EP2348301A1 - Sample analyzer - Google Patents
Sample analyzer Download PDFInfo
- Publication number
- EP2348301A1 EP2348301A1 EP11150180A EP11150180A EP2348301A1 EP 2348301 A1 EP2348301 A1 EP 2348301A1 EP 11150180 A EP11150180 A EP 11150180A EP 11150180 A EP11150180 A EP 11150180A EP 2348301 A1 EP2348301 A1 EP 2348301A1
- Authority
- EP
- European Patent Office
- Prior art keywords
- sample
- display
- subject
- measurement
- controller
- Prior art date
- Legal status (The legal status is an assumption and is not a legal conclusion. Google has not performed a legal analysis and makes no representation as to the accuracy of the status listed.)
- Granted
Links
- 238000005259 measurement Methods 0.000 claims abstract description 122
- 208000019206 urinary tract infection Diseases 0.000 claims abstract description 63
- 210000002700 urine Anatomy 0.000 claims abstract description 15
- 239000003153 chemical reaction reagent Substances 0.000 claims abstract description 7
- 239000002245 particle Substances 0.000 claims abstract 26
- 241000894006 Bacteria Species 0.000 claims description 68
- 229940079593 drug Drugs 0.000 claims description 49
- 239000003814 drug Substances 0.000 claims description 49
- 238000009826 distribution Methods 0.000 claims description 9
- 238000004458 analytical method Methods 0.000 description 84
- 230000001580 bacterial effect Effects 0.000 description 47
- 238000000034 method Methods 0.000 description 40
- 230000008859 change Effects 0.000 description 37
- 238000012545 processing Methods 0.000 description 32
- 230000010365 information processing Effects 0.000 description 29
- 230000008569 process Effects 0.000 description 28
- 230000003287 optical effect Effects 0.000 description 9
- 238000004590 computer program Methods 0.000 description 7
- 238000004891 communication Methods 0.000 description 6
- 238000002483 medication Methods 0.000 description 5
- 208000015181 infectious disease Diseases 0.000 description 4
- 238000003860 storage Methods 0.000 description 4
- 238000012360 testing method Methods 0.000 description 4
- 241000194017 Streptococcus Species 0.000 description 3
- 238000010586 diagram Methods 0.000 description 3
- 201000010099 disease Diseases 0.000 description 3
- 208000037265 diseases, disorders, signs and symptoms Diseases 0.000 description 3
- 230000006870 function Effects 0.000 description 3
- 238000002156 mixing Methods 0.000 description 3
- 238000002360 preparation method Methods 0.000 description 3
- 241000193830 Bacillus <bacterium> Species 0.000 description 2
- 239000008280 blood Substances 0.000 description 2
- 210000004369 blood Anatomy 0.000 description 2
- 230000014670 detection of bacterium Effects 0.000 description 2
- 239000003085 diluting agent Substances 0.000 description 2
- 238000012986 modification Methods 0.000 description 2
- 230000004048 modification Effects 0.000 description 2
- 238000003825 pressing Methods 0.000 description 2
- 239000000243 solution Substances 0.000 description 2
- 239000012192 staining solution Substances 0.000 description 2
- 241000304886 Bacilli Species 0.000 description 1
- 241001478240 Coccus Species 0.000 description 1
- 241000295644 Staphylococcaceae Species 0.000 description 1
- 241000191940 Staphylococcus Species 0.000 description 1
- 230000004075 alteration Effects 0.000 description 1
- 239000012141 concentrate Substances 0.000 description 1
- 238000003745 diagnosis Methods 0.000 description 1
- 230000001678 irradiating effect Effects 0.000 description 1
- 238000009533 lab test Methods 0.000 description 1
- 239000007788 liquid Substances 0.000 description 1
- 238000000691 measurement method Methods 0.000 description 1
- 239000000203 mixture Substances 0.000 description 1
- 150000007523 nucleic acids Chemical class 0.000 description 1
- 102000039446 nucleic acids Human genes 0.000 description 1
- 108020004707 nucleic acids Proteins 0.000 description 1
- 230000004044 response Effects 0.000 description 1
- 238000010186 staining Methods 0.000 description 1
Images







Classifications
-
- G—PHYSICS
- G01—MEASURING; TESTING
- G01N—INVESTIGATING OR ANALYSING MATERIALS BY DETERMINING THEIR CHEMICAL OR PHYSICAL PROPERTIES
- G01N33/00—Investigating or analysing materials by specific methods not covered by groups G01N1/00 - G01N31/00
- G01N33/48—Biological material, e.g. blood, urine; Haemocytometers
- G01N33/483—Physical analysis of biological material
- G01N33/487—Physical analysis of biological material of liquid biological material
- G01N33/493—Physical analysis of biological material of liquid biological material urine
-
- G—PHYSICS
- G01—MEASURING; TESTING
- G01N—INVESTIGATING OR ANALYSING MATERIALS BY DETERMINING THEIR CHEMICAL OR PHYSICAL PROPERTIES
- G01N15/00—Investigating characteristics of particles; Investigating permeability, pore-volume or surface-area of porous materials
- G01N15/10—Investigating individual particles
- G01N15/14—Optical investigation techniques, e.g. flow cytometry
-
- G—PHYSICS
- G01—MEASURING; TESTING
- G01N—INVESTIGATING OR ANALYSING MATERIALS BY DETERMINING THEIR CHEMICAL OR PHYSICAL PROPERTIES
- G01N15/00—Investigating characteristics of particles; Investigating permeability, pore-volume or surface-area of porous materials
- G01N15/10—Investigating individual particles
- G01N15/14—Optical investigation techniques, e.g. flow cytometry
- G01N15/1429—Signal processing
-
- G—PHYSICS
- G01—MEASURING; TESTING
- G01N—INVESTIGATING OR ANALYSING MATERIALS BY DETERMINING THEIR CHEMICAL OR PHYSICAL PROPERTIES
- G01N15/00—Investigating characteristics of particles; Investigating permeability, pore-volume or surface-area of porous materials
- G01N15/01—Investigating characteristics of particles; Investigating permeability, pore-volume or surface-area of porous materials specially adapted for biological cells, e.g. blood cells
- G01N2015/016—White blood cells
-
- G—PHYSICS
- G01—MEASURING; TESTING
- G01N—INVESTIGATING OR ANALYSING MATERIALS BY DETERMINING THEIR CHEMICAL OR PHYSICAL PROPERTIES
- G01N15/00—Investigating characteristics of particles; Investigating permeability, pore-volume or surface-area of porous materials
- G01N15/10—Investigating individual particles
- G01N15/14—Optical investigation techniques, e.g. flow cytometry
- G01N2015/1493—Particle size
Definitions
- the present invention relates to a sample analyzer and a sample analyzing method for analyzing a sample by irradiating, with light, a measurement sample which is prepared from a sample and a reagent.
- Detection of bacteria is performed in clinical laboratory tests and the like. Detection of bacteria can be performed, for example, by a method in which a sample is cultured and colonies formed in the sample are visually examined. This method allows the types and number of bacteria contained in the sample to be identified. However, it takes a few days for the colonies to form in the cultured sample. Thus, this examination method has a problem in that it lacks promptness.
- U.S. patent application publication 20040219627 discloses a bacteria determination method that uses a scattergram.
- a scattergram is created, in which size information and fluorescence information about bacteria in a sample are used as parameters. Then, the state of distribution of bacteria in the scattergram is analyzed. Based on the analysis results, it is determined whether the type of bacteria in the sample is a bacillus or a coccus.
- U.S. patent application publication 20040219627 determines a bacterial type
- the method is unable to provide other information to the user.
- the user In terms of treatment and diagnosis, if, for example, the user is promptly informed that the types of bacteria in a sample collected from a subject have changed as compared to another sample previously collected from the same subject, then the user can properly know the progression of a disease of the subject as well as the effectiveness of medication and treatment of the disease that have been performed. Such information allows the user to take appropriate measures to address the disease of the subject.
- the present invention is applied to a urine sample analyzer for performing measurement on bacteria contained in a urine sample and determining based on the measurement results the types of bacteria in the urine sample.
- FIG. 1 shows an external configuration of a urine sample analyzer 1 according to the present embodiment.
- the urine sample analyzer 1 includes a measurement apparatus 2 and an information processing apparatus 3.
- the measurement apparatus 2 optically measures bacteria contained in a urine sample by means of a flow cytometer.
- the information processing apparatus 3 analyzes the results of the measurement performed by the measurement apparatus 2, and displays the analysis results on a display unit 320.
- FIG. 2 shows a configuration of the measurement apparatus 2.
- the measurement apparatus 2 includes a sample dispenser 201, a sample preparation section 202, an optical detector 203, a signal processing circuit 210, a CPU 204, a communication interface 205, and a memory 206.
- the signal processing circuit 210 includes an analogue signal processing circuit 211, an A/D converter 212, a digital signal processing circuit 213, and a memory 214.
- the sample dispenser 201 includes a pipette and a pump (not shown). When the pump is driven, a predetermined amount of sample (urine) is aspirated into the pipette, and then the sample that has been aspirated into the pipette is discharged. By means of the pipette and the pump, the sample dispenser 201 supplies the sample preparation section 202 with the predetermined amount of sample that the sample dispenser 201 has aspirated from a sample container.
- sample urine
- the sample preparation section 202 includes a reagent container, a mixing container, and a pump (not shown).
- the mixing container the sample supplied from the sample dispenser 201 is mixed with a diluent solution and a staining solution that are supplied from the reagent container, and thereby a measurement sample is prepared.
- the measurement sample prepared in the mixing container is supplied by the pump to a sheath flow cell 203c (see FIG. 3 ) of the optical detector 203, together with a sheath liquid.
- the optical detector 203 emits laser light to the measurement sample, and outputs electrical signals to the analogue signal processing circuit 211, which electrical signals are based on forward scattered light, side fluorescence, and side scattered light which are generated when the measurement sample is irradiated with the laser light.
- the analogue signal processing circuit 211 amplifies the electrical signals outputted from the optical detector 203, and outputs the amplified electrical signals to the A/D converter 212.
- the A/D converter 212 converts the electrical signals amplified by the analogue signal processing circuit 211 into digital signals, and outputs the digital signals to the digital signal processing circuit 213.
- the digital signal processing circuit 213 performs predetermined waveform processing on the digital signals outputted from the A/D converter 212, and the digital signals on which the waveform processing has been performed are stored in the memory 214.
- the digital signals stored in the memory 214 include signals that are based on pulse signals of forward scattered light and side fluorescence which are generated each time a bacterium passes through the sheath flow cell 203c.
- the CPU 204 controls the analogue signal processing circuit 211 and the digital signal processing circuit 213. Also, the CPU 204 obtains, from the digital signals stored in the memory 214, the magnitude of each of the pulse signals of the forward scattered light and the side fluorescence.
- the magnitude of a pulse signal of forward scattered light indicates the intensity of the forward scattered light, which is generated when a bacterium passes through the sheath flow cell 203c.
- the magnitude of a pulse signal of side fluorescence indicates the intensity of the side fluorescence, which is generated when a bacterium passes through the sheath flow cell 203c.
- the magnitude of the pulse signal of the forward scattered light represents the size of the bacterium
- the magnitude of the pulse signal of the side fluorescence represents the degree of staining of the nucleic acid of the bacterium.
- the CPU 204 After obtaining the magnitudes of the respective pulse signals of the forward scattered light and the side fluorescence, the CPU 204 generates, based on the magnitudes of the respective pulse signals, data cluster that indicates a forward scattered light intensity and a side fluorescence intensity for each of the bacteria that have passed through the sheath flow cell 203c (hereinafter, the data cluster is referred to as "measurement data").
- the CPU 204 outputs the measurement data to the communication interface 205. Further, the CPU 204 receives control signals from the information processing apparatus 3 via the communication interface 205, and drives the respective components of the measurement apparatus 2 in accordance with the control signals.
- the communication interface 205 transmits to the information processing apparatus 3 the measurement data outputted from the CPU 204, and receives the control signals outputted from the information processing apparatus 3.
- the memory 206 is used as a work area for the CPU 204.
- FIG. 3 is a schematic diagram showing configurations of the optical detector 203 and the analogue signal processing circuit 211 of the measurement apparatus 2.
- the optical detector 203 includes a light emitter 203a, an irradiation lens unit 203b, the sheath flow cell 203c, a condenser lens 203d, a pinhole plate 203e, a PD (photodiode) 203f, a condenser lens 203g, a dichroic mirror 203h, an optical filter 203i, a pinhole plate 203j, a PMT (photomultiplier tube) 203k, and a PD (photodiode) 2031.
- the analogue signal processing circuit 211 includes amplifiers 211a, 211b, and 211c.
- Laser light emitted from the light emitter 203a is converted by the irradiation lens unit 203b into parallel light, and a sample flow containing the measurement sample is irradiated with the parallel light when passing through the sheath flow cell 203c.
- the measurement sample passing through the sheath flow cell 203c is a mixture of a sample (a urine sample) to be measured and the aforementioned diluent solution and staining solution.
- the condenser lens 203d is disposed in the path of the laser light emitted from the light emitter 203a.
- the forward scattered light which is generated at the sheath flow cell 203c, is converged by the condenser lens 203d, and passes through the pinhole plate 203e, before being received by the PD 203f.
- the condenser lens 203g is disposed in a path that intersects the path of the laser light emitted from the light emitter 203a.
- the side fluorescence and the side scattered light which are generated at the sheath flow cell 203c, are converged by the condenser lens 203g and fall on the dichroic mirror 203h.
- the dichroic mirror 203h separates the side fluorescence and the side scattered light.
- the side fluorescence separated by the dichroic mirror 203h passes through the optical filter 203i and the pinhole plate 203j, and is then received by the PMT 203k.
- the side scattered light separated by the dichroic mirror 203h is received by the PD 2031.
- the PD 203f, the PMT 203k, and the PD 2031 output electrical signals based on the received forward scattered light, side fluorescence, and side scattered light, respectively.
- the amplifiers 211a, 211b, and 211c amplify the electrical signals outputted from the PD 203f, the PMT 203k, and the PD 2031, respectively, and output the resultant signals, to the A/D converter 212. Note that the amplifiers 211a, 211b, and 211c are included in the analogue signal processing circuit 211 shown in FIG. 2 .
- FIG. 4 shows a configuration of the information processing apparatus 3.
- the information processing apparatus 3 is structured as a personal computer, and includes a body 300, an input unit 310, and the display unit 320 (see FIG. 1 ).
- the body 300 includes a CPU 301, a ROM 302, a RAM 303, a hard disk 304, a readout device 305, an input/output interface 306, an image output interface 307, and a communication interface 308.
- the CPU 301 executes a computer program stored in the ROM 302 and a computer program loaded into the RAM 303.
- the RAM 303 is used for loading computer programs that are stored in the ROM 302 and the hard disk 304.
- the RAM 303 is also used as a work area for the CPU 301 when these computer programs are executed.
- the hard disk 304 various computer programs executed by the CPU 301, such as an operating system and application programs, and data used for executing these computer programs, are installed. Further, the hard disk 304 stores measurement data received from the measurement apparatus 2 and a medication administration history which will be described below.
- a program for obtaining based on the measurement data the number of bacteria contained in a sample and for performing analysis of the sample, and a display program for displaying the analysis results on the display unit 320 are installed. These installed programs allow an analysis process and a display process to be performed. These processes will be described below. That is, owing to these programs, the CPU 301 has functions of performing processing as shown in (b) of FIG. 5 , FIG. 6 , and FIG. 9 as well as functions of displaying screens as shown in FIG. 10 to FIG. 12 . These functions will be described below.
- the readout device 305 is structured as a CD drive, DVD drive, or the like.
- the readout device 305 is configured to read a computer program and data that are stored in an external storage, for example, an external storage medium. Accordingly, programs executed by the information processing apparatus 3 can be updated via an external storage, for example, an external storage medium.
- the input unit 310 which includes a mouse and a keyboard, is connected to the input/output interface 306.
- the user uses the input unit 310 to give instructions to the information processing apparatus 3.
- the image output interface 307 is connected to the display unit 320, which includes a display and the like.
- the image output interface 307 outputs image signals based on image data to the display unit 320.
- the display unit 320 displays images based on the image signals that are inputted from the image output interface 307.
- the information processing apparatus 3 can receive measurement data that is transmitted from the measurement apparatus 2.
- the received measurement data is stored in the hard disk 304.
- FIG. 5 shows flowcharts showing control performed by the CPU 204 of the measurement apparatus 2 and control performed by the CPU 301 of the information processing apparatus 3.
- a flowchart (a) in FIG. 5 shows a measurement process performed by the CPU 204 of the measurement apparatus 2, and a flowchart (b) in FIG. 5 shows an analysis process performed by the CPU 301 of the information processing apparatus 3.
- the CPU 301 transmits a measurement start signal to the measurement apparatus 2 (S12). Next, the CPU 301 determines whether measurement data has been received (S13). If measurement data has not been received (S13: NO), the CPU 301 does not advance the processing.
- the CPU 204 when the CPU 204 receives the measurement start signal from the information processing apparatus 3 (S21: YES), the CPU 204 performs a sample measurement as described above (S22). When the sample measurement is completed, the CPU 204 transmits measurement data to the information processing apparatus 3 (S23), and returns the processing to S21.
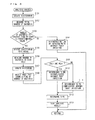
- the CPU 301 when the CPU 301 receives the measurement data from the measurement apparatus 2 (S13: YES), the CPU 301 stores the measurement data in the hard disk 304, and performs the analysis process based on the measurement data (S14). Then, the CPU 301 causes the display unit 320 to display analysis results obtained at S14 (S15), and causes the display unit 320 to display change information based on the analysis results (S16). Thereafter, the processing returns to S11. Note that the analysis process performed at S14 is described below with reference to FIG. 6 , and the process of displaying change information that is performed at S16 is described below with reference to FIG. 9 .
- FIG. 6 is a processing flowchart showing the analysis process performed at S14 of FIG. 5 .
- the CPU 301 loads the measurement data from the hard disk 304 into the RAM 303. Based on the loaded measurement data, the CPU 301 creates a two-dimensional scattergram of which the vertical axis represents forward scattered light intensity and the horizontal axis represents side fluorescence intensity (S101). In the two-dimensional scattergram, pieces of the measurement data are plotted. Each piece of the measurement data indicates a forward scattered light intensity and a side fluorescence intensity of a single bacterium.
- FIG. 7A shows an example of the scattergram created at S101. Based on the created two-dimensional scattergram, the CPU 301 measures the total number of bacteria contained in the measurement sample (S102).
- the CPU 301 determines whether the number of bacteria contained in the measurement sample is greater than or equal to a predetermined value (S103).
- the CPU 301 obtains the number of bacteria contained in 1 mL of the sample from the total number of bacteria measured at S102, and determines whether the number of bacteria contained in 1 mL of the sample is greater than or equal to the predetermined value.
- the predetermined value used in the determination at S103 is a threshold bacterial count that is used for determining whether a subject from whom the sample was collected is infected with a urinary tract infection.
- the threshold bacterial count is, for example, 1.0 ⁇ 10 ⁇ 4 in 1 mL of the sample.
- the CPU 301 determines that the number of bacteria contained in the measurement sample is not greater than or equal to the predetermined value (S103: NO), then the CPU 301 determines that the subject is not infected with a urinary tract infection (S104) and ends the processing. On the other hand, if the CPU 301 determines that the number of bacteria contained in the measurement sample is greater than or equal to the predetermined value (S103: YES), the processing proceeds to S105.
- the CPU 301 divides the two-dimensional scattergram created at S101 into a plurality of areas by using predetermined slope angles (S105).
- the CPU 301 measures the number of bacteria contained in each of the areas of the two-dimensional scattergram divided at S105 (S106).
- FIG. 7B is a schematic diagram showing the scattergram divided at S105.
- straight lines d0, d1, d2, d3, d4, etc. are straight lines each extending in a radial direction of a virtual circle A whose center is the origin (i.e., origin O) of the scattergram.
- the straight line d0 coincides with the horizontal axis of the scattergram.
- each of the other straight lines forms an angle ⁇ with straight lines adjacent thereto.
- Areas D0 D1, D2, D3, etc. are a result of dividing the scattergram by the straight lines d0, d1, d2, d3, d4, etc.
- the angle ⁇ may be set to any angle, for example, 1 degree or 10 degrees.
- FIG. 7C shows areas each used for measuring the number of bacteria on the scattergram. As shown in FIG. 7C , areas E0, E1, E2, E3, etc., which are each used for measuring the number of bacteria, are a result of excluding the area B from the areas D0, D1, D2, D3, etc., shown in FIG. 7B .
- the area B is excluded from the areas D0, D1, D2, D3, etc., of FIG. 7B for the purpose of improving the accuracy of determination of the classification of a urinary tract infection and the accuracy of determination of types of bacteria.
- These determinations will be described below.
- distributions of bacteria tend to concentrate near the origin O. For this reason, if bacteria distributed near the origin O are counted in each of the areas D0, D1, D2, D3, etc., then differences are not likely to occur among the counting results of the respective areas. This hinders smooth determination of bacteria.
- areas divided by the straight lines d0, d1, d2, d3, d4, etc. are small. Furthermore, distributions of different types of bacteria tend to overlap each other near the origin O. Therefore, if bacteria are counted in an area near the origin, it is likely that a large number of bacteria that are not intended to be counted in the area are counted. This causes a significant error in the counting result.
- the area B is excluded from the areas D0, D1, D2, D3, etc., so that bacteria near the origin O are not counted in the determination of the classification of a urinary tract infection and the determination of types of bacteria, which determinations are described below, and so that the numbers of bacteria contained in the respective areas, which are obtained from the counting, may significantly differ from each other.
- the size of the area B is set such that types of bacteria that are determined based on the numbers of bacteria contained in the respective areas E0, E1, E2, E3, etc., are closest to those determined based on measurement results that would be obtained by a measurement method in which cultured bacteria are used.
- the CPU 301 creates a histogram based on the numbers of bacteria that are obtained at S106 for the areas E0, E1, E2, E3, etc., respectively (S107).
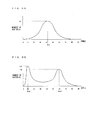
- FIG. 8A shows an example of the histogram created at S107.
- the horizontal axis represents angles, with respect to the straight line d0 of the straight lines d0 d1, d2, d3, d4, etc., which divide the areas E0 E1, E2, E3, etc. That is, the horizontal axis corresponds to the areas E0, E1, E2, E3, etc., in order of their angle with respect to the straight line d0, from the smallest angle to the greatest angle.
- the vertical axis represents the numbers of bacteria that are contained in the areas E0, E1, E2, E3, etc., respectively.
- the CPU 301 selects, in the histogram created at S107, the area(s) that shows a peak of the number of bacteria (S108).
- an area that shows a peak of the number of bacteria is an area (an angular range) which corresponds to the peak of a raised portion of the histogram. That is, among the areas E0, E1, E2, E3, etc., an area for which the number of bacteria counted therein is greater than the number of bacteria counted in adjacent areas that precede and follow the area in terms of the size of the angle with respect to the straight line d0, is selected as a peak area.
- the histogram of FIG. 8A shows a single peak of the number of bacteria. At the peak, the bacterial count is N1. In this case, the CPU 301 selects an area En1 that corresponds to the peak.
- FIG. 8B shows another example of a histogram. The histogram of FIG. 8B shows two peaks of the number of bacteria. At these two peaks, the bacterial counts are N2 and N3, respectively. In this case, the CPU 301 selects an area En2 which corresponds to the peak at the left of the histogram and an area En3 which corresponds to the peak at the right of the histogram.
- the CPU 301 determines that the classification of a urinary tract infection indicated by the sample from which the measurement data has been obtained is an uncomplicated urinary tract infection (S110). On the other hand, if the number of areas selected at S108 as corresponding to a peak of the number of bacteria is two or more (S109: NO), then the CPU 301 determines that the classification of a urinary tract infection indicated by the sample from which the measurement data has been obtained is a complicated urinary tract infection (S111).
- the CPU 301 determines the type(s) of bacteria contained in the sample from which the measurement data has been obtained (5112). To be specific, the CPU 301 determines the type(s) of bacteria contained in the sample based on whether the angular range, with respect to the straight line d0, of the area(s) selected at S108 is included among angular ranges that are preset for the purpose of specifying bacterial types. For example, in the case of FIG. 7B , the angular range of the area D2 is 2 ⁇ to 3 ⁇ .
- the type of bacteria contained in the area D2 is determined based on which angular range, among the angular ranges that are preset for the purpose of specifying bacterial types, includes the angular range of 2 ⁇ to 3 ⁇ .
- the angular ranges used for specifying bacterial types are set as shown below.
- bacterial types are determined only for the areas for which the numbers of bacteria counted therein are the greatest and the second greatest among the selected areas.
- bacterial types may be determined for the areas for which the numbers of bacteria counted therein are the greatest, the second greatest, and the third greatest among the selected areas.
- bacterial types may be determined for all of the select areas.
- the CPU 301 stores the analysis results in the hard disk 304 (S113), which analysis results contain the classification of urinary tract infection and the bacterial type(s) obtained in the above manner. Then, the processing ends.
- FIG. 9 is a processing flowchart showing the process of displaying change information that is performed at S16 of FIG. 5 .
- the CPU 301 determines whether the analysis results obtained from the most recently performed analysis and the analysis results obtained from the immediately previously performed analysis are all stored in the hard disk 304 regarding the subject from whom the sample was collected for the most recently performed analysis (S201). If the analysis results obtained from the most recently performed analysis and the analysis results obtained from the immediately previously performed analysis are not all stored in the hard disk 304 (S201: NO), the processing ends. If the analysis results obtained from the most recently performed analysis and the analysis results obtained from the immediately previously performed analysis are all stored in the hard disk 304 (S201: YES), the CPU 301 loads the most recent analysis results and the immediately previous analysis results into the RAM 303 (S202), and compares the most recent analysis results and the immediately previous analysis results (S203).
- the CPU 301 determines whether the classification of urinary tract infection indicated by the most recent analysis results has changed from that indicated by the immediately previous analysis results (S204). If it is determined that the classification of urinary tract infection has changed (S204: YES), the CPU 301 assigns 1 to a urinary tract infection flag (S205). On the other hand, if it is determined that the type of urinary tract infection has not changed (S204: NO), the CPU 301 assigns 0 to the urinary tract infection flag (S206).
- the CPU 301 determines based on the result of the comparison at S203 whether the bacterial type indicated by the most recent analysis results has changed from that indicated by the immediately previous analysis results (S207). If it is determined that the bacterial type has changed (S207: YES), the CPU 301 assigns 1 to a type flag (S208). On the other hand, if it is determined that the bacterial type has not changed (S207: NO), the CPU 301 assigns 0 to the type flag (S209).
- the CPU 301 determines whether the urinary tract infection flag is 1 or the type flag is 1 (S210). If it is determined that either the urinary tract infection flag is 1 or the type flag is 1 (S210: YES), the CPU 301 causes the display unit 320 of the information processing apparatus 3 to display a message indicating the change (S211). Then, the processing ends.
- FIG. 10 shows an example of an information display screen 400 displayed by the display unit 320 of the information processing apparatus 3.
- the information display screen 400 is displayed in accordance with S15 and S16 of FIG. 5 .
- the information display screen 400 includes a subject ID area 401, a measurement date/time area 402, a scattergram area 403, a histogram area 404, a subject information area 405, a bacterial information area 406, a division angle area 407, and a change information area 408.
- the bacterial information area 406 includes a urinary tract infection classification area 406a and a type area 406b.
- the subject ID area 401 shows a subject ID.
- the subject ID identifies the subject from whom the sample was collected for the analysis of which the results are shown in the information display screen 400.
- the measurement date/time area 402 shows the date and time when the measurement for the analysis was performed.
- the scattergram area 403 shows a scattergram as in FIG. 7A which is obtained based on the performed measurement.
- the histogram area 404 shows a histogram as in FIG. 8A or 8B which is obtained based on the scattergram shown in the scattergram area 403.
- the subject information area 405 shows, for example, the name of the subject, the name of the attending doctor, and comments from the attending doctor that are associated with the subject ID.
- information about medication administered to the subject may be inputted via the input unit 310 (see FIG. 4 ) and shown in the subject information area 405.
- the urinary tract infection classification area 406a shows the determination result obtained at S110 or S111 of the analysis process shown in FIG. 6 . That is, in a case where the classification of the urinary tract infection indicated by the sample analyzed in the analysis process is an uncomplicated urinary tract infection, the urinary tract infection classification area 406a shows "UNCOMPLICATED INFECTION?". On the other hand, in a case where the classification of the urinary tract infection indicated by the sample analyzed in the analysis process is a complicated urinary tract infection, the urinary tract infection classification area 406a shows "COMPLICATED INFECTION?".
- the urinary tract infection classification area 406a is left blank or shows a message "UNKNOWN".
- the type area 406b shows the bacterial type(s) determined at S112 of the analysis process shown in FIG. 6 . Note that "?” added at the end of the message shown in the type area 406b indicates that there is a high possibility that the sample contains the bacteria of the type(s) shown in the type area 406b. If there is no determination provided regarding the bacterial types, or the bacteria contained in the sample cannot be determined to be a specific type(s), the type area 406b is left blank or shows a message "UNKNOWN".
- the division angle area 407 shows the angle ⁇ which is formed between each of the straight lines d0, d1, d2, d3, d4, etc., and the respective straight line(s) adjacent thereto.
- the straight lines d0, d1, d2, d3, d4, etc. divide the areas D0, D1, D2, D3, etc., as shown in FIG. 7B .
- the change information area 408 shows, in accordance with the process of displaying change information which is performed as shown in FIG. 9 , a message indicating that the bacterial type has changed.
- the change information area 408 shows "CHANGED” indicating that the most recent analysis results have changed from the immediately previous analysis results.
- the change information area 408 shows "UNCOMPLICATED ⁇ COMPLICATED” together with "CHANGED”.
- the change information area 408 shows "TYPE" together with "CHANGED”.
- FIG. 11 shows an example of a chronological display screen 500 which is displayed by the display unit 320 of the information processing apparatus 3. This screen is displayed when an input operation for displaying a chronological display regarding a particular subject is performed via the input unit 310 of the information processing apparatus 3.
- the chronological display screen 500 includes: a subject ID area 501; measurement date/time areas 511, 521, 531, and 541; scattergram areas 512, 522, 532, and 542; histogram areas 513, 523, 533, and 543; bacterial information areas 514, 524, 534, and 544; division angle areas 515, 525, 535, and 545; change information areas 516, 526, 536, and 546; and medication information areas 551, 552, and 553.
- the subject ID area 501 shows a subject ID.
- the subject ID identifies the subject from whom samples were collected for analyses of which the results are shown in the chronological display screen 500.
- Each of the four groups of areas 511 to 516, 521 to 526, 531 to 536, and 541 to 546 shows measurement results and analysis results obtained based on a corresponding single measurement. That is, these four groups show four sets of information that are based on four sets of measurement data obtained from four samples that were collected from the same subject at four different dates and times. Each group shows a corresponding one of the four sets of information, in the areas that correspond to the areas 402, 403, 404, 406, 407, and 408 of the information display screen 400 shown in FIG. 10 . Note that, in the present embodiment, the four sets of measurement data that correspond to these four groups are chronologically successive.
- Each of the change information areas 516, 526, 536, and 546 shows whether the bacterial type information obtained based on the most recent measurement has changed from the bacterial type information obtained based on the immediately previous measurement, and if the bacterial type information has changed, shows the details of the change. If the bacterial type information obtained based on the most recent measurement has not changed from the bacterial type information obtained based on the immediately previous measurement, or the number of bacteria determined based on the most recent measurement is not greater than or equal to the predetermined value (NO at S103), then the change information area is left blank.
- the analysis results shown at the second-from-left position in FIG. 11 indicate a change in the bacterial type from "BACILLUS?" to "STREPTOCOCCUS? ". Accordingly, the change information area 526 shows "TYPE" indicating that the bacterial type has changed.
- the change information area 536 at the third-from-left position in FIG. 11 shows "TYPE” indicating that the bacterial type has changed, and also shows that the classification of urinary tract infection has changed.
- the classification of urinary tract infection has changed from "UNCOMPLICATED?” to "COMPLICATED?”
- the bacterial type has changed from "STREPTOCOCCUS?” to "STREPTOCOCCUS? STAPHYLOCOCCUS?”.
- the change information area 536 shows "UNCOMPLICATED ⁇ COMPLICATED” indicating that the classification of urinary tract infection has changed from an uncomplicated urinary tract infection to a complicated urinary tract infection, together with "TYPE” indicating that the bacterial type has changed.
- Each of the medication information areas 551, 552, and 553 shows information as to whether medication was administered to the subject between a measurement and a measurement immediately previous thereto.
- information indicating that medication was administered to the subject in this example, a picture of a syringe
- the medication information area 551 information indicating that medication was administered to the subject between the measurement date/time indicated in the measurement date/time area 531 and the measurement date/time indicated in the measurement date/time area 541, is shown in the medication information area 553.
- FIG. 12 shows an example of a medication administration history screen 600 which is displayed by the display unit 320 of the information processing apparatus 3.
- the medication administration history screen 600 contains a subject ID area 601, a medication administration history area 602, and an edit command area 603.
- the subject ID area 601 shows a subject ID that identifies a subject to whom medications were administered.
- the medication administration history area 602 shows a history of medications administered to the subject identified by the subject ID indicated in the subject ID area 601.
- medication administration history area 602 dates and times when the medications were administered to the subject are shown in association with the details of the administered medications.
- Such medication administration history is stored in the hard disk 304 of the information processing apparatus 3.
- the screen shown in FIG. 11 is displayed, if the user uses the input unit 310 of the information processing apparatus 3, thereby pressing (e.g., by a click), among the medication information areas 551, 552, and 553, one of the medication information areas 551 and 553 that are showing information (i.e., a picture of a syringe), then the screen shown in FIG. 12 is displayed.
- a row showing a medication administration date/time and the details of administered medication that correspond to the pressed medication information area is selectively displayed as shown in FIG. 12 . In this manner, the user can check the details of the medication.
- the edit command area 603 includes "ADD”, "EDIT”, and "DELETE” buttons for editing the information shown in the medication administration history area 602.
- the user can edit the information shown in the medication administration history area 602 by pressing (e.g., by a click) these buttons via the input unit 310. Note that if the information in the medication administration history area 602 is altered, the information shown in the medication information areas 551, 552, and 553 of the chronological display screen 500 of FIG. 11 is also altered so as to be consistent with the alteration of the information in the medication administration history area 602.
- the analysis process as shown in FIG. 6 is performed based on the forward scattered light and the side fluorescence that are received by the PD 203f and the PMT 203k, respectively.
- the information display screen 400 as shown in FIG. 10 is displayed by the display unit 320 of the information processing apparatus 3. If a change in the bacterial type has occurred, the change information area 408 shows a message indicating the change. Accordingly, if treatment was given to the subject from whom the sample was collected, the user can check whether the treatment has been effective for the subject.
- the chronological display screen 500 as in FIG. 11 shows measurement results and analysis results based on measurement data obtained from four samples that were collected from the same subject at four different dates and times. Accordingly, if treatment was given to the subject from whom the samples were collected, the user can check, chronologically, whether the treatment has been effective for the subject.
- the medication information areas 551, 552, and 553 in the chronological display screen 500 as in FIG. 11 show medication information. Since the medication information is shown in this manner, the user can readily know how the types of bacteria found in the samples have changed owing to medications administered to the subject. This also allows the user to check if the medication administered to the subject has been effective.
- the present invention is applicable to sample testing apparatuses for testing blood samples. Further, the present invention is applicable to sample testing apparatuses for testing other types of samples.
- the classification of the urinary tract infection indicated by the sample from which the measurement data has been obtained is determined.
- whether the number of peaks of bacterial count in the histogram is one may be determined based on the skewness of the histogram.
- the skewness of the histogram may be used in addition to performing the determination at S109 of the above embodiment.
- Described below is a method for determining based on the skewness of the histogram whether the number of peaks of bacterial count is one.
- the histogram shows a symmetrical distribution such as a normal distribution
- the value of the skewness ⁇ 3 is 0. If the skewness ⁇ 3 is a negative value, the distribution has a negative skew, and the histogram has an elongated tail at the left. On the other hand, if the skewness ⁇ 3 is a positive value, the distribution has a positive skew, and the histogram has an elongated tail at the right.
- the histogram shows a symmetrical distribution, it is likely that the histogram shows only one peak. On the other hand, if the histogram shows a significant positive or negative skew, it is likely that the histogram shows multiples peaks, or that, although the histogram shows only one peak, other peaks are buried in the elongated tails.
- the number of peaks may be determined to be one.
- the value of the skewness ⁇ 3 is out of these ranges, the number of peaks may be determined to be plural. That is, proper adjustment of the positive and negative threshold ranges for the skewness ⁇ 3 that are used for determining whether the number of peaks is plural, makes it possible to determine whether the number of peaks of the histogram is one based on whether the skewness ⁇ 3 is within these threshold ranges.
- FIG. 13A is part of a processing flowchart showing the analysis process in which S121, instead of S108 and S109 of FIG. 6 , is performed in order to determine whether the number of peaks is one. If the absolute value of the skewness of the histogram created at S107 is less than or equal to a predetermined value (i.e., a threshold) (S121: YES), the number of peaks of the histogram is determined to be one. Then, the classification of the urinary tract infection indicated by the sample from which the measurement data has been obtained is determined to be an uncomplicated urinary tract infection (S110).
- a predetermined value i.e., a threshold
- the absolute value of the skewness of the histogram created at S107 is not less than or equal to the predetermined value (S121: NO)
- the number of peaks of the histogram is determined to be plural. Then, the classification of the urinary tract infection indicated by the sample from which the measurement data has been obtained is determined to be a complicated urinary tract infection (S111).
- the classification of the urinary tract infection indicated by the sample from which the measurement data has been obtained is determined to be an uncomplicated urinary tract infection. Further, even in a case where the histogram shows only one peak, the number of peaks is determined to be plural if other peaks are buried in the elongated tails of the histogram. Then, the classification of the urinary tract infection indicated by the sample from which the measurement data has been obtained is determined to be a complicated urinary tract infection.
- FIG. 13B is part of a processing flowchart showing the analysis process in which S121 is additionally performed between S109 and S110 of FIG. 6 in order to determine whether the number of peaks is one.
- the shape of the histogram is determined at S121 based on its skewness, in addition to the determination being performed at S109 as to whether the number of peaks of the histogram is one. In this manner, even if the number of peaks is determined to be one, the classification of the urinary tract infection indicated by the sample from which the measurement data has been obtained is determined to be a complicated urinary tract infection if the histogram has elongated tails at the right and left.
- the chronological display screen 500 of FIG. 11 shows the four sets of measurement results and analysis results for the respective four sets of measurement dates and times, at the same time.
- the number of sets of measurement dates and times for which the measurement results and analysis results are shown is not limited to four.
- the measurement results and analysis results may be shown at the same time for any multiple number of sets of measurement dates and times. If the measurement results and analysis results to be shown do not entirely fit in a single screen, a scrollbar may be provided on the chronological display screen 500 so as to allow scrolling of the display screen, or a page switching button may be provided so as to allow switching of the page to view.
- the chronological display screen 500 shows information based on multiple sets of measurement data that are chronologically successive.
- the chronological display screen 500 may show information based on multiple sets of measurement data that are not chronologically successive. For example, the user may select, among the past measurement dates and times, any four sets of measurement dates and times for which information is to be shown chronologically.
- characters are used to show information in the change information area 408 of the information display screen 400 and in the change information areas 516, 526, 536, and 546 of the chronological display screen 500.
- characters are used to show information in these areas.
- each of the medication information areas 551, 552, and 553 of the chronological display screen 500 merely indicates that medication has been administered to the subject.
- Each medication information area may show a date and time when medication was administered and the details of the medication.
- the date and time when medication was administered and the details of the medication that correspond to the pressed medication information area may be shown as a pop-up.
- the change information area 408 of FIG. 10 shows, based on the comparison of the most recent analysis results and the immediately previous analysis results, change information indicating that the most recent analysis results have changed from the immediately previous analysis results.
- the most recent analysis results may be compared with analysis results earlier than the immediately previous analysis results.
- the most recent analysis results may be compared with analysis results obtained based on measurement performed at any date and time that precede the date and time of the measurement for the most recent analysis results.
- each of the change information areas 516, 526, 536, 546, and change information area 408 may show a message "UNCHANGED" if the corresponding analysis results show no changes from the previous analysis results.
- the display may be performed in such a manner that each of these areas is not shown if the corresponding analysis results show no changes from the previous analysis results.
- the determination as to whether the analysis results have changed it is determined as shown in S210 of FIG. 9 whether the classification of urinary tract infection or the bacterial type has changed.
- the present invention is not limited thereto. The determination may be additionally performed as to whether the number of bacterial types has changed.
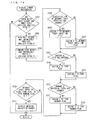
- FIG. 14 is a processing flowchart showing the process of displaying change information in the above case.
- the flowchart of FIG. 14 is different from the flowchart of FIG. 9 in that S221 to S223 are added and S210 is replaced with S224. Hereinafter, these added and replaced steps are described.
- the CPU 301 determines whether the number of bacterial types indicated by the most recent analysis results has changed from that indicated by the immediately previous analysis results (S221). If it is determined that the number of bacterial types indicated by the most recent analysis results has changed from that indicated by the immediately previous analysis results (S221: YES), the CPU 301 assigns 1 to a type number flag (S222). On the other hand, if it is determined that the number of bacterial types indicated by the most recent analysis results has not changed from that indicated by the immediately previous analysis results (S221: NO), the CPU 301 assigns 0 to the type number flag.
- the CPU 301 determines whether the urinary tract infection flag is 1, or the type flag is 1, or the type number flag is 1 (5224). If it is determined that the urinary tract infection flag is 1, or the type flag is 1, or the type number flag is 1 (S224: YES), the CPU 301 causes the display unit 320 of the information processing apparatus 3 to display a message indicating the change (S221), and ends the processing.
- FIG. 15 shows an example of the information display screen 400 displayed by the display unit 320 of the information processing apparatus 3 in the above case.
- FIG. 15 shows, in a change information area 411, information that is different from the information shown in the change information area 408 of FIG. 10 .
- the change information area 411 shows, in addition to the information shown in the change information area 408 of FIG. 10 , "NUMBER OF TYPES" indicating that the number of bacterial types has changed. Note that, in the above case, each of the change information areas 516, 526, 536, and 546 of the chronological display screen 500 in FIG. 11 is also configured to show "NUMBER OF TYPES" so as to indicate that the number of bacterial types has changed.
Landscapes
- Health & Medical Sciences (AREA)
- Life Sciences & Earth Sciences (AREA)
- Chemical & Material Sciences (AREA)
- Engineering & Computer Science (AREA)
- Biomedical Technology (AREA)
- Physics & Mathematics (AREA)
- Pathology (AREA)
- General Health & Medical Sciences (AREA)
- General Physics & Mathematics (AREA)
- Immunology (AREA)
- Biochemistry (AREA)
- Urology & Nephrology (AREA)
- Analytical Chemistry (AREA)
- Dispersion Chemistry (AREA)
- Biophysics (AREA)
- Hematology (AREA)
- Molecular Biology (AREA)
- Food Science & Technology (AREA)
- Medicinal Chemistry (AREA)
- Investigating Or Analysing Biological Materials (AREA)
- Apparatus Associated With Microorganisms And Enzymes (AREA)
Abstract
Description
- This application claims priority under 35 U.S.C. §119 to Japanese Patent Application No.
2010-3211 filed on January 8, 2010 2010-3215 filed on January 8, 2010 - The present invention relates to a sample analyzer and a sample analyzing method for analyzing a sample by irradiating, with light, a measurement sample which is prepared from a sample and a reagent.
- Currently, detection of bacteria is performed in clinical laboratory tests and the like. Detection of bacteria can be performed, for example, by a method in which a sample is cultured and colonies formed in the sample are visually examined. This method allows the types and number of bacteria contained in the sample to be identified. However, it takes a few days for the colonies to form in the cultured sample. Thus, this examination method has a problem in that it lacks promptness.
- In relation to this problem,
U.S. patent application publication 20040219627 discloses a bacteria determination method that uses a scattergram. In this method, a scattergram is created, in which size information and fluorescence information about bacteria in a sample are used as parameters. Then, the state of distribution of bacteria in the scattergram is analyzed. Based on the analysis results, it is determined whether the type of bacteria in the sample is a bacillus or a coccus. - However, with the method disclosed by
U.S. patent application publication 20040219627 , if multiple types of bacteria are contained in a sample, it is difficult to determine the respective types of bacteria in the sample. Therefore, even if the method ofU.S. patent application publication 20040219627 is used in analysis of a urine sample, it is difficult for the user of the method to determine whether a urinary tract infection indicated by the urine sample is a complicated urinary tract infection or uncomplicated urinary tract infection. - Moreover, although the method of
U.S. patent application publication 20040219627 determines a bacterial type, the method is unable to provide other information to the user. In terms of treatment and diagnosis, if, for example, the user is promptly informed that the types of bacteria in a sample collected from a subject have changed as compared to another sample previously collected from the same subject, then the user can properly know the progression of a disease of the subject as well as the effectiveness of medication and treatment of the disease that have been performed. Such information allows the user to take appropriate measures to address the disease of the subject. -
-
FIG. 1 shows an external configuration of a urine sample analyzer according to an embodiment of the present invention; -
FIG. 2 shows a configuration of a measurement apparatus according to the embodiment; -
FIG. 3 is a schematic diagram showing configurations of an optical detector and an analogue signal processing circuit according to the embodiment; -
FIG. 4 shows a configuration of an information processing apparatus according to the embodiment; -
FIG. 5 shows flowcharts showing a measurement process of measuring a sample and an analysis process of analyzing the sample, according to the embodiment; -
FIG. 6 is a flowchart showing the analysis process according to the embodiment; -
FIG. 7A shows a scattergram according to the embodiment; -
FIG. 7B illustrates dividing the scattergram according to the embodiment; -
FIG. 7C shows areas each used for measuring the number of bacteria on the scattergram, according to the embodiment; -
FIG. 8A shows an example of a histogram according to the embodiment; -
FIG. 8B shows an example of a histogram according to the embodiment; -
FIG. 9 is a flowchart showing a process of displaying change information according to the embodiment; -
FIG. 10 shows an example of an information display screen displayed by a display unit of the information processing apparatus according to the embodiment; -
FIG. 11 shows an example of a chronological display screen displayed by the display unit of the information processing apparatus according to the embodiment; -
FIG. 12 shows an example of a medication administration history screen displayed by the display unit of the information processing apparatus according to the embodiment; -
FIG. 13A shows a variation of the flowchart showing the analysis process according to the embodiment; -
FIG. 13B shows a variation of the flowchart showing the analysis process according to the embodiment; -
FIG. 14 shows a variation of the flowchart showing the process of displaying change information according to the embodiment; and -
FIG. 15 shows a variation of the information display screen displayed by the display unit of the information processing apparatus according to the embodiment. - In an embodiment described below, the present invention is applied to a urine sample analyzer for performing measurement on bacteria contained in a urine sample and determining based on the measurement results the types of bacteria in the urine sample.
- Hereinafter, the urine sample analyzer according to the present embodiment will be described with reference to the drawings.
-
FIG. 1 shows an external configuration of aurine sample analyzer 1 according to the present embodiment. - The
urine sample analyzer 1 includes ameasurement apparatus 2 and aninformation processing apparatus 3. Themeasurement apparatus 2 optically measures bacteria contained in a urine sample by means of a flow cytometer. Theinformation processing apparatus 3 analyzes the results of the measurement performed by themeasurement apparatus 2, and displays the analysis results on adisplay unit 320. -
FIG. 2 shows a configuration of themeasurement apparatus 2. - The
measurement apparatus 2 includes asample dispenser 201, asample preparation section 202, anoptical detector 203, asignal processing circuit 210, aCPU 204, acommunication interface 205, and amemory 206. Thesignal processing circuit 210 includes an analoguesignal processing circuit 211, an A/D converter 212, a digitalsignal processing circuit 213, and amemory 214. - The
sample dispenser 201 includes a pipette and a pump (not shown). When the pump is driven, a predetermined amount of sample (urine) is aspirated into the pipette, and then the sample that has been aspirated into the pipette is discharged. By means of the pipette and the pump, thesample dispenser 201 supplies thesample preparation section 202 with the predetermined amount of sample that thesample dispenser 201 has aspirated from a sample container. - The
sample preparation section 202 includes a reagent container, a mixing container, and a pump (not shown). In the mixing container, the sample supplied from thesample dispenser 201 is mixed with a diluent solution and a staining solution that are supplied from the reagent container, and thereby a measurement sample is prepared. The measurement sample prepared in the mixing container is supplied by the pump to asheath flow cell 203c (seeFIG. 3 ) of theoptical detector 203, together with a sheath liquid. - The
optical detector 203 emits laser light to the measurement sample, and outputs electrical signals to the analoguesignal processing circuit 211, which electrical signals are based on forward scattered light, side fluorescence, and side scattered light which are generated when the measurement sample is irradiated with the laser light. In accordance with an instruction from theCPU 204, the analoguesignal processing circuit 211 amplifies the electrical signals outputted from theoptical detector 203, and outputs the amplified electrical signals to the A/D converter 212. - The A/
D converter 212 converts the electrical signals amplified by the analoguesignal processing circuit 211 into digital signals, and outputs the digital signals to the digitalsignal processing circuit 213. In accordance with an instruction from theCPU 204, the digitalsignal processing circuit 213 performs predetermined waveform processing on the digital signals outputted from the A/D converter 212, and the digital signals on which the waveform processing has been performed are stored in thememory 214. Here, the digital signals stored in thememory 214 include signals that are based on pulse signals of forward scattered light and side fluorescence which are generated each time a bacterium passes through thesheath flow cell 203c. - The
CPU 204 controls the analoguesignal processing circuit 211 and the digitalsignal processing circuit 213. Also, theCPU 204 obtains, from the digital signals stored in thememory 214, the magnitude of each of the pulse signals of the forward scattered light and the side fluorescence. Here, the magnitude of a pulse signal of forward scattered light indicates the intensity of the forward scattered light, which is generated when a bacterium passes through thesheath flow cell 203c. Similarly, the magnitude of a pulse signal of side fluorescence indicates the intensity of the side fluorescence, which is generated when a bacterium passes through thesheath flow cell 203c. Here, the magnitude of the pulse signal of the forward scattered light represents the size of the bacterium, and the magnitude of the pulse signal of the side fluorescence represents the degree of staining of the nucleic acid of the bacterium. - After obtaining the magnitudes of the respective pulse signals of the forward scattered light and the side fluorescence, the
CPU 204 generates, based on the magnitudes of the respective pulse signals, data cluster that indicates a forward scattered light intensity and a side fluorescence intensity for each of the bacteria that have passed through thesheath flow cell 203c (hereinafter, the data cluster is referred to as "measurement data"). TheCPU 204 outputs the measurement data to thecommunication interface 205. Further, theCPU 204 receives control signals from theinformation processing apparatus 3 via thecommunication interface 205, and drives the respective components of themeasurement apparatus 2 in accordance with the control signals. - The
communication interface 205 transmits to theinformation processing apparatus 3 the measurement data outputted from theCPU 204, and receives the control signals outputted from theinformation processing apparatus 3. Thememory 206 is used as a work area for theCPU 204. -
FIG. 3 is a schematic diagram showing configurations of theoptical detector 203 and the analoguesignal processing circuit 211 of themeasurement apparatus 2. - The
optical detector 203 includes alight emitter 203a, anirradiation lens unit 203b, thesheath flow cell 203c, acondenser lens 203d, apinhole plate 203e, a PD (photodiode) 203f, a condenser lens 203g, adichroic mirror 203h, an optical filter 203i, a pinhole plate 203j, a PMT (photomultiplier tube) 203k, and a PD (photodiode) 2031. The analoguesignal processing circuit 211 includesamplifiers - Laser light emitted from the
light emitter 203a is converted by theirradiation lens unit 203b into parallel light, and a sample flow containing the measurement sample is irradiated with the parallel light when passing through thesheath flow cell 203c. Note that the measurement sample passing through thesheath flow cell 203c is a mixture of a sample (a urine sample) to be measured and the aforementioned diluent solution and staining solution. - The
condenser lens 203d is disposed in the path of the laser light emitted from thelight emitter 203a. The forward scattered light, which is generated at thesheath flow cell 203c, is converged by thecondenser lens 203d, and passes through thepinhole plate 203e, before being received by thePD 203f. - The condenser lens 203g is disposed in a path that intersects the path of the laser light emitted from the
light emitter 203a. The side fluorescence and the side scattered light, which are generated at thesheath flow cell 203c, are converged by the condenser lens 203g and fall on thedichroic mirror 203h. Thedichroic mirror 203h separates the side fluorescence and the side scattered light. The side fluorescence separated by thedichroic mirror 203h passes through the optical filter 203i and the pinhole plate 203j, and is then received by thePMT 203k. The side scattered light separated by thedichroic mirror 203h is received by thePD 2031. - The
PD 203f, thePMT 203k, and thePD 2031 output electrical signals based on the received forward scattered light, side fluorescence, and side scattered light, respectively. Theamplifiers PD 203f, thePMT 203k, and thePD 2031, respectively, and output the resultant signals, to the A/D converter 212. Note that theamplifiers signal processing circuit 211 shown inFIG. 2 . -
FIG. 4 shows a configuration of theinformation processing apparatus 3. - The
information processing apparatus 3 is structured as a personal computer, and includes abody 300, aninput unit 310, and the display unit 320 (seeFIG. 1 ). Thebody 300 includes aCPU 301, aROM 302, aRAM 303, ahard disk 304, areadout device 305, an input/output interface 306, animage output interface 307, and acommunication interface 308. - The
CPU 301 executes a computer program stored in theROM 302 and a computer program loaded into theRAM 303. TheRAM 303 is used for loading computer programs that are stored in theROM 302 and thehard disk 304. TheRAM 303 is also used as a work area for theCPU 301 when these computer programs are executed. - In the
hard disk 304, various computer programs executed by theCPU 301, such as an operating system and application programs, and data used for executing these computer programs, are installed. Further, thehard disk 304 stores measurement data received from themeasurement apparatus 2 and a medication administration history which will be described below. - In addition, in the
hard disk 304, a program for obtaining based on the measurement data the number of bacteria contained in a sample and for performing analysis of the sample, and a display program for displaying the analysis results on thedisplay unit 320, are installed. These installed programs allow an analysis process and a display process to be performed. These processes will be described below. That is, owing to these programs, theCPU 301 has functions of performing processing as shown in (b) ofFIG. 5 ,FIG. 6 , andFIG. 9 as well as functions of displaying screens as shown inFIG. 10 to FIG. 12 . These functions will be described below. - The
readout device 305 is structured as a CD drive, DVD drive, or the like. Thereadout device 305 is configured to read a computer program and data that are stored in an external storage, for example, an external storage medium. Accordingly, programs executed by theinformation processing apparatus 3 can be updated via an external storage, for example, an external storage medium. - The
input unit 310, which includes a mouse and a keyboard, is connected to the input/output interface 306. The user uses theinput unit 310 to give instructions to theinformation processing apparatus 3. Theimage output interface 307 is connected to thedisplay unit 320, which includes a display and the like. Theimage output interface 307 outputs image signals based on image data to thedisplay unit 320. Thedisplay unit 320 displays images based on the image signals that are inputted from theimage output interface 307. - By means of the
communication interface 308, theinformation processing apparatus 3 can receive measurement data that is transmitted from themeasurement apparatus 2. The received measurement data is stored in thehard disk 304. -
FIG. 5 shows flowcharts showing control performed by theCPU 204 of themeasurement apparatus 2 and control performed by theCPU 301 of theinformation processing apparatus 3. A flowchart (a) inFIG. 5 shows a measurement process performed by theCPU 204 of themeasurement apparatus 2, and a flowchart (b) inFIG. 5 shows an analysis process performed by theCPU 301 of theinformation processing apparatus 3. - Referring to (b) in
FIG. 5 , when a measurement start instruction is provided from the user via the input unit 310 (S11: YES), theCPU 301 transmits a measurement start signal to the measurement apparatus 2 (S12). Next, theCPU 301 determines whether measurement data has been received (S13). If measurement data has not been received (S13: NO), theCPU 301 does not advance the processing. - Referring to (a) in
FIG. 5 , when theCPU 204 receives the measurement start signal from the information processing apparatus 3 (S21: YES), theCPU 204 performs a sample measurement as described above (S22). When the sample measurement is completed, theCPU 204 transmits measurement data to the information processing apparatus 3 (S23), and returns the processing to S21. - Referring to (b) in
FIG. 5 , when theCPU 301 receives the measurement data from the measurement apparatus 2 (S13: YES), theCPU 301 stores the measurement data in thehard disk 304, and performs the analysis process based on the measurement data (S14). Then, theCPU 301 causes thedisplay unit 320 to display analysis results obtained at S14 (S15), and causes thedisplay unit 320 to display change information based on the analysis results (S16). Thereafter, the processing returns to S11. Note that the analysis process performed at S14 is described below with reference toFIG. 6 , and the process of displaying change information that is performed at S16 is described below with reference toFIG. 9 . -
FIG. 6 is a processing flowchart showing the analysis process performed at S14 ofFIG. 5 . - First, the
CPU 301 loads the measurement data from thehard disk 304 into theRAM 303. Based on the loaded measurement data, theCPU 301 creates a two-dimensional scattergram of which the vertical axis represents forward scattered light intensity and the horizontal axis represents side fluorescence intensity (S101). In the two-dimensional scattergram, pieces of the measurement data are plotted. Each piece of the measurement data indicates a forward scattered light intensity and a side fluorescence intensity of a single bacterium.FIG. 7A shows an example of the scattergram created at S101. Based on the created two-dimensional scattergram, theCPU 301 measures the total number of bacteria contained in the measurement sample (S102). - Next, the
CPU 301 determines whether the number of bacteria contained in the measurement sample is greater than or equal to a predetermined value (S103). To be specific, theCPU 301 obtains the number of bacteria contained in 1 mL of the sample from the total number of bacteria measured at S102, and determines whether the number of bacteria contained in 1 mL of the sample is greater than or equal to the predetermined value. Note that, in the present embodiment, the predetermined value used in the determination at S103 is a threshold bacterial count that is used for determining whether a subject from whom the sample was collected is infected with a urinary tract infection. The threshold bacterial count is, for example, 1.0×10^4 in 1 mL of the sample. - If the
CPU 301 determines that the number of bacteria contained in the measurement sample is not greater than or equal to the predetermined value (S103: NO), then theCPU 301 determines that the subject is not infected with a urinary tract infection (S104) and ends the processing. On the other hand, if theCPU 301 determines that the number of bacteria contained in the measurement sample is greater than or equal to the predetermined value (S103: YES), the processing proceeds to S105. - Next, the
CPU 301 divides the two-dimensional scattergram created at S101 into a plurality of areas by using predetermined slope angles (S105). TheCPU 301 measures the number of bacteria contained in each of the areas of the two-dimensional scattergram divided at S105 (S106). - Hereinafter, the plurality of areas of the scattergram will be described with reference to
FIG. 7B andFIG. 7C . -
FIG. 7B is a schematic diagram showing the scattergram divided at S105. - In
FIG. 7B , straight lines d0, d1, d2, d3, d4, etc., are straight lines each extending in a radial direction of a virtual circle A whose center is the origin (i.e., origin O) of the scattergram. The straight line d0 coincides with the horizontal axis of the scattergram. As shown inFIG. 7B , each of the other straight lines forms an angle θ with straight lines adjacent thereto. Areas D0 D1, D2, D3, etc., are a result of dividing the scattergram by the straight lines d0, d1, d2, d3, d4, etc. Note that the angle θ may be set to any angle, for example, 1 degree or 10 degrees. After the scattergram is divided into the plurality of areas in this manner, a rectangular area B which contains the origin O is excluded from the areas D0 D1, D2, D3, etc. -
FIG. 7C shows areas each used for measuring the number of bacteria on the scattergram. As shown inFIG. 7C , areas E0, E1, E2, E3, etc., which are each used for measuring the number of bacteria, are a result of excluding the area B from the areas D0, D1, D2, D3, etc., shown inFIG. 7B . - Here, the area B is excluded from the areas D0, D1, D2, D3, etc., of
FIG. 7B for the purpose of improving the accuracy of determination of the classification of a urinary tract infection and the accuracy of determination of types of bacteria. These determinations will be described below. To be specific, as shown in the scattergram ofFIG. 7A , distributions of bacteria tend to concentrate near the origin O. For this reason, if bacteria distributed near the origin O are counted in each of the areas D0, D1, D2, D3, etc., then differences are not likely to occur among the counting results of the respective areas. This hinders smooth determination of bacteria. Moreover, in the area B, as compared to other areas (i.e., areas where the forward scattered light intensity and the side fluorescence intensity are greater than those in the area B), areas divided by the straight lines d0, d1, d2, d3, d4, etc., are small. Furthermore, distributions of different types of bacteria tend to overlap each other near the origin O. Therefore, if bacteria are counted in an area near the origin, it is likely that a large number of bacteria that are not intended to be counted in the area are counted. This causes a significant error in the counting result. - For the above reasons, the area B is excluded from the areas D0, D1, D2, D3, etc., so that bacteria near the origin O are not counted in the determination of the classification of a urinary tract infection and the determination of types of bacteria, which determinations are described below, and so that the numbers of bacteria contained in the respective areas, which are obtained from the counting, may significantly differ from each other.
- Note that the size of the area B is set such that types of bacteria that are determined based on the numbers of bacteria contained in the respective areas E0, E1, E2, E3, etc., are closest to those determined based on measurement results that would be obtained by a measurement method in which cultured bacteria are used.
- Returning to
FIG. 6 , next, theCPU 301 creates a histogram based on the numbers of bacteria that are obtained at S106 for the areas E0, E1, E2, E3, etc., respectively (S107). -
FIG. 8A shows an example of the histogram created at S107. InFIG. 8A , the horizontal axis represents angles, with respect to the straight line d0 of the straight lines d0 d1, d2, d3, d4, etc., which divide the areas E0 E1, E2, E3, etc. That is, the horizontal axis corresponds to the areas E0, E1, E2, E3, etc., in order of their angle with respect to the straight line d0, from the smallest angle to the greatest angle. The vertical axis represents the numbers of bacteria that are contained in the areas E0, E1, E2, E3, etc., respectively. - Returning to
FIG. 6 , next, theCPU 301 selects, in the histogram created at S107, the area(s) that shows a peak of the number of bacteria (S108). - Here, an area that shows a peak of the number of bacteria is an area (an angular range) which corresponds to the peak of a raised portion of the histogram. That is, among the areas E0, E1, E2, E3, etc., an area for which the number of bacteria counted therein is greater than the number of bacteria counted in adjacent areas that precede and follow the area in terms of the size of the angle with respect to the straight line d0, is selected as a peak area.
- For example, the histogram of
FIG. 8A shows a single peak of the number of bacteria. At the peak, the bacterial count is N1. In this case, theCPU 301 selects an area En1 that corresponds to the peak.FIG. 8B shows another example of a histogram. The histogram ofFIG. 8B shows two peaks of the number of bacteria. At these two peaks, the bacterial counts are N2 and N3, respectively. In this case, theCPU 301 selects an area En2 which corresponds to the peak at the left of the histogram and an area En3 which corresponds to the peak at the right of the histogram. - Next, if the number of areas selected at S108 as corresponding to a peak of the number of bacteria is one (S109: YES), then the
CPU 301 determines that the classification of a urinary tract infection indicated by the sample from which the measurement data has been obtained is an uncomplicated urinary tract infection (S110). On the other hand, if the number of areas selected at S108 as corresponding to a peak of the number of bacteria is two or more (S109: NO), then theCPU 301 determines that the classification of a urinary tract infection indicated by the sample from which the measurement data has been obtained is a complicated urinary tract infection (S111). - Subsequently, based on the area(s) selected at S108, the
CPU 301 determines the type(s) of bacteria contained in the sample from which the measurement data has been obtained (5112). To be specific, theCPU 301 determines the type(s) of bacteria contained in the sample based on whether the angular range, with respect to the straight line d0, of the area(s) selected at S108 is included among angular ranges that are preset for the purpose of specifying bacterial types. For example, in the case ofFIG. 7B , the angular range of the area D2 is 2θ to 3θ. If the area D2 is selected at S108, the type of bacteria contained in the area D2 is determined based on which angular range, among the angular ranges that are preset for the purpose of specifying bacterial types, includes the angular range of 2θ to 3θ. - In the present embodiment, the angular ranges used for specifying bacterial types are set as shown below.
- (a) 0° to 25° ...Bacilli
- (b) 26° to 44°...Streptococci
- (c) 45° to 80°...Staphylococci
- (d) 81° to 90°...Not Applicable
- Note that, in the present embodiment, if the number of areas selected at S108 is three or more, then bacterial types are determined only for the areas for which the numbers of bacteria counted therein are the greatest and the second greatest among the selected areas. However, as an alternative, bacterial types may be determined for the areas for which the numbers of bacteria counted therein are the greatest, the second greatest, and the third greatest among the selected areas. As a further alternative, bacterial types may be determined for all of the select areas.
- Next, the
CPU 301 stores the analysis results in the hard disk 304 (S113), which analysis results contain the classification of urinary tract infection and the bacterial type(s) obtained in the above manner. Then, the processing ends. -
FIG. 9 is a processing flowchart showing the process of displaying change information that is performed at S16 ofFIG. 5 . - First, the
CPU 301 determines whether the analysis results obtained from the most recently performed analysis and the analysis results obtained from the immediately previously performed analysis are all stored in thehard disk 304 regarding the subject from whom the sample was collected for the most recently performed analysis (S201). If the analysis results obtained from the most recently performed analysis and the analysis results obtained from the immediately previously performed analysis are not all stored in the hard disk 304 (S201: NO), the processing ends. If the analysis results obtained from the most recently performed analysis and the analysis results obtained from the immediately previously performed analysis are all stored in the hard disk 304 (S201: YES), theCPU 301 loads the most recent analysis results and the immediately previous analysis results into the RAM 303 (S202), and compares the most recent analysis results and the immediately previous analysis results (S203). - Next, based on the result of the comparison at S203, the
CPU 301 determines whether the classification of urinary tract infection indicated by the most recent analysis results has changed from that indicated by the immediately previous analysis results (S204). If it is determined that the classification of urinary tract infection has changed (S204: YES), theCPU 301 assigns 1 to a urinary tract infection flag (S205). On the other hand, if it is determined that the type of urinary tract infection has not changed (S204: NO), theCPU 301 assigns 0 to the urinary tract infection flag (S206). - Subsequently, the
CPU 301 determines based on the result of the comparison at S203 whether the bacterial type indicated by the most recent analysis results has changed from that indicated by the immediately previous analysis results (S207). If it is determined that the bacterial type has changed (S207: YES), theCPU 301 assigns 1 to a type flag (S208). On the other hand, if it is determined that the bacterial type has not changed (S207: NO), theCPU 301 assigns 0 to the type flag (S209). - Next, the
CPU 301 determines whether the urinary tract infection flag is 1 or the type flag is 1 (S210). If it is determined that either the urinary tract infection flag is 1 or the type flag is 1 (S210: YES), theCPU 301 causes thedisplay unit 320 of theinformation processing apparatus 3 to display a message indicating the change (S211). Then, the processing ends. -
FIG. 10 shows an example of aninformation display screen 400 displayed by thedisplay unit 320 of theinformation processing apparatus 3. Theinformation display screen 400 is displayed in accordance with S15 and S16 ofFIG. 5 . - The
information display screen 400 includes asubject ID area 401, a measurement date/time area 402, ascattergram area 403, ahistogram area 404, asubject information area 405, abacterial information area 406, adivision angle area 407, and achange information area 408. Thebacterial information area 406 includes a urinary tractinfection classification area 406a and atype area 406b. - The
subject ID area 401 shows a subject ID. The subject ID identifies the subject from whom the sample was collected for the analysis of which the results are shown in theinformation display screen 400. The measurement date/time area 402 shows the date and time when the measurement for the analysis was performed. Thescattergram area 403 shows a scattergram as inFIG. 7A which is obtained based on the performed measurement. Thehistogram area 404 shows a histogram as inFIG. 8A or 8B which is obtained based on the scattergram shown in thescattergram area 403. - The
subject information area 405 shows, for example, the name of the subject, the name of the attending doctor, and comments from the attending doctor that are associated with the subject ID. In addition to these types of information, information about medication administered to the subject may be inputted via the input unit 310 (seeFIG. 4 ) and shown in thesubject information area 405. - The urinary tract
infection classification area 406a shows the determination result obtained at S110 or S111 of the analysis process shown inFIG. 6 . That is, in a case where the classification of the urinary tract infection indicated by the sample analyzed in the analysis process is an uncomplicated urinary tract infection, the urinary tractinfection classification area 406a shows "UNCOMPLICATED INFECTION?". On the other hand, in a case where the classification of the urinary tract infection indicated by the sample analyzed in the analysis process is a complicated urinary tract infection, the urinary tractinfection classification area 406a shows "COMPLICATED INFECTION?". - Note that "?" added at the end of the message shown in the urinary tract
infection classification area 406a indicates to the user that the sample indicates a high possibility that the subject is infected with an uncomplicated urinary tract infection or a complicated urinary tract infection. If there is no determination provided regarding the classification of urinary tract infection, or the urinary tract infection of the sample cannot be determined to be a specific classification, then the urinary tractinfection classification area 406a is left blank or shows a message "UNKNOWN". - The
type area 406b shows the bacterial type(s) determined at S112 of the analysis process shown inFIG. 6 . Note that "?" added at the end of the message shown in thetype area 406b indicates that there is a high possibility that the sample contains the bacteria of the type(s) shown in thetype area 406b. If there is no determination provided regarding the bacterial types, or the bacteria contained in the sample cannot be determined to be a specific type(s), thetype area 406b is left blank or shows a message "UNKNOWN". - The
division angle area 407 shows the angle θ which is formed between each of the straight lines d0, d1, d2, d3, d4, etc., and the respective straight line(s) adjacent thereto. The straight lines d0, d1, d2, d3, d4, etc., divide the areas D0, D1, D2, D3, etc., as shown inFIG. 7B . - The
change information area 408 shows, in accordance with the process of displaying change information which is performed as shown inFIG. 9 , a message indicating that the bacterial type has changed. Here, as shown inFIG. 10 , thechange information area 408 shows "CHANGED" indicating that the most recent analysis results have changed from the immediately previous analysis results. In a case where the classification of urinary tract infection has changed from an uncomplicated infection to a complicated infection, thechange information area 408 shows "UNCOMPLICATED → COMPLICATED" together with "CHANGED". In a case where the bacterial type has changed, thechange information area 408 shows "TYPE" together with "CHANGED". Note that if the analysis results obtained based on the most recent measurement have not changed from the analysis results obtained based on the immediately previous measurement, or if the number of bacteria determined based on the most recent measurement is not greater than or equal to the predetermined value (NO at S103), then thechange information area 408 is left blank. -
FIG. 11 shows an example of achronological display screen 500 which is displayed by thedisplay unit 320 of theinformation processing apparatus 3. This screen is displayed when an input operation for displaying a chronological display regarding a particular subject is performed via theinput unit 310 of theinformation processing apparatus 3. - The
chronological display screen 500 includes: asubject ID area 501; measurement date/time areas scattergram areas histogram areas bacterial information areas division angle areas information areas medication information areas - Similar to the
subject ID area 401 shown inFIG. 10 , thesubject ID area 501 shows a subject ID. The subject ID identifies the subject from whom samples were collected for analyses of which the results are shown in thechronological display screen 500. - Each of the four groups of
areas 511 to 516, 521 to 526, 531 to 536, and 541 to 546 shows measurement results and analysis results obtained based on a corresponding single measurement. That is, these four groups show four sets of information that are based on four sets of measurement data obtained from four samples that were collected from the same subject at four different dates and times. Each group shows a corresponding one of the four sets of information, in the areas that correspond to theareas information display screen 400 shown inFIG. 10 . Note that, in the present embodiment, the four sets of measurement data that correspond to these four groups are chronologically successive. - Each of the
change information areas - In the example of
FIG. 11 , in comparison with the analysis results shown at the leftmost position inFIG. 11 , the analysis results shown at the second-from-left position inFIG. 11 indicate a change in the bacterial type from "BACILLUS?" to "STREPTOCOCCUS? ". Accordingly, thechange information area 526 shows "TYPE" indicating that the bacterial type has changed. - Similarly, since the bacterial type information has changed, as shown in the
bacterial information area 534, from the bacterial type information indicated in thebacterial information area 524, thechange information area 536 at the third-from-left position inFIG. 11 shows "TYPE" indicating that the bacterial type has changed, and also shows that the classification of urinary tract infection has changed. To be specific, in this case, the classification of urinary tract infection has changed from "UNCOMPLICATED?" to "COMPLICATED?", and the bacterial type has changed from "STREPTOCOCCUS?" to "STREPTOCOCCUS? STAPHYLOCOCCUS?". Therefore, thechange information area 536 shows "UNCOMPLICATED → COMPLICATED" indicating that the classification of urinary tract infection has changed from an uncomplicated urinary tract infection to a complicated urinary tract infection, together with "TYPE" indicating that the bacterial type has changed. - Each of the
medication information areas FIG. 11 , information indicating that medication was administered to the subject (in this example, a picture of a syringe) between the measurement date/time indicated in the measurement date/time area 511 and the measurement date/time indicated in the measurement date/time area 521, is shown in themedication information area 551. Similarly, information indicating that medication was administered to the subject between the measurement date/time indicated in the measurement date/time area 531 and the measurement date/time indicated in the measurement date/time area 541, is shown in themedication information area 553. -
FIG. 12 shows an example of a medicationadministration history screen 600 which is displayed by thedisplay unit 320 of theinformation processing apparatus 3. - The medication
administration history screen 600 contains asubject ID area 601, a medicationadministration history area 602, and anedit command area 603. - The
subject ID area 601 shows a subject ID that identifies a subject to whom medications were administered. The medicationadministration history area 602 shows a history of medications administered to the subject identified by the subject ID indicated in thesubject ID area 601. - In the medication
administration history area 602, dates and times when the medications were administered to the subject are shown in association with the details of the administered medications. Such medication administration history is stored in thehard disk 304 of theinformation processing apparatus 3. - Note that, while the screen shown in
FIG. 11 is displayed, if the user uses theinput unit 310 of theinformation processing apparatus 3, thereby pressing (e.g., by a click), among themedication information areas medication information areas FIG. 12 is displayed. Here, in response to one of themedication information areas FIG. 11 , a row showing a medication administration date/time and the details of administered medication that correspond to the pressed medication information area, is selectively displayed as shown inFIG. 12 . In this manner, the user can check the details of the medication. - The
edit command area 603 includes "ADD", "EDIT", and "DELETE" buttons for editing the information shown in the medicationadministration history area 602. The user can edit the information shown in the medicationadministration history area 602 by pressing (e.g., by a click) these buttons via theinput unit 310. Note that if the information in the medicationadministration history area 602 is altered, the information shown in themedication information areas chronological display screen 500 ofFIG. 11 is also altered so as to be consistent with the alteration of the information in the medicationadministration history area 602. - As described above, in the present embodiment, the analysis process as shown in
FIG. 6 is performed based on the forward scattered light and the side fluorescence that are received by thePD 203f and thePMT 203k, respectively. According to the analysis results obtained from the analysis process, theinformation display screen 400 as shown inFIG. 10 is displayed by thedisplay unit 320 of theinformation processing apparatus 3. If a change in the bacterial type has occurred, thechange information area 408 shows a message indicating the change. Accordingly, if treatment was given to the subject from whom the sample was collected, the user can check whether the treatment has been effective for the subject. - Further, according to the present embodiment, the
chronological display screen 500 as inFIG. 11 shows measurement results and analysis results based on measurement data obtained from four samples that were collected from the same subject at four different dates and times. Accordingly, if treatment was given to the subject from whom the samples were collected, the user can check, chronologically, whether the treatment has been effective for the subject. - Still further, according to the present embodiment, the
medication information areas chronological display screen 500 as inFIG. 11 show medication information. Since the medication information is shown in this manner, the user can readily know how the types of bacteria found in the samples have changed owing to medications administered to the subject. This also allows the user to check if the medication administered to the subject has been effective. - Although the embodiment of the present invention has been described as above, the present invention is not limited to the above embodiment. Moreover, various modifications of the above embodiment may be made.
- For example, although urine is measured in the above embodiment, blood may also or alternatively be measured. Thus, for example, the present invention is applicable to sample testing apparatuses for testing blood samples. Further, the present invention is applicable to sample testing apparatuses for testing other types of samples.
- In the above embodiment, it is determined at S109 of
FIG. 6 whether the number of peaks of bacterial count in the histogram is one. Based on the determination result, the classification of the urinary tract infection indicated by the sample from which the measurement data has been obtained, is determined. Here, whether the number of peaks of bacterial count in the histogram is one may be determined based on the skewness of the histogram. Moreover, in order to determine the classification of urinary tract infection, the skewness of the histogram may be used in addition to performing the determination at S109 of the above embodiment. - Described below is a method for determining based on the skewness of the histogram whether the number of peaks of bacterial count is one.
- In the histogram of the above embodiment, if the number of pieces of data is n; the number of bacteria at each angle is Xi; the average number of bacteria is Xa; and the standard deviation is S(X), then a skewness α3 is calculated by an equation shown below.

- If the histogram shows a symmetrical distribution such as a normal distribution, the value of the skewness α3 is 0. If the skewness α3 is a negative value, the distribution has a negative skew, and the histogram has an elongated tail at the left. On the other hand, if the skewness α3 is a positive value, the distribution has a positive skew, and the histogram has an elongated tail at the right.
- If the histogram shows a symmetrical distribution, it is likely that the histogram shows only one peak. On the other hand, if the histogram shows a significant positive or negative skew, it is likely that the histogram shows multiples peaks, or that, although the histogram shows only one peak, other peaks are buried in the elongated tails.
- Accordingly, if the value of the skewness α3 is within predetermined positive and negative value ranges from 0, the number of peaks may be determined to be one. On the other hand, if the value of the skewness α3 is out of these ranges, the number of peaks may be determined to be plural. That is, proper adjustment of the positive and negative threshold ranges for the skewness α3 that are used for determining whether the number of peaks is plural, makes it possible to determine whether the number of peaks of the histogram is one based on whether the skewness α3 is within these threshold ranges.
-
FIG. 13A is part of a processing flowchart showing the analysis process in which S121, instead of S108 and S109 ofFIG. 6 , is performed in order to determine whether the number of peaks is one. If the absolute value of the skewness of the histogram created at S107 is less than or equal to a predetermined value (i.e., a threshold) (S121: YES), the number of peaks of the histogram is determined to be one. Then, the classification of the urinary tract infection indicated by the sample from which the measurement data has been obtained is determined to be an uncomplicated urinary tract infection (S110). On the other hand, if the absolute value of the skewness of the histogram created at S107 is not less than or equal to the predetermined value (S121: NO), the number of peaks of the histogram is determined to be plural. Then, the classification of the urinary tract infection indicated by the sample from which the measurement data has been obtained is determined to be a complicated urinary tract infection (S111). - In the above determination process, even in a case where the histogram shows multiple peaks due to noise or the like, the number of peaks is determined to be one if the shape of the histogram is substantially symmetrical. Accordingly, the classification of the urinary tract infection indicated by the sample from which the measurement data has been obtained is determined to be an uncomplicated urinary tract infection. Further, even in a case where the histogram shows only one peak, the number of peaks is determined to be plural if other peaks are buried in the elongated tails of the histogram. Then, the classification of the urinary tract infection indicated by the sample from which the measurement data has been obtained is determined to be a complicated urinary tract infection.
-
FIG. 13B is part of a processing flowchart showing the analysis process in which S121 is additionally performed between S109 and S110 ofFIG. 6 in order to determine whether the number of peaks is one. In this case, the shape of the histogram is determined at S121 based on its skewness, in addition to the determination being performed at S109 as to whether the number of peaks of the histogram is one. In this manner, even if the number of peaks is determined to be one, the classification of the urinary tract infection indicated by the sample from which the measurement data has been obtained is determined to be a complicated urinary tract infection if the histogram has elongated tails at the right and left. - In the above embodiment, the
chronological display screen 500 ofFIG. 11 shows the four sets of measurement results and analysis results for the respective four sets of measurement dates and times, at the same time. However, the number of sets of measurement dates and times for which the measurement results and analysis results are shown is not limited to four. The measurement results and analysis results may be shown at the same time for any multiple number of sets of measurement dates and times. If the measurement results and analysis results to be shown do not entirely fit in a single screen, a scrollbar may be provided on thechronological display screen 500 so as to allow scrolling of the display screen, or a page switching button may be provided so as to allow switching of the page to view. - Further, the
chronological display screen 500 shows information based on multiple sets of measurement data that are chronologically successive. However, thechronological display screen 500 may show information based on multiple sets of measurement data that are not chronologically successive. For example, the user may select, among the past measurement dates and times, any four sets of measurement dates and times for which information is to be shown chronologically. - Still further, in the above embodiment, characters are used to show information in the
change information area 408 of theinformation display screen 400 and in thechange information areas chronological display screen 500. However, not only characters but also symbols and figures that are easier to visually recognize may be used to show information in these areas. - Still further, in the above embodiment, each of the
medication information areas chronological display screen 500 merely indicates that medication has been administered to the subject. However, the present invention is not limited thereto. Each medication information area may show a date and time when medication was administered and the details of the medication. Moreover, when any one of the medication information areas is pressed (e.g., clicked), the date and time when medication was administered and the details of the medication that correspond to the pressed medication information area may be shown as a pop-up. - Still further, in the above embodiment, the
change information area 408 ofFIG. 10 shows, based on the comparison of the most recent analysis results and the immediately previous analysis results, change information indicating that the most recent analysis results have changed from the immediately previous analysis results. However, the present invention is not limited thereto. The most recent analysis results may be compared with analysis results earlier than the immediately previous analysis results. For example, the most recent analysis results may be compared with analysis results obtained based on measurement performed at any date and time that precede the date and time of the measurement for the most recent analysis results. - Still further, in the above embodiment, each of the
change information areas information area 408 may show a message "UNCHANGED" if the corresponding analysis results show no changes from the previous analysis results. Alternatively, the display may be performed in such a manner that each of these areas is not shown if the corresponding analysis results show no changes from the previous analysis results. - Still further, in the above embodiment, in the determination as to whether the analysis results have changed, it is determined as shown in S210 of
FIG. 9 whether the classification of urinary tract infection or the bacterial type has changed. However, the present invention is not limited thereto. The determination may be additionally performed as to whether the number of bacterial types has changed. -
FIG. 14 is a processing flowchart showing the process of displaying change information in the above case. The flowchart ofFIG. 14 is different from the flowchart ofFIG. 9 in that S221 to S223 are added and S210 is replaced with S224. Hereinafter, these added and replaced steps are described. - Based on the result of the comparison at S203, the
CPU 301 determines whether the number of bacterial types indicated by the most recent analysis results has changed from that indicated by the immediately previous analysis results (S221). If it is determined that the number of bacterial types indicated by the most recent analysis results has changed from that indicated by the immediately previous analysis results (S221: YES), theCPU 301 assigns 1 to a type number flag (S222). On the other hand, if it is determined that the number of bacterial types indicated by the most recent analysis results has not changed from that indicated by the immediately previous analysis results (S221: NO), theCPU 301 assigns 0 to the type number flag. - Next, the
CPU 301 determines whether the urinary tract infection flag is 1, or the type flag is 1, or the type number flag is 1 (5224). If it is determined that the urinary tract infection flag is 1, or the type flag is 1, or the type number flag is 1 (S224: YES), theCPU 301 causes thedisplay unit 320 of theinformation processing apparatus 3 to display a message indicating the change (S221), and ends the processing. -
FIG. 15 shows an example of theinformation display screen 400 displayed by thedisplay unit 320 of theinformation processing apparatus 3 in the above case.FIG. 15 shows, in achange information area 411, information that is different from the information shown in thechange information area 408 ofFIG. 10 . - The
change information area 411 shows, in addition to the information shown in thechange information area 408 ofFIG. 10 , "NUMBER OF TYPES" indicating that the number of bacterial types has changed. Note that, in the above case, each of thechange information areas chronological display screen 500 inFIG. 11 is also configured to show "NUMBER OF TYPES" so as to indicate that the number of bacterial types has changed. - In addition to the above, various modifications of the embodiment of the present invention may be made without departing from the scope of the technical idea defined by the claims.
Claims (15)
- A sample analyzer comprising:a light source for emitting light to particles contained in a measurement sample which is prepared from a reagent and a urine sample collected from a subject;a detector for detecting scattered light and fluorescence which are generated from the particles in the measurement sample;a display; anda controller, whereinthe controller executes operations comprising:obtaining particle data based on the scattered light and the fluorescence which are detected from the particles by the detector; andcontrolling, when the particle data satisfies a predetermined condition, the display to display information indicating a possibility that the subject is infected with an uncomplicated urinary tract infection.
- The sample analyzer of claim 1, wherein
the particle data comprises a scattered light intensity and a fluorescence intensity which are obtained for each particle in the measurement sample, and
the controller controls the display to display the information when a state of distribution of the scattered light intensities and fluorescence intensities of the respective particles in the measurement sample satisfies the predetermined condition. - The sample analyzer of claim 1 or 2, wherein
the controller generates a scattergram in which pieces of the particle data are plotted based on the scattered light and the fluorescence, sets a plurality of areas on the scattergram, and determines based on the number of plots in each area whether the particle data satisfies the predetermined condition. - The sample analyzer of claim 3, wherein
the controller sets the plurality of areas by dividing the scattergram at predetermined slope angles with respect to the origin of the scattergram. - The sample analyzer of claim 3 or 4, wherein predetermined areas each including the origin of the scattergram are excluded from the plurality of areas, respectively.
- The sample analyzer of any one of claims 3 to 5, wherein
the controller determines whether the particle data satisfies the predetermined condition based on the number of areas, among the plurality of areas, that comprise a greater number of plots than respective numbers of plots in areas adjacent thereto. - The sample analyzer of any one of claims 4 to 6, wherein
the controller determines whether the particle data satisfies the predetermined condition based on a histogram which is generated based on the slope angles and the number of plots in each area. - The sample analyzer of claim 7, wherein
the controller determines based on the shape of the histogram whether the particle data satisfies the predetermined condition. - The sample analyzer of claim 8, wherein
the controller determines based on the number of peaks shown in the histogram whether the particle data satisfies the predetermined condition. - The sample analyzer of any one of claims 7 to 9, wherein
the controller:controls, when the histogram satisfies the predetermined condition, the display to display first information indicating a possibility that the subject is infected with an uncomplicated urinary tract infection; andcontrols, when the histogram satisfies a second condition, the display to display second information indicating a possibility that the subject is infected with a complicated urinary tract infection. - A sample analyzer comprising:a light source for emitting light to particles contained in a measurement sample which is prepared from a sample and a reagent;a detector for detecting scattered light and fluorescence which are generated from the particles in the measurement sample;a display; anda controller, whereinthe controller executes operations comprising:obtaining, for each particle in the measurement sample, particle data which comprise numerical values obtained from the scattered light and the fluorescence detected from the particle;determining one of a plurality of numerical ranges to which each of the particle data belongs;generating a histogram that indicates, for each numerical value range, the number of particles belonging thereto; andcontrolling the display to display the histogram.
- A sample analyzer comprising:a light source for emitting light to a measurement sample which is prepared from a reagent and a sample collected from a subject;a detector for detecting scattered light and fluorescence which are generated from the measurement sample;a memory;a display; anda controller, whereinthe controller executes operations comprising:obtaining a measurement result based on the scattered light and the fluorescence;storing the measurement result in the memory;determining, based on the measurement result of the subject that has most recently been obtained and the measurement result of the subject that has previously been stored in the memory, whether a type of bacteria that the subject is suspected to be infected with has changed; andcontrolling, when the type of bacteria has changed, the display to display information indicating that the type of bacteria has changed.
- The sample analyzer of claim 12, wherein
the controller further determines, based on the measurement result of the subject that has most recently been obtained and the measurement result that has previously been stored in the memory, whether a urinary tract infection with which the subject is infected has changed between an uncomplicated urinary tract infection and a complicated urinary tract infection, and when the urinary tract infection has changed, controls the display to display information indicating that the urinary tract infection has changed. - The sample analyzer of claim 12 or 13, wherein
the controller stores, in the memory, histories of medication administration regarding respective subjects, separately. - The sample analyzer of claim 14, wherein
the controller controls the display to display the measurement results of the subject in a chronological manner together with a history of medication administration of the subject.
Applications Claiming Priority (2)
| Application Number | Priority Date | Filing Date | Title |
|---|---|---|---|
| JP2010003211A JP5685378B2 (en) | 2010-01-08 | 2010-01-08 | Sample analyzer and sample analysis method |
| JP2010003215A JP5530723B2 (en) | 2010-01-08 | 2010-01-08 | Sample analyzer and sample analysis method |
Publications (2)
| Publication Number | Publication Date |
|---|---|
| EP2348301A1 true EP2348301A1 (en) | 2011-07-27 |
| EP2348301B1 EP2348301B1 (en) | 2013-08-21 |
Family
ID=43569289
Family Applications (1)
| Application Number | Title | Priority Date | Filing Date |
|---|---|---|---|
| EP11150180.5A Not-in-force EP2348301B1 (en) | 2010-01-08 | 2011-01-05 | Sample analyzer |
Country Status (3)
| Country | Link |
|---|---|
| US (1) | US9086402B2 (en) |
| EP (1) | EP2348301B1 (en) |
| CN (1) | CN102121892B (en) |
Cited By (4)
| Publication number | Priority date | Publication date | Assignee | Title |
|---|---|---|---|---|
| EP2811032A1 (en) * | 2013-06-03 | 2014-12-10 | Sysmex Corporation | Bacteria analyzing method and specimen analyzer |
| WO2017189632A1 (en) * | 2016-04-25 | 2017-11-02 | Aperture Bio, LLC | Systems, devices and methods for sequential analysis of complex matrix samples for high confidence bacterial detection and drug susceptibility prediction using a flow cytometer |
| US10458896B2 (en) | 2013-05-28 | 2019-10-29 | Chemometec A/S | Image forming cytometer |
| US20200249144A1 (en) * | 2019-01-31 | 2020-08-06 | Aperture Bio, LLC | Methods And Systems For Increasing The Capacity Of Flow Cytometer Bacteria Detection And Antibiotic Susceptibility Testing Systems |
Families Citing this family (8)
| Publication number | Priority date | Publication date | Assignee | Title |
|---|---|---|---|---|
| WO2013056415A1 (en) * | 2011-10-18 | 2013-04-25 | 长沙高新技术产业开发区爱威科技实业有限公司 | Automatic detection control device for sample tangible ingredient analyzer and control method thereof |
| US9372143B2 (en) * | 2013-05-15 | 2016-06-21 | Captl Llc | Scanning image flow cytometer |
| JP6196502B2 (en) * | 2013-08-30 | 2017-09-13 | シスメックス株式会社 | Sample analysis method and sample analyzer |
| CN105096293B (en) * | 2014-04-30 | 2018-12-07 | 西门子医疗保健诊断公司 | Method and apparatus for handling the block to be processed of sediment urinalysis image |
| WO2016053181A1 (en) * | 2014-10-01 | 2016-04-07 | Water Optics Technology Pte. Ltd | A sensor for particle detection in a fluid |
| WO2016100954A1 (en) | 2014-12-19 | 2016-06-23 | Captl Llc | Flow cytometry using hydrodynamically planar flow |
| US10036698B2 (en) | 2015-06-19 | 2018-07-31 | Captl Llc | Time-sequential cytometry |
| CN110118758B (en) * | 2019-04-01 | 2022-06-03 | 深圳市趣方科技有限公司 | Scattering fluorescence bimodal flow type imaging system |
Citations (5)
| Publication number | Priority date | Publication date | Assignee | Title |
|---|---|---|---|---|
| EP0949498A2 (en) * | 1998-04-08 | 1999-10-13 | Sysmex Corporation | Apparatus and method for differentiating erythrocytes in urine |
| US20040219627A1 (en) | 2003-04-10 | 2004-11-04 | Sysmex Corporation. | Methods for measuring bacteria, bacteria measuring apparatuses, and storage media for storing computer-executable programs for analyzing bacteria |
| EP1857805A2 (en) * | 2006-05-17 | 2007-11-21 | Sysmex Corporation | Apparatus for analyzing particles in urine and method thereof |
| JP2010003211A (en) | 2008-06-23 | 2010-01-07 | Lsmpartners Co Ltd | Method and system for imparting working result point |
| JP2010003215A (en) | 2008-06-23 | 2010-01-07 | Fuji Xerox Co Ltd | Image processing system, image processor, and program |
Family Cites Families (15)
| Publication number | Priority date | Publication date | Assignee | Title |
|---|---|---|---|---|
| JPH0534263A (en) | 1991-07-26 | 1993-02-09 | Omron Corp | Cell analyzer |
| TW438973B (en) | 1995-12-19 | 2001-06-07 | Sysmex Corp | Apparatus and method for analyzing solid components in urine |
| JP4477173B2 (en) | 1998-09-30 | 2010-06-09 | シスメックス株式会社 | Microorganism measuring method and apparatus |
| JP3888876B2 (en) | 2000-11-01 | 2007-03-07 | シスメックス株式会社 | Bacterial staining method, bacterial classification / counting method, and dilution solution for bacterial staining |
| JP4474135B2 (en) | 2002-09-10 | 2010-06-02 | シスメックス株式会社 | Method and apparatus for measuring reticulocyte |
| JP4448673B2 (en) * | 2003-08-22 | 2010-04-14 | シスメックス株式会社 | Bacteria analyzer and method |
| JP4509526B2 (en) * | 2003-10-10 | 2010-07-21 | シスメックス株式会社 | Bacteria analyzer and method |
| JP4746285B2 (en) | 2004-06-30 | 2011-08-10 | シスメックス株式会社 | Hematology analyzer, analysis program, fractionation area setting method |
| JP4964446B2 (en) | 2005-09-14 | 2012-06-27 | シスメックス株式会社 | Analytical apparatus and sample information processing program |
| JP4918281B2 (en) | 2006-05-18 | 2012-04-18 | シスメックス株式会社 | Urine component analyzer |
| JP4759438B2 (en) * | 2006-05-17 | 2011-08-31 | シスメックス株式会社 | Urine component analyzer |
| CN101245368A (en) * | 2008-03-20 | 2008-08-20 | 重庆师范大学 | Classification of myxospores using scattered light and autofluorescence parameters in flow cytometry |
| JP5511149B2 (en) * | 2008-03-28 | 2014-06-04 | シスメックス株式会社 | Biological sample analyzer and biological sample analyzing method |
| JP5399647B2 (en) * | 2008-03-28 | 2014-01-29 | シスメックス株式会社 | Sample analyzer and computer program |
| JP5127606B2 (en) * | 2008-07-08 | 2013-01-23 | シスメックス株式会社 | Bacteria analyzer |
-
2011
- 2011-01-05 EP EP11150180.5A patent/EP2348301B1/en not_active Not-in-force
- 2011-01-06 CN CN201110001625.6A patent/CN102121892B/en not_active Expired - Fee Related
- 2011-01-07 US US12/986,887 patent/US9086402B2/en active Active
Patent Citations (5)
| Publication number | Priority date | Publication date | Assignee | Title |
|---|---|---|---|---|
| EP0949498A2 (en) * | 1998-04-08 | 1999-10-13 | Sysmex Corporation | Apparatus and method for differentiating erythrocytes in urine |
| US20040219627A1 (en) | 2003-04-10 | 2004-11-04 | Sysmex Corporation. | Methods for measuring bacteria, bacteria measuring apparatuses, and storage media for storing computer-executable programs for analyzing bacteria |
| EP1857805A2 (en) * | 2006-05-17 | 2007-11-21 | Sysmex Corporation | Apparatus for analyzing particles in urine and method thereof |
| JP2010003211A (en) | 2008-06-23 | 2010-01-07 | Lsmpartners Co Ltd | Method and system for imparting working result point |
| JP2010003215A (en) | 2008-06-23 | 2010-01-07 | Fuji Xerox Co Ltd | Image processing system, image processor, and program |
Cited By (7)
| Publication number | Priority date | Publication date | Assignee | Title |
|---|---|---|---|---|
| US10458896B2 (en) | 2013-05-28 | 2019-10-29 | Chemometec A/S | Image forming cytometer |
| US10921234B2 (en) | 2013-05-28 | 2021-02-16 | Chemometec A/S | Image forming cytometer |
| EP2811032A1 (en) * | 2013-06-03 | 2014-12-10 | Sysmex Corporation | Bacteria analyzing method and specimen analyzer |
| US11053530B2 (en) | 2013-06-03 | 2021-07-06 | Sysmex Corporation | Bacteria analyzing method and specimen analyzer |
| WO2017189632A1 (en) * | 2016-04-25 | 2017-11-02 | Aperture Bio, LLC | Systems, devices and methods for sequential analysis of complex matrix samples for high confidence bacterial detection and drug susceptibility prediction using a flow cytometer |
| US20200249144A1 (en) * | 2019-01-31 | 2020-08-06 | Aperture Bio, LLC | Methods And Systems For Increasing The Capacity Of Flow Cytometer Bacteria Detection And Antibiotic Susceptibility Testing Systems |
| US11579069B2 (en) * | 2019-01-31 | 2023-02-14 | Renascent Diagnostics, Llc | Methods and systems for increasing the capacity of flow cytometer bacteria detection and antibiotic susceptibility testing systems |
Also Published As
| Publication number | Publication date |
|---|---|
| EP2348301B1 (en) | 2013-08-21 |
| US9086402B2 (en) | 2015-07-21 |
| CN102121892A (en) | 2011-07-13 |
| US20110169837A1 (en) | 2011-07-14 |
| CN102121892B (en) | 2014-05-28 |
Similar Documents
| Publication | Publication Date | Title |
|---|---|---|
| EP2348301B1 (en) | Sample analyzer | |
| US9733186B2 (en) | Cell analysis apparatus and cell analysis method | |
| US20230055601A1 (en) | Urine analysis system, image capturing apparatus, urine analysis method | |
| EP2045595B1 (en) | Cell analyser and cell analysing method | |
| JP5670052B2 (en) | Blood analyzer, blood analysis method and computer program | |
| US8189177B2 (en) | Sample preparation apparatus and sample preparation method, and cell analyzer and cell analysis method | |
| US8808623B2 (en) | Diagnosis assisting system, diagnosis assisting information providing device and computer program product | |
| CN101403739B (en) | Cell analyzer and cell analyzing method | |
| US20100079762A1 (en) | Sample analyzer, and a method for analyzing a sample | |
| US11280720B2 (en) | Cell analysis method, cell analyzer and sample screening method | |
| US10208352B2 (en) | Providing cervical or oral mucosa canceration information from measurement of cells located toward the basal membrane side of epithelial tissue | |
| US9719123B2 (en) | Urine sample analyzer and urine sample analyzing method | |
| US20100047856A1 (en) | Bacteria analyzer, bacteria analyzing method and computer program product | |
| US10073080B2 (en) | Sample analyzing apparatus, disease monitoring system, and method for managing multiple disease determination data in a sample analyzing apparatus | |
| US9784729B2 (en) | Canceration information providing method and canceration information providing device | |
| EP2843409B1 (en) | Urine sample analyzing method and sample analyzer | |
| US9541542B2 (en) | Method of detecting filarial larvae in blood | |
| US9945783B2 (en) | Cervical cancer information providing method and device | |
| JP5530723B2 (en) | Sample analyzer and sample analysis method | |
| CN115398209B (en) | Cell analysis method, cell analyzer, and computer-readable storage medium | |
| JP5685378B2 (en) | Sample analyzer and sample analysis method |
Legal Events
| Date | Code | Title | Description |
|---|---|---|---|
| PUAI | Public reference made under article 153(3) epc to a published international application that has entered the european phase |
Free format text: ORIGINAL CODE: 0009012 |
|
| AK | Designated contracting states |
Kind code of ref document: A1 Designated state(s): AL AT BE BG CH CY CZ DE DK EE ES FI FR GB GR HR HU IE IS IT LI LT LU LV MC MK MT NL NO PL PT RO RS SE SI SK SM TR |
|
| AX | Request for extension of the european patent |
Extension state: BA ME |
|
| 17P | Request for examination filed |
Effective date: 20120103 |
|
| 17Q | First examination report despatched |
Effective date: 20120220 |
|
| GRAP | Despatch of communication of intention to grant a patent |
Free format text: ORIGINAL CODE: EPIDOSNIGR1 |
|
| RIN1 | Information on inventor provided before grant (corrected) |
Inventor name: TANAKA, YOUSUKE Inventor name: INOUE, JUNYA Inventor name: NARISADA, NORIYUKI Inventor name: TAKATA, RUMI |
|
| GRAS | Grant fee paid |
Free format text: ORIGINAL CODE: EPIDOSNIGR3 |
|
| GRAA | (expected) grant |
Free format text: ORIGINAL CODE: 0009210 |
|
| AK | Designated contracting states |
Kind code of ref document: B1 Designated state(s): AL AT BE BG CH CY CZ DE DK EE ES FI FR GB GR HR HU IE IS IT LI LT LU LV MC MK MT NL NO PL PT RO RS SE SI SK SM TR |
|
| REG | Reference to a national code |
Ref country code: GB Ref legal event code: FG4D |
|
| REG | Reference to a national code |
Ref country code: CH Ref legal event code: EP |
|
| REG | Reference to a national code |
Ref country code: AT Ref legal event code: REF Ref document number: 628363 Country of ref document: AT Kind code of ref document: T Effective date: 20130915 |
|
| REG | Reference to a national code |
Ref country code: IE Ref legal event code: FG4D |
|
| REG | Reference to a national code |
Ref country code: DE Ref legal event code: R096 Ref document number: 602011002634 Country of ref document: DE Effective date: 20131024 |
|
| REG | Reference to a national code |
Ref country code: NL Ref legal event code: VDEP Effective date: 20130821 Ref country code: AT Ref legal event code: MK05 Ref document number: 628363 Country of ref document: AT Kind code of ref document: T Effective date: 20130821 |
|
| REG | Reference to a national code |
Ref country code: LT Ref legal event code: MG4D |
|
| PG25 | Lapsed in a contracting state [announced via postgrant information from national office to epo] |
Ref country code: CY Free format text: LAPSE BECAUSE OF FAILURE TO SUBMIT A TRANSLATION OF THE DESCRIPTION OR TO PAY THE FEE WITHIN THE PRESCRIBED TIME-LIMIT Effective date: 20130626 Ref country code: IS Free format text: LAPSE BECAUSE OF FAILURE TO SUBMIT A TRANSLATION OF THE DESCRIPTION OR TO PAY THE FEE WITHIN THE PRESCRIBED TIME-LIMIT Effective date: 20131221 Ref country code: PT Free format text: LAPSE BECAUSE OF FAILURE TO SUBMIT A TRANSLATION OF THE DESCRIPTION OR TO PAY THE FEE WITHIN THE PRESCRIBED TIME-LIMIT Effective date: 20131223 Ref country code: LT Free format text: LAPSE BECAUSE OF FAILURE TO SUBMIT A TRANSLATION OF THE DESCRIPTION OR TO PAY THE FEE WITHIN THE PRESCRIBED TIME-LIMIT Effective date: 20130821 Ref country code: SE Free format text: LAPSE BECAUSE OF FAILURE TO SUBMIT A TRANSLATION OF THE DESCRIPTION OR TO PAY THE FEE WITHIN THE PRESCRIBED TIME-LIMIT Effective date: 20130821 Ref country code: HR Free format text: LAPSE BECAUSE OF FAILURE TO SUBMIT A TRANSLATION OF THE DESCRIPTION OR TO PAY THE FEE WITHIN THE PRESCRIBED TIME-LIMIT Effective date: 20130821 Ref country code: AT Free format text: LAPSE BECAUSE OF FAILURE TO SUBMIT A TRANSLATION OF THE DESCRIPTION OR TO PAY THE FEE WITHIN THE PRESCRIBED TIME-LIMIT Effective date: 20130821 Ref country code: NO Free format text: LAPSE BECAUSE OF FAILURE TO SUBMIT A TRANSLATION OF THE DESCRIPTION OR TO PAY THE FEE WITHIN THE PRESCRIBED TIME-LIMIT Effective date: 20131121 |
|
| PG25 | Lapsed in a contracting state [announced via postgrant information from national office to epo] |
Ref country code: LV Free format text: LAPSE BECAUSE OF FAILURE TO SUBMIT A TRANSLATION OF THE DESCRIPTION OR TO PAY THE FEE WITHIN THE PRESCRIBED TIME-LIMIT Effective date: 20130821 Ref country code: BE Free format text: LAPSE BECAUSE OF FAILURE TO SUBMIT A TRANSLATION OF THE DESCRIPTION OR TO PAY THE FEE WITHIN THE PRESCRIBED TIME-LIMIT Effective date: 20130821 Ref country code: SI Free format text: LAPSE BECAUSE OF FAILURE TO SUBMIT A TRANSLATION OF THE DESCRIPTION OR TO PAY THE FEE WITHIN THE PRESCRIBED TIME-LIMIT Effective date: 20130821 Ref country code: GR Free format text: LAPSE BECAUSE OF FAILURE TO SUBMIT A TRANSLATION OF THE DESCRIPTION OR TO PAY THE FEE WITHIN THE PRESCRIBED TIME-LIMIT Effective date: 20131122 Ref country code: PL Free format text: LAPSE BECAUSE OF FAILURE TO SUBMIT A TRANSLATION OF THE DESCRIPTION OR TO PAY THE FEE WITHIN THE PRESCRIBED TIME-LIMIT Effective date: 20130821 Ref country code: FI Free format text: LAPSE BECAUSE OF FAILURE TO SUBMIT A TRANSLATION OF THE DESCRIPTION OR TO PAY THE FEE WITHIN THE PRESCRIBED TIME-LIMIT Effective date: 20130821 |
|
| PG25 | Lapsed in a contracting state [announced via postgrant information from national office to epo] |
Ref country code: CY Free format text: LAPSE BECAUSE OF FAILURE TO SUBMIT A TRANSLATION OF THE DESCRIPTION OR TO PAY THE FEE WITHIN THE PRESCRIBED TIME-LIMIT Effective date: 20130821 |
|
| PG25 | Lapsed in a contracting state [announced via postgrant information from national office to epo] |
Ref country code: SK Free format text: LAPSE BECAUSE OF FAILURE TO SUBMIT A TRANSLATION OF THE DESCRIPTION OR TO PAY THE FEE WITHIN THE PRESCRIBED TIME-LIMIT Effective date: 20130821 Ref country code: EE Free format text: LAPSE BECAUSE OF FAILURE TO SUBMIT A TRANSLATION OF THE DESCRIPTION OR TO PAY THE FEE WITHIN THE PRESCRIBED TIME-LIMIT Effective date: 20130821 Ref country code: NL Free format text: LAPSE BECAUSE OF FAILURE TO SUBMIT A TRANSLATION OF THE DESCRIPTION OR TO PAY THE FEE WITHIN THE PRESCRIBED TIME-LIMIT Effective date: 20130821 Ref country code: RO Free format text: LAPSE BECAUSE OF FAILURE TO SUBMIT A TRANSLATION OF THE DESCRIPTION OR TO PAY THE FEE WITHIN THE PRESCRIBED TIME-LIMIT Effective date: 20130821 Ref country code: DK Free format text: LAPSE BECAUSE OF FAILURE TO SUBMIT A TRANSLATION OF THE DESCRIPTION OR TO PAY THE FEE WITHIN THE PRESCRIBED TIME-LIMIT Effective date: 20130821 Ref country code: CZ Free format text: LAPSE BECAUSE OF FAILURE TO SUBMIT A TRANSLATION OF THE DESCRIPTION OR TO PAY THE FEE WITHIN THE PRESCRIBED TIME-LIMIT Effective date: 20130821 |
|
| PG25 | Lapsed in a contracting state [announced via postgrant information from national office to epo] |
Ref country code: ES Free format text: LAPSE BECAUSE OF FAILURE TO SUBMIT A TRANSLATION OF THE DESCRIPTION OR TO PAY THE FEE WITHIN THE PRESCRIBED TIME-LIMIT Effective date: 20130821 |
|
| PLBE | No opposition filed within time limit |
Free format text: ORIGINAL CODE: 0009261 |
|
| STAA | Information on the status of an ep patent application or granted ep patent |
Free format text: STATUS: NO OPPOSITION FILED WITHIN TIME LIMIT |
|
| 26N | No opposition filed |
Effective date: 20140522 |
|
| PG25 | Lapsed in a contracting state [announced via postgrant information from national office to epo] |
Ref country code: LU Free format text: LAPSE BECAUSE OF FAILURE TO SUBMIT A TRANSLATION OF THE DESCRIPTION OR TO PAY THE FEE WITHIN THE PRESCRIBED TIME-LIMIT Effective date: 20140105 |
|
| REG | Reference to a national code |
Ref country code: CH Ref legal event code: PL |
|
| REG | Reference to a national code |
Ref country code: DE Ref legal event code: R097 Ref document number: 602011002634 Country of ref document: DE Effective date: 20140522 |
|
| PG25 | Lapsed in a contracting state [announced via postgrant information from national office to epo] |
Ref country code: LI Free format text: LAPSE BECAUSE OF NON-PAYMENT OF DUE FEES Effective date: 20140131 Ref country code: CH Free format text: LAPSE BECAUSE OF NON-PAYMENT OF DUE FEES Effective date: 20140131 |
|
| REG | Reference to a national code |
Ref country code: IE Ref legal event code: MM4A |
|
| PG25 | Lapsed in a contracting state [announced via postgrant information from national office to epo] |
Ref country code: IE Free format text: LAPSE BECAUSE OF NON-PAYMENT OF DUE FEES Effective date: 20140105 |
|
| PG25 | Lapsed in a contracting state [announced via postgrant information from national office to epo] |
Ref country code: MC Free format text: LAPSE BECAUSE OF FAILURE TO SUBMIT A TRANSLATION OF THE DESCRIPTION OR TO PAY THE FEE WITHIN THE PRESCRIBED TIME-LIMIT Effective date: 20130821 |
|
| REG | Reference to a national code |
Ref country code: FR Ref legal event code: PLFP Year of fee payment: 6 |
|
| PG25 | Lapsed in a contracting state [announced via postgrant information from national office to epo] |
Ref country code: MT Free format text: LAPSE BECAUSE OF FAILURE TO SUBMIT A TRANSLATION OF THE DESCRIPTION OR TO PAY THE FEE WITHIN THE PRESCRIBED TIME-LIMIT Effective date: 20130821 |
|
| PG25 | Lapsed in a contracting state [announced via postgrant information from national office to epo] |
Ref country code: SM Free format text: LAPSE BECAUSE OF FAILURE TO SUBMIT A TRANSLATION OF THE DESCRIPTION OR TO PAY THE FEE WITHIN THE PRESCRIBED TIME-LIMIT Effective date: 20130821 |
|
| PG25 | Lapsed in a contracting state [announced via postgrant information from national office to epo] |
Ref country code: RS Free format text: LAPSE BECAUSE OF FAILURE TO SUBMIT A TRANSLATION OF THE DESCRIPTION OR TO PAY THE FEE WITHIN THE PRESCRIBED TIME-LIMIT Effective date: 20130821 Ref country code: BG Free format text: LAPSE BECAUSE OF FAILURE TO SUBMIT A TRANSLATION OF THE DESCRIPTION OR TO PAY THE FEE WITHIN THE PRESCRIBED TIME-LIMIT Effective date: 20130821 |
|
| PG25 | Lapsed in a contracting state [announced via postgrant information from national office to epo] |
Ref country code: HU Free format text: LAPSE BECAUSE OF FAILURE TO SUBMIT A TRANSLATION OF THE DESCRIPTION OR TO PAY THE FEE WITHIN THE PRESCRIBED TIME-LIMIT; INVALID AB INITIO Effective date: 20110105 Ref country code: TR Free format text: LAPSE BECAUSE OF FAILURE TO SUBMIT A TRANSLATION OF THE DESCRIPTION OR TO PAY THE FEE WITHIN THE PRESCRIBED TIME-LIMIT Effective date: 20130821 |
|
| REG | Reference to a national code |
Ref country code: FR Ref legal event code: PLFP Year of fee payment: 7 |
|
| REG | Reference to a national code |
Ref country code: FR Ref legal event code: PLFP Year of fee payment: 8 |
|
| PG25 | Lapsed in a contracting state [announced via postgrant information from national office to epo] |
Ref country code: MK Free format text: LAPSE BECAUSE OF FAILURE TO SUBMIT A TRANSLATION OF THE DESCRIPTION OR TO PAY THE FEE WITHIN THE PRESCRIBED TIME-LIMIT Effective date: 20130821 |
|
| PG25 | Lapsed in a contracting state [announced via postgrant information from national office to epo] |
Ref country code: AL Free format text: LAPSE BECAUSE OF FAILURE TO SUBMIT A TRANSLATION OF THE DESCRIPTION OR TO PAY THE FEE WITHIN THE PRESCRIBED TIME-LIMIT Effective date: 20130821 |
|
| PGFP | Annual fee paid to national office [announced via postgrant information from national office to epo] |
Ref country code: FR Payment date: 20211217 Year of fee payment: 12 Ref country code: GB Payment date: 20211206 Year of fee payment: 12 |
|
| PGFP | Annual fee paid to national office [announced via postgrant information from national office to epo] |
Ref country code: IT Payment date: 20211213 Year of fee payment: 12 |
|
| PGFP | Annual fee paid to national office [announced via postgrant information from national office to epo] |
Ref country code: DE Payment date: 20221130 Year of fee payment: 13 |
|
| GBPC | Gb: european patent ceased through non-payment of renewal fee |
Effective date: 20230105 |
|
| PG25 | Lapsed in a contracting state [announced via postgrant information from national office to epo] |
Ref country code: GB Free format text: LAPSE BECAUSE OF NON-PAYMENT OF DUE FEES Effective date: 20230105 |
|
| PG25 | Lapsed in a contracting state [announced via postgrant information from national office to epo] |
Ref country code: FR Free format text: LAPSE BECAUSE OF NON-PAYMENT OF DUE FEES Effective date: 20230131 |
|
| PG25 | Lapsed in a contracting state [announced via postgrant information from national office to epo] |
Ref country code: IT Free format text: LAPSE BECAUSE OF NON-PAYMENT OF DUE FEES Effective date: 20230105 |
|
| REG | Reference to a national code |
Ref country code: DE Ref legal event code: R119 Ref document number: 602011002634 Country of ref document: DE |
|
| PG25 | Lapsed in a contracting state [announced via postgrant information from national office to epo] |
Ref country code: DE Free format text: LAPSE BECAUSE OF NON-PAYMENT OF DUE FEES Effective date: 20240801 |
|
| PG25 | Lapsed in a contracting state [announced via postgrant information from national office to epo] |
Ref country code: DE Free format text: LAPSE BECAUSE OF NON-PAYMENT OF DUE FEES Effective date: 20240801 |