EP2344890B1 - Lipoprotein insulin resistance indexes and related methods - Google Patents
Lipoprotein insulin resistance indexes and related methods Download PDFInfo
- Publication number
- EP2344890B1 EP2344890B1 EP09822305.0A EP09822305A EP2344890B1 EP 2344890 B1 EP2344890 B1 EP 2344890B1 EP 09822305 A EP09822305 A EP 09822305A EP 2344890 B1 EP2344890 B1 EP 2344890B1
- Authority
- EP
- European Patent Office
- Prior art keywords
- insulin resistance
- lipoprotein
- index
- risk
- insulin
- Prior art date
- Legal status (The legal status is an assumption and is not a legal conclusion. Google has not performed a legal analysis and makes no representation as to the accuracy of the status listed.)
- Active
Links
- 208000001072 type 2 diabetes mellitus Diseases 0.000 title claims description 207
- 206010022489 Insulin Resistance Diseases 0.000 title claims description 193
- 102000004895 Lipoproteins Human genes 0.000 title claims description 173
- 108090001030 Lipoproteins Proteins 0.000 title claims description 173
- 238000000034 method Methods 0.000 title claims description 45
- 239000002245 particle Substances 0.000 claims description 85
- 238000005259 measurement Methods 0.000 claims description 67
- 210000002381 plasma Anatomy 0.000 claims description 45
- 206010012601 diabetes mellitus Diseases 0.000 claims description 37
- 210000002966 serum Anatomy 0.000 claims description 25
- 235000020925 non fasting Nutrition 0.000 claims description 20
- 238000000338 in vitro Methods 0.000 claims description 6
- 230000008859 change Effects 0.000 claims description 4
- WQZGKKKJIJFFOK-GASJEMHNSA-N Glucose Natural products OC[C@H]1OC(O)[C@H](O)[C@@H](O)[C@@H]1O WQZGKKKJIJFFOK-GASJEMHNSA-N 0.000 description 72
- 239000008103 glucose Substances 0.000 description 72
- NOESYZHRGYRDHS-UHFFFAOYSA-N insulin Chemical compound N1C(=O)C(NC(=O)C(CCC(N)=O)NC(=O)C(CCC(O)=O)NC(=O)C(C(C)C)NC(=O)C(NC(=O)CN)C(C)CC)CSSCC(C(NC(CO)C(=O)NC(CC(C)C)C(=O)NC(CC=2C=CC(O)=CC=2)C(=O)NC(CCC(N)=O)C(=O)NC(CC(C)C)C(=O)NC(CCC(O)=O)C(=O)NC(CC(N)=O)C(=O)NC(CC=2C=CC(O)=CC=2)C(=O)NC(CSSCC(NC(=O)C(C(C)C)NC(=O)C(CC(C)C)NC(=O)C(CC=2C=CC(O)=CC=2)NC(=O)C(CC(C)C)NC(=O)C(C)NC(=O)C(CCC(O)=O)NC(=O)C(C(C)C)NC(=O)C(CC(C)C)NC(=O)C(CC=2NC=NC=2)NC(=O)C(CO)NC(=O)CNC2=O)C(=O)NCC(=O)NC(CCC(O)=O)C(=O)NC(CCCNC(N)=N)C(=O)NCC(=O)NC(CC=3C=CC=CC=3)C(=O)NC(CC=3C=CC=CC=3)C(=O)NC(CC=3C=CC(O)=CC=3)C(=O)NC(C(C)O)C(=O)N3C(CCC3)C(=O)NC(CCCCN)C(=O)NC(C)C(O)=O)C(=O)NC(CC(N)=O)C(O)=O)=O)NC(=O)C(C(C)CC)NC(=O)C(CO)NC(=O)C(C(C)O)NC(=O)C1CSSCC2NC(=O)C(CC(C)C)NC(=O)C(NC(=O)C(CCC(N)=O)NC(=O)C(CC(N)=O)NC(=O)C(NC(=O)C(N)CC=1C=CC=CC=1)C(C)C)CC1=CN=CN1 NOESYZHRGYRDHS-UHFFFAOYSA-N 0.000 description 72
- 238000005481 NMR spectroscopy Methods 0.000 description 70
- 239000000523 sample Substances 0.000 description 67
- 210000004369 blood Anatomy 0.000 description 43
- 239000008280 blood Substances 0.000 description 43
- 108010010234 HDL Lipoproteins Proteins 0.000 description 41
- 102000015779 HDL Lipoproteins Human genes 0.000 description 41
- 108010007622 LDL Lipoproteins Proteins 0.000 description 41
- 102000007330 LDL Lipoproteins Human genes 0.000 description 41
- 238000001228 spectrum Methods 0.000 description 38
- 102000004877 Insulin Human genes 0.000 description 36
- 108090001061 Insulin Proteins 0.000 description 36
- 229940125396 insulin Drugs 0.000 description 36
- 238000012360 testing method Methods 0.000 description 35
- 108010062497 VLDL Lipoproteins Proteins 0.000 description 32
- 238000004458 analytical method Methods 0.000 description 24
- 238000004364 calculation method Methods 0.000 description 13
- 239000002131 composite material Substances 0.000 description 13
- 239000000470 constituent Substances 0.000 description 13
- 208000037265 diseases, disorders, signs and symptoms Diseases 0.000 description 13
- 230000006870 function Effects 0.000 description 13
- 239000003550 marker Substances 0.000 description 12
- 238000012545 processing Methods 0.000 description 12
- 150000002632 lipids Chemical class 0.000 description 11
- HVYWMOMLDIMFJA-DPAQBDIFSA-N cholesterol Chemical compound C1C=C2C[C@@H](O)CC[C@]2(C)[C@@H]2[C@@H]1[C@@H]1CC[C@H]([C@H](C)CCCC(C)C)[C@@]1(C)CC2 HVYWMOMLDIMFJA-DPAQBDIFSA-N 0.000 description 10
- 229940079593 drug Drugs 0.000 description 10
- 239000003814 drug Substances 0.000 description 10
- 206010018429 Glucose tolerance impaired Diseases 0.000 description 9
- 208000035475 disorder Diseases 0.000 description 9
- 201000009104 prediabetes syndrome Diseases 0.000 description 9
- 201000001421 hyperglycemia Diseases 0.000 description 8
- 230000008569 process Effects 0.000 description 8
- 208000001280 Prediabetic State Diseases 0.000 description 7
- 230000005856 abnormality Effects 0.000 description 7
- 230000000875 corresponding effect Effects 0.000 description 7
- 238000010183 spectrum analysis Methods 0.000 description 7
- 239000000126 substance Substances 0.000 description 7
- 230000003247 decreasing effect Effects 0.000 description 6
- 238000009826 distribution Methods 0.000 description 6
- 230000001610 euglycemic effect Effects 0.000 description 6
- 238000000655 nuclear magnetic resonance spectrum Methods 0.000 description 6
- 238000000425 proton nuclear magnetic resonance spectrum Methods 0.000 description 6
- 238000003860 storage Methods 0.000 description 6
- 150000003626 triacylglycerols Chemical class 0.000 description 6
- 208000024172 Cardiovascular disease Diseases 0.000 description 5
- 108010046315 IDL Lipoproteins Proteins 0.000 description 5
- 241001465754 Metazoa Species 0.000 description 5
- 235000012000 cholesterol Nutrition 0.000 description 5
- 238000004590 computer program Methods 0.000 description 5
- 230000002596 correlated effect Effects 0.000 description 5
- 238000011161 development Methods 0.000 description 5
- 108010023302 HDL Cholesterol Proteins 0.000 description 4
- 210000000227 basophil cell of anterior lobe of hypophysis Anatomy 0.000 description 4
- 201000010099 disease Diseases 0.000 description 4
- 238000011156 evaluation Methods 0.000 description 4
- 238000007446 glucose tolerance test Methods 0.000 description 4
- 125000002791 glucosyl group Chemical group C1([C@H](O)[C@@H](O)[C@H](O)[C@H](O1)CO)* 0.000 description 4
- PCHJSUWPFVWCPO-UHFFFAOYSA-N gold Chemical compound [Au] PCHJSUWPFVWCPO-UHFFFAOYSA-N 0.000 description 4
- 238000002483 medication Methods 0.000 description 4
- 230000004066 metabolic change Effects 0.000 description 4
- 230000004048 modification Effects 0.000 description 4
- 238000012986 modification Methods 0.000 description 4
- 238000011160 research Methods 0.000 description 4
- UFTFJSFQGQCHQW-UHFFFAOYSA-N triformin Chemical compound O=COCC(OC=O)COC=O UFTFJSFQGQCHQW-UHFFFAOYSA-N 0.000 description 4
- 201000001320 Atherosclerosis Diseases 0.000 description 3
- 229940121710 HMGCoA reductase inhibitor Drugs 0.000 description 3
- 238000013500 data storage Methods 0.000 description 3
- 238000001514 detection method Methods 0.000 description 3
- 238000010586 diagram Methods 0.000 description 3
- 239000002471 hydroxymethylglutaryl coenzyme A reductase inhibitor Substances 0.000 description 3
- 238000001990 intravenous administration Methods 0.000 description 3
- 230000004060 metabolic process Effects 0.000 description 3
- 230000000750 progressive effect Effects 0.000 description 3
- 108010002139 very low density lipoprotein triglyceride Proteins 0.000 description 3
- 206010070901 Diabetic dyslipidaemia Diseases 0.000 description 2
- 208000032928 Dyslipidaemia Diseases 0.000 description 2
- KCXVZYZYPLLWCC-UHFFFAOYSA-N EDTA Chemical compound OC(=O)CN(CC(O)=O)CCN(CC(O)=O)CC(O)=O KCXVZYZYPLLWCC-UHFFFAOYSA-N 0.000 description 2
- 208000002705 Glucose Intolerance Diseases 0.000 description 2
- 208000031226 Hyperlipidaemia Diseases 0.000 description 2
- 208000017170 Lipid metabolism disease Diseases 0.000 description 2
- 206010067584 Type 1 diabetes mellitus Diseases 0.000 description 2
- 230000004075 alteration Effects 0.000 description 2
- 238000010171 animal model Methods 0.000 description 2
- WQZGKKKJIJFFOK-VFUOTHLCSA-N beta-D-glucose Chemical compound OC[C@H]1O[C@@H](O)[C@H](O)[C@@H](O)[C@@H]1O WQZGKKKJIJFFOK-VFUOTHLCSA-N 0.000 description 2
- 210000004027 cell Anatomy 0.000 description 2
- 210000001175 cerebrospinal fluid Anatomy 0.000 description 2
- 238000004891 communication Methods 0.000 description 2
- 230000002950 deficient Effects 0.000 description 2
- 235000005911 diet Nutrition 0.000 description 2
- 230000037213 diet Effects 0.000 description 2
- 238000002651 drug therapy Methods 0.000 description 2
- 230000000694 effects Effects 0.000 description 2
- 230000005284 excitation Effects 0.000 description 2
- 239000003925 fat Substances 0.000 description 2
- 230000002068 genetic effect Effects 0.000 description 2
- 208000004104 gestational diabetes Diseases 0.000 description 2
- 150000002303 glucose derivatives Chemical class 0.000 description 2
- 230000013632 homeostatic process Effects 0.000 description 2
- 238000012417 linear regression Methods 0.000 description 2
- 230000008604 lipoprotein metabolism Effects 0.000 description 2
- 210000002751 lymph Anatomy 0.000 description 2
- 230000006371 metabolic abnormality Effects 0.000 description 2
- 230000002503 metabolic effect Effects 0.000 description 2
- 230000007935 neutral effect Effects 0.000 description 2
- 239000013610 patient sample Substances 0.000 description 2
- 230000002265 prevention Effects 0.000 description 2
- 102000004169 proteins and genes Human genes 0.000 description 2
- 108090000623 proteins and genes Proteins 0.000 description 2
- 238000003127 radioimmunoassay Methods 0.000 description 2
- 230000009467 reduction Effects 0.000 description 2
- 230000002829 reductive effect Effects 0.000 description 2
- 238000012502 risk assessment Methods 0.000 description 2
- 238000012216 screening Methods 0.000 description 2
- 208000024891 symptom Diseases 0.000 description 2
- 210000001519 tissue Anatomy 0.000 description 2
- 230000000007 visual effect Effects 0.000 description 2
- 230000003820 β-cell dysfunction Effects 0.000 description 2
- 238000005160 1H NMR spectroscopy Methods 0.000 description 1
- 241001502050 Acis Species 0.000 description 1
- 206010003210 Arteriosclerosis Diseases 0.000 description 1
- 210000002237 B-cell of pancreatic islet Anatomy 0.000 description 1
- 241000283690 Bos taurus Species 0.000 description 1
- 241000282465 Canis Species 0.000 description 1
- 241000700198 Cavia Species 0.000 description 1
- 241000282693 Cercopithecidae Species 0.000 description 1
- 208000017667 Chronic Disease Diseases 0.000 description 1
- 108010004103 Chylomicrons Proteins 0.000 description 1
- 241000699800 Cricetinae Species 0.000 description 1
- 241000283073 Equus caballus Species 0.000 description 1
- 241000282324 Felis Species 0.000 description 1
- 102000001554 Hemoglobins Human genes 0.000 description 1
- 108010054147 Hemoglobins Proteins 0.000 description 1
- 241000282412 Homo Species 0.000 description 1
- 101000976075 Homo sapiens Insulin Proteins 0.000 description 1
- 101000603223 Homo sapiens Nischarin Proteins 0.000 description 1
- 206010020772 Hypertension Diseases 0.000 description 1
- 206010056997 Impaired fasting glucose Diseases 0.000 description 1
- 208000031773 Insulin resistance syndrome Diseases 0.000 description 1
- 241000283953 Lagomorpha Species 0.000 description 1
- 241000699670 Mus sp. Species 0.000 description 1
- 102100038995 Nischarin Human genes 0.000 description 1
- 241000288906 Primates Species 0.000 description 1
- 108010076181 Proinsulin Proteins 0.000 description 1
- 241000700159 Rattus Species 0.000 description 1
- 241000283984 Rodentia Species 0.000 description 1
- 208000006011 Stroke Diseases 0.000 description 1
- 230000004913 activation Effects 0.000 description 1
- 239000000654 additive Substances 0.000 description 1
- 230000000996 additive effect Effects 0.000 description 1
- 210000000577 adipose tissue Anatomy 0.000 description 1
- 238000000627 alternating current impedance spectroscopy Methods 0.000 description 1
- 208000011775 arteriosclerosis disease Diseases 0.000 description 1
- 238000003556 assay Methods 0.000 description 1
- 230000001363 autoimmune Effects 0.000 description 1
- 230000009286 beneficial effect Effects 0.000 description 1
- 230000008901 benefit Effects 0.000 description 1
- 238000009534 blood test Methods 0.000 description 1
- 210000004204 blood vessel Anatomy 0.000 description 1
- 210000001124 body fluid Anatomy 0.000 description 1
- 239000010839 body fluid Substances 0.000 description 1
- 210000000988 bone and bone Anatomy 0.000 description 1
- 150000001720 carbohydrates Chemical class 0.000 description 1
- 235000014633 carbohydrates Nutrition 0.000 description 1
- 208000037887 cell injury Diseases 0.000 description 1
- 230000001413 cellular effect Effects 0.000 description 1
- 230000000052 comparative effect Effects 0.000 description 1
- 238000010276 construction Methods 0.000 description 1
- 230000001276 controlling effect Effects 0.000 description 1
- 208000029078 coronary artery disease Diseases 0.000 description 1
- 230000009260 cross reactivity Effects 0.000 description 1
- 230000001186 cumulative effect Effects 0.000 description 1
- 230000006378 damage Effects 0.000 description 1
- 230000001419 dependent effect Effects 0.000 description 1
- 230000002542 deteriorative effect Effects 0.000 description 1
- 238000003745 diagnosis Methods 0.000 description 1
- 235000021045 dietary change Nutrition 0.000 description 1
- 238000005516 engineering process Methods 0.000 description 1
- 230000007613 environmental effect Effects 0.000 description 1
- 230000002349 favourable effect Effects 0.000 description 1
- 238000005188 flotation Methods 0.000 description 1
- 210000001035 gastrointestinal tract Anatomy 0.000 description 1
- 230000002641 glycemic effect Effects 0.000 description 1
- 230000036541 health Effects 0.000 description 1
- 208000019622 heart disease Diseases 0.000 description 1
- 230000002440 hepatic effect Effects 0.000 description 1
- 230000002209 hydrophobic effect Effects 0.000 description 1
- 230000000910 hyperinsulinemic effect Effects 0.000 description 1
- 230000002218 hypoglycaemic effect Effects 0.000 description 1
- 230000001771 impaired effect Effects 0.000 description 1
- 238000002129 infrared reflectance spectroscopy Methods 0.000 description 1
- 230000000977 initiatory effect Effects 0.000 description 1
- PBGKTOXHQIOBKM-FHFVDXKLSA-N insulin (human) Chemical compound C([C@@H](C(=O)N[C@@H](CC(C)C)C(=O)N[C@H]1CSSC[C@H]2C(=O)N[C@H](C(=O)N[C@@H](CO)C(=O)N[C@H](C(=O)N[C@H](C(N[C@@H](CO)C(=O)N[C@@H](CC(C)C)C(=O)N[C@@H](CC=3C=CC(O)=CC=3)C(=O)N[C@@H](CCC(N)=O)C(=O)N[C@@H](CC(C)C)C(=O)N[C@@H](CCC(O)=O)C(=O)N[C@@H](CC(N)=O)C(=O)N[C@@H](CC=3C=CC(O)=CC=3)C(=O)N[C@@H](CSSC[C@H](NC(=O)[C@H](C(C)C)NC(=O)[C@H](CC(C)C)NC(=O)[C@H](CC=3C=CC(O)=CC=3)NC(=O)[C@H](CC(C)C)NC(=O)[C@H](C)NC(=O)[C@H](CCC(O)=O)NC(=O)[C@H](C(C)C)NC(=O)[C@H](CC(C)C)NC(=O)[C@H](CC=3NC=NC=3)NC(=O)[C@H](CO)NC(=O)CNC1=O)C(=O)NCC(=O)N[C@@H](CCC(O)=O)C(=O)N[C@@H](CCCNC(N)=N)C(=O)NCC(=O)N[C@@H](CC=1C=CC=CC=1)C(=O)N[C@@H](CC=1C=CC=CC=1)C(=O)N[C@@H](CC=1C=CC(O)=CC=1)C(=O)N[C@@H]([C@@H](C)O)C(=O)N1[C@@H](CCC1)C(=O)N[C@@H](CCCCN)C(=O)N[C@@H]([C@@H](C)O)C(O)=O)C(=O)N[C@@H](CC(N)=O)C(O)=O)=O)CSSC[C@@H](C(N2)=O)NC(=O)[C@H](CCC(N)=O)NC(=O)[C@H](CCC(O)=O)NC(=O)[C@H](C(C)C)NC(=O)[C@@H](NC(=O)CN)[C@@H](C)CC)[C@@H](C)CC)[C@@H](C)O)NC(=O)[C@H](CCC(N)=O)NC(=O)[C@H](CC(N)=O)NC(=O)[C@@H](NC(=O)[C@@H](N)CC=1C=CC=CC=1)C(C)C)C1=CN=CN1 PBGKTOXHQIOBKM-FHFVDXKLSA-N 0.000 description 1
- 230000003914 insulin secretion Effects 0.000 description 1
- 230000002427 irreversible effect Effects 0.000 description 1
- 238000009533 lab test Methods 0.000 description 1
- 238000011545 laboratory measurement Methods 0.000 description 1
- 230000000670 limiting effect Effects 0.000 description 1
- 230000004132 lipogenesis Effects 0.000 description 1
- 230000004130 lipolysis Effects 0.000 description 1
- 210000004185 liver Anatomy 0.000 description 1
- 238000004519 manufacturing process Methods 0.000 description 1
- 238000000691 measurement method Methods 0.000 description 1
- 239000000203 mixture Substances 0.000 description 1
- 238000012544 monitoring process Methods 0.000 description 1
- 210000003205 muscle Anatomy 0.000 description 1
- 210000000496 pancreas Anatomy 0.000 description 1
- 230000036961 partial effect Effects 0.000 description 1
- 230000000144 pharmacologic effect Effects 0.000 description 1
- 150000003904 phospholipids Chemical class 0.000 description 1
- 230000000704 physical effect Effects 0.000 description 1
- 239000002243 precursor Substances 0.000 description 1
- 238000002360 preparation method Methods 0.000 description 1
- 230000000541 pulsatile effect Effects 0.000 description 1
- 230000004044 response Effects 0.000 description 1
- 230000002441 reversible effect Effects 0.000 description 1
- 238000009666 routine test Methods 0.000 description 1
- 230000003248 secreting effect Effects 0.000 description 1
- 230000028327 secretion Effects 0.000 description 1
- 230000035945 sensitivity Effects 0.000 description 1
- 238000000926 separation method Methods 0.000 description 1
- 230000003595 spectral effect Effects 0.000 description 1
- 230000003068 static effect Effects 0.000 description 1
- 208000011580 syndromic disease Diseases 0.000 description 1
- 230000008685 targeting Effects 0.000 description 1
- 238000012546 transfer Methods 0.000 description 1
- 230000009466 transformation Effects 0.000 description 1
- 238000000844 transformation Methods 0.000 description 1
- 230000007704 transition Effects 0.000 description 1
- 230000032258 transport Effects 0.000 description 1
- 238000005199 ultracentrifugation Methods 0.000 description 1
- 210000002700 urine Anatomy 0.000 description 1
- 230000002792 vascular Effects 0.000 description 1
- 230000004580 weight loss Effects 0.000 description 1
Images


Classifications
-
- G—PHYSICS
- G01—MEASURING; TESTING
- G01R—MEASURING ELECTRIC VARIABLES; MEASURING MAGNETIC VARIABLES
- G01R33/00—Arrangements or instruments for measuring magnetic variables
- G01R33/20—Arrangements or instruments for measuring magnetic variables involving magnetic resonance
- G01R33/44—Arrangements or instruments for measuring magnetic variables involving magnetic resonance using nuclear magnetic resonance [NMR]
- G01R33/46—NMR spectroscopy
- G01R33/465—NMR spectroscopy applied to biological material, e.g. in vitro testing
-
- Y—GENERAL TAGGING OF NEW TECHNOLOGICAL DEVELOPMENTS; GENERAL TAGGING OF CROSS-SECTIONAL TECHNOLOGIES SPANNING OVER SEVERAL SECTIONS OF THE IPC; TECHNICAL SUBJECTS COVERED BY FORMER USPC CROSS-REFERENCE ART COLLECTIONS [XRACs] AND DIGESTS
- Y10—TECHNICAL SUBJECTS COVERED BY FORMER USPC
- Y10T—TECHNICAL SUBJECTS COVERED BY FORMER US CLASSIFICATION
- Y10T436/00—Chemistry: analytical and immunological testing
- Y10T436/10—Composition for standardization, calibration, simulation, stabilization, preparation or preservation; processes of use in preparation for chemical testing
- Y10T436/104165—Lipid, cholesterol, or triglyceride standard or control
-
- Y—GENERAL TAGGING OF NEW TECHNOLOGICAL DEVELOPMENTS; GENERAL TAGGING OF CROSS-SECTIONAL TECHNOLOGIES SPANNING OVER SEVERAL SECTIONS OF THE IPC; TECHNICAL SUBJECTS COVERED BY FORMER USPC CROSS-REFERENCE ART COLLECTIONS [XRACs] AND DIGESTS
- Y10—TECHNICAL SUBJECTS COVERED BY FORMER USPC
- Y10T—TECHNICAL SUBJECTS COVERED BY FORMER US CLASSIFICATION
- Y10T436/00—Chemistry: analytical and immunological testing
- Y10T436/24—Nuclear magnetic resonance, electron spin resonance or other spin effects or mass spectrometry
Definitions
- the present invention relates to a method of predicting a non-diabetic subject's degree of insulin resistance.
- Type 2 diabetes mellitus is one of the most costly and burdensome chronic diseases, and is increasing in epidemic proportions in the U.S. and other countries.
- the defining feature of T2DM is hyperglycemia, a reflection of impaired carbohydrate (glucose) utilization resulting from a defective or deficient insulin secretory response.
- T2DM is currently defined in patients having a fasting plasma glucose level that is greater than or equal to 125 mg/dL.
- T2DM is a late manifestation of metabolic derangements that begin many years earlier. Its cause is believed to be a progressive increase in insulin resistance coupled with deteriorating ⁇ -cell function.
- pancreatic ⁇ -cells So long as the pancreatic ⁇ -cells are able to secrete enough insulin to compensate for the progressive resistance of target tissues to insulin's hypoglycemic effects, the patient is able to maintain normal fasting glucose levels. Hyperglycemia and the transition to T2DM occur as a consequence of progressive ⁇ -cell dysfunction which leads to failure to maintain hypersecretion of insulin in the face of increasing insulin resistance. These potential metabolic changes over time and the impact on glucose levels are shown schematically in Figure 1 .
- Type 2 diabetes has been traditionally diagnosed by the detection of elevated levels of glucose (sugar) in the blood (hyperglycemia). While hyperglycemia defines diabetes, it is a very late stage development in the chain of events that lead from insulin resistance to full-blown diabetes. Accordingly, it would be desirable to have a way of identifying whether or not a subject is at risk for developing Type 2 diabetes (i.e ., is predisposed to the condition) prior to the development of the classic symptoms, such as hyperglycemia. Earlier detection of indicators of the disease (e.g ., detection before glucose levels are elevated enough to be considered hyperglycemia) may lead to more effective treatment of the disease, if not actual prevention of the onset of the disease.
- the most direct and accurate methods for assessing insulin resistance are laborious and time-consuming, and thus impractical for clinical application.
- the "gold standard” among these research methods is the hyperinsulinemic euglycemic clamp, which quantifies the maximal glucose disposal rate (GDR, inversely proportional to insulin resistance) during the clamp.
- Another arduous research method which is somewhat less reproducible is the frequently sampled intravenous glucose tolerance test (IVGTT) with minimal model analysis, which measures insulin sensitivity (S i ), the inverse of insulin resistance.
- U.S. Patent No. 6,518,069 to Otvos et al describes NMR derived measurements of glucose and/or certain lipoprotein values to assess a patient's risk of developing T2DM.
- the article Lindström J. et al, "The Diabetes Risk Score - A practical tool to predict type 2 diabetes risk", Diabetes Care, volume 26, number 3, March 2003 describes a method of predicting type 2 diabetes risk by determining a diabetes risk score as the sum of individual risks related to different variables.
- the present invention relates to a method of predicting a non-diabetic subject's degree of insulin resistance, comprising: measuring a plurality of selected lipoprotein parameters from an in vitro patient biosample, wherein the biosample is a non-fasting blood plasma or serum sample, wherein the plurality of selected lipoprotein parameters includes particle concentration and size; programmatically providing a risk score for each of the selected lipoprotein parameters based on the measurement of the selected lipoprotein parameters, wherein the risk score is selected from a set of defined risk scores associated with different potential measurement values or ranges of values of each of the selected lipoprotein parameters; and programmatically generating a lipoprotein insulin resistance index by summing the risk scores of the selected lipoprotein parameters, wherein the selected lipoprotein parameters include the following: small LDL, and large HDL particle concentrations and LDL, and HDL particle sizes.
- the selected parameters can include the following: large VLDL, small LDL, and large HDL particle concentrations and VLDL, LDL, and HDL particle sizes (typically average sizes).
- the generating step may include calculating a risk score or selecting a risk score from a set of defined risk scores for each of the obtained lipoprotein parameter measurements, and summing the risk scores to generate the lipoprotein insulin resistance index with a value between 0-100, with 100 indicating a high degree of insulin resistance. Larger values of the lipoprotein insulin resistance index can be correlated to an increased risk of developing diabetes.
- the patient's sample is a non-fasting blood plasma or serum sample and the obtained measurements include at least four NMR measurements, including NMR measurements of the small LDL and large HDL particle concentrations and the (average) LDL and HDL particle sizes.
- the generating step can include calculating a risk score for each of the at least four obtained measurements, and summing the four risk scores to generate the lipoprotein insulin resistance index.
- Disclosed herein but not forming part of the invention are systems, methods and assessments for assessing a patient's level of insulin resistance and/or using same for determining whether subjects are at risk for having diabetes.
- Examples disclosed herein provide methods that can predict a non-diabetic subject's level of insulin resistance.
- the methods include: (a) obtaining measurements of a plurality of selected lipoprotein parameters from an in vitro patient biosample; and (b) programmatically generating a lipoprotein insulin resistance index based on the obtained measurements.
- the patient's sample is a fasting sample and the obtained measurements include NMR measurements of all six of the lipoprotein parameters.
- the generating step can include calculating a risk score for each of the six obtained lipoprotein parameter measurements, and summing the six risk scores to generate the lipoprotein insulin resistance index.
- test reports include a lipoprotein insulin resistance index.
- the index is a composite number of risk scores correlated to each of a plurality of NMR-measured lipoprotein particle parameters of a patient blood or plasmas sample.
- the plurality of parameters can include at least four of the following: large VLDL, small LDL, and large HDL particle concentrations and VLDL, LDL, and HDL particle sizes.
- Still other examples are directed to computer programs for assessing decreased insulin sensitivity (e.g ., insulin insensitivity) and/or insulin resistance in a non-diabetic subject.
- the computer program includes a computer readable storage medium having computer readable program code embodied in the medium.
- the computer-readable program code includes computer readable program code that determines NMR measurements of at least four of the following lipoprotein parameters: large VLDL, small LDL, and large HDL particle concentrations and VLDL, LDL, and HDL particle sizes; computer readable program code that associates a risk score for each of the at least four lipoprotein NMR measurements; and computer readable program code that uses the risk scores of each of the at least four NMR lipoprotein parameter measurements to generate a lipoprotein insulin resistance index.
- the systems include an NMR spectrometer for acquiring at least one NMR spectrum of an in vitro blood plasma or serum sample; and a processor in communication with the NMR spectrometer.
- the processor is configured to: (a) determine NMR measurements of a plurality of selected lipoprotein parameters; (b) calculate a risk score or select a risk score from a set of defined risk scores for each of the determined measurements of the selected lipoprotein parameters; and (c) sum the risk scores for each of the lipoprotein parameters to generate a lipoprotein insulin resistance index.
- the selected lipoprotein parameters can include at least four of the following lipoprotein parameters in the blood plasma or serum sample: large VLDL, small LDL, and large HDL particle concentrations and VLDL, LDL, and HDL particle sizes
- Still other examples are directed to methods of evaluating the efficacy of treatment of a subject undergoing treatment to reduce insulin sensitivity.
- the methods include: (a) obtaining a first insulin resistance score using NMR measured lipoprotein parameters for a patient's blood plasma or serum sample, including at least a plurality of the following lipoprotein parameters: large VLDL, small LDL, and large HDL particle concentrations and VLDL, LDL, and HDL particle sizes; and programmatically generating a first insulin resistance score based on the values of the obtained measurements; then (b) obtaining a second insulin resistance analysis of a patient's blood plasma or serum sample obtained after the subject has initiated lifestyle or drug treatment for decreasing insulin sensitivity using NMR measured lipoprotein parameters for a patient's blood plasma or serum sample, including at least a plurality of the following lipoprotein parameters: large VLDL, small LDL, and large HDL particle concentrations and VLDL, LDL, and HDL particle sizes, and programmatically generating a second insulin resistance score based on the values of
- Examples disclosed herein provide for easy-to-understand insulin resistance assessments for identifying subjects with decreased insulin sensitivity (e.g., insulin insensitivity or resistance) and/or subjects that are at risk for developing or having diabetes earlier than has been conventionally achieved to enable more effective T2DM prevention by targeting at-risk patients for initiation of lifestyle interventions earlier than has been conventionally achieved for most people, such as when blood glucose levels are still in the normal range and ⁇ -cell function has not yet deteriorated.
- insulin sensitivity e.g., insulin insensitivity or resistance
- Some examples described herein are directed to insulin resistance tests that can assess insulin sensitivity/resistance and provide an insulin resistance index (e.g., score) associated with a (defined) scale to assess a patient's risk of developing Type 2 diabetes.
- the tests can be generated using an automated nuclear magnetic resonance (NMR) spectrometer to measure lipoprotein particle subclasses to quantify a plurality of the following: large VLDL, small LDL, and large HDL particle concentrations and (average) VLDL, LDL, and HDL particle sizes.
- NMR nuclear magnetic resonance
- Some tests can be done using fasting or non-fasting serum and plasma samples using nuclear magnetic resonance (NMR) spectroscopy.
- Some tests can also include measuring glucose using the same patient sample.
- the lipoprotein subclass (concentrations) and size measures are associated with insulin resistance and, in aggregate, can be used as a quantitative means to assess the level of insulin sensitivity of non-diabetic patients, for the purpose of aiding, in conjunction with other laboratory measurements and clinical evaluation, assessment of their risk of developing type 2 diabetes mellitus.
- the tests can be based on measurements of a plurality of different lipoprotein subclasses measurements (e.g ., typically between about four-six different lipoprotein factors) with each factor scored for risk individually.
- a composite or cumulative (aggregate) score can be used to define a lipoprotein insulin resistance index.
- phrases such as “between X and Y” and “between about X and Y” should be interpreted to include X and Y.
- phrases such as “between about X and Y” mean “between about X and about Y.”
- phrases such as “from about X to Y” mean “from about X to about Y.”
- the term "programmatically” means the instruction, calculation, function, feature, operation and/or step is carried out using computer program directions.
- automated means that the operations can be carried out with minimal or no manual labor or input.
- semi- automated refers to allowing operators some input or activation, but the calculations, determinations and signal acquisition as well as the calculation of the concentrations and/or sizes of the lipoprotein parameters and/or insulin resistance markers are done electronically, typically programmatically, without requiring manual input.
- biosample includes whole blood, plasma, serum, urine, cerebral spinal fluid (CSF), lymph samples, stool samples, tissues, and/or body fluids in raw form and/or in preparations.
- whole blood or plasma biosamples may be particularly suitable for embodiments of the present invention.
- the biosamples can be from any target subject.
- Subjects', according to the present invention can be any animal subject, and are preferably mammalian subjects ( e.g ., humans, canines, felines, bovines, caprines, ovines, equines, rodents (mice, rats, hamsters, guinea pigs or others), porcines, primates, monkeys, and/or lagomorphs).
- the animals can be laboratory animals or non-laboratory animals, whether naturally occurring, genetically engineered or modified, and/o whether being laboratory altered, lifestyle and/or diet altered or drug treated animal variations.
- automated means that substantially all or all of the operations so described can be carried out without requiring active manual input of a human operator, and typically means that the operation(s) can be programmatically directed and/or carried out.
- electronic means that the system, operation or device can communicate using any suitable electronic media and typically employs programmatically controlling the communication between a control system that may be remote and one or more local NMR analyzers using a computer network.
- each block in the flow charts or block diagrams represents a module, segment, operation, or portion of code, which comprises one or more executable instructions for implementing the specified logical function(s).
- the functions noted in the blocks might occur out of the order noted in the figures. For example, two blocks shown in succession may in fact be executed substantially concurrently or the blocks may sometimes be executed in the reverse order, depending upon the functionality involved.
- Type 2 diabetes mellitus also and interchangeably referred to as “non-insulin dependent diabetes mellitus (NIDDM),” refers to the disorder characterized by cellular resistance to insulin and/or secretion of less insulin than is necessary to keep blood glucose levels in balance.
- Type 1 diabetes in contrast, refers to a disorder characterized by the destruction of insulin producing beta cells in the pancreas by an autoimmune reaction.
- IGF impaired fasting glucose
- ITT impaired glucose tolerance
- Individuals with pre-diabetes have an increased risk of developing T2DM within a few years, and clinical trials have shown that lifestyle or pharmacologic interventions that increase insulin sensitivity can delay the onset of T2DM in these people.
- HOMA homeostasis model assessment
- HOMA is a useful index of insulin resistance in large population-based research studies, the ability of a single determination to evaluate insulin resistance in an individual patient is limited by its measurement variability.
- the coefficient of variation (CV) for HOMA can be as high as 30%, with CVs of 8 to 12% reported under more optimal conditions.
- CV coefficient of variation
- biologic and analytic variability of fasting glucose makes some contribution to the variability of HOMA, limitations of the insulin measurement are more important.
- Commercial insulin assays differ in cross-reactivity between insulin and pro-insulin and it is believed that no standardization program has been instituted to help ensure inter-laboratory agreement of insulin values.
- Another limitation for measurement of fasting plasma insulin is the pulsatile mode of insulin secretion (pulses with a periodicity of 10-15 minutes). To minimize errors from this source of variation, it has been recommended that 3 blood samples be drawn 5 minutes apart.
- Embodiments of the present invention are useful in assessing a single patient (e.g., blood/plasma) in vitro sample to provide a lipoprotein insulin resistance index that is correlated to levels of insulin sensitivity and/or insulin resistance.
- the lipoprotein insulin resistance index (e.g., score) can be used to assess the risk of the subject's having and/or developing diabetes.
- Insulin resistance means the failure of the body to respond normally to insulin.
- Insulin resistance is often a precursor to Type 2 diabetes.
- “Insulin resistance syndrome” or “Syndrome X” refers to a set of medical conditions related to insulin resistance in which high blood sugar levels stimulate the production of insulin. When a subject is unable to normally process excess insulin, insulin levels rise.
- hyperlipidemia contributes to high blood pressure, heart disease and stroke.
- Other disorders of insulin resistance include, but are not limited to, dyslipidemia, (including diabetic dyslipidemia) and full-blown Type 2 diabetes, juvenile diabetes and gestational diabetes.
- Lipoproteins include a wide variety of particles found in plasma, serum, whole blood, and lymph, comprising various types and quantities of triglycerides, cholesterol, phospholipids, sphyngolipids, and proteins. These various particles permit the solublization of otherwise hydrophobic lipid molecules in blood and serve a variety of functions related to lipolysis, lipogenesis, and lipid transport between the gut, liver, muscle tissue and adipose tissue. In blood and/or plasma, lipoproteins have been classified in many ways, generally based on physical properties such as density or electrophoretic mobility.
- Classification based on nuclear magnetic resonance-determined particle size distinguishes at least 15 distinct lipoprotein particle subtypes, including 5 subtypes of high density lipoproteins, 4 subtypes of low density lipoproteins, and 6 subtypes of very low density lipoproteins, designated TRL (triglyceride rich lipoprotein) V1 through V6.
- TRL triglyceride rich lipoprotein
- small LDL particles typically includes particles whose sizes range from between about 18 to less than 20.5 nm.
- large LDL particles includes particles ranging in diameter from between about 20.5-23 nm. It is noted that the LDL subclasses of particles can be divided in other size ranges. For example, the "small” size may be between about 19-20.5 nm, intermediate may be between about 20.5-21.2 nm, and large may be between about 21.2-23 nm.
- intermediate-density lipoprotein particles IDL or “IDL-P"
- IDL intermediate-density lipoprotein particles
- large HDL particles typically includes HDL subclasses of particles whose sizes range from between about 9.4 to about 14 nm.
- small HDL particles typically includes particles ranging in diameter between about 7.3 to about 8.2 nm.
- the intermediate or medium HDL particles can be parsed into one of the small or large designations or be measured separately as including particles in the size range that is typically between about 8.2 to 9.4 nm.
- either or both the ranges of size above can be broadened to include some or all the sizes of the intermediate HDL particles.
- large VLDL particles refers to particles at or above about 55 nm.
- population norm and "standard” refer to values of lipoprotein parameters in populations of study participants that were evaluated for insulin resistance using a different measure of insulin resistance, e.g ., a gold standard euglycemic clamp method, glucose tolerance tests, and HOMA as will be discussed further below.
- a gold standard euglycemic clamp method e.g ., glucose tolerance tests, and HOMA as will be discussed further below.
- embodiments of the instant invention are not limited to these population values as the presently defined normal and at-risk population values for one or more of the lipoprotein parameters may change.
- embodiments of the invention use lipoprotein subclass concentrations and size and use a plurality of those measurements as separate and/or independent predictors of insulin resistance that are then combined to form a lipoprotein (composite) insulin resistance index (e.g ., score) to provide a more reliable indicator of insulin resistance level in the subject and/or a predictor of risk of diabetes or other (insulin resistance related abnormalities) based on that level.
- a lipoprotein (composite) insulin resistance index e.g ., score
- hemoglobin A 1 c provides a more accurate, time-integrated indication of a patient's glycemic status compared to a single fasting glucose measurement
- lipoprotein subclass concentrations and particle sizes can provide an accurate and stable reflection of a patient's insulin resistance status. This postulate is based (at least in part) on evidence that hepatic insulin resistance manifests its earliest measurable abnormalities in changes in lipoprotein metabolism, producing elevations in triglycerides and reductions in HDL cholesterol.
- the metabolic changes induced by or accompanying decreased insulin sensitivity and/or insulin resistance produce more extensive abnormalities in lipoprotein subclass levels and particle size distributions which are detectable by NMR.
- NMR measurements of the lipoprotein particles are contemplated as being particularly suitable for the analyses described herein, it is contemplated that other technologies may be used to measure these parameters now or in the future and embodiments of the invention are not limited to this measurement methodology.
- flotation and ultracentrifugtion employ a density-based separation technique for evaluating lipoprotein particles.
- Lipoprotein subclass/size variable can be combined by taking into account their differential strengths of association with insulin resistance to produce a lipoprotein insulin resistance index (e.g ., score).
- a person's insulin resistance can extend over a continuum from low to high and the lipoprotein insulin resistance "index" is a guide or predictor of a person's insulin resistance status.
- the term "index" refers to a number, letter and/or symbol that can characterize a subject's insulin resistance level in a range of from low ( e.g ., insulin sensitive) to high (a greater degree of insulin resistance).
- the index is provided as a numerical score.
- the term "score" refers to a result expressed numerically, typically on a defined scale or within a defined range of values.
- the lipoprotein insulin resistance index can be provided as or include a score within a defined range, such as, for example, between 0-10, 0-24, 0-100, or 0-1000 and the like (with the lowest number being associated with most insulin sensitivity or associated with a low insulin resistance and the highest number in the range being associated with the most insulin resistance or a higher degree of insulin resistance).
- the lower value in the range may be above “0” such as 1, 2, 3, 4 or 5 and the like, or may even be a negative number ( e.g., -1, -2, -3, 4, -5 and the like).
- Other index examples include, for example, alphanumeric indexes such as "100A”, “100B”, terms such as "IR positive”, “IR high”, “IR neutral”, “IR low”, “IR good” , “IR bad”, “IR watch” and the like.
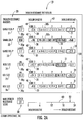
- Figures 2A and 2B illustrates exemplary patient test reports 10 with the insulin resistance index 50 and lipoprotein particle measurements as insulin resistance markers 20 that can each be treated as independent risk factors (each has an independent association with insulin resistance).
- patients can be alerted to a heightened risk of developing type 2 diabetes, before becoming overtly "pre-diabetic", potentially in time for effective lifestyle modification to prevent, not just delay, the onset of that disease.
- the report 10 can be electronically provided to a clinician or patient and/or provided as a "paper" report.
- the report 10 can provide the index 50 as a "bare bones” index (e.g., score) alone or with a lipoprotein-based test/screen for cardiovascular disease or "CVD” 70.
- Cardiovascular disease (CVD) is a general term used to describe disorders that can affect your heart (cardio) and/or your body's system of blood vessels (vascular). The same biosample can be used to generate both the CVD analysis 70 and the index 50.
- the test report 10 can show the insulin resistance markers 20 which are used to calculate or determine the index 50. (However, these parameters may be omitted from the report as noted above).
- the markers 20 can include a plurality of the following (shown as all of the following six lipoprotein particle parameters), concentrations of large VLDL-P 21, small LDL-P 22, large HDL-P 23, and VLDL size 24, LDL size 25, and HDL size 26.
- the VLDL size 24, LDL size 25, and HDL size 26 may be measured as "average" particle size, however, other size demarcations may be used.
- a set of possible respective risk scores 30 can be defined based on the differential strengths of association for each of the lipoprotein parameters used as insulin resistance markers 20 which can be used to determine the index 50. That is, a risk score for a lipoprotein measurement value or range of values can be defined for each lipoprotein particle parameter.
- the risk scores 30 for different values of the different parameters 21-26 are pre-defined, one for a value or range of values of lipoprotein measurements 30p. The actual measurement 30p is correlated to one of the defined risk scores 30 for that parameter 20 and this number provides the risk score 40 for that lipoprotein particle parameter measurement 30p for that patient.
- Figure 2A shows that the risk scores vary from 0-4 and that the patient risk score 40 for marker 21 is "4" and a total largest possible index number of 24.
- Figure 2B uses different ranges of risk scores 30 from, for example 0- 26, 0-27 or 0- 32 for one parameter and 0-8, 0-4 and 0-6 for another (depending on the type of sample and the calculation model used) with different value ranges and scoring numbers for each parameter and with each lipoprotein parameter 20 having a different possible high end risk score number with a total largest possible index number of 100.
- the largest possible risk score 30 for a measurement 30p of the lipoprotein parameters 20 in Figure 2B is for VLDL particle size 24.
- Large VLDL particle concentration 21 has the second largest possible risk score number 30.
- Figure 2B illustrates that the risk score 40 for large VLDL-P concentration 21 is greater than the score 40 for VLDL particle size 24 for this patient.
- the different risk scores 30 are not shown on the report 10 in Figure 2B .
- an equation can be used to combine the different scores 40.
- the associated risk score 30 can be selected from a set of predefined risk scores for a respective lipoprotein parameter or the risk score can be calculated using an equation that correlates a risk score to the actual measurement.
- the report 10 can provide a "transparent" risk model 10R for the risk markers 20 (21-26).
- Figures 2A and 2B also illustrate that the lipoprotein insulin resistance index 50 may be provided with a scale 60 that represents a possible continuum of results from insulin sensitivity/low insulin resistance to high insulin resistant to illustrate the range of possible results.
- the index 50 may be calculated differently for different samples depending on whether the specimen/sample for the lipoprotein measurements was a fasting or non-fasting sample/specimen and/or if the patient is on lipid-altering medication. (However, it should be noted that the present invention is concerned with non-fasting samples only.)
- the index 50 and/or scoring of the markers 20 may also be gender-specific (the risk score may be different for the same lipoprotein particle measurement for a female versus a male).
- the report 10 and or index 50 may be calculated the same irrespective of whether the patient was on lipid altering medications or whether the specimen was a fasting or non-fasting type.
- the index 50 may be calculated by eliminating the small LDL particle concentration as one of the risk markers 20 and the total possible index or range can be reduced accordingly.
- the index 50 can be calculated in the same manner irrespective of whether a patient is on statins, as the overall index may not be materially affected.
- Each marker 20 can have a separately calculated risk score 40 depending on the patient's measurement of that marker 20.
- the pre-defined risk scores 30 that are used to define the respective patient score 40 can be defined based on whether a measured lipoprotein particle value is in a lower or higher segment (typically defined by different quintiles) of population norms, lower risks have lower scores.
- Each marker 20 can have a risk range that is the same, e.g., 0-4, 0-10, 0-25 and the like or each marker 20 or some markers 20 can have a risk range that is different from others. For example, a non-linear equation can be used to generate the index 50.
- the ranges of risk scores 30 can be different and at least one of the lipoprotein particle parameters 20 can have a higher possible risk score 30 than others. See, e.g., Tables 1-3 below.
- the possible risk scores for each marker 20 are from 0-4, for a total highest possible number of 24.
- the score values 30 of each risk marker 20 increase, typically in successive integer values. However, the score values 30 can be non-successive and are not required to be integers.
- the score values 30 can increase for a particular measurement value or a range of values 30p which in the embodiment shown in Figure 2A may be provided in segments of different successive quintile ranges of values 30 for each of the different markers 20 associated with different lipoprotein parameter values 21-26 in a direction associated with increased insulin resistance risk (per the arrow 42 ) from a high insulin sensitivity (or low insulin resistance) at a defined range of values 30 with a risk score of "0" to a greater score 30 associated with a greater degree of insulin resistance associated with a marker value in a different quintile range.
- one or more markers 20 may have a different risk scale with higher scores assigned to its measurement ranges than to those of other markers, and the scores need not be incremental or successive integers (e.g ., the scores can be, for example, 0, 1, 3, 5 and 7 (or more), for the respective different quintiles for the VLDL-P concentration measurement). In addition, the lowest number may be negative or above "0".
- the index 50 can be calculated to include both those of higher and lower contributors (e.g ., some of the information provided by some of the parameters may be redundant with the information provided by another of the parameters).
- the index 50 can be a more reliable or stable indicator (e.g ., similar to a time average measurement) as the test is typically taken at a single point in time with a single sample.
- any single factor can be subject to patient and/or analytic variation.
- Figures 2A and 2B illustrate an exemplary simple and easy-to-understand report 10 that includes the predictive information supplied by the NMR insulin resistance markers 20.
- Patient results 30p for each of the six markers 21-26 are shown or displayed.
- Figure 2A shows a report 10 with a patient measurement 30p and adjacent and aligned therewith are boxes 30b showing the ranges of data in segments associated with different risk scores 30, shown here as corresponding to quintiles of a reference population of non-diabetic individuals (in this example, using MESA as the source of this normal range data).
- the quintile boxes 30b are arrayed from left to right according to their relationships with insulin resistance, with those denoting the highest insulin resistance to the far right.
- a marker score 30 (e.g., from 0 to 4) is assigned to each box (e.g ., population sub-group), higher numbers corresponding to values associated with greater insulin resistance.
- the appropriate boxes corresponding to the patient's measured results for each of the six parameters can be visually enhanced 31 (such as highlighted, shown in bold, red or in another visually enhanced manner).
- the patient measurement results in a score 40 for each of these six boxes 31 that may be summed to give the lipoprotein insulin resistance index 50.
- This index score 50 can be displayed at the bottom of the report 10 and/or in other locations, such as at the top. As shown, the report 10 can also show the relative degree of risk with a visual arrow/scale or ruler 60 depicting that higher scores indicate an increasingly greater likelihood that the patient has a higher degree of insulin resistance.
- Figure 2B illustrates that each measurement 30p can be shown adjacent to a scale of low to high, high to low, small to large and small to large, all arranged to show increasing risk in the same direction.
- the actual risk score 40 can be indicated by a visual marker.
- a triangle indicate the percentile value of the measured subclass/size 30p of variable 20, to provide an indication of where along the continuum of low to high values the patient's value is situated.
- the possible scores 30 are not indentified on this report.
- the index 50 can provide a predictor of a patient's insulin resistance status as a continuum, with an index 50 that is closer to the maximum representing a higher degree of insulin resistance and a higher risk of developing diabetes, rather than making a categorical diagnosis of the presence or absence of insulin resistance.
- This type of index 50 of metabolic abnormality may help a clinician convince a patient to exercise, change a diet and/or lose weight to influence (and reduce and/or favorably alter) this index 50 -- preventing the onset of pre-diabetes and ultimately, diabetes.
- a patient having an index 50 in the top quartile e.g., above 18 or between 18-24 in the score range shown in Figure 2A or at or above the 75th percentile level in Figure 2B , may be diagnosed with pre-diabetes and/or recommended for further medical evaluation to assess glucose abnormalities to confirm this condition.
- the exemplary reports 10 illustrate an easy to understand format with a relatively "transparent" summary of risk by relevant marker 20, but other embodiments of the invention envision generating and providing the insulin resistance index 50 in "opaque" form, e.g ., as a single number without the details of the independent lipoprotein parameter values and associated risk values defined for these markers. If this format is used, the scale 60 may optionally also be provided.
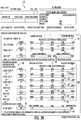
- Tables 1-3 show exemplary equations and risk scores 30 that can be associated with different measurements of the lipoprotein parameters 20.
- the risk score data can be used to generate an index 50 in a range of between 0-100, such as that shown with respect to the index 50 shown in the report of Figure 2B .
- Tables 1-3 are tables that show the six lipoprotein parameters 21-26 ( Figures 2A , 2B ) noted above with risk scores 30 (identified with the word "score" in the tables) correlated to measurement values or ranges of values of the lipoprotein parameters in adjacent columns.
- Table 1 shows exemplary scores 30 used to calculate the index 50 for females while Table 2 shows the same information for males.
- Table 1 and 2 illustrate examples of gender specific indices 50.
- the parameter risk scores 30 are parameter-specific and, for particular lipoprotein measurements of a respective parameter 21-26, can be different for the same value/range of values for females and males.
- Table 3 illustrates a gender neutral index 50 and risk scores 30 for the lipoprotein parameters 20. Table 1.
- LP-IR (F) vszsc + Iszsc + hszsc + vlpsc + Ispsc + hIpsc (Equation 1)
- LP-IR (M) vszsc + Iszsc + hszsc + vIpsc + Ispsc + hIpsc (Equation 2)
- Non-Gender Specific Lipoprotein Insulin Resistance Index Calculation Data
- Equations 1-3 are the same, the scores 30 available for the subjects are different based on gender specific risk score (or a unisex risk score) potentially resulting in a somewhat different value for the index 50 using the same measurements for a particular patient.
- IIR Insulin Resistance Atherosclerosis Study
- MESA Multi-Ethnic Study of Atherosclerosis
- HOMA homeostasis model assessment of insulin resistance index
- insulin mU/l
- x glucose [mg/dl] x 0.055
- values were natural log-transformed for analysis.
- Table 5 shows the gender-specific percentile distributions of HOMA values in the MESA non-diabetic population. Also shown are the natural log-transformed values of HOMA, In(HOMA), which are more closely and linearly related to the gold standard euglycemic clamp measure of insulin resistance. In Table 6 are the percentile distributions of the six NMR subclass and particle size markers of insulin resistance in men and women separately and combined. Table 5.
- the strengths of association with insulin resistance are expressed as ⁇ In(HOMA), the difference in In(HOMA) associated with a 1-standard deviation increment of each lipid or lipoprotein measure.
- the analyses used log-transformed values of triglycerides, triglyceride/HDL-C ratio, and large VLDL-P. Median In(HOMA) was 0.15and values ranged from -1.97 (most insulin sensitive) to 2.43 (most insulin resistant).
- Model R 2 values give a measure of the goodness of fit of the different models (higher R 2 values indicating better insulin resistance prediction).
- FIG. 3A Another measure of the performance of the lipoprotein insulin resistance index as a continuous indicator of insulin resistance is shown graphically in Figure 3A .
- Plotted are the mean ln(HOMA) values and 95% confidence intervals for the non-diabetic MESA participants as a function of their (non-gender-specific) LP-IR scores.
- the results show a strong, linear relationship between the LP-IR score and In(HOMA), indicating that the relative insulin sensitivity of patients can be usefully assessed using lipoprotein subclass/size information from a single (fasting) NMR LipoProfile measurement.
- the NMR LipoProfile® lipoprotein test can measure the plurality ( e.g ., six) subclass/size lipoprotein parameters 20 simultaneously without requiring added cost, equipment or time
- the information from the different parameters 20 can be combined (e.g., typically all six measures where fasting samples are analyzed while typically four measures can be combined for non-fasting samples) to predict the level or degree of insulin resistance and/or the risk of developing insulin resistance disorders including, for example, T2DM.
- the risk prediction can come both from the extent to which the different parameters give independent, additive prediction and/or the advantage that multiplexed information has (even if redundant) in helping overcome the limitations of prediction based on a single measurement taken at one time point. If other test techniques are used (e.g., ultra-centrifugation) where the different lipoprotein parameter data is not readily obtained, then a reduced number of lipoprotein parameters may be used.
- the data indicates that the insulin sensitivity of individual patients can be accurately assessed using information obtained from a single test, such as, for example, a single NMR LipoProfile® insulin resistance test. It is believed that some patients may not be receptive to fasting tests or may not be willing to return for a test but are receptive to blood work during a planned doctor visit and the availability of a non-fasting test may be able to provide tests for those patients.
- Risk assessments provided by embodiments of the invention can be routinely included in a standard overall lipoprotein profile analysis protocol for any individual undergoing a cholesterol or lipoprotein profile. Indeed, the methods of the instant invention can be conveniently and quickly automatically applied to NMR-based lipoprotein profile tests and thereby cost-effectively provide risk information, even while a patient is without symptoms. No additional blood samples are required beyond a standard cholesterol sample and the individual need not be exposed to the relatively time-consuming extended glucose tests. Such a quick and routine test can potentially allow increased numbers of now readily identifiable at-risk patients to undergo drug therapy and/or lifestyle changes to prevent the onset of insulin resistance disorders.
- Figure 4 is a flow chart of exemplary operations that can be used to carry out embodiments of the present invention. It is noted that the present invention is limited to an analysis of non-fasting blood samples (i.e. blocks 110, 120, 125, 123).
- An in vitro blood sample (collected from a subject) can be obtained and introduced to an NMR analyzer (spectrometer).
- the subject may be suspected of being at risk for developing insulin resistance and/or Type 2 diabetes or developing insulin resistance.
- the subject may be undergoing a lipoprotein profile screening as part of an overall assessment of health or for reasons other than suspicion of being at risk for Type 2 diabetes or other insulin resistance disorder (such as screening for coronary heart disease).
- the blood sample may be collected according to known techniques, and may be a blood plasma sample, or a blood serum sample.
- the blood sample is then analyzed by NMR spectral analysis to measure lipoprotein parameters (block 100 ).
- the type of blood sample can be determined (block 110 ). That is, embodiments of the invention contemplate that a common NMR analyzer will be used to assess risk using both fasting and non-fasting blood samples and the samples can be identified to allow the proper test analysis.
- only one type of blood sample can be processed in a single test system, obviating the need for whether a blood sample is a fasting or non-fasting sample type.
- the sample type can be identified using a different color collection label or tube and associated bar code that can be input to the system to order the desired testing protocol.
- the same testing protocol can be used for both sample types and the values that are not used for that sample type can simply be suppressed, discarded or otherwise disregarded.
- any glucose measurement (where made) and/or a VLDL-P concentration or VLDL size measurement can be optionally disregarded, e.g ., not used to calculate the insulin-resistance index 50.
- the insulin resistance index can be calculated using a composite score that adds the risk scores 40 of a plurality of (typically all six) different lipoprotein parameters 20 (block 135 ).
- An NMR glucose measurement can also be obtained (block 138 ) .
- the risk numbers for concentrations of large VLDL-P, small LDL-P and large HDL-P and VLDL size, LDL size and HDL size can be determined and added together to define the insulin resistance index 50 (block 137 ).
- this glucose test result can override the index 50 or buttress the risk associated with the index 50 to identify that the patient is likely to have insulin resistance disorders and/or T2DM (block 140 ).
- the glucose measurement can be considered and for a FG ⁇ 90 mg/dL value or a value that is less than about 100 mg/dL, this measurement can confirm that the patient is insulin sensitive (before the onset of undue insulin resistance or pre-diabetes).
- the blood sample is a non-fasting blood sample (block 120 )
- the insulin resistance index 50 can be calculated using a composite score that adds the risk scores 40 for concentrations of small LDL-P and large HDL-P and LDL size and HDL size can be determined and added together to define the (composite) insulin resistance index 50 (block 123 ).
- lipoprotein parameters with associated risk scores can be added together for the non-fasting samples to generate the insulin resistance index and/or that the risk scores 40 for one or more of the parameters 20 may be weighted in the index calculation.
- the testing system/method can be configured to identify whether a patient is on any lipid altering medications, e.g ., (whether a non-diabetic patient is taking the lipid altering medications). This can allow the system/method to calculate the index with a different set of the six lipoprotein parameters (and adjusted maximum score) or weight the parameters 40 or use alternate risk scores 30, e.g ., analyze the sample differently than the analysis used for other samples. For example, for a patient taking statins, the risk score may be calculated the same as for other patients or the index may be calculated by excluding the concentration of small LDL particles (and reducing the overall potential index number).
- the index 50 can be calculated in alternate ways and provided to a clinician. Similar adjustments in the total index score possible and/or which of the six lipoprotein parameters 20 to exclude or to adjust the associated risk scores 30 can be based on medication that the patient is taking and what lipid alterations are associated with same.
- the process of NMR lipoprotein analysis can be carried out by the following steps: (1) acquisition of an NMR "reference" spectrum for each of the "pure” individual or related groupings of constituent lipoprotein classes and/or subclasses of plasma of interest, (2) acquisition of a whole plasma NMR spectrum for a sample using measurement conditions substantially identical to those used to obtain the reference spectra, and (3) computer deconvolution of the plasma NMR spectrum in terms of the constituent classes and/or subclasses (or related groupings thereof) to give the concentration of each lipoprotein constituent expressed as a multiple of the concentration of the corresponding lipoprotein reference.
- NMR spectral analysis means using proton ( 1 H) nuclear magnetic resonance spectroscopy techniques to measure the lipoprotein parameters present in blood plasma or blood serum, or to measure the concentration or "level” of glucose present in blood plasma or blood serum.
- Measureing a lipoprotein parameter (class or subclass) refers to determining a parameter of the lipoprotein class or subclass, such as the concentration of the lipoprotein class or subclass or the average particle size thereof.
- the systems and methods may optionally also acquire proton NMR data from a sample of blood plasma or serum, process the acquired NMR data to produce a chemical shift spectrum, and deconvolute the spectrum in terms of the reference spectrum of glucose to give the concentration of glucose in the blood serum or blood plasma sample.
- the concentrations and sizes of the lipoprotein parameters of interest can be determined by acquiring reference spectra of individual lipoprotein classes and/or subclasses.
- the reference spectra are then stored, such as in electronic memory and/or a computer program, to provide a reference basis for evaluating additional blood samples or serum samples.
- the NMR spectroscopy-derived spectra associated with the individual lipoprotein classes and subclasses are substantially invariant across the population.
- the NMR reference spectra (lineshapes and amplitudes) of individual lipoprotein constituents can be used as a "key” to "deconvolute” the composite signal associated with an individual's whole blood plasma (or blood serum). In this way, a single reference set can be used as a basis to determine the lipoprotein profile of other blood samples (when taken at a substantially constant temperature and magnetic field).
- An NMR spectroscopy analysis is generated for a desired blood plasma or serum specimen (taken at the same magnetic field strength and temperatures used for the reference spectra) to provide an actual (measured) composite blood plasma spectra signal.
- the preferred method of the present invention then manipulates the scalable reference spectra until the sum of the scalable coefficients substantially "fits" the composite signal value.
- the value of the scalable coefficient is then used to determine the actual concentration values for the lipoprotein constituents in the blood plasma sample of that individual.
- the NMR spectral analysis may also be used to measure the parameters of other constituents of blood such as the concentration of triglycerides, protein, and chylomicrons in the blood sample.
- the concentration of glucose in a blood sample of the invention can be measured, typically also using NMR spectral analysis concurrently with the NMR-based measurement of the lipoprotein values in the same blood sample.
- the word “concurrently” means sufficiently close in time to be able to be performed during one NMR "run” or measurement event (that is, “concurrently” may be simultaneously, or it may be two or more events occurring within a short time period before or after each other, or it may be an NMR evaluation performed on the same sample, or samples taken from the patient in a single blood withdraw session, or samples taken from a single venipuncture once patency is established).
- Figure 5 shows the proton NMR spectrum of blood plasma, with a glucose fitting region with two peaks between about 3.55 - 3.50 (ppm) in the proton NMR spectrum that can be used to determine the glucose level.
- Figure 6 shows an expansion of the region of the blood plasma spectrum where glucose signals are observed, the two peaks being specifically indicated within the glucose fitting region. The peaks in the glucose fitting region may be used for the quantitative determination of glucose.
- the data points in the reference or standard spectrum and patient glucose sample spectra are aligned using a line-shape fitting process as described herein to find the "best fit," and the intensity of the standard spectrum is scaled to match the sample spectrum.
- the glucose concentration of the standard is multiplied by the scaling factor used to match the sample lineshape to give the glucose concentration of the blood sample.
- an NMR reference data spectrum corresponding to glucose in a reference blood plasma or serum sample or specimen is acquired and stored in computer memory.
- a reference coefficient is assigned to one glucose signal or group of glucose signals ("reference glucose lineshape") in the reference spectrum, the value of which is based on the glucose concentration of that reference specimen determined by an independent chemical glucose measurement.
- An NMR spectrum of a patient's blood plasma or serum specimen is acquired at some later time under measurement conditions (substantially) identical to those used to obtain the glucose reference spectrum and stored in computer memory. That is, for example, the NMR data spectrums are obtained under the same magnetic field strength and specimen temperature.
- the reference glucose lineshape is compared with the same glucose signal or group of signals in the patient spectrum ("patient glucose lineshape").
- a calculation is then performed which determines the scaling factor needed to adjust the amplitude of the reference glucose lineshape to give the best match with the patient glucose lineshape. This scaling factor is multiplied by the reference coefficient to give the concentration of glucose in the patient blood plasma or serum specimen.
- Other lifestyle and genetic information can also be acquired and factored into an overall risk assessment analysis by the clinician.
- weight, age, and family history of diabetes can all be assigned risk values which can be factored (separately or with) into the blood lipoprotein based analysis.
- a subject may have a borderline (blood test) insulin resistance index 50 (e.g, a value that is between 50%-60% of the maximum risk number), but may be identified as being "at-risk” (i.e., for developing Type 2 diabetes) by the increased risk values attributed to one or more of familial, genetic, weight or lifestyle information. This information may then identify the subject for lifestyle changes such as exercise, weight loss or diet changes and/or drug therapy and/or place the subject on an increased and/or timed monitoring schedule. As noted above, the index 50 may provide more tangible evidence of metabolic abnormality that can be used to motivate a patient to make lifestyle changes.
- a borderline (blood test) insulin resistance index 50 e.g, a value that is between 50%-60% of the maximum risk number
- This information may then identify the subject for lifestyle changes such as exercise, weight loss or diet changes and/or drug therapy and/or place the subject on an increased and/or timed monitoring schedule.
- the index 50 may provide more tangible evidence of metabolic abnormality that can be used to motivate a patient to make lifestyle
- a baseline insulin resistance/sensitivity test generating a baseline insulin resistance index 50 can be obtained by analyzing the patient sample, e.g ., typically a blood sample analyzed by NMR spectral analysis as described herein. After the baseline test, and periodically thereafter, blood or another suitable biosample can be collected again from the subject, and a second and subsequent insulin resistance analysis of the lipoprotein parameters that were measured in the baseline is then obtained, again typically by NMR spectral analysis, as described herein. The second analysis and/or index 50 can be compared to the baseline index 50.
- a difference between the two may provide an indication of the efficacy of treatment and/or stability in the index 50.
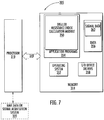
- FIG. 7 is a block diagram of exemplary data processing systems that illustrates systems, methods, and computer program products.
- the processor 310 communicates with the memory 314 via an address/data bus 348.
- the processor 310 can be any commercially available or custom microprocessor.
- the memory 314 is representative of the overall hierarchy of memory devices containing the software and data used to implement the functionality of the data processing system 305.
- the memory 314 can include, but is not limited to, the following types of devices: cache, ROM, PROM, EPROM, EEPROM, flash memory, SRAM, and DRAM.
- the memory 314 may include several categories of software and data used in the data processing system 305: the operating system 352; the application programs 354; the input/output (I/O) device drivers 358; an Insulin Resistance Index Calculation Module that considers concentrations and sizes of lipoprotein parameters 350; and the data 356.
- the Insulin Resistance Index Calculation Module 350 can include predefined risk values for different values or ranges of each lipoprotein parameter acting as a marker "20" (a defined lipoprotein particle parameter that is associated with insulin resistance) in a look-up chart or electronic reference library.
- the data 356 may include signal (constituent and/or composite spectrum lineshape) data 362 which may be obtained from a data or signal acquisition system 320.
- the operating system 352 may be any operating system suitable for use with a data processing system, such as OS/2, AIX or OS/390 from International Business Machines Corporation, Armonk, NY, WindowsCE, WindowsNT, Windows95, Windows98, Windows2000 or WindowsXP from Microsoft Corporation, Redmond, WA, PalmOS from Palm, Inc., MacOS from Apple Computer, UNIX, FreeBSD, or Linux, proprietary operating systems or dedicated operating systems, for example, for embedded data processing systems.
- the I/O device drivers 358 typically include software routines accessed through the operating system 352 by the application programs 354 to communicate with devices such as I/O data port(s), data storage 356 and certain memory 314 components and/or the image acquisition system 320.
- the application programs 354 are illustrative of the programs that implement the various features of the data processing system 305 and can include at least one application, which supports operations according to embodiments of the present invention.
- the data 356 represents the static and dynamic data used by the application programs 354, the operating system 352, the I/O device drivers 358, and other software programs that may reside in the memory 314.
- Module 350 is illustrated, for example, with reference to the Module 350 being an application program in Figure 7 , as will be appreciated by those of skill in the art, other configurations may also be utilized while still benefiting from the teachings of the present invention.
- the Module 350 may also be incorporated into the operating system 352, the I/O device drivers 358 or other such logical division of the data processing system 305.
- the present invention should not be construed as limited to the configuration of Figure 7 , which is intended to encompass any configuration capable of carrying out the operations described herein.
- the I/O data port can be used to transfer information between the data processing system 305 and the image scanner or acquisition system 320 or another computer system or a network (e.g ., the Internet) or to other devices controlled by the processor.
- These components may be conventional components such as those used in many conventional data processing systems.
- the system 207 includes an NMR spectrometer 210 for taking NMR measurements of a sample.
- the spectrometer 210 may be configured so that the NMR measurements are conducted at 400 MHz for proton signals; in other embodiments the measurements may be carried out at 360MHz or other suitable frequency. Other frequencies corresponding to a desired operational magnetic field strength may also be employed.
- a proton flow probe is installed, as is a temperature controller to maintain the sample temperature at 47 +/-0.2 degrees C.
- Field homogeneity of the spectrometer 210 can be optimized by shimming on a sample of 99.8% D 2 O until the spectral linewidth of the HDO NMR signal is less than 0.6 Hz.
- the 90° RF excitation pulse width used for the D 2 O measurement is typically ca. 6-7 microseconds.
- the spectrometer 210 is controlled by a processor or an ACIS typically held in a digital computer 211 or other signal processing unit.
- the computer/processor should be capable of performing rapid Fourier transformations.
- the system 207 may also include a data link 212 to an external server, client or other computer 213, and a direct-memory-access channel 214 which connects to a hard disc unit 215 or back-up server with data storage.
- the computer 211 may also include a set of analog-to-digital converters, digital-to-analog converters and slow device I/O ports which connect through a pulse control and interface circuit 216 to the operating elements of the spectrometer. These elements include an RF transmitter 217 which produces an RF excitation pulse of the duration, frequency and magnitude directed by the digital computer 211, and an RF power amplifier 218 which amplifies the pulse and couples it to the RF transmit coil 219 that surrounds sample cell 220.
- the NMR signal produced by the excited sample in the presence of a 9.4 Tesla polarizing magnetic field produced by superconducting magnet 221 is received by a coil 222 and applied to an RF receiver 223.
- the amplified and filtered NMR signal is demodulated at 224 and the resulting quadrature signals are applied to the interface circuit 216 where they are digitized and input through the digital computer 211 to a file in the disc storage 215.
- the module 350 ( Figure 7 ) can be located in the digital computer 211 and/or in a secondary computer, processor, or database that may be on-site or remote with a wired or wireless connection.
- the system 207 can have Internet connectivity 227 and can send reports to clinicians electronically and/or via paper. Additional automated clinical NMR analyzer systems suitable for analyzing biosamples or specimens are described in co-pending, co-assigned U.S. Patent Application Publication US 2005/0222504 A1 . See also, US Pat. Nos.
- processing by the computer 211 produces another file that can, as desired, be stored in the disc storage 215 (or other data storage device such as a server or database).
- This second file is a digital representation of the chemical shift spectrum and it is subsequently read out to the computer 213 for storage in its disc storage 225.
- the computer 13 which may be personal, laptop, desktop, or other computer, processes the chemical shift spectrum to print a report, which is output to a printer 226 or electronically stored and relayed to a desired email address or URL.
- printer 226 or electronically stored and relayed to a desired email address or URL.
- the functions performed by the computer 213 and its separate disc storage 225 may also be incorporated into the functions performed by the spectrometer's digital computer 211.
- the printer 226 may be connected directly to the digital computer 211 or may reside at a clinician site.
- Other interfaces and output devices may also be employed, as are well-known to those skilled in this art.
- the insulin resistance index may help identify patients that are at-risk for having disorders of insulin resistance including, but not limited to, dyslipidemia, (including diabetic dyslipidemia) Type 2 diabetes, and gestational diabetes.
Description
- The present invention relates to a method of predicting a non-diabetic subject's degree of insulin resistance.
-
Type 2 diabetes mellitus (T2DM) is one of the most costly and burdensome chronic diseases, and is increasing in epidemic proportions in the U.S. and other countries. The defining feature of T2DM is hyperglycemia, a reflection of impaired carbohydrate (glucose) utilization resulting from a defective or deficient insulin secretory response. T2DM is currently defined in patients having a fasting plasma glucose level that is greater than or equal to 125 mg/dL. T2DM is a late manifestation of metabolic derangements that begin many years earlier. Its cause is believed to be a progressive increase in insulin resistance coupled with deteriorating β-cell function. So long as the pancreatic β-cells are able to secrete enough insulin to compensate for the progressive resistance of target tissues to insulin's hypoglycemic effects, the patient is able to maintain normal fasting glucose levels. Hyperglycemia and the transition to T2DM occur as a consequence of progressive β-cell dysfunction which leads to failure to maintain hypersecretion of insulin in the face of increasing insulin resistance. These potential metabolic changes over time and the impact on glucose levels are shown schematically inFigure 1 . -
Type 2 diabetes has been traditionally diagnosed by the detection of elevated levels of glucose (sugar) in the blood (hyperglycemia). While hyperglycemia defines diabetes, it is a very late stage development in the chain of events that lead from insulin resistance to full-blown diabetes. Accordingly, it would be desirable to have a way of identifying whether or not a subject is at risk for developingType 2 diabetes (i.e., is predisposed to the condition) prior to the development of the classic symptoms, such as hyperglycemia. Earlier detection of indicators of the disease (e.g., detection before glucose levels are elevated enough to be considered hyperglycemia) may lead to more effective treatment of the disease, if not actual prevention of the onset of the disease. - The most direct and accurate methods for assessing insulin resistance are laborious and time-consuming, and thus impractical for clinical application. The "gold standard" among these research methods is the hyperinsulinemic euglycemic clamp, which quantifies the maximal glucose disposal rate (GDR, inversely proportional to insulin resistance) during the clamp. Another arduous research method which is somewhat less reproducible (CV 14-30%) is the frequently sampled intravenous glucose tolerance test (IVGTT) with minimal model analysis, which measures insulin sensitivity (Si), the inverse of insulin resistance.
-
U.S. Patent No. 6,518,069 to Otvos et al . describes NMR derived measurements of glucose and/or certain lipoprotein values to assess a patient's risk of developing T2DM. The article Garvey, W.T. et al.: "Effects of Insulin Resistance and , describes correlations between insulin sensitivity and selected lipoprotein subclass particle concentrations and particle sizes.The article Lindström J. et al, "The Diabetes Risk Score - A practical tool to predict , describes a method of predictingtype 2 diabetes risk by determining a diabetes risk score as the sum of individual risks related to different variables. - The present invention relates to a method of predicting a non-diabetic subject's degree of insulin resistance, comprising:
measuring a plurality of selected lipoprotein parameters from an in vitro patient biosample, wherein the biosample is a non-fasting blood plasma or serum sample, wherein the plurality of selected lipoprotein parameters includes particle concentration and size; programmatically providing a risk score for each of the selected lipoprotein parameters based on the measurement of the selected lipoprotein parameters, wherein the risk score is selected from a set of defined risk scores associated with different potential measurement values or ranges of values of each of the selected lipoprotein parameters; and programmatically generating a lipoprotein insulin resistance index by summing the risk scores of the selected lipoprotein parameters, wherein the selected lipoprotein parameters include the following: small LDL, and large HDL particle concentrations and LDL, and HDL particle sizes. - The selected parameters can include the following: large VLDL, small LDL, and large HDL particle concentrations and VLDL, LDL, and HDL particle sizes (typically average sizes).
- In particular embodiments, the generating step may include calculating a risk score or selecting a risk score from a set of defined risk scores for each of the obtained lipoprotein parameter measurements, and summing the risk scores to generate the lipoprotein insulin resistance index with a value between 0-100, with 100 indicating a high degree of insulin resistance. Larger values of the lipoprotein insulin resistance index can be correlated to an increased risk of developing diabetes.
- The patient's sample is a non-fasting blood plasma or serum sample and the obtained measurements include at least four NMR measurements, including NMR measurements of the small LDL and large HDL particle concentrations and the (average) LDL and HDL particle sizes. The generating step can include calculating a risk score for each of the at least four obtained measurements, and summing the four risk scores to generate the lipoprotein insulin resistance index.
- Still other embodiments are set out in the dependent claims.
- Disclosed herein but not forming part of the invention are systems, methods and assessments for assessing a patient's level of insulin resistance and/or using same for determining whether subjects are at risk for having diabetes.
- Examples disclosed herein provide methods that can predict a non-diabetic subject's level of insulin resistance. The methods include: (a) obtaining measurements of a plurality of selected lipoprotein parameters from an in vitro patient biosample; and (b) programmatically generating a lipoprotein insulin resistance index based on the obtained measurements.
- In other examples, the patient's sample is a fasting sample and the obtained measurements include NMR measurements of all six of the lipoprotein parameters. The generating step can include calculating a risk score for each of the six obtained lipoprotein parameter measurements, and summing the six risk scores to generate the lipoprotein insulin resistance index.
- Yet other examples are directed to patient test reports. The test reports include a lipoprotein insulin resistance index. The index is a composite number of risk scores correlated to each of a plurality of NMR-measured lipoprotein particle parameters of a patient blood or plasmas sample.
- The plurality of parameters can include at least four of the following: large VLDL, small LDL, and large HDL particle concentrations and VLDL, LDL, and HDL particle sizes.
- Still other examples are directed to computer programs for assessing decreased insulin sensitivity (e.g., insulin insensitivity) and/or insulin resistance in a non-diabetic subject. The computer program includes a computer readable storage medium having computer readable program code embodied in the medium. The computer-readable program code includes computer readable program code that determines NMR measurements of at least four of the following lipoprotein parameters: large VLDL, small LDL, and large HDL particle concentrations and VLDL, LDL, and HDL particle sizes; computer readable program code that associates a risk score for each of the at least four lipoprotein NMR measurements; and computer readable program code that uses the risk scores of each of the at least four NMR lipoprotein parameter measurements to generate a lipoprotein insulin resistance index.
- Yet other examples are directed to systems for generating an insulin resistance index using measurement data of lipoprotein parameters in a blood or plasma sample of a subject. The systems include an NMR spectrometer for acquiring at least one NMR spectrum of an in vitro blood plasma or serum sample; and a processor in communication with the NMR spectrometer. The processor is configured to: (a) determine NMR measurements of a plurality of selected lipoprotein parameters; (b) calculate a risk score or select a risk score from a set of defined risk scores for each of the determined measurements of the selected lipoprotein parameters; and (c) sum the risk scores for each of the lipoprotein parameters to generate a lipoprotein insulin resistance index.
- The selected lipoprotein parameters can include at least four of the following lipoprotein parameters in the blood plasma or serum sample: large VLDL, small LDL, and large HDL particle concentrations and VLDL, LDL, and HDL particle sizes
- Still other examples are directed to methods of evaluating the efficacy of treatment of a subject undergoing treatment to reduce insulin sensitivity. The methods include: (a) obtaining a first insulin resistance score using NMR measured lipoprotein parameters for a patient's blood plasma or serum sample, including at least a plurality of the following lipoprotein parameters: large VLDL, small LDL, and large HDL particle concentrations and VLDL, LDL, and HDL particle sizes; and programmatically generating a first insulin resistance score based on the values of the obtained measurements; then (b) obtaining a second insulin resistance analysis of a patient's blood plasma or serum sample obtained after the subject has initiated lifestyle or drug treatment for decreasing insulin sensitivity using NMR measured lipoprotein parameters for a patient's blood plasma or serum sample, including at least a plurality of the following lipoprotein parameters: large VLDL, small LDL, and large HDL particle concentrations and VLDL, LDL, and HDL particle sizes, and programmatically generating a second insulin resistance score based on the values of the obtained measurements; and (c) comparing the first and second scores to assess whether the risk number has decreased to provide an indication of the efficacy of treatment for the subject.
- Examples disclosed herein provide for easy-to-understand insulin resistance assessments for identifying subjects with decreased insulin sensitivity (e.g., insulin insensitivity or resistance) and/or subjects that are at risk for developing or having diabetes earlier than has been conventionally achieved to enable more effective T2DM prevention by targeting at-risk patients for initiation of lifestyle interventions earlier than has been conventionally achieved for most people, such as when blood glucose levels are still in the normal range and β-cell function has not yet deteriorated.
- Some examples described herein are directed to insulin resistance tests that can assess insulin sensitivity/resistance and provide an insulin resistance index (e.g., score) associated with a (defined) scale to assess a patient's risk of developing
Type 2 diabetes. The tests can be generated using an automated nuclear magnetic resonance (NMR) spectrometer to measure lipoprotein particle subclasses to quantify a plurality of the following: large VLDL, small LDL, and large HDL particle concentrations and (average) VLDL, LDL, and HDL particle sizes. Some tests can be done using fasting or non-fasting serum and plasma samples using nuclear magnetic resonance (NMR) spectroscopy. Some tests can also include measuring glucose using the same patient sample. The lipoprotein subclass (concentrations) and size measures are associated with insulin resistance and, in aggregate, can be used as a quantitative means to assess the level of insulin sensitivity of non-diabetic patients, for the purpose of aiding, in conjunction with other laboratory measurements and clinical evaluation, assessment of their risk of developingtype 2 diabetes mellitus. - The tests can be based on measurements of a plurality of different lipoprotein subclasses measurements (e.g., typically between about four-six different lipoprotein factors) with each factor scored for risk individually. A composite or cumulative (aggregate) score can be used to define a lipoprotein insulin resistance index.
- The foregoing and other objects and aspects of the invention are explained in further detail herein.
-
-
Figure 1 is a graph that schematically illustrates metabolic changes over time. -
Figure 2A is an exemplary patient test report with a lipoprotein insulin resistance index. -
Figure 2B is another exemplary patient test report with a lipoprotein insulin resistance index. -
Figure 3A is a graph of insulin resistance measured by ln(HOMA) values in non-diabetic MESA participants categorized by their lipoprotein insulin resistance index values (with the number of subjects in each index category indicated numerically). -
Figure 3B is a bar graph of insulin resistance (ln(HOMA)) by quartile of glucose (mg/dL) and lipoprotein insulin resistance index score in non-diabetic MESA participants (with the number of subjects in each category indicated in parentheses). -
Figure 4 is a flow chart of exemplary operations that can be carried out to determine insulin resistance indices (e.g., scores). Only those steps concerning an analysis of a non-fasting blood sample fall within the scope of the invention. -
Figure 5 is a proton NMR spectrum of blood plasma, with a glucose fitting region indicated by the broken-line box. -
Figure 6 is an enlarged partial NMR spectrum ofFigure 5 showing the glucose fitting region enlarged with two peaks used to assess glucose level in patients. -
Figure 7 is a schematic illustration of a data processing system. -
Figure 8 is a schematic illustration of an NMR analyzer. - The present invention will now be described more fully hereinafter with reference to the accompanying drawings, in which preferred embodiments of the invention are shown. This invention may, however, be embodied in many different forms and should not be construed as limited to the embodiments set forth herein; rather, these embodiments are provided so that this disclosure will be thorough and complete, and will fully convey the scope of the invention to those skilled in the art.
- Like numbers refer to like elements throughout. In the figures, the thickness of certain lines, layers, components, elements or features may be exaggerated for clarity. Broken lines illustrate optional features or operations unless specified otherwise.
- The terminology used herein is for the purpose of describing particular embodiments only and is not intended to be limiting of the invention. As used herein, the singular forms "a", "an" and "the" are intended to include the plural forms as well, unless the context clearly indicates otherwise. It will be further understood that the terms "comprises" and/or "comprising," when used in this specification, specify the presence of stated features, integers, steps, operations, elements, and/or components, but do not preclude the presence or addition of one or more other features, integers, steps, operations, elements, components, and/or groups thereof. As used herein, the term "and/or" includes any and all combinations of one or more of the associated listed items. As used herein, phrases such as "between X and Y" and "between about X and Y" should be interpreted to include X and Y. As used herein, phrases such as "between about X and Y" mean "between about X and about Y." As used herein, phrases such as "from about X to Y" mean "from about X to about Y."
- Unless otherwise defined, all terms (including technical and scientific terms) used herein have the same meaning as commonly understood by one of ordinary skill in the art to which this invention belongs. It will be further understood that terms, such as those defined in commonly used dictionaries, should be interpreted as having a meaning that is consistent with their meaning in the context of the specification and relevant art and should not be interpreted in an idealized or overly formal sense unless expressly so defined herein. Well-known functions or constructions may not be described in detail for brevity and/or clarity.
- The term "programmatically" means the instruction, calculation, function, feature, operation and/or step is carried out using computer program directions. The terms "automated" and "automatic" means that the operations can be carried out with minimal or no manual labor or input. The term "semi- automated" refers to allowing operators some input or activation, but the calculations, determinations and signal acquisition as well as the calculation of the concentrations and/or sizes of the lipoprotein parameters and/or insulin resistance markers are done electronically, typically programmatically, without requiring manual input.
- The term "biosample" includes whole blood, plasma, serum, urine, cerebral spinal fluid (CSF), lymph samples, stool samples, tissues, and/or body fluids in raw form and/or in preparations. However, whole blood or plasma biosamples may be particularly suitable for embodiments of the present invention. The biosamples can be from any target subject. Subjects', according to the present invention, can be any animal subject, and are preferably mammalian subjects (e.g., humans, canines, felines, bovines, caprines, ovines, equines, rodents (mice, rats, hamsters, guinea pigs or others), porcines, primates, monkeys, and/or lagomorphs). The animals can be laboratory animals or non-laboratory animals, whether naturally occurring, genetically engineered or modified, and/o whether being laboratory altered, lifestyle and/or diet altered or drug treated animal variations.
- The term "automatic" means that substantially all or all of the operations so described can be carried out without requiring active manual input of a human operator, and typically means that the operation(s) can be programmatically directed and/or carried out. The term "electronic" means that the system, operation or device can communicate using any suitable electronic media and typically employs programmatically controlling the communication between a control system that may be remote and one or more local NMR analyzers using a computer network.
- The flowcharts and block diagrams of certain of the figures herein illustrate the architecture, functionality, and operation of possible implementations of analysis models and evaluation systems and/or programs according to the present invention. In this regard, each block in the flow charts or block diagrams represents a module, segment, operation, or portion of code, which comprises one or more executable instructions for implementing the specified logical function(s). It should also be noted that in some alternative implementations, the functions noted in the blocks might occur out of the order noted in the figures. For example, two blocks shown in succession may in fact be executed substantially concurrently or the blocks may sometimes be executed in the reverse order, depending upon the functionality involved.
- As used herein, the term "
Type 2 diabetes mellitus (T2DM)" also and interchangeably referred to as "non-insulin dependent diabetes mellitus (NIDDM)," refers to the disorder characterized by cellular resistance to insulin and/or secretion of less insulin than is necessary to keep blood glucose levels in balance.Type 1 diabetes, in contrast, refers to a disorder characterized by the destruction of insulin producing beta cells in the pancreas by an autoimmune reaction. - Before people develop "frank" T2DM, they pass through a transitional state of moderate hyperglycemia termed "pre-diabetes" by the American Diabetes Association, currently defined as impaired fasting glucose (IFG, fasting glucose between 100 and 125 mg/dL) or impaired glucose tolerance (IGT, glucose = 140 to 199 mg/dL, 2 hours after a standard 75g oral glucose load). Individuals with pre-diabetes have an increased risk of developing T2DM within a few years, and clinical trials have shown that lifestyle or pharmacologic interventions that increase insulin sensitivity can delay the onset of T2DM in these people.
- However, it is increasingly being questioned whether intervention at the "pre-diabetes" stage is too late to prevent diabetes from occuring, as opposed to simply delaying its onset. The reason is that potentially significant (irreversible) β-cell dysfunction has typically occurred by the time a patient develops pre-diabetes (IFG or IGT). Earlier intervention with aggressive lifestyle modification when a patient becomes insulin resistant, or even before a patient becomes insulin resistant when elevated insulin sensitivity is detected, before there is β-cell damage, could prevent, not just delay, T2DM.
- In the past, surrogate measures of insulin resistance suitable for use in a clinical setting all rely on laboratory tests performed on fasting blood samples. The oldest and most widely used method in epidemiologic studies is homeostasis model assessment (HOMA), based on fasting levels of insulin and glucose: HOMA = (fasting insulin x glucose)/22.5. A number of other estimates of insulin resistance based on a fasting plasma sample have been proposed. The performance of HOMA and these alternative insulin resistance estimates has been evaluated in studies of different patient populations by determining how they correlate with the gold standard euglycemic clamp measure. The log-transform of HOMA, log(HOMA), performed as well or better than any of the alternatives, giving strong correlations (r~0.8) with clamp-measured GDR.
- Although HOMA is a useful index of insulin resistance in large population-based research studies, the ability of a single determination to evaluate insulin resistance in an individual patient is limited by its measurement variability. The coefficient of variation (CV) for HOMA can be as high as 30%, with CVs of 8 to 12% reported under more optimal conditions. Although biologic and analytic variability of fasting glucose makes some contribution to the variability of HOMA, limitations of the insulin measurement are more important. Commercial insulin assays differ in cross-reactivity between insulin and pro-insulin and it is believed that no standardization program has been instituted to help ensure inter-laboratory agreement of insulin values. Another limitation for measurement of fasting plasma insulin is the pulsatile mode of insulin secretion (pulses with a periodicity of 10-15 minutes). To minimize errors from this source of variation, it has been recommended that 3 blood samples be drawn 5 minutes apart.
- Embodiments of the present invention are useful in assessing a single patient (e.g., blood/plasma) in vitro sample to provide a lipoprotein insulin resistance index that is correlated to levels of insulin sensitivity and/or insulin resistance. The lipoprotein insulin resistance index (e.g., score) can be used to assess the risk of the subject's having and/or developing diabetes. Insulin resistance means the failure of the body to respond normally to insulin. Insulin resistance is often a precursor to
Type 2 diabetes. "Insulin resistance syndrome" or "Syndrome X" refers to a set of medical conditions related to insulin resistance in which high blood sugar levels stimulate the production of insulin. When a subject is unable to normally process excess insulin, insulin levels rise. Eventually, the subject has high blood sugar levels (hyperglycemia) and high insulin levels (hyperinsulemia). Under these conditions, insulin loses its ability to control fat metabolism, and excessive fats enter the bloodstream (hyperlipidemia). Hyperlipidemia contributes to high blood pressure, heart disease and stroke. Other disorders of insulin resistance include, but are not limited to, dyslipidemia, (including diabetic dyslipidemia) and full-blownType 2 diabetes, juvenile diabetes and gestational diabetes. - One of the earliest manifestations of insulin resistance is an alteration of lipoprotein metabolism, producing triglyceride elevations and reductions in HDL cholesterol. See, Laasko et al., Insulin resistance is associated with lipid and lipoprotein abnormalities in subjects with varying degrees of glucose tolerance, Arteriosclerosis: 1990; 10-223-31. The metabolic changes accompanying insulin resistance produce even greater and more extensive abnormalities in lipoprotein subclass levels and particle size distributions which are detected by NMR LipoProfile® lipoprotein analysis. Specifically, large VLDL and small LDL subclass particle concentrations are higher and large HDL subclass levels are lower in insulin resistant individuals. NMR-measured VLDL, LDL, and HDL particle sizes also reflect insulin resistance status. VLDL size tends to be greater and LDL and HDL sizes smaller when a patient is insulin resistant.
- Lipoproteins include a wide variety of particles found in plasma, serum, whole blood, and lymph, comprising various types and quantities of triglycerides, cholesterol, phospholipids, sphyngolipids, and proteins. These various particles permit the solublization of otherwise hydrophobic lipid molecules in blood and serve a variety of functions related to lipolysis, lipogenesis, and lipid transport between the gut, liver, muscle tissue and adipose tissue. In blood and/or plasma, lipoproteins have been classified in many ways, generally based on physical properties such as density or electrophoretic mobility. Classification based on nuclear magnetic resonance-determined particle size distinguishes at least 15 distinct lipoprotein particle subtypes, including 5 subtypes of high density lipoproteins, 4 subtypes of low density lipoproteins, and 6 subtypes of very low density lipoproteins, designated TRL (triglyceride rich lipoprotein) V1 through V6.
- As used herein, the term "small LDL particles" typically includes particles whose sizes range from between about 18 to less than 20.5 nm. The term "large LDL particles" includes particles ranging in diameter from between about 20.5-23 nm. It is noted that the LDL subclasses of particles can be divided in other size ranges. For example, the "small" size may be between about 19-20.5 nm, intermediate may be between about 20.5-21.2 nm, and large may be between about 21.2-23 nm. In addition, intermediate-density lipoprotein particles ("IDL" or "IDL-P"), which range in diameter from between about 23-29 nm, can be included among the particles defined as "large" LDL.
- The term "large HDL particles" ("large HDL-P") typically includes HDL subclasses of particles whose sizes range from between about 9.4 to about 14 nm. The term "small HDL particles" (small HDL-P) typically includes particles ranging in diameter between about 7.3 to about 8.2 nm. The intermediate or medium HDL particles (medium HDL-P) can be parsed into one of the small or large designations or be measured separately as including particles in the size range that is typically between about 8.2 to 9.4 nm. Thus, either or both the ranges of size above can be broadened to include some or all the sizes of the intermediate HDL particles.
- The term "large VLDL particles" refers to particles at or above about 55 nm.
- The particle sizes noted above typically refer to average measurements, but other demarcations may be used.
- The terms "population norm" and "standard" refer to values of lipoprotein parameters in populations of study participants that were evaluated for insulin resistance using a different measure of insulin resistance, e.g., a gold standard euglycemic clamp method, glucose tolerance tests, and HOMA as will be discussed further below. However, embodiments of the instant invention are not limited to these population values as the presently defined normal and at-risk population values for one or more of the lipoprotein parameters may change.
- Generally stated, embodiments of the invention use lipoprotein subclass concentrations and size and use a plurality of those measurements as separate and/or independent predictors of insulin resistance that are then combined to form a lipoprotein (composite) insulin resistance index (e.g., score) to provide a more reliable indicator of insulin resistance level in the subject and/or a predictor of risk of diabetes or other (insulin resistance related abnormalities) based on that level. Just as hemoglobin A1c provides a more accurate, time-integrated indication of a patient's glycemic status compared to a single fasting glucose measurement, while not wishing to be bound to any one theory, it is postulated that lipoprotein subclass concentrations and particle sizes can provide an accurate and stable reflection of a patient's insulin resistance status. This postulate is based (at least in part) on evidence that hepatic insulin resistance manifests its earliest measurable abnormalities in changes in lipoprotein metabolism, producing elevations in triglycerides and reductions in HDL cholesterol. The metabolic changes induced by or accompanying decreased insulin sensitivity and/or insulin resistance produce more extensive abnormalities in lipoprotein subclass levels and particle size distributions which are detectable by NMR.
- It is also noted that while NMR measurements of the lipoprotein particles are contemplated as being particularly suitable for the analyses described herein, it is contemplated that other technologies may be used to measure these parameters now or in the future and embodiments of the invention are not limited to this measurement methodology. For example, flotation and ultracentrifugtion employ a density-based separation technique for evaluating lipoprotein particles.
- As depicted in
Figure 1 , the development and progression of these lipoprotein subclass abnormalities occurs early and in parallel with the development and progression of insulin resistance, with the onset of both taking place years before the emergence of abnormal glucose tolerance. Evidence, such as that discussed below, shows that the lipoprotein subclass and size information measured by NMR or other suitable means, taken together in the form of a (composite) lipoprotein insulin resistance index, can provide a clinically useful means of assessing a patient's insulin resistance status. - Lipoprotein subclass/size variable can be combined by taking into account their differential strengths of association with insulin resistance to produce a lipoprotein insulin resistance index (e.g., score). A person's insulin resistance can extend over a continuum from low to high and the lipoprotein insulin resistance "index" is a guide or predictor of a person's insulin resistance status. The term "index" refers to a number, letter and/or symbol that can characterize a subject's insulin resistance level in a range of from low (e.g., insulin sensitive) to high (a greater degree of insulin resistance).
- According to the invention, the index is provided as a numerical score. The term "score" refers to a result expressed numerically, typically on a defined scale or within a defined range of values. In particular embodiments, the lipoprotein insulin resistance index can be provided as or include a score within a defined range, such as, for example, between 0-10, 0-24, 0-100, or 0-1000 and the like (with the lowest number being associated with most insulin sensitivity or associated with a low insulin resistance and the highest number in the range being associated with the most insulin resistance or a higher degree of insulin resistance). The lower value in the range may be above "0" such as 1, 2, 3, 4 or 5 and the like, or may even be a negative number (e.g., -1, -2, -3, 4, -5 and the like). Other index examples (outside the scope of the invention), include, for example, alphanumeric indexes such as "100A", "100B", terms such as "IR positive", "IR high", "IR neutral", "IR low", "IR good" , "IR bad", "IR watch" and the like.
-
Figures 2A and2B illustrates exemplary patient test reports 10 with theinsulin resistance index 50 and lipoprotein particle measurements asinsulin resistance markers 20 that can each be treated as independent risk factors (each has an independent association with insulin resistance). With this information, patients can be alerted to a heightened risk of developingtype 2 diabetes, before becoming overtly "pre-diabetic", potentially in time for effective lifestyle modification to prevent, not just delay, the onset of that disease. Thereport 10 can be electronically provided to a clinician or patient and/or provided as a "paper" report. - The
report 10 can provide theindex 50 as a "bare bones" index (e.g., score) alone or with a lipoprotein-based test/screen for cardiovascular disease or "CVD" 70. Cardiovascular disease (CVD) is a general term used to describe disorders that can affect your heart (cardio) and/or your body's system of blood vessels (vascular). The same biosample can be used to generate both theCVD analysis 70 and theindex 50. - As shown, the
test report 10 can show theinsulin resistance markers 20 which are used to calculate or determine theindex 50. (However, these parameters may be omitted from the report as noted above). Themarkers 20 can include a plurality of the following (shown as all of the following six lipoprotein particle parameters), concentrations of large VLDL-P 21, small LDL-P 22, large HDL-P 23, andVLDL size 24,LDL size 25, andHDL size 26. TheVLDL size 24,LDL size 25, andHDL size 26. As noted above, the size parameters may be measured as "average" particle size, however, other size demarcations may be used. - A set of possible
respective risk scores 30 can be defined based on the differential strengths of association for each of the lipoprotein parameters used asinsulin resistance markers 20 which can be used to determine theindex 50. That is, a risk score for a lipoprotein measurement value or range of values can be defined for each lipoprotein particle parameter. The risk scores 30 for different values of the different parameters 21-26 are pre-defined, one for a value or range of values oflipoprotein measurements 30p. Theactual measurement 30p is correlated to one of the defined risk scores 30 for thatparameter 20 and this number provides therisk score 40 for that lipoproteinparticle parameter measurement 30p for that patient. -
Figure 2A shows that the risk scores vary from 0-4 and that thepatient risk score 40 formarker 21 is "4" and a total largest possible index number of 24.Figure 2B uses different ranges ofrisk scores 30 from, for example 0- 26, 0-27 or 0- 32 for one parameter and 0-8, 0-4 and 0-6 for another (depending on the type of sample and the calculation model used) with different value ranges and scoring numbers for each parameter and with eachlipoprotein parameter 20 having a different possible high end risk score number with a total largest possible index number of 100. The largestpossible risk score 30 for ameasurement 30p of thelipoprotein parameters 20 inFigure 2B is forVLDL particle size 24. LargeVLDL particle concentration 21 has the second largest possiblerisk score number 30.Figure 2B illustrates that therisk score 40 for large VLDL-P concentration 21 is greater than thescore 40 forVLDL particle size 24 for this patient. Thedifferent risk scores 30 are not shown on thereport 10 inFigure 2B . - It is contemplated that, to determine the
index 50, an equation can be used to combine the different scores 40. To generate or provide thescore 40 for anactual measurement 30p for aparameter 20, the associatedrisk score 30 can be selected from a set of predefined risk scores for a respective lipoprotein parameter or the risk score can be calculated using an equation that correlates a risk score to the actual measurement. - As shown in
Figures 2A and2B , thereport 10 can provide a "transparent"risk model 10R for the risk markers 20 (21-26).Figures 2A and2B also illustrate that the lipoproteininsulin resistance index 50 may be provided with ascale 60 that represents a possible continuum of results from insulin sensitivity/low insulin resistance to high insulin resistant to illustrate the range of possible results. - It is contemplated that the
index 50 may be calculated differently for different samples depending on whether the specimen/sample for the lipoprotein measurements was a fasting or non-fasting sample/specimen and/or if the patient is on lipid-altering medication. (However, it should be noted that the present invention is concerned with non-fasting samples only.) Theindex 50 and/or scoring of themarkers 20 may also be gender-specific (the risk score may be different for the same lipoprotein particle measurement for a female versus a male). Alternatively, thereport 10 and orindex 50 may be calculated the same irrespective of whether the patient was on lipid altering medications or whether the specimen was a fasting or non-fasting type. For example, if the former, if a patient is on statins, theindex 50 may be calculated by eliminating the small LDL particle concentration as one of therisk markers 20 and the total possible index or range can be reduced accordingly. Alternatively, in some particular embodiments, it is contemplated that as the small LDL particle concentration is only 1 of 6potential markers 20, theindex 50 can be calculated in the same manner irrespective of whether a patient is on statins, as the overall index may not be materially affected. - Each
marker 20 can have a separately calculatedrisk score 40 depending on the patient's measurement of thatmarker 20. The pre-defined risk scores 30 that are used to define the respective patient score 40 can be defined based on whether a measured lipoprotein particle value is in a lower or higher segment (typically defined by different quintiles) of population norms, lower risks have lower scores. Eachmarker 20 can have a risk range that is the same, e.g., 0-4, 0-10, 0-25 and the like or eachmarker 20 or somemarkers 20 can have a risk range that is different from others. For example, a non-linear equation can be used to generate theindex 50. The ranges ofrisk scores 30 can be different and at least one of thelipoprotein particle parameters 20 can have a higherpossible risk score 30 than others. See, e.g., Tables 1-3 below. - In
Figure 2A , the possible risk scores for eachmarker 20 are from 0-4, for a total highest possible number of 24. The score values 30 of eachrisk marker 20 increase, typically in successive integer values. However, the score values 30 can be non-successive and are not required to be integers. - The score values 30 can increase for a particular measurement value or a range of
values 30p which in the embodiment shown inFigure 2A may be provided in segments of different successive quintile ranges ofvalues 30 for each of thedifferent markers 20 associated with different lipoprotein parameter values 21-26 in a direction associated with increased insulin resistance risk (per the arrow 42) from a high insulin sensitivity (or low insulin resistance) at a defined range ofvalues 30 with a risk score of "0" to agreater score 30 associated with a greater degree of insulin resistance associated with a marker value in a different quintile range. - Alternatively, one or
more markers 20 may have a different risk scale with higher scores assigned to its measurement ranges than to those of other markers, and the scores need not be incremental or successive integers (e.g., the scores can be, for example, 0, 1, 3, 5 and 7 (or more), for the respective different quintiles for the VLDL-P concentration measurement). In addition, the lowest number may be negative or above "0". - While certain of these lipoprotein parameters 21-26 have stronger independent correlations (independent risk contributors) with insulin resistance than others, the
index 50 can be calculated to include both those of higher and lower contributors (e.g., some of the information provided by some of the parameters may be redundant with the information provided by another of the parameters). For example, using four or more of thedifferent lipoprotein parameters 20 to generate the index 50 (e.g., a composite index that considers several different lipoprotein particle measurements each of which can be associated with insulin resistance) can help theindex 50 be a more reliable or stable indicator (e.g., similar to a time average measurement) as the test is typically taken at a single point in time with a single sample. That is, at any one point in time for a particular patient, any single factor can be subject to patient and/or analytic variation. Using a plurality of the lipoprotein risk markers, typically at least four, and in some embodiments, the six shown inFigures 2A and2B , can provide a better and/or morestable index 50. -
Figures 2A and2B illustrate an exemplary simple and easy-to-understandreport 10 that includes the predictive information supplied by the NMRinsulin resistance markers 20. Patient results 30p for each of the six markers 21-26 are shown or displayed.Figure 2A shows areport 10 with apatient measurement 30p and adjacent and aligned therewith areboxes 30b showing the ranges of data in segments associated withdifferent risk scores 30, shown here as corresponding to quintiles of a reference population of non-diabetic individuals (in this example, using MESA as the source of this normal range data). As shown, thequintile boxes 30b are arrayed from left to right according to their relationships with insulin resistance, with those denoting the highest insulin resistance to the far right. A marker score 30 (e.g., from 0 to 4) is assigned to each box (e.g., population sub-group), higher numbers corresponding to values associated with greater insulin resistance. The appropriate boxes corresponding to the patient's measured results for each of the six parameters can be visually enhanced 31 (such as highlighted, shown in bold, red or in another visually enhanced manner). The patient measurement results in ascore 40 for each of these sixboxes 31 that may be summed to give the lipoproteininsulin resistance index 50. As shown inFigure 2A , theindex 50 is a number in this example that is between 0 to 24 (4+3+4+3+4+4=22 in the example inFigure 2A ). Thisindex score 50 can be displayed at the bottom of thereport 10 and/or in other locations, such as at the top. As shown, thereport 10 can also show the relative degree of risk with a visual arrow/scale orruler 60 depicting that higher scores indicate an increasingly greater likelihood that the patient has a higher degree of insulin resistance. -
Figure 2B illustrates that eachmeasurement 30p can be shown adjacent to a scale of low to high, high to low, small to large and small to large, all arranged to show increasing risk in the same direction. Theactual risk score 40 can be indicated by a visual marker. As shown, a triangle indicate the percentile value of the measured subclass/size 30p ofvariable 20, to provide an indication of where along the continuum of low to high values the patient's value is situated. Thepossible scores 30 are not indentified on this report. - In some embodiments, the
index 50 can provide a predictor of a patient's insulin resistance status as a continuum, with anindex 50 that is closer to the maximum representing a higher degree of insulin resistance and a higher risk of developing diabetes, rather than making a categorical diagnosis of the presence or absence of insulin resistance. This type ofindex 50 of metabolic abnormality may help a clinician convince a patient to exercise, change a diet and/or lose weight to influence (and reduce and/or favorably alter) thisindex 50 -- preventing the onset of pre-diabetes and ultimately, diabetes. - However, it is possible that a patient having an
index 50 in the top quartile, e.g., above 18 or between 18-24 in the score range shown inFigure 2A or at or above the 75th percentile level inFigure 2B , may be diagnosed with pre-diabetes and/or recommended for further medical evaluation to assess glucose abnormalities to confirm this condition. - Again, the
exemplary reports 10 illustrate an easy to understand format with a relatively "transparent" summary of risk byrelevant marker 20, but other embodiments of the invention envision generating and providing theinsulin resistance index 50 in "opaque" form, e.g., as a single number without the details of the independent lipoprotein parameter values and associated risk values defined for these markers. If this format is used, thescale 60 may optionally also be provided. - Tables 1-3 show exemplary equations and
risk scores 30 that can be associated with different measurements of thelipoprotein parameters 20. The risk score data can be used to generate anindex 50 in a range of between 0-100, such as that shown with respect to theindex 50 shown in the report ofFigure 2B . - Tables 1-3 are tables that show the six lipoprotein parameters 21-26 (
Figures 2A ,2B ) noted above with risk scores 30 (identified with the word "score" in the tables) correlated to measurement values or ranges of values of the lipoprotein parameters in adjacent columns. Table 1 showsexemplary scores 30 used to calculate theindex 50 for females while Table 2 shows the same information for males. Thus, Table 1 and 2 illustrate examples of genderspecific indices 50. As shown, the parameter risk scores 30 are parameter-specific and, for particular lipoprotein measurements of a respective parameter 21-26, can be different for the same value/range of values for females and males. Table 3 illustrates a genderneutral index 50 andrisk scores 30 for thelipoprotein parameters 20.Table 1. Female Lipoprotein Insulin Resistance Index Calculation Data Female LP-IR Index: LP-IR (F) = vszsc + Iszsc + hszsc + vlpsc + Ispsc + hIpsc (Equation 1) VLDL Size (nm) vszsc score LDL Size (nm) Iszsc score HDL Size (nm) hszsc Score Large VLDL-P (nmol/L) vIpsc score Small LDL-P (nmol/L) Ispsc score Large HDL-P (µmol/L) hIpsc score <39.2 0 <20.6 8 <8.8 19 <0.4 0 <90 0 <3.1 14 39.2-41.1 1 20.6-20.9 7 8.8-8.9 17 0.4-0.6 1 90-104 1 3.1-4.0 13 41.2-42.7 2 21.0-21.1 6 9.0 12 0.7-1.1 3 105-128 3 4.1-4.7 12 42.8-44.3 3 21.2 3 9.1-9.2 10 1.2-1.3 5 129-372 4 4.8-5.4 11 44.4-46.0 4 21.3-21.4 1 9.3 8 1.4-1.5 7 373-484 6 5.5-6.3 9 46.1-48.1 5 >21.4 0 9.4 6 1.6-1.7 10 485-600 7 6.4-7.1 7 48.2-49.1 6 IdIdif<150** 4 9.5 4 1.8-2.5 13 >600 8 7.2-8.0 4 49.2-50.3 7 9.6-9.7 2 2.6-3.1 15 8.1-9.3 2 50.4-51.6 8 >9.7 0 3.2-3.7 17 >9.3 0 51.7-53.2 9 hdIp<5*** 8 3.8-5.1 19 53.3-55.3 10 5.2-7.3 21 55.4-58.4 13 7.4-11.7 22 58.5-60.0 16 >11.7 24 60.1-63.0 20 >63.0 27 vtg<30* 0 *vtg = VLDL triglyceride (mg/dL); **IdIdif = LDL minus IDL particle number (nmol/L); ***hdIp = HDL particle number (nmol/L) Table 2. Male Lipoprotein Insulin Resistance Index Calculation Data Male LP-IR Index: LP-IR (M) = vszsc + Iszsc + hszsc + vIpsc + Ispsc + hIpsc (Equation 2) VLDL Size (nm) vszsc score LDL Size (nm) Iszsc score HDL Size (nm) hszsc Score Large VLDL-P (nmol/L) vIpsc score Small LDL-P (nmol/L) Ispsc score Large HDL-P (µmol/L) hIpsc score <39.2 0 <20.8 4 <8.5 17 <0.7 0 <94 0 <1.9 10 39.2-41.1 3 20.8-20.9 3 8.5-8.6 15 0.7-0.9 3 94-332 1 1.9-2.3 9 41.2-42.7 5 21.0 2 8.7 13 1.0-1.1 6 333-472 2 2.4-2.7 8 42.8-44.3 8 >21.0 0 8.8 10 1.2-1.7 9 473-568 3 2.8-3.1 7 44.4-46.0 10 IdIdif<150** 2 8.9 8 1.8-2.6 12 569-672 4 3.2-3.5 6 46.1-48.1 12 9.0 6 2.7-4.1 15 673-767 5 3.6-4.1 4 48.2-49.1 15 9.1 4 4.2-6.1 18 768-869 6 4.2-4.9 3 49.2-50.3 18 9.2 1 6.2-9.1 21 870-991 7 5.0-5.9 1 50.4-51.6 21 >9.2 0 9.2-14.1 23 992-1166 8 >5.9 0 51.7-53.2 24 hdIp<5*** 6 >14.1 24 >1166 9 53.3-55.3 27 55.4-58.4 30 58.5-63.0 33 >63.0 36 vtg<30* 0 *vtg = VLDL triglyceride (mg/dL); **IdIdif = LDL minus IDL particle number (nmol/L); ***hdIp = HDL particle number (nmol/L) Table 3. Non-Gender Specific Lipoprotein Insulin Resistance Index Calculation Data Non-Gender-Specific LP-IR Index: LP-IR = vszsc + Iszsc + hszsc + vIpsc + Ispsc + hIpsc (Equation 3) VLDL Size (nm) vszsc score LDL Size (nm) Iszsc score HDL Size (nm) hszsc score Large VLDL-P (nmol/L) vIpsc score Small LDL-P (nmol/L) Ispsc score Large HDL-P (µmol/L) hIpsc score <39.2 0 <21.0 6 <8.7 20 <0.7 0 <90 0 <3.1 12 39.2-41.1 1 21.0 5 8.7 16 0.7-1.0 2 90-104 1 3.1-4.0 10 41.2-42.8 2 21.1 3 8.8 12 1.1-1.3 5 105-128 3 4.1-5.4 9 42.8-44.3 4 21.2 2 8.9 10 1.4-1.5 7 129-372 4 5.5-6.3 8 44.4-46.0 6 >21.2 0 9.0 9 1.6-1.7 9 373-961 6 6.4-7.1 6 46.1-48.1 9 IdIdif<150** 3 9.1-9.2 7 1.8-2.5 12 >961 8 7.2-8.0 4 48.2-50.3 10 9.3 5 2.6-3.7 15 8.1-9.3 2 50.4-51.6 11 9.4-9.5 4 3.8-5.3 18 >9.3 0 51.7-53.2 12 9.6-9.7 2 5.4-7.9 19 53.3-55.3 15 >9.7 0 >7.9 22 55.4-58.4 18 hdIp<5*** 8 58.5-61.0 19 61.1-63.0 22 63.1-64.1 25 64.2-65.1 28 >65.1 32 vtg<30* 0 *vtg = VLDL triglyceride (mg/dL); **IdIdif = LDL minus IDL particle number (nmol/L); ***hdIp = HDL particle number (nmol/L) - Thus, while Equations 1-3 are the same, the
scores 30 available for the subjects are different based on gender specific risk score (or a unisex risk score) potentially resulting in a somewhat different value for theindex 50 using the same measurements for a particular patient. - Strong associations between insulin resistance and the six lipoprotein particle concentration and
size parameters 20 measured by the NMR LipoProfile® lipoprotein test, available by LipoScience, Inc., having a principal place of business in Raleigh, NC, have been documented in two published studies and a large unpublished study, each using a different measure of insulin resistance. These associations are summarized in Table 4. The first published study was conducted at the Medical University of South Carolina (MUSC) on a relatively small number of subjects (n=148: 46 with untreated diabetes; mean age 37y; 43% male; 66% Caucasian) ( Garvey WT et al. Effects of Insulin Resistance and .). Insulin resistance was measured using the gold standard euglycemic clamp method, and the NMR LipoProfile® lipoprotein tests were conducted on frozen fasting serum specimens. - The second published study was the Insulin Resistance Atherosclerosis Study (IRAS) ( Goff DC Jr et al. Insulin resistance and adiposity influence lipoprotein size and subclass concentrations. Results from the Insulin Resistance Atherosclerosis Study. Metabolism 2005;54:264-70 ). NMR LipoProfile® lipoprotein analyses were conducted on frozen plasma samples from 1,371 participants with a mean age of 55.5 years. The study population was 55% women and approximately one-third each were African Americans, Hispanic Americans, and non-Hispanic whites. 46% were normoglucose tolerant, 22% had impaired glucose tolerance, and 32% had diabetes. Insulin resistance was measured by the frequently sampled intravenous glucose tolerance test.
- The third (unpublished) study is the Multi-Ethnic Study of Atherosclerosis (MESA). MESA is a large, NHLBI-sponsored observational study of 6,814 white, black, Hispanic, and Chinese men and women aged 45-84 years with no evidence of clinical cardiovascular disease. Fasting blood samples were collected at the baseline exam (2000-2002) from all participants. Serum glucose was measured by the Vitros analyzer (Johnson & Johnson Clinical Diagnostics) and insulin was determined by radioimmunoassay using the Linco Human Insulin Specific RIA kit (Linco Research). HOMA (homeostasis model assessment of insulin resistance index) was calculated as insulin (mU/l) x (glucose [mg/dl] x 0.055)/22.5 and values were natural log-transformed for analysis. NMR LipoProfile® lipoprotein test measurements were conducted at LipoScience on frozen baseline plasma specimens. Development of both gender-specific and non-gender-specific lipoprotein insulin resistance score algorithms was guided in part by data from the subset of MESA participants without diabetes who provided informed consent and were not taking any lipid-altering medications (n=4,085).
Table 4. Correlations of NMR-Measured Lipoprotein Subclasses and Particle Sizes with Different Measures of Insulin Resistance in 3 Studies* Subclass/Size Parameter GDR in MUSC1 (n=148) Si in IRAS2 (n=1371) HOMA in MESA3 (n=4085) Large VLDL-P -0.35 -0.32 0.45 Small LDL-P -0.36 -0.34 0.37 Large HDL-P 0.29 0.31 -0.39 VLDL Size -0.40 -0.38 0.38 LDL Size 0.30 0.34 -0.35 HDL Size 0.30 0.33 -0.36 *Values are Spearman correlation coefficients for the lipoprotein subclass/size associations with the measures of insulin resistance used in the 3 studies.
1Correlations (all p<0.001) with glucose disposal rate (GDR) measured by the euglycemic clamp method, adjusted for age, gender, race, and BMI (Garvey et al. Diabetes 2003;52:453-62). GDR is inversely proportional to insulin resistance. The study population included 46 individuals with untreated diabetes.
2Correlations (all p<0.001) with insulin sensitivity (Si) measured by the frequently sampled intravenous glucose tolerance test, adjusted for age, gender, and ethnicity (Goff et al. Metabolism 2005;54:264-70). Si is inversely proportional to insulin resistance. The study population included 437 individuals withtype 2 diabetes.
3Correlations (all p<0.001) with the HOMA estimate of insulin resistance determined from fasting insulin and glucose concentrations. The study population was restricted to non-diabetic subjects not treated with lipid-altering drugs. - Table 5 shows the gender-specific percentile distributions of HOMA values in the MESA non-diabetic population. Also shown are the natural log-transformed values of HOMA, In(HOMA), which are more closely and linearly related to the gold standard euglycemic clamp measure of insulin resistance. In Table 6 are the percentile distributions of the six NMR subclass and particle size markers of insulin resistance in men and women separately and combined.
Table 5. Distributions of HOMA and ln(HOMA) Values in MESA (n=4085)* Percentile 10th 25th 50th 75th 90th HOMA All 0.5 0.8 1.2 1.9 2.9 Men 0.5 0.8 1.3 2.0 3.0 Women 0.5 0.7 1.1 1.8 2.7 In(HOMA) All -0.7 -0.3 0.2 0.6 1.0 Men -0.6 -0.3 0.2 0.7 1.1 Women -0.7 -0.3 0.1 0.6 1.0 *Excluding subjects with diabetes and those on lipid-altering drugs. 
- Linear regression models were analyzed to quantitatively assess the comparative ability of each of the six NMR subclass/size parameters 21-26 to predict insulin resistance. The results, shown in Table 7, indicate that each of the subclass/size parameters has a statistically significant association with insulin resistance, though they differ in strengths of association. The strongest individual association was with the large VLDL-P subclass, with a 1 standard deviation increment of this parameter corresponding to a 0.29 increase in In(HOMA). The associations of the NMR subclass/size parameters with insulin resistance are comparable to those for triglycerides and HDL-C. See, e.g., McLaughlin et al., Use of metabolic markers to identify overweight individuals who are insulin resistant, Ann. Intern. Med. 2003: 139: 802-9. Combining the information from a plurality of (e.g., the 6 NMR) measures into an index 50 (referred to below as a composite "LP-IR score") enhanced the association with insulin resistance substantially, with the gender-specific score performing slightly better than the non-gender-specific score.
Table 7. Associations of Lipids, Lipoprotein Subclass and Size Parameters, and LP-IR Index/Score with Insulin Resistance as Assessed by ln(HOMA) in Non-Diabetic Subjects in MESA (n=4085; 1955 men; 2130 women) Lipid or Lipoprotein Measure Mean (SD) Median (IQ Range) Δ In(HOMA) (SE) per 1-SD p value Model R 2 Triglycerides, mg/dL 122 (64) 107 (76-153) 0.24 (0.01) <0.0001 0.127 HDL-C, mg/dL 52(15) 49 (41-60) -0.25 (0.01) <0.0001 0.147 Triglyceride/HDL-C 2.7 (1.9) 2.1 (1,4-3.5) 0.28 (0.01) <0.0001 0.182 Large VLDL-P, nmol/L 4.8 (5.8) 2.4 (0.8-6.5) 0.29 (0.01) <0.0001 0.192 Small LDL-P, nmol/L 530 (392) 507 (112-812) 0.23 (0.01) <0.0001 0.126 Large HDL-P, µmol/L 5.7 (3.3) 4.9 (3.2-7.5) -0.25 (0.01) <0.0001 0.147 VLDL Size, nm 48.0 (7.7) 46.3 (42.2-52.1) 0.24 (0.01) <0.0001 0.136 LDL Size, nm 20.8 (0.5) 20.9 (20.4-21.2) -0.22 (0.01) <0.0001 0.109 HDL Size, nm 9.3 (0.5) 9.2 (8.9-9.6) -0.23 (0.01) <0.0001 0.123 LP-IR Score1 (0-100) 43 (23) 43 (25-61) 0.34 (0.01) <0.0001 0.264 GS LP-IR Score2 (0-100) 42 (25) 42 (21-62) 0.34 (0.01) <0.0001 0.267 Data are from separate unadjusted linear regression models. The strengths of association with insulin resistance are expressed as Δ In(HOMA), the difference in In(HOMA) associated with a 1-standard deviation increment of each lipid or lipoprotein measure. The analyses used log-transformed values of triglycerides, triglyceride/HDL-C ratio, and large VLDL-P. Median In(HOMA) was 0.15and values ranged from -1.97 (most insulin sensitive) to 2.43 (most insulin resistant). Model R2 values give a measure of the goodness of fit of the different models (higher R2 values indicating better insulin resistance prediction).
Non-gender-specific LP-IR score. 2Gender-specific LP-IR score - When only non-fasting specimens are available for analysis, it is still possible to assess insulin resistance using a modified "non-fasting" index that can omit large VLDL-
P 21 andVLDL size 24 from the calculation, since these two parameters are the only ones appreciably affected by non-fasting status (both giving higher values in non-fasting versus fasting blood samples). - Another measure of the performance of the lipoprotein insulin resistance index as a continuous indicator of insulin resistance is shown graphically in
Figure 3A . Plotted are the mean ln(HOMA) values and 95% confidence intervals for the non-diabetic MESA participants as a function of their (non-gender-specific) LP-IR scores. The results show a strong, linear relationship between the LP-IR score and In(HOMA), indicating that the relative insulin sensitivity of patients can be usefully assessed using lipoprotein subclass/size information from a single (fasting) NMR LipoProfile measurement. - Since fasting glucose levels are reflective of insulin resistance and are the most well-accepted indicator of a patient's risk of developing T2DM, the extent to which the index 50 (e.g., LP-IR score) adds to fasting glucose in assessing insulin resistance was examined. Mean ln(HOMA) values were determined in subgroups stratified by quartile of fasting glucose and (non-gender-specific) LP-IR score. As shown in
Figure 3B , individuals within each glucose category exhibited a range of ln(HOMA) values that were strongly associated with LP-IR score. As expected, given that glucose levels are used in the calculation of HOMA, there was also a relation of glucose level with ln(HOMA) within each LP-IR category. - Advantageously, since the NMR LipoProfile® lipoprotein test can measure the plurality (e.g., six) subclass/
size lipoprotein parameters 20 simultaneously without requiring added cost, equipment or time, the information from thedifferent parameters 20 can be combined (e.g., typically all six measures where fasting samples are analyzed while typically four measures can be combined for non-fasting samples) to predict the level or degree of insulin resistance and/or the risk of developing insulin resistance disorders including, for example, T2DM. The risk prediction can come both from the extent to which the different parameters give independent, additive prediction and/or the advantage that multiplexed information has (even if redundant) in helping overcome the limitations of prediction based on a single measurement taken at one time point. If other test techniques are used (e.g., ultra-centrifugation) where the different lipoprotein parameter data is not readily obtained, then a reduced number of lipoprotein parameters may be used. - The data indicates that the insulin sensitivity of individual patients can be accurately assessed using information obtained from a single test, such as, for example, a single NMR LipoProfile® insulin resistance test. It is believed that some patients may not be receptive to fasting tests or may not be willing to return for a test but are receptive to blood work during a planned doctor visit and the availability of a non-fasting test may be able to provide tests for those patients.
- Risk assessments provided by embodiments of the invention can be routinely included in a standard overall lipoprotein profile analysis protocol for any individual undergoing a cholesterol or lipoprotein profile. Indeed, the methods of the instant invention can be conveniently and quickly automatically applied to NMR-based lipoprotein profile tests and thereby cost-effectively provide risk information, even while a patient is without symptoms. No additional blood samples are required beyond a standard cholesterol sample and the individual need not be exposed to the relatively time-consuming extended glucose tests. Such a quick and routine test can potentially allow increased numbers of now readily identifiable at-risk patients to undergo drug therapy and/or lifestyle changes to prevent the onset of insulin resistance disorders.
-
Figure 4 is a flow chart of exemplary operations that can be used to carry out embodiments of the present invention. It is noted that the present invention is limited to an analysis of non-fasting blood samples (i.e. blocks 110, 120, 125, 123). An in vitro blood sample (collected from a subject) can be obtained and introduced to an NMR analyzer (spectrometer). The subject may be suspected of being at risk for developing insulin resistance and/orType 2 diabetes or developing insulin resistance. Alternatively, the subject may be undergoing a lipoprotein profile screening as part of an overall assessment of health or for reasons other than suspicion of being at risk forType 2 diabetes or other insulin resistance disorder (such as screening for coronary heart disease). The blood sample may be collected according to known techniques, and may be a blood plasma sample, or a blood serum sample. The blood sample is then analyzed by NMR spectral analysis to measure lipoprotein parameters (block 100). The type of blood sample can be determined (block 110). That is, embodiments of the invention contemplate that a common NMR analyzer will be used to assess risk using both fasting and non-fasting blood samples and the samples can be identified to allow the proper test analysis. Alternatively, only one type of blood sample can be processed in a single test system, obviating the need for whether a blood sample is a fasting or non-fasting sample type. The sample type can be identified using a different color collection label or tube and associated bar code that can be input to the system to order the desired testing protocol. In some embodiments, the same testing protocol can be used for both sample types and the values that are not used for that sample type can simply be suppressed, discarded or otherwise disregarded. Thus, for a non-fasting sample, any glucose measurement (where made) and/or a VLDL-P concentration or VLDL size measurement can be optionally disregarded, e.g., not used to calculate the insulin-resistance index 50. - If the blood sample is a fasting blood sample (block 130, outside the scope of the present invention) the insulin resistance index can be calculated using a composite score that adds the risk scores 40 of a plurality of (typically all six) different lipoprotein parameters 20 (block 135). An NMR glucose measurement can also be obtained (block 138). In particular embodiments, the risk numbers for concentrations of large VLDL-P, small LDL-P and large HDL-P and VLDL size, LDL size and HDL size can be determined and added together to define the insulin resistance index 50 (block 137). Optionally, if the glucose level is elevated, e.g., at or above 90 mg/dL (e.g., either FG between 100-125 mg/dL or FG >125 mg/dL) this glucose test result can override the
index 50 or buttress the risk associated with theindex 50 to identify that the patient is likely to have insulin resistance disorders and/or T2DM (block 140). Where used, the glucose measurement can be considered and for a FG < 90 mg/dL value or a value that is less than about 100 mg/dL, this measurement can confirm that the patient is insulin sensitive (before the onset of undue insulin resistance or pre-diabetes). - If, according to the present invention, the blood sample is a non-fasting blood sample (block 120) the
insulin resistance index 50 can be calculated using a composite score that adds the risk scores 40 for concentrations of small LDL-P and large HDL-P and LDL size and HDL size can be determined and added together to define the (composite) insulin resistance index 50 (block 123). - It is contemplated that additional lipoprotein parameters with associated risk scores can be added together for the non-fasting samples to generate the insulin resistance index and/or that the risk scores 40 for one or more of the
parameters 20 may be weighted in the index calculation. - In some embodiments, the testing system/method can be configured to identify whether a patient is on any lipid altering medications, e.g., (whether a non-diabetic patient is taking the lipid altering medications). This can allow the system/method to calculate the index with a different set of the six lipoprotein parameters (and adjusted maximum score) or weight the
parameters 40 or use alternate risk scores 30, e.g., analyze the sample differently than the analysis used for other samples. For example, for a patient taking statins, the risk score may be calculated the same as for other patients or the index may be calculated by excluding the concentration of small LDL particles (and reducing the overall potential index number). - In some embodiments, the
index 50 can be calculated in alternate ways and provided to a clinician. Similar adjustments in the total index score possible and/or which of the sixlipoprotein parameters 20 to exclude or to adjust the associated risk scores 30 can be based on medication that the patient is taking and what lipid alterations are associated with same. - As is known, because the observed CH3 lineshapes of whole plasma samples are closely simulated by the appropriately weighted sum of lipid signals of its constituent lipoprotein classes, it is possible to extract the concentrations of these constituents present in any sample. This is accomplished by calculating the weighting factors which give the best fit between observed blood plasma NMR spectra and the calculated blood plasma spectra. Generally speaking, the process of NMR lipoprotein analysis can be carried out by the following steps: (1) acquisition of an NMR "reference" spectrum for each of the "pure" individual or related groupings of constituent lipoprotein classes and/or subclasses of plasma of interest, (2) acquisition of a whole plasma NMR spectrum for a sample using measurement conditions substantially identical to those used to obtain the reference spectra, and (3) computer deconvolution of the plasma NMR spectrum in terms of the constituent classes and/or subclasses (or related groupings thereof) to give the concentration of each lipoprotein constituent expressed as a multiple of the concentration of the corresponding lipoprotein reference.
- As used herein, the term "NMR spectral analysis" means using proton (1H) nuclear magnetic resonance spectroscopy techniques to measure the lipoprotein parameters present in blood plasma or blood serum, or to measure the concentration or "level" of glucose present in blood plasma or blood serum. "Measuring" a lipoprotein parameter (class or subclass) refers to determining a parameter of the lipoprotein class or subclass, such as the concentration of the lipoprotein class or subclass or the average particle size thereof.
- More specifically, one may use systems and methods that acquire proton NMR data from a sample of blood plasma or serum, process the acquired NMR data to produce a chemical shift spectrum, and deconvolute the spectrum in terms of the reference spectra of subclasses of the major classes of lipoprotein to give the concentration of each of the lipoprotein constituents and the distribution of subclasses of the constituents. The systems and methods may optionally also acquire proton NMR data from a sample of blood plasma or serum, process the acquired NMR data to produce a chemical shift spectrum, and deconvolute the spectrum in terms of the reference spectrum of glucose to give the concentration of glucose in the blood serum or blood plasma sample.
- Although the procedure can be carried out on lipoprotein classes, carrying out the process for subclasses of lipoproteins can decrease the error between the calculated lineshape and the NMR lineshape, thus increasing the accuracy of the measurement while allowing for simultaneous determination of the subclass profile of each class. Because the differences in subclass lineshapes and chemical shifts are small, it is typically important to correctly align the reference spectrum of each subclass with the plasma spectrum. The alignment of these spectra is accomplished by the alignment of control peaks in the spectra, which are known to respond in the same manner to environmental variables, such as temperature and sample composition, as do the lipoprotein spectra. One such suitable alignment peak is the peak produced by CaEDTA, although other EDTA peaks or suitable peak may be utilized. By alignment of the spectra, the small variations in the subclasses' lineshapes and chemical shifts may be exploited to produce higher accuracy and subclass profiles. Further description of deconvolving methods for NMR signals can be found in
U.S. Patent Nos. 4,933,844 ;5,343,389 ; and7,243,030 . - Thus, the concentrations and sizes of the lipoprotein parameters of interest can be determined by acquiring reference spectra of individual lipoprotein classes and/or subclasses. The reference spectra are then stored, such as in electronic memory and/or a computer program, to provide a reference basis for evaluating additional blood samples or serum samples. The NMR spectroscopy-derived spectra associated with the individual lipoprotein classes and subclasses are substantially invariant across the population. As such, the NMR reference spectra (lineshapes and amplitudes) of individual lipoprotein constituents can be used as a "key" to "deconvolute" the composite signal associated with an individual's whole blood plasma (or blood serum). In this way, a single reference set can be used as a basis to determine the lipoprotein profile of other blood samples (when taken at a substantially constant temperature and magnetic field).
- More particularly stated, one assigns a scalable coefficient to the individual reference constituent standards and takes the sums of the scalable (weighted) individual constituent parameters. An NMR spectroscopy analysis is generated for a desired blood plasma or serum specimen (taken at the same magnetic field strength and temperatures used for the reference spectra) to provide an actual (measured) composite blood plasma spectra signal. The preferred method of the present invention then manipulates the scalable reference spectra until the sum of the scalable coefficients substantially "fits" the composite signal value. The value of the scalable coefficient is then used to determine the actual concentration values for the lipoprotein constituents in the blood plasma sample of that individual.
- In addition to determining parameters of the lipoprotein classes and/or subclasses, the NMR spectral analysis may also be used to measure the parameters of other constituents of blood such as the concentration of triglycerides, protein, and chylomicrons in the blood sample.
- As discussed above, the concentration of glucose in a blood sample of the invention can be measured, typically also using NMR spectral analysis concurrently with the NMR-based measurement of the lipoprotein values in the same blood sample. As used herein, the word "concurrently" means sufficiently close in time to be able to be performed during one NMR "run" or measurement event (that is, "concurrently" may be simultaneously, or it may be two or more events occurring within a short time period before or after each other, or it may be an NMR evaluation performed on the same sample, or samples taken from the patient in a single blood withdraw session, or samples taken from a single venipuncture once patency is established).
- Patients with moderately elevated fasting glucose levels are at an increased risk of developing
Type 2 diabetes. Accordingly, one can determine the concentration of glucose in a sample of blood plasma by 1H NMR spectral analysis. This is done by comparing the 1H-NMR spectrum of the sample to the spectrum of a sample with a known glucose concentration. By comparing the difference in intensities of the sample spectra, the concentration of glucose in the spectrum can be calculated. -
Figure 5 shows the proton NMR spectrum of blood plasma, with a glucose fitting region with two peaks between about 3.55 - 3.50 (ppm) in the proton NMR spectrum that can be used to determine the glucose level.Figure 6 shows an expansion of the region of the blood plasma spectrum where glucose signals are observed, the two peaks being specifically indicated within the glucose fitting region. The peaks in the glucose fitting region may be used for the quantitative determination of glucose. The data points in the reference or standard spectrum and patient glucose sample spectra are aligned using a line-shape fitting process as described herein to find the "best fit," and the intensity of the standard spectrum is scaled to match the sample spectrum. The glucose concentration of the standard is multiplied by the scaling factor used to match the sample lineshape to give the glucose concentration of the blood sample. - Stated differently, in this glucose measurement method, an NMR reference data spectrum corresponding to glucose in a reference blood plasma or serum sample or specimen is acquired and stored in computer memory. A reference coefficient is assigned to one glucose signal or group of glucose signals ("reference glucose lineshape") in the reference spectrum, the value of which is based on the glucose concentration of that reference specimen determined by an independent chemical glucose measurement. An NMR spectrum of a patient's blood plasma or serum specimen is acquired at some later time under measurement conditions (substantially) identical to those used to obtain the glucose reference spectrum and stored in computer memory. That is, for example, the NMR data spectrums are obtained under the same magnetic field strength and specimen temperature. The reference glucose lineshape is compared with the same glucose signal or group of signals in the patient spectrum ("patient glucose lineshape"). A calculation is then performed which determines the scaling factor needed to adjust the amplitude of the reference glucose lineshape to give the best match with the patient glucose lineshape. This scaling factor is multiplied by the reference coefficient to give the concentration of glucose in the patient blood plasma or serum specimen.
- The mathematics used in the lineshape fitting process (i.e., least squares fit of an unknown function in terms of a weighted sum of known functions) is well known and is described in many textbooks of numerical analysis such as F.B. Hildebrand, Introduction to Numerical Analysis, 2nd edition, pp. 314-326, 539-567, McGraw-Hill, 1975. Additional description of glucose computation is provided in
U.S. Patent No. 6,518,069 to Otvos et al. - Other lifestyle and genetic information can also be acquired and factored into an overall risk assessment analysis by the clinician. For example, weight, age, and family history of diabetes can all be assigned risk values which can be factored (separately or with) into the blood lipoprotein based analysis.
- A subject may have a borderline (blood test) insulin resistance index 50 (e.g, a value that is between 50%-60% of the maximum risk number), but may be identified as being "at-risk" (i.e., for developing
Type 2 diabetes) by the increased risk values attributed to one or more of familial, genetic, weight or lifestyle information. This information may then identify the subject for lifestyle changes such as exercise, weight loss or diet changes and/or drug therapy and/or place the subject on an increased and/or timed monitoring schedule. As noted above, theindex 50 may provide more tangible evidence of metabolic abnormality that can be used to motivate a patient to make lifestyle changes. - It will be understood by those skilled in the art that the methods described herein are useful for evaluating a patient over time (and potentially efficacy of a treatment program) for decreasing the insulin insensitivity or insulin resistance risk. A baseline insulin resistance/sensitivity test generating a baseline
insulin resistance index 50 can be obtained by analyzing the patient sample, e.g., typically a blood sample analyzed by NMR spectral analysis as described herein. After the baseline test, and periodically thereafter, blood or another suitable biosample can be collected again from the subject, and a second and subsequent insulin resistance analysis of the lipoprotein parameters that were measured in the baseline is then obtained, again typically by NMR spectral analysis, as described herein. The second analysis and/orindex 50 can be compared to thebaseline index 50. A difference between the two (as indicated by a difference in theindex 50 and/or a beneficial/favorable change in the value of one or more measured lipoprotein particle parameters 20) may provide an indication of the efficacy of treatment and/or stability in theindex 50. -
Figure 7 is a block diagram of exemplary data processing systems that illustrates systems, methods, and computer program products. Theprocessor 310 communicates with thememory 314 via an address/data bus 348. Theprocessor 310 can be any commercially available or custom microprocessor. Thememory 314 is representative of the overall hierarchy of memory devices containing the software and data used to implement the functionality of thedata processing system 305. Thememory 314 can include, but is not limited to, the following types of devices: cache, ROM, PROM, EPROM, EEPROM, flash memory, SRAM, and DRAM. - As shown in
Figure 7 , thememory 314 may include several categories of software and data used in the data processing system 305: theoperating system 352; theapplication programs 354; the input/output (I/O)device drivers 358; an Insulin Resistance Index Calculation Module that considers concentrations and sizes oflipoprotein parameters 350; and thedata 356. The Insulin ResistanceIndex Calculation Module 350 can include predefined risk values for different values or ranges of each lipoprotein parameter acting as a marker "20" (a defined lipoprotein particle parameter that is associated with insulin resistance) in a look-up chart or electronic reference library. - The
data 356 may include signal (constituent and/or composite spectrum lineshape)data 362 which may be obtained from a data orsignal acquisition system 320. As will be appreciated by those of skill in the art, theoperating system 352 may be any operating system suitable for use with a data processing system, such as OS/2, AIX or OS/390 from International Business Machines Corporation, Armonk, NY, WindowsCE, WindowsNT, Windows95, Windows98, Windows2000 or WindowsXP from Microsoft Corporation, Redmond, WA, PalmOS from Palm, Inc., MacOS from Apple Computer, UNIX, FreeBSD, or Linux, proprietary operating systems or dedicated operating systems, for example, for embedded data processing systems. - The I/
O device drivers 358 typically include software routines accessed through theoperating system 352 by theapplication programs 354 to communicate with devices such as I/O data port(s),data storage 356 andcertain memory 314 components and/or theimage acquisition system 320. Theapplication programs 354 are illustrative of the programs that implement the various features of thedata processing system 305 and can include at least one application, which supports operations according to embodiments of the present invention. Finally, thedata 356 represents the static and dynamic data used by theapplication programs 354, theoperating system 352, the I/O device drivers 358, and other software programs that may reside in thememory 314. - While the present invention is illustrated, for example, with reference to the
Module 350 being an application program inFigure 7 , as will be appreciated by those of skill in the art, other configurations may also be utilized while still benefiting from the teachings of the present invention. For example, theModule 350 may also be incorporated into theoperating system 352, the I/O device drivers 358 or other such logical division of thedata processing system 305. Thus, the present invention should not be construed as limited to the configuration ofFigure 7 , which is intended to encompass any configuration capable of carrying out the operations described herein. - The I/O data port can be used to transfer information between the
data processing system 305 and the image scanner oracquisition system 320 or another computer system or a network (e.g., the Internet) or to other devices controlled by the processor. These components may be conventional components such as those used in many conventional data processing systems. - Referring now to
Figure 8 , a schematic of anexemplary system 207 for acquiring and calculating the lineshape and/or NMR measurements of a selected sample is illustrated. Thesystem 207 includes anNMR spectrometer 210 for taking NMR measurements of a sample. Thespectrometer 210 may be configured so that the NMR measurements are conducted at 400 MHz for proton signals; in other embodiments the measurements may be carried out at 360MHz or other suitable frequency. Other frequencies corresponding to a desired operational magnetic field strength may also be employed. Typically, a proton flow probe is installed, as is a temperature controller to maintain the sample temperature at 47 +/-0.2 degrees C. Field homogeneity of thespectrometer 210 can be optimized by shimming on a sample of 99.8% D2O until the spectral linewidth of the HDO NMR signal is less than 0.6 Hz. The 90° RF excitation pulse width used for the D2O measurement is typically ca. 6-7 microseconds. - Referring again to
Figure 8 , thespectrometer 210 is controlled by a processor or an ACIS typically held in adigital computer 211 or other signal processing unit. The computer/processor should be capable of performing rapid Fourier transformations. Thesystem 207 may also include adata link 212 to an external server, client orother computer 213, and a direct-memory-access channel 214 which connects to ahard disc unit 215 or back-up server with data storage. - The
computer 211 may also include a set of analog-to-digital converters, digital-to-analog converters and slow device I/O ports which connect through a pulse control andinterface circuit 216 to the operating elements of the spectrometer. These elements include anRF transmitter 217 which produces an RF excitation pulse of the duration, frequency and magnitude directed by thedigital computer 211, and anRF power amplifier 218 which amplifies the pulse and couples it to the RF transmitcoil 219 that surroundssample cell 220. The NMR signal produced by the excited sample in the presence of a 9.4 Tesla polarizing magnetic field produced bysuperconducting magnet 221 is received by a coil 222 and applied to anRF receiver 223. The amplified and filtered NMR signal is demodulated at 224 and the resulting quadrature signals are applied to theinterface circuit 216 where they are digitized and input through thedigital computer 211 to a file in thedisc storage 215. The module 350 (Figure 7 ) can be located in thedigital computer 211 and/or in a secondary computer, processor, or database that may be on-site or remote with a wired or wireless connection. Thesystem 207 can haveInternet connectivity 227 and can send reports to clinicians electronically and/or via paper. Additional automated clinical NMR analyzer systems suitable for analyzing biosamples or specimens are described in co-pending, co-assigned U.S. Patent Application PublicationUS 2005/0222504 A1 . See also,US Pat. Nos. 5,343,389 ,6,617,167 ,4,933,844 , and7,243,030 , for additonal description of this analytical technique. See also Handbook of Lipoprotein Testing, Chapter 31: "Measurement of lipoprotein subclass profiles by nuclear magnetic resonance spectroscopy", J.D. Otvos, AACC Press, Washington DC, 2000, 2nd ed., pp 609-623. - After the NMR data are acquired from the sample in the
measurement cell 220, processing by thecomputer 211 produces another file that can, as desired, be stored in the disc storage 215 (or other data storage device such as a server or database). This second file is a digital representation of the chemical shift spectrum and it is subsequently read out to thecomputer 213 for storage in itsdisc storage 225. Under the direction of a program stored in its memory or a remote system, thecomputer 13, which may be personal, laptop, desktop, or other computer, processes the chemical shift spectrum to print a report, which is output to aprinter 226 or electronically stored and relayed to a desired email address or URL. Those skilled in this art will recognize that other output devices, such as a computer display screen, may also be employed for the display of results. - It should be apparent to those skilled in the art that the functions performed by the
computer 213 and itsseparate disc storage 225 may also be incorporated into the functions performed by the spectrometer'sdigital computer 211. In such case, theprinter 226 may be connected directly to thedigital computer 211 or may reside at a clinician site. Other interfaces and output devices may also be employed, as are well-known to those skilled in this art. - It is contemplated that the insulin resistance index may help identify patients that are at-risk for having disorders of insulin resistance including, but not limited to, dyslipidemia, (including diabetic dyslipidemia)
Type 2 diabetes, and gestational diabetes. - Although a few exemplary embodiments of the invention have been described, those skilled in the art will readily appreciate that many modifications are possible in the exemplary embodiments without materially departing from the scope of this invention as defined in the claims. In the claims, means-plus-function clauses, where used, are intended to cover the structures described herein as performing the recited function and not only structural equivalents but also equivalent structures. Therefore, it is to be understood that the foregoing is illustrative of the present invention and is not to be construed as limited to the specific embodiments disclosed, and that modifications to the disclosed embodiments, as well as other embodiments, are intended to be included within the scope of the appended claims. The invention is defined by the following claims.
Claims (7)
- A method of predicting a non-diabetic subject's degree of insulin resistance, comprising:measuring a plurality of selected lipoprotein (20) parameters from an in vitro patient biosample, wherein the biosample is a non-fasting blood plasma or serum sample,wherein the plurality of selected lipoprotein parameters includes particle concentration and size;programmatically providing a risk score (40) for each of the selected lipoprotein parameters based on the measurement of the selected lipoprotein parameters, wherein the risk score is selected from a set of defined risk scores associated with different potential measurement values or ranges of values of each of the selected lipoprotein parameters; andprogrammatically generating a lipoprotein insulin resistance index (50) by summing the risk scores of the selected lipoprotein parameters, wherein the selected lipoprotein parameters include the following: small LDL (22), and large HDL particle (23) concentrations and LDL (25), and HDL (26) particle sizes.
- The method of claim 1 wherein the selected lipoprotein parameters include large VLDL (21), small LDL (22), and large HDL particle (23) concentrations and VLDL (24), LDL (25), and HDL (26) particle sizes.
- The method of any preceding Claim, wherein the insulin resistance index has a value between 0-100, with "100" indicating a high degree of insulin resistance and "0" indicating insulin sensitivity.
- The method of Claim 3, wherein the subject is a male or a female and the set of defined risk scores are gender specific.
- The method of any of Claims 1-4, further comprising comparing a first index of a subject and a second index obtained at a later point in time to assess whether the patient has a change in value of the lipoprotein insulin resistance index to thereby provide an indication of the efficacy of any lifestyle changes or treatment for the subject.
- The method of claim 1, wherein the lipoprotein insulin resistance index generated is a score:(i) in a defined numerical range, with a lowest number in the defined range associated with most insulin sensitivity and a highest number in the defined range associated with most insulin resistance; or(ii) with a numerical range being one of the following: about 0-10, about 0-24, about 0-25, about 0-50, about 0-100, about 0-200, or about 0-1000, wherein the about "0" end of the range is associated with insulin sensitivity and a highest number in each range is associated with most insulin resistance; or(iii) that ranges between about 0-100, with about "0" being associated with most insulin sensitivity and about "1 00" being associated with most insulin resistance and a high degree of risk of developing Type 2 diabetes.
- The method of claim 1, wherein the set of defined risk scores are defined based on the differential strengths of association for each of the lipoprotein parameters with insulin resistance.
Priority Applications (1)
| Application Number | Priority Date | Filing Date | Title |
|---|---|---|---|
| EP21190653.2A EP4016105A1 (en) | 2008-10-20 | 2009-10-20 | Lipoprotein insulin resistance indexes and related methods, systems and computer program for generating same |
Applications Claiming Priority (2)
| Application Number | Priority Date | Filing Date | Title |
|---|---|---|---|
| US10683308P | 2008-10-20 | 2008-10-20 | |
| PCT/US2009/005689 WO2010047767A2 (en) | 2008-10-20 | 2009-10-20 | Lipoprotein insulin resistance indexes and related methods, systems and computer programs for generating same |
Related Child Applications (1)
| Application Number | Title | Priority Date | Filing Date |
|---|---|---|---|
| EP21190653.2A Division EP4016105A1 (en) | 2008-10-20 | 2009-10-20 | Lipoprotein insulin resistance indexes and related methods, systems and computer program for generating same |
Publications (3)
| Publication Number | Publication Date |
|---|---|
| EP2344890A2 EP2344890A2 (en) | 2011-07-20 |
| EP2344890A4 EP2344890A4 (en) | 2012-12-26 |
| EP2344890B1 true EP2344890B1 (en) | 2021-08-11 |
Family
ID=42109358
Family Applications (2)
| Application Number | Title | Priority Date | Filing Date |
|---|---|---|---|
| EP09822305.0A Active EP2344890B1 (en) | 2008-10-20 | 2009-10-20 | Lipoprotein insulin resistance indexes and related methods |
| EP21190653.2A Pending EP4016105A1 (en) | 2008-10-20 | 2009-10-20 | Lipoprotein insulin resistance indexes and related methods, systems and computer program for generating same |
Family Applications After (1)
| Application Number | Title | Priority Date | Filing Date |
|---|---|---|---|
| EP21190653.2A Pending EP4016105A1 (en) | 2008-10-20 | 2009-10-20 | Lipoprotein insulin resistance indexes and related methods, systems and computer program for generating same |
Country Status (7)
| Country | Link |
|---|---|
| US (1) | US8386187B2 (en) |
| EP (2) | EP2344890B1 (en) |
| JP (1) | JP5393798B2 (en) |
| KR (1) | KR20110086074A (en) |
| AU (1) | AU2009308124B2 (en) |
| CA (1) | CA2741034C (en) |
| WO (1) | WO2010047767A2 (en) |
Families Citing this family (16)
| Publication number | Priority date | Publication date | Assignee | Title |
|---|---|---|---|---|
| KR20110086074A (en) | 2008-10-20 | 2011-07-27 | 리포사이언스, 인크. | Lipoprotein insulin resistance indexes and related methods, systems and computer programs for generating same |
| EP2726857B1 (en) * | 2011-06-30 | 2019-10-23 | Liposcience, Inc. | Quantitative nmr clinical analyzers with automatic nmr temperature sensitivity compensation that accommodate large ambient operational temperature ranges |
| KR102150771B1 (en) * | 2012-03-05 | 2020-09-01 | 오와이 아크틱 파트너스 에이비 | Methods and apparatuses for predicting risk of prostate cancer and prostate gland volume |
| US9483612B2 (en) | 2012-04-27 | 2016-11-01 | Liposcience, Inc. | CHD risk stratification evaluations for subjects with high levels of large HDL-P |
| US9361429B2 (en) * | 2012-06-08 | 2016-06-07 | Liposcience, Inc. | Multi-parameter diabetes risk evaluations |
| US9928345B2 (en) | 2012-06-08 | 2018-03-27 | Liposciences, Inc. | Multiple-marker risk parameters predictive of conversion to diabetes |
| US9470771B2 (en) | 2012-06-08 | 2016-10-18 | Liposcience, Inc. | NMR measurements of NMR biomarker GlycA |
| US9551768B2 (en) | 2013-03-15 | 2017-01-24 | East Carolina University | NMR method for monitoring changes in the core of lipoprotein particles in metabolism and disease |
| WO2015103553A1 (en) * | 2014-01-06 | 2015-07-09 | Liposcience, Inc. | Multiple-marker risk parameters predictive of conversion to diabetes |
| CN106663149A (en) | 2014-03-28 | 2017-05-10 | 欧普科诊断有限责任公司 | Compositions and methods related to diagnosis of prostate cancer |
| CA2960822C (en) * | 2014-09-11 | 2021-11-16 | Liposcience Inc. | Cardiovascular risk evaluations using a risk parameter that includes an hdl and inflammatory biomarker interaction parameter |
| US11143659B2 (en) | 2015-01-27 | 2021-10-12 | Arterez, Inc. | Biomarkers of vascular disease |
| PT3253800T (en) | 2015-03-27 | 2021-04-28 | Opko Diagnostics Llc | Prostate antigen standards and uses thereof |
| KR102539142B1 (en) | 2016-09-05 | 2023-06-01 | 삼성전자주식회사 | Device and method for analysis of spectra, and device for measurement the blood glucose |
| US10775458B2 (en) | 2018-03-05 | 2020-09-15 | Texas Tech University System | Method and system for non-invasive measurement of metabolic health |
| CN113117241B (en) * | 2021-04-15 | 2022-01-28 | 中国科学院合肥物质科学研究院 | Magnetic field generating device for improving insulin level and sensitivity and application thereof |
Citations (1)
| Publication number | Priority date | Publication date | Assignee | Title |
|---|---|---|---|---|
| US20070264677A1 (en) * | 2006-05-10 | 2007-11-15 | Liposcience, Inc. | Methods, systems and computer programs for assessing chd risk using adjusted hdl particle number measurements |
Family Cites Families (23)
| Publication number | Priority date | Publication date | Assignee | Title |
|---|---|---|---|---|
| US4933844A (en) | 1988-09-26 | 1990-06-12 | Otvos James D | Measurement of blood lipoprotein constituents by analysis of data acquired from an NMR spectrometer |
| AU2384292A (en) * | 1991-07-30 | 1993-03-02 | North Carolina State University | Method and apparatus for measuring blood lipoprotein levels by nmr spectroscopy |
| US6653140B2 (en) * | 1999-02-26 | 2003-11-25 | Liposcience, Inc. | Methods for providing personalized lipoprotein-based risk assessments |
| DE60026287T2 (en) * | 1999-04-22 | 2006-08-17 | Liposcience, Inc. | NMR METHOD FOR DETERMINING THE RISK FOR DEVELOPING DIABETES TYPE 2 |
| US7395158B2 (en) * | 2000-05-30 | 2008-07-01 | Sensys Medical, Inc. | Method of screening for disorders of glucose metabolism |
| US6890905B2 (en) * | 2001-04-02 | 2005-05-10 | Prosidion Limited | Methods for improving islet signaling in diabetes mellitus and for its prevention |
| WO2003012416A1 (en) * | 2001-08-01 | 2003-02-13 | Liposcience, Inc. | Method of determining presence and concentration of lipoprotein x in blood plasma and serum |
| WO2003042704A1 (en) * | 2001-11-13 | 2003-05-22 | The Regents Of The University Of California | Ion mobility analysis of biological particles |
| US7243030B2 (en) | 2002-10-25 | 2007-07-10 | Liposcience, Inc. | Methods, systems and computer programs for deconvolving the spectral contribution of chemical constituents with overlapping signals |
| DE10315877B4 (en) * | 2003-04-08 | 2005-11-17 | Roche Diagnostics Gmbh | Disease control |
| FR2853911B1 (en) * | 2003-04-17 | 2005-07-08 | Merck Sante Sas | INSULIN-INDUCED GENE AS A THERAPEUTIC TARGET IN DIABETES |
| CA2539430C (en) * | 2003-09-23 | 2015-03-17 | The General Hospital Corporation | Screening for gestational disorders with sex hormone binding globulin as biomarker |
| US8013602B2 (en) * | 2004-04-01 | 2011-09-06 | Liposcience, Inc. | NMR clinical analyzers and related methods, systems, modules and computer program products for clinical evaluation of biosamples |
| ES2571929T3 (en) * | 2004-05-26 | 2016-05-27 | Region Nordjylland | Procedure to determine the amount of circulating CD36 |
| DE102004026903B4 (en) * | 2004-06-01 | 2006-05-18 | Universität Regensburg | Determination of lipoprotein classes in body fluids comprises analyzing NMR spectra of a plasma or serum sample and measuring under different measuring conditions; and determining the different effects of these measuring conditions |
| MX2007000783A (en) * | 2004-07-20 | 2007-04-09 | Genentech Inc | Compositions and methods of using angiopoietin-like 4 protein. |
| JP4210855B2 (en) * | 2004-09-28 | 2009-01-21 | 大塚製薬株式会社 | Method for evaluating insulin resistance |
| US7323296B2 (en) * | 2004-10-01 | 2008-01-29 | Yuanhong Ma | Method and index for diagnosing insulin resistance |
| EP1645877A1 (en) * | 2004-10-08 | 2006-04-12 | Nederlandse Organisatie voor toegepast-natuurwetenschappelijk Onderzoek TNO | Method for providing a insulin resistance biomarker profile of one or more lipids |
| WO2006110082A1 (en) | 2005-04-11 | 2006-10-19 | Astrazeneca Ab | A method and a kit for diagnosing type 2 diabetes, metabolic syndrome, sub clinical atherosclerosis, myocardial infarct, stroke or clinical manifestations of diabetes. |
| AU2008279778B2 (en) * | 2007-07-17 | 2014-09-18 | Metabolon, Inc. | Method for Determining Insulin Sensitivity with Biomarkers |
| US20090191576A1 (en) * | 2008-01-28 | 2009-07-30 | Yuanhong Ma | Method and index for diagnosing insulin resistance |
| KR20110086074A (en) | 2008-10-20 | 2011-07-27 | 리포사이언스, 인크. | Lipoprotein insulin resistance indexes and related methods, systems and computer programs for generating same |
-
2009
- 2009-10-20 KR KR1020117011307A patent/KR20110086074A/en not_active Application Discontinuation
- 2009-10-20 JP JP2011532094A patent/JP5393798B2/en active Active
- 2009-10-20 US US12/582,259 patent/US8386187B2/en active Active
- 2009-10-20 EP EP09822305.0A patent/EP2344890B1/en active Active
- 2009-10-20 WO PCT/US2009/005689 patent/WO2010047767A2/en active Application Filing
- 2009-10-20 EP EP21190653.2A patent/EP4016105A1/en active Pending
- 2009-10-20 CA CA2741034A patent/CA2741034C/en active Active
- 2009-10-20 AU AU2009308124A patent/AU2009308124B2/en not_active Expired - Fee Related
Patent Citations (1)
| Publication number | Priority date | Publication date | Assignee | Title |
|---|---|---|---|---|
| US20070264677A1 (en) * | 2006-05-10 | 2007-11-15 | Liposcience, Inc. | Methods, systems and computer programs for assessing chd risk using adjusted hdl particle number measurements |
Non-Patent Citations (1)
| Title |
|---|
| JAANA LINDSTRÖM ET AL: "The diabetes risk score: a practical tool to predict type 2 diabetes risk", DIABETES CARE, vol. 26, no. 3, 1 March 2003 (2003-03-01), US, pages 725 - 731, XP055474872, ISSN: 0149-5992, DOI: 10.2337/diacare.26.3.725 * |
Also Published As
| Publication number | Publication date |
|---|---|
| WO2010047767A3 (en) | 2010-08-26 |
| KR20110086074A (en) | 2011-07-27 |
| AU2009308124A1 (en) | 2010-04-29 |
| JP2012506051A (en) | 2012-03-08 |
| US8386187B2 (en) | 2013-02-26 |
| EP2344890A4 (en) | 2012-12-26 |
| WO2010047767A2 (en) | 2010-04-29 |
| AU2009308124B2 (en) | 2014-12-11 |
| US20100100334A1 (en) | 2010-04-22 |
| EP4016105A1 (en) | 2022-06-22 |
| CA2741034A1 (en) | 2010-04-29 |
| JP5393798B2 (en) | 2014-01-22 |
| CA2741034C (en) | 2021-06-22 |
| EP2344890A2 (en) | 2011-07-20 |
Similar Documents
| Publication | Publication Date | Title |
|---|---|---|
| EP2344890B1 (en) | Lipoprotein insulin resistance indexes and related methods | |
| JP6730410B2 (en) | Multi-parameter diabetes risk assessment | |
| EP1171778B1 (en) | Nmr-method for determining the risk of developing type 2 diabetes | |
| US20210304898A1 (en) | Multiple-Marker Risk Parameters Predictive of Conversion to Diabetes | |
| JP2024054240A (en) | Multimarker risk parameters predicting conversion to diabetes mellitus. | |
| EP3444595B1 (en) | Nmr quantification of tmao |
Legal Events
| Date | Code | Title | Description |
|---|---|---|---|
| PUAI | Public reference made under article 153(3) epc to a published international application that has entered the european phase |
Free format text: ORIGINAL CODE: 0009012 |
|
| 17P | Request for examination filed |
Effective date: 20110505 |
|
| AK | Designated contracting states |
Kind code of ref document: A2 Designated state(s): AT BE BG CH CY CZ DE DK EE ES FI FR GB GR HR HU IE IS IT LI LT LU LV MC MK MT NL NO PL PT RO SE SI SK SM TR |
|
| AX | Request for extension of the european patent |
Extension state: AL BA RS |
|
| DAX | Request for extension of the european patent (deleted) | ||
| A4 | Supplementary search report drawn up and despatched |
Effective date: 20121123 |
|
| RIC1 | Information provided on ipc code assigned before grant |
Ipc: G06F 19/00 20110101ALI20121119BHEP Ipc: A61B 5/055 20060101ALI20121119BHEP Ipc: G01N 33/66 20060101ALI20121119BHEP Ipc: G01R 33/465 20060101AFI20121119BHEP Ipc: G01N 33/68 20060101ALI20121119BHEP |
|
| 17Q | First examination report despatched |
Effective date: 20150827 |
|
| STAA | Information on the status of an ep patent application or granted ep patent |
Free format text: STATUS: EXAMINATION IS IN PROGRESS |
|
| REG | Reference to a national code |
Ref country code: DE Ref legal event code: R079 Ref document number: 602009063954 Country of ref document: DE Free format text: PREVIOUS MAIN CLASS: G01N0033680000 Ipc: G01R0033465000 |
|
| GRAP | Despatch of communication of intention to grant a patent |
Free format text: ORIGINAL CODE: EPIDOSNIGR1 |
|
| STAA | Information on the status of an ep patent application or granted ep patent |
Free format text: STATUS: GRANT OF PATENT IS INTENDED |
|
| RIC1 | Information provided on ipc code assigned before grant |
Ipc: G01N 33/48 20060101ALI20200910BHEP Ipc: A61B 5/055 20060101ALI20200910BHEP Ipc: G01N 33/66 20060101ALI20200910BHEP Ipc: G01R 33/465 20060101AFI20200910BHEP |
|
| INTG | Intention to grant announced |
Effective date: 20200929 |
|
| GRAJ | Information related to disapproval of communication of intention to grant by the applicant or resumption of examination proceedings by the epo deleted |
Free format text: ORIGINAL CODE: EPIDOSDIGR1 |
|
| STAA | Information on the status of an ep patent application or granted ep patent |
Free format text: STATUS: EXAMINATION IS IN PROGRESS |
|
| GRAP | Despatch of communication of intention to grant a patent |
Free format text: ORIGINAL CODE: EPIDOSNIGR1 |
|
| STAA | Information on the status of an ep patent application or granted ep patent |
Free format text: STATUS: GRANT OF PATENT IS INTENDED |
|
| INTC | Intention to grant announced (deleted) | ||
| RAP1 | Party data changed (applicant data changed or rights of an application transferred) |
Owner name: LIPOSCIENCE, INC. |
|
| INTG | Intention to grant announced |
Effective date: 20210302 |
|
| GRAS | Grant fee paid |
Free format text: ORIGINAL CODE: EPIDOSNIGR3 |
|
| GRAA | (expected) grant |
Free format text: ORIGINAL CODE: 0009210 |
|
| STAA | Information on the status of an ep patent application or granted ep patent |
Free format text: STATUS: THE PATENT HAS BEEN GRANTED |
|
| AK | Designated contracting states |
Kind code of ref document: B1 Designated state(s): AT BE BG CH CY CZ DE DK EE ES FI FR GB GR HR HU IE IS IT LI LT LU LV MC MK MT NL NO PL PT RO SE SI SK SM TR |
|
| REG | Reference to a national code |
Ref country code: GB Ref legal event code: FG4D |
|
| REG | Reference to a national code |
Ref country code: CH Ref legal event code: EP |
|
| REG | Reference to a national code |
Ref country code: DE Ref legal event code: R096 Ref document number: 602009063954 Country of ref document: DE |
|
| REG | Reference to a national code |
Ref country code: IE Ref legal event code: FG4D Ref country code: AT Ref legal event code: REF Ref document number: 1419926 Country of ref document: AT Kind code of ref document: T Effective date: 20210915 |
|
| REG | Reference to a national code |
Ref country code: LT Ref legal event code: MG9D |
|
| REG | Reference to a national code |
Ref country code: NL Ref legal event code: MP Effective date: 20210811 |
|
| REG | Reference to a national code |
Ref country code: AT Ref legal event code: MK05 Ref document number: 1419926 Country of ref document: AT Kind code of ref document: T Effective date: 20210811 |
|
| PG25 | Lapsed in a contracting state [announced via postgrant information from national office to epo] |
Ref country code: AT Free format text: LAPSE BECAUSE OF FAILURE TO SUBMIT A TRANSLATION OF THE DESCRIPTION OR TO PAY THE FEE WITHIN THE PRESCRIBED TIME-LIMIT Effective date: 20210811 Ref country code: BG Free format text: LAPSE BECAUSE OF FAILURE TO SUBMIT A TRANSLATION OF THE DESCRIPTION OR TO PAY THE FEE WITHIN THE PRESCRIBED TIME-LIMIT Effective date: 20211111 Ref country code: LT Free format text: LAPSE BECAUSE OF FAILURE TO SUBMIT A TRANSLATION OF THE DESCRIPTION OR TO PAY THE FEE WITHIN THE PRESCRIBED TIME-LIMIT Effective date: 20210811 Ref country code: NO Free format text: LAPSE BECAUSE OF FAILURE TO SUBMIT A TRANSLATION OF THE DESCRIPTION OR TO PAY THE FEE WITHIN THE PRESCRIBED TIME-LIMIT Effective date: 20211111 Ref country code: PT Free format text: LAPSE BECAUSE OF FAILURE TO SUBMIT A TRANSLATION OF THE DESCRIPTION OR TO PAY THE FEE WITHIN THE PRESCRIBED TIME-LIMIT Effective date: 20211213 Ref country code: ES Free format text: LAPSE BECAUSE OF FAILURE TO SUBMIT A TRANSLATION OF THE DESCRIPTION OR TO PAY THE FEE WITHIN THE PRESCRIBED TIME-LIMIT Effective date: 20210811 Ref country code: FI Free format text: LAPSE BECAUSE OF FAILURE TO SUBMIT A TRANSLATION OF THE DESCRIPTION OR TO PAY THE FEE WITHIN THE PRESCRIBED TIME-LIMIT Effective date: 20210811 Ref country code: HR Free format text: LAPSE BECAUSE OF FAILURE TO SUBMIT A TRANSLATION OF THE DESCRIPTION OR TO PAY THE FEE WITHIN THE PRESCRIBED TIME-LIMIT Effective date: 20210811 Ref country code: SE Free format text: LAPSE BECAUSE OF FAILURE TO SUBMIT A TRANSLATION OF THE DESCRIPTION OR TO PAY THE FEE WITHIN THE PRESCRIBED TIME-LIMIT Effective date: 20210811 |
|
| PG25 | Lapsed in a contracting state [announced via postgrant information from national office to epo] |
Ref country code: PL Free format text: LAPSE BECAUSE OF FAILURE TO SUBMIT A TRANSLATION OF THE DESCRIPTION OR TO PAY THE FEE WITHIN THE PRESCRIBED TIME-LIMIT Effective date: 20210811 Ref country code: LV Free format text: LAPSE BECAUSE OF FAILURE TO SUBMIT A TRANSLATION OF THE DESCRIPTION OR TO PAY THE FEE WITHIN THE PRESCRIBED TIME-LIMIT Effective date: 20210811 Ref country code: GR Free format text: LAPSE BECAUSE OF FAILURE TO SUBMIT A TRANSLATION OF THE DESCRIPTION OR TO PAY THE FEE WITHIN THE PRESCRIBED TIME-LIMIT Effective date: 20211112 |
|
| PG25 | Lapsed in a contracting state [announced via postgrant information from national office to epo] |
Ref country code: NL Free format text: LAPSE BECAUSE OF FAILURE TO SUBMIT A TRANSLATION OF THE DESCRIPTION OR TO PAY THE FEE WITHIN THE PRESCRIBED TIME-LIMIT Effective date: 20210811 |
|
| PG25 | Lapsed in a contracting state [announced via postgrant information from national office to epo] |
Ref country code: DK Free format text: LAPSE BECAUSE OF FAILURE TO SUBMIT A TRANSLATION OF THE DESCRIPTION OR TO PAY THE FEE WITHIN THE PRESCRIBED TIME-LIMIT Effective date: 20210811 |
|
| REG | Reference to a national code |
Ref country code: DE Ref legal event code: R097 Ref document number: 602009063954 Country of ref document: DE |
|
| REG | Reference to a national code |
Ref country code: CH Ref legal event code: PL |
|
| PG25 | Lapsed in a contracting state [announced via postgrant information from national office to epo] |
Ref country code: SM Free format text: LAPSE BECAUSE OF FAILURE TO SUBMIT A TRANSLATION OF THE DESCRIPTION OR TO PAY THE FEE WITHIN THE PRESCRIBED TIME-LIMIT Effective date: 20210811 Ref country code: SK Free format text: LAPSE BECAUSE OF FAILURE TO SUBMIT A TRANSLATION OF THE DESCRIPTION OR TO PAY THE FEE WITHIN THE PRESCRIBED TIME-LIMIT Effective date: 20210811 Ref country code: RO Free format text: LAPSE BECAUSE OF FAILURE TO SUBMIT A TRANSLATION OF THE DESCRIPTION OR TO PAY THE FEE WITHIN THE PRESCRIBED TIME-LIMIT Effective date: 20210811 Ref country code: EE Free format text: LAPSE BECAUSE OF FAILURE TO SUBMIT A TRANSLATION OF THE DESCRIPTION OR TO PAY THE FEE WITHIN THE PRESCRIBED TIME-LIMIT Effective date: 20210811 Ref country code: CZ Free format text: LAPSE BECAUSE OF FAILURE TO SUBMIT A TRANSLATION OF THE DESCRIPTION OR TO PAY THE FEE WITHIN THE PRESCRIBED TIME-LIMIT Effective date: 20210811 |
|
| PLBE | No opposition filed within time limit |
Free format text: ORIGINAL CODE: 0009261 |
|
| STAA | Information on the status of an ep patent application or granted ep patent |
Free format text: STATUS: NO OPPOSITION FILED WITHIN TIME LIMIT |
|
| REG | Reference to a national code |
Ref country code: BE Ref legal event code: MM Effective date: 20211031 |
|
| PG25 | Lapsed in a contracting state [announced via postgrant information from national office to epo] |
Ref country code: MC Free format text: LAPSE BECAUSE OF FAILURE TO SUBMIT A TRANSLATION OF THE DESCRIPTION OR TO PAY THE FEE WITHIN THE PRESCRIBED TIME-LIMIT Effective date: 20210811 |
|
| 26N | No opposition filed |
Effective date: 20220512 |
|
| PG25 | Lapsed in a contracting state [announced via postgrant information from national office to epo] |
Ref country code: LU Free format text: LAPSE BECAUSE OF NON-PAYMENT OF DUE FEES Effective date: 20211020 Ref country code: IT Free format text: LAPSE BECAUSE OF FAILURE TO SUBMIT A TRANSLATION OF THE DESCRIPTION OR TO PAY THE FEE WITHIN THE PRESCRIBED TIME-LIMIT Effective date: 20210811 Ref country code: BE Free format text: LAPSE BECAUSE OF NON-PAYMENT OF DUE FEES Effective date: 20211031 |
|
| PG25 | Lapsed in a contracting state [announced via postgrant information from national office to epo] |
Ref country code: SI Free format text: LAPSE BECAUSE OF FAILURE TO SUBMIT A TRANSLATION OF THE DESCRIPTION OR TO PAY THE FEE WITHIN THE PRESCRIBED TIME-LIMIT Effective date: 20210811 Ref country code: LI Free format text: LAPSE BECAUSE OF NON-PAYMENT OF DUE FEES Effective date: 20211031 Ref country code: CH Free format text: LAPSE BECAUSE OF NON-PAYMENT OF DUE FEES Effective date: 20211031 |
|
| PG25 | Lapsed in a contracting state [announced via postgrant information from national office to epo] |
Ref country code: IE Free format text: LAPSE BECAUSE OF NON-PAYMENT OF DUE FEES Effective date: 20211020 |
|
| PG25 | Lapsed in a contracting state [announced via postgrant information from national office to epo] |
Ref country code: HU Free format text: LAPSE BECAUSE OF FAILURE TO SUBMIT A TRANSLATION OF THE DESCRIPTION OR TO PAY THE FEE WITHIN THE PRESCRIBED TIME-LIMIT; INVALID AB INITIO Effective date: 20091020 Ref country code: CY Free format text: LAPSE BECAUSE OF FAILURE TO SUBMIT A TRANSLATION OF THE DESCRIPTION OR TO PAY THE FEE WITHIN THE PRESCRIBED TIME-LIMIT Effective date: 20210811 |
|
| PGFP | Annual fee paid to national office [announced via postgrant information from national office to epo] |
Ref country code: GB Payment date: 20230831 Year of fee payment: 15 |
|
| PGFP | Annual fee paid to national office [announced via postgrant information from national office to epo] |
Ref country code: FR Payment date: 20230911 Year of fee payment: 15 |
|
| PGFP | Annual fee paid to national office [announced via postgrant information from national office to epo] |
Ref country code: DE Payment date: 20230822 Year of fee payment: 15 |
|
| P01 | Opt-out of the competence of the unified patent court (upc) registered |
Effective date: 20240215 |