EP2283463B1 - System und verfahren zur erkennung und entfernung eines oder mehrerer defokussierter bilder oder eines oder mehrerer bilder mit geringem kontrast-rausch-verhältnis - Google Patents
System und verfahren zur erkennung und entfernung eines oder mehrerer defokussierter bilder oder eines oder mehrerer bilder mit geringem kontrast-rausch-verhältnis Download PDFInfo
- Publication number
- EP2283463B1 EP2283463B1 EP09755161.8A EP09755161A EP2283463B1 EP 2283463 B1 EP2283463 B1 EP 2283463B1 EP 09755161 A EP09755161 A EP 09755161A EP 2283463 B1 EP2283463 B1 EP 2283463B1
- Authority
- EP
- European Patent Office
- Prior art keywords
- image
- images
- cell
- sub
- defocus
- Prior art date
- Legal status (The legal status is an assumption and is not a legal conclusion. Google has not performed a legal analysis and makes no representation as to the accuracy of the status listed.)
- Active
Links
- 238000000034 method Methods 0.000 title claims description 19
- 238000000354 decomposition reaction Methods 0.000 claims description 14
- 238000003384 imaging method Methods 0.000 claims description 11
- 239000012472 biological sample Substances 0.000 claims description 9
- 230000011218 segmentation Effects 0.000 description 21
- 239000000523 sample Substances 0.000 description 20
- 238000001514 detection method Methods 0.000 description 18
- 230000003287 optical effect Effects 0.000 description 13
- 239000012620 biological material Substances 0.000 description 9
- 238000004458 analytical method Methods 0.000 description 8
- 239000000306 component Substances 0.000 description 8
- 230000006870 function Effects 0.000 description 8
- 238000004891 communication Methods 0.000 description 7
- 238000001914 filtration Methods 0.000 description 6
- 238000013459 approach Methods 0.000 description 5
- 238000010586 diagram Methods 0.000 description 5
- 230000008569 process Effects 0.000 description 5
- 238000012545 processing Methods 0.000 description 5
- 108090000623 proteins and genes Proteins 0.000 description 5
- 238000003556 assay Methods 0.000 description 4
- 238000009826 distribution Methods 0.000 description 4
- 238000002474 experimental method Methods 0.000 description 4
- 238000000386 microscopy Methods 0.000 description 4
- 230000006399 behavior Effects 0.000 description 3
- 230000011278 mitosis Effects 0.000 description 3
- 238000011282 treatment Methods 0.000 description 3
- 101100228469 Caenorhabditis elegans exp-1 gene Proteins 0.000 description 2
- 230000002159 abnormal effect Effects 0.000 description 2
- 230000005856 abnormality Effects 0.000 description 2
- 230000008901 benefit Effects 0.000 description 2
- 239000002872 contrast media Substances 0.000 description 2
- 230000000694 effects Effects 0.000 description 2
- 238000010191 image analysis Methods 0.000 description 2
- 230000007246 mechanism Effects 0.000 description 2
- 102000004169 proteins and genes Human genes 0.000 description 2
- 238000011160 research Methods 0.000 description 2
- 238000007493 shaping process Methods 0.000 description 2
- 230000002123 temporal effect Effects 0.000 description 2
- 238000012360 testing method Methods 0.000 description 2
- 230000009466 transformation Effects 0.000 description 2
- 108020004414 DNA Proteins 0.000 description 1
- 230000004543 DNA replication Effects 0.000 description 1
- 230000004568 DNA-binding Effects 0.000 description 1
- 102000004190 Enzymes Human genes 0.000 description 1
- 108090000790 Enzymes Proteins 0.000 description 1
- 108091093105 Nuclear DNA Proteins 0.000 description 1
- 108091034117 Oligonucleotide Proteins 0.000 description 1
- -1 Petri dish Substances 0.000 description 1
- 241000700605 Viruses Species 0.000 description 1
- JLCPHMBAVCMARE-UHFFFAOYSA-N [3-[[3-[[3-[[3-[[3-[[3-[[3-[[3-[[3-[[3-[[3-[[5-(2-amino-6-oxo-1H-purin-9-yl)-3-[[3-[[3-[[3-[[3-[[3-[[5-(2-amino-6-oxo-1H-purin-9-yl)-3-[[5-(2-amino-6-oxo-1H-purin-9-yl)-3-hydroxyoxolan-2-yl]methoxy-hydroxyphosphoryl]oxyoxolan-2-yl]methoxy-hydroxyphosphoryl]oxy-5-(5-methyl-2,4-dioxopyrimidin-1-yl)oxolan-2-yl]methoxy-hydroxyphosphoryl]oxy-5-(6-aminopurin-9-yl)oxolan-2-yl]methoxy-hydroxyphosphoryl]oxy-5-(6-aminopurin-9-yl)oxolan-2-yl]methoxy-hydroxyphosphoryl]oxy-5-(6-aminopurin-9-yl)oxolan-2-yl]methoxy-hydroxyphosphoryl]oxy-5-(6-aminopurin-9-yl)oxolan-2-yl]methoxy-hydroxyphosphoryl]oxyoxolan-2-yl]methoxy-hydroxyphosphoryl]oxy-5-(5-methyl-2,4-dioxopyrimidin-1-yl)oxolan-2-yl]methoxy-hydroxyphosphoryl]oxy-5-(4-amino-2-oxopyrimidin-1-yl)oxolan-2-yl]methoxy-hydroxyphosphoryl]oxy-5-(5-methyl-2,4-dioxopyrimidin-1-yl)oxolan-2-yl]methoxy-hydroxyphosphoryl]oxy-5-(5-methyl-2,4-dioxopyrimidin-1-yl)oxolan-2-yl]methoxy-hydroxyphosphoryl]oxy-5-(6-aminopurin-9-yl)oxolan-2-yl]methoxy-hydroxyphosphoryl]oxy-5-(6-aminopurin-9-yl)oxolan-2-yl]methoxy-hydroxyphosphoryl]oxy-5-(4-amino-2-oxopyrimidin-1-yl)oxolan-2-yl]methoxy-hydroxyphosphoryl]oxy-5-(4-amino-2-oxopyrimidin-1-yl)oxolan-2-yl]methoxy-hydroxyphosphoryl]oxy-5-(4-amino-2-oxopyrimidin-1-yl)oxolan-2-yl]methoxy-hydroxyphosphoryl]oxy-5-(6-aminopurin-9-yl)oxolan-2-yl]methoxy-hydroxyphosphoryl]oxy-5-(4-amino-2-oxopyrimidin-1-yl)oxolan-2-yl]methyl [5-(6-aminopurin-9-yl)-2-(hydroxymethyl)oxolan-3-yl] hydrogen phosphate Polymers Cc1cn(C2CC(OP(O)(=O)OCC3OC(CC3OP(O)(=O)OCC3OC(CC3O)n3cnc4c3nc(N)[nH]c4=O)n3cnc4c3nc(N)[nH]c4=O)C(COP(O)(=O)OC3CC(OC3COP(O)(=O)OC3CC(OC3COP(O)(=O)OC3CC(OC3COP(O)(=O)OC3CC(OC3COP(O)(=O)OC3CC(OC3COP(O)(=O)OC3CC(OC3COP(O)(=O)OC3CC(OC3COP(O)(=O)OC3CC(OC3COP(O)(=O)OC3CC(OC3COP(O)(=O)OC3CC(OC3COP(O)(=O)OC3CC(OC3COP(O)(=O)OC3CC(OC3COP(O)(=O)OC3CC(OC3COP(O)(=O)OC3CC(OC3COP(O)(=O)OC3CC(OC3COP(O)(=O)OC3CC(OC3COP(O)(=O)OC3CC(OC3CO)n3cnc4c(N)ncnc34)n3ccc(N)nc3=O)n3cnc4c(N)ncnc34)n3ccc(N)nc3=O)n3ccc(N)nc3=O)n3ccc(N)nc3=O)n3cnc4c(N)ncnc34)n3cnc4c(N)ncnc34)n3cc(C)c(=O)[nH]c3=O)n3cc(C)c(=O)[nH]c3=O)n3ccc(N)nc3=O)n3cc(C)c(=O)[nH]c3=O)n3cnc4c3nc(N)[nH]c4=O)n3cnc4c(N)ncnc34)n3cnc4c(N)ncnc34)n3cnc4c(N)ncnc34)n3cnc4c(N)ncnc34)O2)c(=O)[nH]c1=O JLCPHMBAVCMARE-UHFFFAOYSA-N 0.000 description 1
- 230000001594 aberrant effect Effects 0.000 description 1
- 239000000654 additive Substances 0.000 description 1
- 230000000996 additive effect Effects 0.000 description 1
- 230000004075 alteration Effects 0.000 description 1
- 230000002238 attenuated effect Effects 0.000 description 1
- 230000003190 augmentative effect Effects 0.000 description 1
- 230000003542 behavioural effect Effects 0.000 description 1
- 230000015556 catabolic process Effects 0.000 description 1
- 230000001364 causal effect Effects 0.000 description 1
- 230000000295 complement effect Effects 0.000 description 1
- 239000012141 concentrate Substances 0.000 description 1
- 238000013527 convolutional neural network Methods 0.000 description 1
- 239000008358 core component Substances 0.000 description 1
- 238000006731 degradation reaction Methods 0.000 description 1
- 230000000916 dilatatory effect Effects 0.000 description 1
- 238000011143 downstream manufacturing Methods 0.000 description 1
- 239000000428 dust Substances 0.000 description 1
- 239000000975 dye Substances 0.000 description 1
- 230000008030 elimination Effects 0.000 description 1
- 238000003379 elimination reaction Methods 0.000 description 1
- 238000000605 extraction Methods 0.000 description 1
- 238000000799 fluorescence microscopy Methods 0.000 description 1
- 239000007850 fluorescent dye Substances 0.000 description 1
- 239000011521 glass Substances 0.000 description 1
- 238000013537 high throughput screening Methods 0.000 description 1
- 238000003709 image segmentation Methods 0.000 description 1
- 239000004973 liquid crystal related substance Substances 0.000 description 1
- 229910044991 metal oxide Inorganic materials 0.000 description 1
- 150000004706 metal oxides Chemical class 0.000 description 1
- 239000000203 mixture Substances 0.000 description 1
- 238000012986 modification Methods 0.000 description 1
- 230000004048 modification Effects 0.000 description 1
- 230000004899 motility Effects 0.000 description 1
- 239000002245 particle Substances 0.000 description 1
- 238000003909 pattern recognition Methods 0.000 description 1
- 238000002135 phase contrast microscopy Methods 0.000 description 1
- 238000007781 pre-processing Methods 0.000 description 1
- 238000003672 processing method Methods 0.000 description 1
- 230000002062 proliferating effect Effects 0.000 description 1
- 230000000644 propagated effect Effects 0.000 description 1
- 230000001902 propagating effect Effects 0.000 description 1
- 239000002096 quantum dot Substances 0.000 description 1
- 230000009467 reduction Effects 0.000 description 1
- 238000012216 screening Methods 0.000 description 1
- BTIHMVBBUGXLCJ-OAHLLOKOSA-N seliciclib Chemical compound C=12N=CN(C(C)C)C2=NC(N[C@@H](CO)CC)=NC=1NCC1=CC=CC=C1 BTIHMVBBUGXLCJ-OAHLLOKOSA-N 0.000 description 1
- 239000004065 semiconductor Substances 0.000 description 1
- 238000000926 separation method Methods 0.000 description 1
- 238000012163 sequencing technique Methods 0.000 description 1
- 229910052710 silicon Inorganic materials 0.000 description 1
- 239000010703 silicon Substances 0.000 description 1
- 150000003384 small molecules Chemical class 0.000 description 1
- 238000000528 statistical test Methods 0.000 description 1
- 231100000331 toxic Toxicity 0.000 description 1
- 230000002588 toxic effect Effects 0.000 description 1
- 238000012546 transfer Methods 0.000 description 1
- 239000013598 vector Substances 0.000 description 1
Images


Classifications
-
- G—PHYSICS
- G06—COMPUTING; CALCULATING OR COUNTING
- G06T—IMAGE DATA PROCESSING OR GENERATION, IN GENERAL
- G06T7/00—Image analysis
- G06T7/0002—Inspection of images, e.g. flaw detection
- G06T7/0012—Biomedical image inspection
-
- G—PHYSICS
- G06—COMPUTING; CALCULATING OR COUNTING
- G06T—IMAGE DATA PROCESSING OR GENERATION, IN GENERAL
- G06T7/00—Image analysis
- G06T7/40—Analysis of texture
- G06T7/41—Analysis of texture based on statistical description of texture
- G06T7/42—Analysis of texture based on statistical description of texture using transform domain methods
-
- G—PHYSICS
- G01—MEASURING; TESTING
- G01N—INVESTIGATING OR ANALYSING MATERIALS BY DETERMINING THEIR CHEMICAL OR PHYSICAL PROPERTIES
- G01N15/00—Investigating characteristics of particles; Investigating permeability, pore-volume or surface-area of porous materials
- G01N15/10—Investigating individual particles
- G01N15/14—Optical investigation techniques, e.g. flow cytometry
- G01N15/1429—Signal processing
- G01N15/1433—Signal processing using image recognition
-
- G—PHYSICS
- G06—COMPUTING; CALCULATING OR COUNTING
- G06T—IMAGE DATA PROCESSING OR GENERATION, IN GENERAL
- G06T2207/00—Indexing scheme for image analysis or image enhancement
- G06T2207/10—Image acquisition modality
- G06T2207/10016—Video; Image sequence
-
- G—PHYSICS
- G06—COMPUTING; CALCULATING OR COUNTING
- G06T—IMAGE DATA PROCESSING OR GENERATION, IN GENERAL
- G06T2207/00—Indexing scheme for image analysis or image enhancement
- G06T2207/10—Image acquisition modality
- G06T2207/10056—Microscopic image
-
- G—PHYSICS
- G06—COMPUTING; CALCULATING OR COUNTING
- G06T—IMAGE DATA PROCESSING OR GENERATION, IN GENERAL
- G06T2207/00—Indexing scheme for image analysis or image enhancement
- G06T2207/20—Special algorithmic details
- G06T2207/20048—Transform domain processing
- G06T2207/20064—Wavelet transform [DWT]
-
- G—PHYSICS
- G06—COMPUTING; CALCULATING OR COUNTING
- G06T—IMAGE DATA PROCESSING OR GENERATION, IN GENERAL
- G06T2207/00—Indexing scheme for image analysis or image enhancement
- G06T2207/30—Subject of image; Context of image processing
- G06T2207/30004—Biomedical image processing
- G06T2207/30024—Cell structures in vitro; Tissue sections in vitro
-
- G—PHYSICS
- G06—COMPUTING; CALCULATING OR COUNTING
- G06T—IMAGE DATA PROCESSING OR GENERATION, IN GENERAL
- G06T2207/00—Indexing scheme for image analysis or image enhancement
- G06T2207/30—Subject of image; Context of image processing
- G06T2207/30168—Image quality inspection
Definitions
- the present invention relates to a system and method for detecting and eliminating one or more abnormal images acquired from biological samples.
- Motility and division are two fundamental cell behaviors that are of great importance in a number of areas of research, including oncology, immunology, and developmental biology. While these behaviors have unique analysis requirements, they also share several significant analysis challenges. Examination of these behaviors requires time-lapse imaging. Implementation of time-lapse imaging for large-scale experimentation poses challenges with respect to finding assay, imaging, and analysis parameters that will be optimal across the wide variety of treatment conditions and behavioral phenotypes represented in a particular data set. Another challenge is the frequent problem of low contrast-to-noise ratios in acquired images. In live-cell time-lapse experiments, poor contrast-to-noise ratios often arise from deliberate reduction of dye concentrations in order to avoid unwanted toxic side-effects such as DNA-binding, which inhibits DNA replication in living cells. An added challenge is that automated focus mechanisms occasionally fail under the demands of high-speed acquisition protocols. Model systems also typically contain far more targets (cells) than are monitored with common surveillance applications. Specific biological events such as mitosis also need to be handled.
- the present invention has been accomplished in view of the above-mentioned technical background, and it is an object of the present invention to provide a system and method for detecting a corrupted image acquired from a biological sample.
- a method for detecting a corrupted image acquired from a biological sample includes: providing at least one image of at least one cell; generating the image of the at least one cell over a period of time; determining if the at least one image of the at least one cell has corruptions; applying a wavelet transform, Fourier transform, or other frequency decomposing transform to the at least one image to decompose the at least one image into a plurality of sub-images, wherein the plurality of sub-images have a plurality of low frequency channels, a plurality of middle frequency channels and a plurality of high frequency channels; calculating a ratio based on an energy level of the plurality of low frequency channels and the plurality of middle frequency channels; and removing the at least one image of at least one cell if the at least one image has the corruptions.
- a system for detecting a corruption in an image acquired from a biological sample configured to transmit at least one image of at least one cell to an image receiving device.
- the image receiving device is configured to: provide at least one image of the at least one cell; determine if the at least one image of the at least one cell has corruptions; apply a wavelet transform, Fourier transform, or other frequency decomposing transform to the at least one image to decompose the at least one image into a plurality of sub-images, wherein the plurality of sub-images have a plurality of low frequency channels, a plurality of middle frequency channels and a plurality of high frequency channels; calculate a ratio based on an energy level of the plurality of low frequency channels and the plurality of middle frequency channels; and either remove the at least one image of at least one cell if the at least one image is corrupted, or segment and track objects within the image of the at least one cell if the at least one image does not have the corruption.
- an apparatus for detecting a corruption in an image is disclosed.
- An image receiving device is configured to: provide at least one image of the at least one cell; determine if the at least one image of the at least one cell is corrupted; apply a wavelet transform, Fourier transform, or other frequency decomposing transform to the at least one image to decompose the at least one image into a plurality of sub-images, wherein the plurality of sub-images have a plurality of low frequency channels, a plurality of middle frequency channels and a plurality of high frequency channels; calculate a ratio based on an energy level of the plurality of low frequency channels and the plurality of middle frequency channels; and remove the at least one image of at least one cell if the at least one image has the corruption.
- a computer-implemented image processing method for detecting a corruption in an image of biological material includes: providing at least one image of at least one cell; determining if the at least one image has the corruption; apply a wavelet transform, Fourier transform, or other frequency decomposing transform to the at least one image to decompose the at least one image into a plurality of sub-images, wherein the plurality of sub-images have a plurality of low frequency channels, a plurality of middle frequency channels and a plurality of high frequency channels; calculate a ratio based on an energy level of the plurality of low frequency channels and the plurality of middle frequency channels; and removing the at least one image of at least one cell if the at least one image has the corruption.
- FIG. 1 illustrates a block diagram of the essential components of a typical digital microscope system that includes a system for detecting a corruption in an image of a biological material.
- This automated digital microscope system 100 includes: a light source 105, propagation/beam shaping optics (light delivery) 101, beam folding optics 109, an objective turret 102 holding objective lens 123, sample 115, sample positioning stage 113, communication link 117, imaging optics (tube lens) 108, an optical detector 107, and an optional computer 103.
- the light source 105 may be a lamp, a laser, a plurality of lasers, a light emitting diode (LED), a plurality of LEDs, or any type of light source known to those of ordinary skill in the art that generates a light beam 106.
- the light beam 106 is directed by the propagation/beam-shaping optics 101, beam-folding optics 109 and objective lens 123 to illuminate the sample 115.
- Sample 115 includes biological material, such as cells, proteins, small molecules, oligonucleotides, proteins (e.g. enzymes, antibodies, etc.), tissue specimens, DNA, RNA and other typical biological materials.
- the light signal emanating from the sample 115 is collected by the objective lens 123 and imaging optics 108 to form an image on the optical detector 107.
- the optical detector 107 may be a photomultiplier tube, a charged coupled device (CCD), a complementary metal-oxide semiconductor (CMOS) image detector or any optical detector utilized by those of ordinary skill in the art.
- CMOS complementary metal-oxide semiconductor
- Optical detector 107 is electrically or wirelessly, connected by the communication link 117 to the computer 103.
- the optical detector 107 may be replaced with the typical microscope eyepiece or oculars that work with objective lens mounted in the objective turret 102 to further magnify the intermediate image so that specimen details can be observed.
- Sample 115 is contained in the sample holder 121, which may be referred to as a typical micro titer plate, a microscope slide, a microwell plate, a chip, plate of glass, Petri dish, plastic, or silicon or any type of typical holder.
- the microwell plate may have 96 wells, 384 wells, 1534 wells or any typical amount of wells in a microwell plate having any height, width, length, base, well diameter, well depth known to those of ordinary skill in the art.
- the microscope system 100 may be electrically or wirelessly connected by a communication link 117 to the conventional computer 103.
- the communication link 117 may be any network that is able to facilitate the transfer of data between the automated microscope system 100 and the computer 103, such as a local access network (LAN), a wireless local network, a wide area network (WAN), a universal service bus (USB), an Ethernet link, fiber-optic or the like.
- the microscope may also have a plurality of objective lenses 123.
- the computer 103 may be referred to as an image receiving device 103 or image detection device 103. In another example, image receiving device 103 may be located inside of the image transmitting device 100.
- the image receiving device 103 acts as a typical computer, which is capable of receiving an image of the sample 115 from the optical detector 107, then the image receiving device 103 is able to display, save or process the image by utilizing a standard image processing software program, analysis routine, algorithm or equation.
- the computer 103 may be a personal digital assistant (PDA), laptop computer, notebook computer, mobile telephone, hard-drive based device or any device that can receive, send and store information through the communication link 117. Although one computer is utilized in this invention, a plurality of computers may be utilized in place of computer 103.
- the microscope system 100 has been depicted schematically in Fig. 1 with only the essential components highlighted. It will be obvious to a person skilled in the art of microscopy that the block diagram describes all microscopes using an objective lens. Examples include, but are not limited to, conventional wide-field microscope, fluorescent microscope, traditional confocal microscope, line scanning confocal microscope. These types of microscopes may be augmented with automation equipment to serve different applications, such as high-throughput screening. However, they are not precluded from the scope of this invention. Also, the microscope system 100 may also be the INCELLTM Analyzer 1000 or 3000 manufactured by GE Healthcare in Piscataway, NJ.
- FIG. 2 illustrates a schematic diagram of the image receiving device of the corruption detection system of FIG. 1 .
- Image or imaging receiving device 103 includes the typical components associated with a conventional computer. Image receiving device 103 may also be stored on the image transmitting system 100.
- the image receiving device 103 includes: a processor 103a, an input/output (I/O) controller 103b, a mass storage 103c, a memory 103d, a video adapter 103e, a connection interface 103f and a system bus 103g that operatively, electrically or wirelessly, couples the aforementioned systems components to the processor 103a.
- the system bus 103g electrically or wirelessly, operatively couples typical computer system components to the processor 103a.
- the processor 103a may be referred to as a processing unit, a central processing unit (CPU), a plurality of processing units or a parallel processing unit.
- System bus 103g may be a typical bus associated with a conventional computer.
- Memory 103d includes a read only memory (ROM) and a random access memory (RAM).
- ROM includes a typical input/output system including basic routines, which assists in transferring information between components of the computer during start-up.
- Input/output controller 103b is connected to the processor 103a by the bus 103g, where the input/output controller 103b acts as an interface that allows a user to enter commands and information into the computer through an automatic corruption detection means such as an optional graphical user interface (GUI) and input device 104, such as a keyboard and pointing devices.
- GUI graphical user interface
- input device 104 such as a keyboard and pointing devices.
- the typical pointing devices utilized are joysticks, mouse, game pads or the like.
- a display 106 is electrically or wirelessly connected to the system bus 103g by the video adapter 103e.
- Display 106 may be the typical computer monitor, plasma television, liquid crystal display (LCD) or any device capable of displaying characters and/or still images generated by a computer 103.
- connection interface 103f Next to the video adapter 103e of the computer 103, is the connection interface 103f.
- the connection interface 103f may be referred to as a network interface, which is connected, as described above, by the communication link 117 to the optical detector 107.
- the image receiving device 103 may include a network adapter or a modem, which enables the image receiving device 103 to be coupled to other computers.
- the mass storage 103c which includes: 1.a hard disk drive component (not shown) for reading from and writing to a hard disk, and a hard disk drive interface (not shown), 2. a magnetic disk drive (not shown) and a hard disk drive interface (not shown) and 3. an optical disk drive (not shown) for reading from or writing to a removable optical disk such as a CD- ROM or other optical media and an optical disk drive interface (not shown).
- the aforementioned drives and their associated computer readable media provide nonvolatile storage of computer-readable instructions, data structures, program modules and other data for the computer 103.
- the aforementioned drives include the technical effect of having an algorithm, analysis routine, software or equation for determining if corruption or problems exist in an image of a biological material, which will be described in the flow chart of FIG. 3 .
- corruption, problem or faulty used in this application indicates that the image is defocused or has low contrast-to-noise ratio and can therefore lead to segmentation/tracking failures.
- the software has a corruption detection graphical user interface (GUI).
- GUI corruption detection graphical user interface
- the corruption detection graphical user interface is a specially programmed GUI that has some of the same functionality as a typical GUI, which is a software program designed to allow a computer user to interact easily with the computer 103.
- FIG. 3 depicts a flow chart of how corruption of an image of a biological sample is detected in a software application.
- This description is in reference to an image of one cell, but this description also applies to a plurality of images of one cell or a number of cells being detected by the microscope system 100.
- a user inserts the biological sample (e.g. cell or plurality of cells) into the microscope system 100, where an image of the sample is transferred by the optical detector 107 through the communication link 117 by the connection interface 103f ( FIG. 2 ) where the image is received at the image receiving device 103 at block 301.
- the user employs a pointing device 104 to generate one or more images of a population consisting of at least one cell over a period of time.
- Exposure times for a single image could range from 1 to 100 milliseconds in a typical assay, depending on the detection system.
- a series of such images is collected at specified intervals over a defined period of time, which could range from 1-100 milliseconds to several days.
- the acquired data of the cell could comprise an image of a single cell or a plurality of cells having a plurality of images.
- the user utilizes the pointing device 104 on the corruption detection graphical user interface to point to an icon that says, for example START, which allows the user to initiate the determination if the image of the biological material or cell is corrupted.
- this corruption detection graphical user interface and software is on a processor of the image receiving device 103. If the image does not exhibit a corruption, then the process goes through the normal segmentation and cell tracking procedure at block 307 the returns to block 301 where another image is received in sequence. However, if there is a determination that there is a corrupted image, then the image is discarded, and the next image is processed.
- FIG. 4 shows an illustration of a normal image, a defocused image and a low contrast to noise (CNR) ratio image.
- the defocused image (b) and the low CNR image (c) can lead to a failure of segmentation and tracking routines.
- a defocused image indicates that there is a problem with the algorithm on the microscope.
- a defocused image is one that is out-of-focus. In simple terms, focus can be defined as the state of maximum distinctness or clarity of the sample or sample feature to be imaged.
- a defocused image is an image that looks blurry or out-of focus because the imaging plane is not located in the same plane as the sample of interest.
- a low contrast to noise ratio image indicates there is a problem with protocol or lens of the microscope.
- low CNR Many things can contribute to low CNR, including: low concentration of contrast agent (e.g. fluorescent probe), degradation of contrast agent or its target, improper focus, high background signal from the sample (e.g. unincorporated probe), insufficient exposure time, over-exposure, lens aberrations, dirt on the lens, dirt on the sample support (e.g. fingerprint on the plate bottom), artifacts in the sample (e.g. dust) that obscure the true signal, etc.
- contributing factors can come the various elements that comprise the total system-e.g. the probe, the sample, the sample support, the acquisition conditions, the detection system.
- the associated algorithm, routine, software or equation described in FIG. 3 is utilized to detect automatically images that are defocused or have a low CNR, so that aberrant images can be removed from analysis before segmentation and tracking occur. Also, the algorithm finds when the CNR is not low but too low for downstream processing.
- a wavelet transform, Fourier transform, or other standard frequency decomposing transform is applied to the image of the at least one cell.
- separable 2D filters can be obtained from the successive 1D filtering using the scaling functions in Equation 1.
- Equation 2 The intuition of the operations in Equation 2 is that the ⁇ performs low-pass filtering in both x and y leading to a smooth version of the original, ⁇ h performs low-pass filtering in x and high-pass filtering in y leading to horizontal edges, ⁇ v leads to vertical edges, and ⁇ d leads to diagonal edges.
- the low-pass image is further decomposed into four channels, and the resulting images at each level are decimated or sub-sampled by 2.
- An example of the wavelet decomposition can be seen in FIG. 5 , where the subscripts on each of the ⁇ refer to level of the decomposition. For this FIG.
- the wavelet decomposition is for 5 levels, where the wavelets are shown as a plurality of sub-images.
- the plurality of sub-images has a plurality of low frequency channels for a first and second plurality of sub-images, a plurality of middle frequency channels for a third and fourth plurality of sub-images and a plurality of high frequency channels for a fifth plurality of sub-images.
- more or less than 5 levels of wavelet or plurality of sub-images may be decomposed.
- Each of the channels is identified as either an approximation channel ( ⁇ ) or a detail channel ( ⁇ ).
- Each detail channel is indicated by a subscript letter as defined in Equation 2 and by a number indicating the level of decomposition, with lower values representing lower frequencies. There is only one approximation channel.
- the energy in each channel provides insight into the texture of the image. Smooth images tend to concentrate most of the energy in the low frequency channels, whereas the wavelet decomposition of textured images show energy spread throughout the channels as stated in article by Porter R. Canagarajah, C.N. Porter, R., Canagaraja, C.N.: A Robust Automatic Clustering Scheme for Image Segmentation using Wavelets. IEEE Transactions on Image processing 5(4) (1996) pages 662-665 .
- the high-frequency noise is still present and thus provides little discriminative information. However the middle frequencies are attenuated relative to in-focus images.
- R d E ⁇ E ⁇ h ⁇ 1 + E ⁇ v ⁇ 1 + E ⁇ d ⁇ 1 + E ⁇ h ⁇ 2 + E ⁇ v ⁇ 2 + E ⁇ d ⁇ 2
- E (.) represents the energy operator
- the numbers represent the level of the decomposition, with lower numbers signifying lower frequencies.
- the ratio also finds images with low contrast-to-noise since the middle frequency energy in these images is also low relative to the low frequency energy. While it is desirable to find these images as well, it is helpful to separate them from defocused images since this gives additional feedback to the user or, potentially, to the microscope.
- an information entropy H ( X ) measure is utilized to separate these since the intensity distributions of the low contrast images are more uniform than those with high contrast.
- X is a discrete random variable that can take on possible values ( x 1 ,... x n ) corresponding to the bins of the standard probability density function of the image intensities. Due to the randomness in images with low contrast-to-noise, they have a lower entropy score than high contrast-to-noise images, even defocused images.
- X is a discrete random variable that can take on possible values ( x 1 ,... x n ) corresponding to the bins of the standard probability density function of the image intensities. Due to the randomness in images with low contrast-to-noise, they have a lower entropy score than high contrast-to-noise images, even defocused images.
- X is a discrete random variable that can take on possible values ( x 1 ,... x n ) corresponding to the bins of the standard probability density function of the image intensities. Due to the randomness in images with low contrast-to-noise, they have a lower entropy
- the wavelet energy score is used to separate normal images from defocused images.
- the defocused images are separated into those that are truly defocused and those with low contrast-to-noise using the entropy measure. This sequence can be seen in the flow chart of Figure 3 . Those images that pass these tests continue to the segmentation and tracking stages of block 305.
- the defocus and low CNR detection algorithms were used as a pre-processing module of the cell tracking system described in FIG. 3 .
- the aforementioned algorithms were run on a set of 4384 images under various experimental setups and different cell treatments and consisting of a mixture of defocused images and images with low CNR. Each of these images was manually annotated as to whether it was defocused, had low CNR, or was normal; in total, there were 190 defocused images, 100 low CNR images, and 4094 normal images.
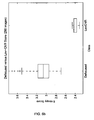
- FIG. 6(a) gives a box-plot of the defocus score for the defocused versus the normal images.
- the algorithm clearly separates the two classes; a threshold of 2 results in 1 missed detection (0.03% error) and 21 false positives ( ⁇ 5% error).
- FIG. 6(b) shows a box-plot of the entropy measure for the defocused versus the low-CNR images. The algorithm separates the two classes effectively, and results in perfect separation for a threshold of 2.5.
- the cell segmentation and tracking algorithms were applied to the datasets.
- the algorithms were applied to four datasetstwo with no treatment (control), and two treated with Roscovitine. Nuclei were stained with a relatively low concentration of the nuclear DNA stain HoechstTM33342 to aid identification.
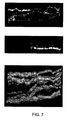
- FIG. 7 shows several examples of spatio-temporal trees extracted by the algorithms.
- the aforementioned algorithms are related to segmentation and tracking. Although the cells move in clusters, touch one another, and undergo mitosis, the algorithms are able to successfully separate the clusters into individual tracks. These figures show that the algorithm can extract not only the tracks, but also the shape of the cells over time.
- the distance was calculated from manually placed centroids to the centroids of the automatically segmented cells for every cell of one of the experiments. The mean distance was 5.5 ⁇ m , and the standard deviation was 6.8 ⁇ m ; the average cell diameter in these experiments was approximately 35 ⁇ m .
- the total number of manually identified cells was 6157, and 5758 were detected automatically, so that only 6% of the cells were under-segmented.
- the standard cell segmentation algorithms are utilized. For example, an algorithm based on the shift invariant wavelet frames transformation of the image as well as the filtering of non-salient wavelet coefficients is utilized.
- C s ( x, y ) is the multiplication of a subset of the denoised wavelet coefficients corresponding to the selected scales
- FIG. 7 shows an example segmentation of a low-dose Hoechst-stained section, demonstrating the accuracy of the segmentation approach even with a very low contrast-to-noise ratio. This shows that, even if some low-CNR images are passed by the low-CNR detection algorithms, they can be handled by the segmentation module, although the results are generally not as clean as with images with higher CNR.
- the segmented spatio-temporal volume is then labeled in 3D. This results in a 3D set of segmented "tubes" corresponding to cells moving through time.
- the 3D labeled "tubes" comprise two types of tracks: those corresponding to single cells (single-tracks) and those corresponding to multiple cells clustered together (multi-tracks).
- the goal of the spatio-temporal cluster segmentation step is to segment the multi-tracks into individual tracks by utilizing learned object descriptors.
- the distribution p of learned features that capture the appearance of cells f i t can be readily trained from the single-tracks. Alternatively, if few single-tracks are present in the dataset, these features can be trained using other datasets, assuming that the experimental conditions are kept constant.
- the cell clusters are segmented by taking advantage of temporal context for determining the best way to split cells. There is a determination of whether an object should be split into individual cells or a set of objects should be merged to form a cell.
- the temporal information is utilized by propagating higher likelihood cell segmentations to slices with lower likelihood.
- the algorithm propagates the segmented objects from slices with greater number of objects to those with fewer.
- the number of objects on the adjacent frame will be the same as the reference frame, and at least one object will have been segmented.
- the features f i t of each of the split segments are then used to calculate the likelihood of the segment being cell-like using the trained distribution parameters ⁇ and ⁇ G f i t ⁇ exp - 1 2 ⁇ f i t - ⁇ T ⁇ ⁇ - 1 ⁇ f i t - ⁇
- L merge is high when the combined labels on the reference frame have a higher likelihood than the separate labels
- L split is high when the separate labels on the adjacent frame have higher likelihood than when they are combined circumstances, when one is positive, the other will be negative, and the final decision combines both measures.
- mitosis is a special case, since a cell will be one object in one frame and two in the next. This case is handled implicitly by leaving the regions unchanged if both splitting the cell on the previous frame and merging the cells on the next frame lead to lower likelihoods.
- the causal relationships are also taken into account since cells can split over time but not merge.
- the step of renumbering the cells in the clusters to correctly associate cells across frames is accomplished using the parameters ⁇ d , ⁇ d of a distribution trained from the single-tracks.
- This invention provides a system and method that allows a user to determine if there are abnormalities in an image. If there are abnormalities in the image, then the user is able to determine what type of corruption is in the image. The user is able to quickly determine if there is an abnormal image in order to remove the image before it undergoes cell segmentation and tracking algorithm. The user is able to easily optimize the imaging conditions for viewing the image of the cell(s) by quickly determining if the image has a corruption and removing the image. Thus, this invention provides the user with a means to easily optimize the imaging conditions for experimentation.
Landscapes
- Engineering & Computer Science (AREA)
- Physics & Mathematics (AREA)
- Computer Vision & Pattern Recognition (AREA)
- Theoretical Computer Science (AREA)
- General Physics & Mathematics (AREA)
- Medical Informatics (AREA)
- Quality & Reliability (AREA)
- Radiology & Medical Imaging (AREA)
- Nuclear Medicine, Radiotherapy & Molecular Imaging (AREA)
- Health & Medical Sciences (AREA)
- General Health & Medical Sciences (AREA)
- Probability & Statistics with Applications (AREA)
- Image Processing (AREA)
- Investigating Or Analysing Biological Materials (AREA)
- Investigating, Analyzing Materials By Fluorescence Or Luminescence (AREA)
Claims (2)
- Verfahren zum Analysieren mehrerer Bilder einer biologischen Probe (115), die eine Population aus mindestens einer Zelle umfasst, aus einer Zeitreihenaufnahme, umfassend die Schritte:Erfassen verschwommener Bilder (305) durch:• Zerlegen jedes Bildes unter Verwendung einer Wavelet-Transformation in mehrere Teilbilder, die jeweils einen spezifischen Frequenzkanal darstellen, und ein Teilbild, das einen Näherungskanal darstellt,• Berechnen eines Unschärfeverhältnisses für jedes Bild als das Verhältnis zwischen der Energie des Näherungskanal-Teilbildes und der Summe der Energie der Teilbilder, die Mittelfrequenzkanäle darstellen, wobei die Energie als die mittlere Größe von Wavelet-Koeffizienten für jedes Teilbild definiert ist,• Vergleich des Unschärfeverhältnisses jedes Bildes mit einem vorgegebenen Unschärfeschwellenwert, wobei Bilder mit einem Unschärfeverhältnis, das den Unschärfeschwellenwert übersteigt, als verschwommen identifiziert werden,Durchführen einer anschließenden Segmentierung und Verfolgung der mindestens einen Zelle in Bildern, die nicht als verschwommen identifiziert sind (307).
- Verfahren nach Anspruch 1, wobei die Wavelets eine Verwendung von Filterpaaren beinhalten, die ein Filter enthalten, das aus den Tiefpassfilterkoeffizienten h (k) und den Hochpassfilterkoeffizienten g(k) = (-1) k+ 1h/(L+1-k) besteht, wobei k = 1... L den Grad der Zerlegung darstellt und L die Anzahl von Graden ist und wobei das Mutter-Wavelet aus der Skalierungsfunktion konstruiert wird als:


wobei ein Näherungskanal und drei Detailkanäle bereitgestellt werden


wobei i der x-Index und j der y-Index ist,
und wobei das Unschärfeverhältnis Rd berechnet wird als
wobei E(.) den Energieoperator darstellt:
wobei IJ die Anzahl von Koeffizienten in Kanal x ist und x(i,j) der Wert des Koeffizienten ist und die Zahlen den Grad der Zerlegung darstellen, wobei niedrigere Zahlen niedrigere Frequenzen angeben.
Applications Claiming Priority (2)
| Application Number | Priority Date | Filing Date | Title |
|---|---|---|---|
| US5721208P | 2008-05-30 | 2008-05-30 | |
| PCT/SE2009/050623 WO2009145723A1 (en) | 2008-05-30 | 2009-05-29 | System and method for detecting and eliminating one or more defocused or low contrast-to-noise ratio images |
Publications (3)
| Publication Number | Publication Date |
|---|---|
| EP2283463A1 EP2283463A1 (de) | 2011-02-16 |
| EP2283463A4 EP2283463A4 (de) | 2011-08-31 |
| EP2283463B1 true EP2283463B1 (de) | 2014-10-29 |
Family
ID=41377348
Family Applications (1)
| Application Number | Title | Priority Date | Filing Date |
|---|---|---|---|
| EP09755161.8A Active EP2283463B1 (de) | 2008-05-30 | 2009-05-29 | System und verfahren zur erkennung und entfernung eines oder mehrerer defokussierter bilder oder eines oder mehrerer bilder mit geringem kontrast-rausch-verhältnis |
Country Status (4)
| Country | Link |
|---|---|
| US (1) | US8588503B2 (de) |
| EP (1) | EP2283463B1 (de) |
| JP (1) | JP5554776B2 (de) |
| WO (1) | WO2009145723A1 (de) |
Families Citing this family (16)
| Publication number | Priority date | Publication date | Assignee | Title |
|---|---|---|---|---|
| WO2011153500A2 (en) | 2010-06-04 | 2011-12-08 | Aperio Technologies, Inc. | System and method to determine slide quality of a digitized microscope slide |
| CN102044069B (zh) * | 2010-12-01 | 2012-05-09 | 华中科技大学 | 一种白细胞图像分割方法 |
| JP4988057B1 (ja) | 2011-10-11 | 2012-08-01 | アキュートロジック株式会社 | 全焦点画像生成方法、全焦点画像生成装置、全焦点画像生成プログラム、被写体高さ情報取得方法、被写体高さ情報取得装置及び被写体高さ情報取得プログラム |
| JP5861428B2 (ja) * | 2011-12-08 | 2016-02-16 | 大日本印刷株式会社 | 細胞挙動検出装置、細胞挙動検出方法、及びプログラム |
| EP2660639B1 (de) * | 2012-05-02 | 2016-04-13 | Centre National De La Recherche Scientifique | Verfahren und Vorrichtung zur Einzelteilchenlokalisierung mittels Waveletanalyse |
| CN104574346A (zh) * | 2013-10-23 | 2015-04-29 | 核工业北京地质研究院 | 一种光学遥感图像分解算法 |
| EP3265956A1 (de) * | 2015-03-02 | 2018-01-10 | Siemens Aktiengesellschaft | Klassifizierung von zellularen bildern und videos |
| CN107408197A (zh) * | 2015-03-11 | 2017-11-28 | 西门子公司 | 基于解卷积网络的细胞图像和视频的分类的系统和方法 |
| US9466001B1 (en) * | 2015-04-07 | 2016-10-11 | Toshiba Tec Kabushiki Kaisha | Image processing apparatus and computer-readable storage medium |
| US9715721B2 (en) * | 2015-12-18 | 2017-07-25 | Sony Corporation | Focus detection |
| US10983039B2 (en) | 2016-01-27 | 2021-04-20 | Hitachi High-Tech Corporation | Observation device |
| EP3478728B1 (de) | 2016-06-30 | 2024-08-28 | Konica Minolta Laboratory U.S.A., Inc. | Verfahren und system für zellannotation mit adaptivem inkrementellem lernen |
| US10423819B2 (en) * | 2017-10-31 | 2019-09-24 | Chung Yuan Christian University | Method and apparatus for image processing and visualization for analyzing cell kinematics in cell culture |
| IT201800001656A1 (it) * | 2018-01-23 | 2019-07-23 | Centro Cardiologico Spa Fond Monzino In Forma Abbreviata Centro Cardiologico Monzino Spa | Metodo di elaborazione di immagini e metodo per la determinazione di caratteristiche quantitative e/o qualitative degli oggetti riprodotti in una immagine, sistema per l’elaborazione di immagini e sistema per la determinazione di caratteristiche quantitative e/o qualitative degli oggetti riprodotti in una immagine |
| CN110113618B (zh) * | 2019-06-11 | 2021-09-03 | 苏州泓迅生物科技股份有限公司 | 一种图像存储方法、读取方法、存储装置和读取装置 |
| CN111079805A (zh) * | 2019-12-03 | 2020-04-28 | 浙江工业大学 | 一种结合注意力机制及信息熵最小化的异常图像检测方法 |
Family Cites Families (11)
| Publication number | Priority date | Publication date | Assignee | Title |
|---|---|---|---|---|
| US6075905A (en) * | 1996-07-17 | 2000-06-13 | Sarnoff Corporation | Method and apparatus for mosaic image construction |
| US7133543B2 (en) * | 2001-06-12 | 2006-11-07 | Applied Imaging Corporation | Automated scanning method for pathology samples |
| US7298876B1 (en) * | 2002-11-04 | 2007-11-20 | R2 Technology, Inc. | Method and apparatus for quality assurance and quality control in radiological equipment using automatic analysis tools |
| US7181082B2 (en) * | 2002-12-18 | 2007-02-20 | Sharp Laboratories Of America, Inc. | Blur detection system |
| US7680308B2 (en) * | 2004-05-11 | 2010-03-16 | Dale Richard B | Medical imaging-quality assessment and improvement system (QAISys) |
| JP2007018379A (ja) * | 2005-07-08 | 2007-01-25 | Konica Minolta Medical & Graphic Inc | 画像処理方法及び画像処理装置 |
| US8041090B2 (en) | 2005-09-10 | 2011-10-18 | Ge Healthcare Uk Limited | Method of, and apparatus and computer software for, performing image processing |
| JP4840854B2 (ja) * | 2006-01-27 | 2011-12-21 | 国立大学法人東京農工大学 | 電子顕微鏡の画像処理システム及び方法並びにスペクトル処理システム及び方法 |
| WO2007121454A1 (en) * | 2006-04-18 | 2007-10-25 | Ge Healthcare Bio-Sciences Corp. | System for preparing an image for segmentation |
| JP2007334746A (ja) * | 2006-06-16 | 2007-12-27 | Olympus Corp | 画像処理装置および画像処理プログラム |
| US8270695B2 (en) * | 2008-10-07 | 2012-09-18 | Carestream Health, Inc. | Diagnostic image processing with automatic self image quality validation |
-
2009
- 2009-05-29 JP JP2011511567A patent/JP5554776B2/ja active Active
- 2009-05-29 US US12/993,180 patent/US8588503B2/en active Active
- 2009-05-29 WO PCT/SE2009/050623 patent/WO2009145723A1/en active Application Filing
- 2009-05-29 EP EP09755161.8A patent/EP2283463B1/de active Active
Also Published As
| Publication number | Publication date |
|---|---|
| EP2283463A1 (de) | 2011-02-16 |
| JP5554776B2 (ja) | 2014-07-23 |
| US20110069905A1 (en) | 2011-03-24 |
| JP2011525009A (ja) | 2011-09-08 |
| EP2283463A4 (de) | 2011-08-31 |
| US8588503B2 (en) | 2013-11-19 |
| WO2009145723A1 (en) | 2009-12-03 |
Similar Documents
| Publication | Publication Date | Title |
|---|---|---|
| EP2283463B1 (de) | System und verfahren zur erkennung und entfernung eines oder mehrerer defokussierter bilder oder eines oder mehrerer bilder mit geringem kontrast-rausch-verhältnis | |
| JP2011525009A5 (de) | ||
| US11803968B2 (en) | Automated stereology for determining tissue characteristics | |
| EP3151192B1 (de) | Verfahren und system zur automatischen analyse von zellbildern | |
| US8744164B2 (en) | Automated analysis of images using bright field microscopy | |
| Campanella et al. | Towards machine learned quality control: A benchmark for sharpness quantification in digital pathology | |
| EP2053535B1 (de) | Automatischer Nachweis von Zellkolonien und Deckglasnachweis unter Anwendung von Hough-Transformationen | |
| JP5709836B2 (ja) | 生体物質を識別するシステム及び方法 | |
| JP2016533475A (ja) | 適応的病理組織画像分解のためのシステム及び方法 | |
| WO2019243897A2 (en) | System and method for detection and classification of objects of interest in microscope images by supervised machine learning | |
| Padfield et al. | Spatio-temporal cell segmentation and tracking for automated screening | |
| US8064679B2 (en) | Targeted edge detection method and apparatus for cytological image processing applications | |
| EP3676750B1 (de) | Nachweis biologischer zellen und nachweis von zelllinien | |
| EP3837664A1 (de) | Erzeugung von anmerkungsdaten von gewebebildern | |
| Fazel et al. | Analysis of super-resolution single molecule localization microscopy data: A tutorial | |
| Harder et al. | Large‐scale tracking and classification for automatic analysis of cell migration and proliferation, and experimental optimization of high‐throughput screens of neuroblastoma cells | |
| Dave et al. | MIMO U-Net: efficient cell segmentation and counting in microscopy image sequences | |
| Mignardi et al. | Bridging histology and bioinformatics—computational analysis of spatially resolved transcriptomics | |
| Govind et al. | Automated erythrocyte detection and classification from whole slide images | |
| Krappe et al. | Automated classification of bone marrow cells in microscopic images for diagnosis of leukemia: a comparison of two classification schemes with respect to the segmentation quality | |
| Qiu et al. | Automated detection of analyzable metaphase chromosome cells depicted on scanned digital microscopic images | |
| Padfield et al. | Defocus and low CNR detection for cell tracking applications | |
| Chenouard | Advances in probabilistic particle tracking for biomedical imaging | |
| Iannello et al. | An efficient autofocus algorithm for indirect immunofluorescence applications | |
| US10867208B2 (en) | Unbiased feature selection in high content analysis of biological image samples |
Legal Events
| Date | Code | Title | Description |
|---|---|---|---|
| PUAI | Public reference made under article 153(3) epc to a published international application that has entered the european phase |
Free format text: ORIGINAL CODE: 0009012 |
|
| AK | Designated contracting states |
Kind code of ref document: A1 Designated state(s): AT BE BG CH CY CZ DE DK EE ES FI FR GB GR HR HU IE IS IT LI LT LU LV MC MK MT NL NO PL PT RO SE SI SK TR |
|
| AX | Request for extension of the european patent |
Extension state: AL BA RS |
|
| 17P | Request for examination filed |
Effective date: 20101112 |
|
| RIN1 | Information on inventor provided before grant (corrected) |
Inventor name: PADFIELD, DIRK, R. Inventor name: ADIGA, UMESH Inventor name: RITTSCHER, JENS Inventor name: LI, XUDONG Inventor name: CAN, ALI Inventor name: ROQUEMORE, ELIZABETH, P. |
|
| A4 | Supplementary search report drawn up and despatched |
Effective date: 20110802 |
|
| RIC1 | Information provided on ipc code assigned before grant |
Ipc: G06K 9/62 20060101ALI20110722BHEP Ipc: G06K 9/52 20060101ALI20110722BHEP Ipc: H04N 5/232 20060101ALI20110722BHEP Ipc: G06K 9/00 20060101ALI20110722BHEP Ipc: G06T 7/00 20060101AFI20110722BHEP |
|
| DAX | Request for extension of the european patent (deleted) | ||
| 17Q | First examination report despatched |
Effective date: 20120510 |
|
| GRAP | Despatch of communication of intention to grant a patent |
Free format text: ORIGINAL CODE: EPIDOSNIGR1 |
|
| INTG | Intention to grant announced |
Effective date: 20140625 |
|
| GRAS | Grant fee paid |
Free format text: ORIGINAL CODE: EPIDOSNIGR3 |
|
| GRAA | (expected) grant |
Free format text: ORIGINAL CODE: 0009210 |
|
| AK | Designated contracting states |
Kind code of ref document: B1 Designated state(s): AT BE BG CH CY CZ DE DK EE ES FI FR GB GR HR HU IE IS IT LI LT LU LV MC MK MT NL NO PL PT RO SE SI SK TR |
|
| REG | Reference to a national code |
Ref country code: GB Ref legal event code: FG4D |
|
| REG | Reference to a national code |
Ref country code: CH Ref legal event code: EP |
|
| REG | Reference to a national code |
Ref country code: AT Ref legal event code: REF Ref document number: 693901 Country of ref document: AT Kind code of ref document: T Effective date: 20141115 |
|
| REG | Reference to a national code |
Ref country code: IE Ref legal event code: FG4D |
|
| REG | Reference to a national code |
Ref country code: DE Ref legal event code: R096 Ref document number: 602009027453 Country of ref document: DE Effective date: 20141211 |
|
| REG | Reference to a national code |
Ref country code: AT Ref legal event code: MK05 Ref document number: 693901 Country of ref document: AT Kind code of ref document: T Effective date: 20141029 |
|
| REG | Reference to a national code |
Ref country code: NL Ref legal event code: VDEP Effective date: 20141029 |
|
| REG | Reference to a national code |
Ref country code: LT Ref legal event code: MG4D |
|
| PG25 | Lapsed in a contracting state [announced via postgrant information from national office to epo] |
Ref country code: IS Free format text: LAPSE BECAUSE OF FAILURE TO SUBMIT A TRANSLATION OF THE DESCRIPTION OR TO PAY THE FEE WITHIN THE PRESCRIBED TIME-LIMIT Effective date: 20150228 Ref country code: NL Free format text: LAPSE BECAUSE OF FAILURE TO SUBMIT A TRANSLATION OF THE DESCRIPTION OR TO PAY THE FEE WITHIN THE PRESCRIBED TIME-LIMIT Effective date: 20141029 Ref country code: LT Free format text: LAPSE BECAUSE OF FAILURE TO SUBMIT A TRANSLATION OF THE DESCRIPTION OR TO PAY THE FEE WITHIN THE PRESCRIBED TIME-LIMIT Effective date: 20141029 Ref country code: PT Free format text: LAPSE BECAUSE OF FAILURE TO SUBMIT A TRANSLATION OF THE DESCRIPTION OR TO PAY THE FEE WITHIN THE PRESCRIBED TIME-LIMIT Effective date: 20150302 Ref country code: NO Free format text: LAPSE BECAUSE OF FAILURE TO SUBMIT A TRANSLATION OF THE DESCRIPTION OR TO PAY THE FEE WITHIN THE PRESCRIBED TIME-LIMIT Effective date: 20150129 Ref country code: FI Free format text: LAPSE BECAUSE OF FAILURE TO SUBMIT A TRANSLATION OF THE DESCRIPTION OR TO PAY THE FEE WITHIN THE PRESCRIBED TIME-LIMIT Effective date: 20141029 Ref country code: ES Free format text: LAPSE BECAUSE OF FAILURE TO SUBMIT A TRANSLATION OF THE DESCRIPTION OR TO PAY THE FEE WITHIN THE PRESCRIBED TIME-LIMIT Effective date: 20141029 |
|
| PG25 | Lapsed in a contracting state [announced via postgrant information from national office to epo] |
Ref country code: AT Free format text: LAPSE BECAUSE OF FAILURE TO SUBMIT A TRANSLATION OF THE DESCRIPTION OR TO PAY THE FEE WITHIN THE PRESCRIBED TIME-LIMIT Effective date: 20141029 Ref country code: LV Free format text: LAPSE BECAUSE OF FAILURE TO SUBMIT A TRANSLATION OF THE DESCRIPTION OR TO PAY THE FEE WITHIN THE PRESCRIBED TIME-LIMIT Effective date: 20141029 Ref country code: SE Free format text: LAPSE BECAUSE OF FAILURE TO SUBMIT A TRANSLATION OF THE DESCRIPTION OR TO PAY THE FEE WITHIN THE PRESCRIBED TIME-LIMIT Effective date: 20141029 Ref country code: PL Free format text: LAPSE BECAUSE OF FAILURE TO SUBMIT A TRANSLATION OF THE DESCRIPTION OR TO PAY THE FEE WITHIN THE PRESCRIBED TIME-LIMIT Effective date: 20141029 Ref country code: GR Free format text: LAPSE BECAUSE OF FAILURE TO SUBMIT A TRANSLATION OF THE DESCRIPTION OR TO PAY THE FEE WITHIN THE PRESCRIBED TIME-LIMIT Effective date: 20150130 Ref country code: CY Free format text: LAPSE BECAUSE OF FAILURE TO SUBMIT A TRANSLATION OF THE DESCRIPTION OR TO PAY THE FEE WITHIN THE PRESCRIBED TIME-LIMIT Effective date: 20141029 Ref country code: HR Free format text: LAPSE BECAUSE OF FAILURE TO SUBMIT A TRANSLATION OF THE DESCRIPTION OR TO PAY THE FEE WITHIN THE PRESCRIBED TIME-LIMIT Effective date: 20141029 |
|
| REG | Reference to a national code |
Ref country code: DE Ref legal event code: R097 Ref document number: 602009027453 Country of ref document: DE |
|
| PG25 | Lapsed in a contracting state [announced via postgrant information from national office to epo] |
Ref country code: RO Free format text: LAPSE BECAUSE OF FAILURE TO SUBMIT A TRANSLATION OF THE DESCRIPTION OR TO PAY THE FEE WITHIN THE PRESCRIBED TIME-LIMIT Effective date: 20141029 Ref country code: DK Free format text: LAPSE BECAUSE OF FAILURE TO SUBMIT A TRANSLATION OF THE DESCRIPTION OR TO PAY THE FEE WITHIN THE PRESCRIBED TIME-LIMIT Effective date: 20141029 Ref country code: EE Free format text: LAPSE BECAUSE OF FAILURE TO SUBMIT A TRANSLATION OF THE DESCRIPTION OR TO PAY THE FEE WITHIN THE PRESCRIBED TIME-LIMIT Effective date: 20141029 Ref country code: SK Free format text: LAPSE BECAUSE OF FAILURE TO SUBMIT A TRANSLATION OF THE DESCRIPTION OR TO PAY THE FEE WITHIN THE PRESCRIBED TIME-LIMIT Effective date: 20141029 Ref country code: CZ Free format text: LAPSE BECAUSE OF FAILURE TO SUBMIT A TRANSLATION OF THE DESCRIPTION OR TO PAY THE FEE WITHIN THE PRESCRIBED TIME-LIMIT Effective date: 20141029 |
|
| PGFP | Annual fee paid to national office [announced via postgrant information from national office to epo] |
Ref country code: GB Payment date: 20150527 Year of fee payment: 7 |
|
| PG25 | Lapsed in a contracting state [announced via postgrant information from national office to epo] |
Ref country code: IT Free format text: LAPSE BECAUSE OF FAILURE TO SUBMIT A TRANSLATION OF THE DESCRIPTION OR TO PAY THE FEE WITHIN THE PRESCRIBED TIME-LIMIT Effective date: 20141029 |
|
| PLBE | No opposition filed within time limit |
Free format text: ORIGINAL CODE: 0009261 |
|
| STAA | Information on the status of an ep patent application or granted ep patent |
Free format text: STATUS: NO OPPOSITION FILED WITHIN TIME LIMIT |
|
| 26N | No opposition filed |
Effective date: 20150730 |
|
| REG | Reference to a national code |
Ref country code: CH Ref legal event code: PL |
|
| PG25 | Lapsed in a contracting state [announced via postgrant information from national office to epo] |
Ref country code: LI Free format text: LAPSE BECAUSE OF NON-PAYMENT OF DUE FEES Effective date: 20150531 Ref country code: MC Free format text: LAPSE BECAUSE OF FAILURE TO SUBMIT A TRANSLATION OF THE DESCRIPTION OR TO PAY THE FEE WITHIN THE PRESCRIBED TIME-LIMIT Effective date: 20141029 Ref country code: LU Free format text: LAPSE BECAUSE OF FAILURE TO SUBMIT A TRANSLATION OF THE DESCRIPTION OR TO PAY THE FEE WITHIN THE PRESCRIBED TIME-LIMIT Effective date: 20150529 Ref country code: CH Free format text: LAPSE BECAUSE OF NON-PAYMENT OF DUE FEES Effective date: 20150531 |
|
| REG | Reference to a national code |
Ref country code: IE Ref legal event code: MM4A |
|
| REG | Reference to a national code |
Ref country code: FR Ref legal event code: ST Effective date: 20160129 |
|
| PG25 | Lapsed in a contracting state [announced via postgrant information from national office to epo] |
Ref country code: SI Free format text: LAPSE BECAUSE OF FAILURE TO SUBMIT A TRANSLATION OF THE DESCRIPTION OR TO PAY THE FEE WITHIN THE PRESCRIBED TIME-LIMIT Effective date: 20141029 |
|
| PG25 | Lapsed in a contracting state [announced via postgrant information from national office to epo] |
Ref country code: IE Free format text: LAPSE BECAUSE OF NON-PAYMENT OF DUE FEES Effective date: 20150529 |
|
| PG25 | Lapsed in a contracting state [announced via postgrant information from national office to epo] |
Ref country code: FR Free format text: LAPSE BECAUSE OF NON-PAYMENT OF DUE FEES Effective date: 20150601 |
|
| PG25 | Lapsed in a contracting state [announced via postgrant information from national office to epo] |
Ref country code: MT Free format text: LAPSE BECAUSE OF FAILURE TO SUBMIT A TRANSLATION OF THE DESCRIPTION OR TO PAY THE FEE WITHIN THE PRESCRIBED TIME-LIMIT Effective date: 20141029 |
|
| GBPC | Gb: european patent ceased through non-payment of renewal fee |
Effective date: 20160529 |
|
| PG25 | Lapsed in a contracting state [announced via postgrant information from national office to epo] |
Ref country code: BG Free format text: LAPSE BECAUSE OF FAILURE TO SUBMIT A TRANSLATION OF THE DESCRIPTION OR TO PAY THE FEE WITHIN THE PRESCRIBED TIME-LIMIT Effective date: 20141029 Ref country code: HU Free format text: LAPSE BECAUSE OF FAILURE TO SUBMIT A TRANSLATION OF THE DESCRIPTION OR TO PAY THE FEE WITHIN THE PRESCRIBED TIME-LIMIT; INVALID AB INITIO Effective date: 20090529 Ref country code: GB Free format text: LAPSE BECAUSE OF NON-PAYMENT OF DUE FEES Effective date: 20160529 |
|
| PG25 | Lapsed in a contracting state [announced via postgrant information from national office to epo] |
Ref country code: TR Free format text: LAPSE BECAUSE OF FAILURE TO SUBMIT A TRANSLATION OF THE DESCRIPTION OR TO PAY THE FEE WITHIN THE PRESCRIBED TIME-LIMIT Effective date: 20141029 |
|
| PG25 | Lapsed in a contracting state [announced via postgrant information from national office to epo] |
Ref country code: BE Free format text: LAPSE BECAUSE OF FAILURE TO SUBMIT A TRANSLATION OF THE DESCRIPTION OR TO PAY THE FEE WITHIN THE PRESCRIBED TIME-LIMIT Effective date: 20141029 |
|
| PG25 | Lapsed in a contracting state [announced via postgrant information from national office to epo] |
Ref country code: MK Free format text: LAPSE BECAUSE OF FAILURE TO SUBMIT A TRANSLATION OF THE DESCRIPTION OR TO PAY THE FEE WITHIN THE PRESCRIBED TIME-LIMIT Effective date: 20141029 |
|
| REG | Reference to a national code |
Ref country code: DE Ref legal event code: R081 Ref document number: 602009027453 Country of ref document: DE Owner name: GLOBAL LIFE SCIENCES SOLUTIONS USA LLC, MARLBO, US Free format text: FORMER OWNER: GE HEALTHCARE BIO-SCIENCES CORP., PISCATAWAY, N.J., US |
|
| P01 | Opt-out of the competence of the unified patent court (upc) registered |
Effective date: 20230530 |
|
| PGFP | Annual fee paid to national office [announced via postgrant information from national office to epo] |
Ref country code: DE Payment date: 20240328 Year of fee payment: 16 |