EP2182840B1 - Non-invasive characterization of human vasculature - Google Patents
Non-invasive characterization of human vasculature Download PDFInfo
- Publication number
- EP2182840B1 EP2182840B1 EP08795384.0A EP08795384A EP2182840B1 EP 2182840 B1 EP2182840 B1 EP 2182840B1 EP 08795384 A EP08795384 A EP 08795384A EP 2182840 B1 EP2182840 B1 EP 2182840B1
- Authority
- EP
- European Patent Office
- Prior art keywords
- signal
- data
- accelerometers
- patient
- head
- Prior art date
- Legal status (The legal status is an assumption and is not a legal conclusion. Google has not performed a legal analysis and makes no representation as to the accuracy of the status listed.)
- Active
Links
- JAPMJSVZDUYFKL-UHFFFAOYSA-N C1C2C1CCC2 Chemical compound C1C2C1CCC2 JAPMJSVZDUYFKL-UHFFFAOYSA-N 0.000 description 1
Images








Classifications
-
- A—HUMAN NECESSITIES
- A61—MEDICAL OR VETERINARY SCIENCE; HYGIENE
- A61B—DIAGNOSIS; SURGERY; IDENTIFICATION
- A61B7/00—Instruments for auscultation
- A61B7/02—Stethoscopes
- A61B7/04—Electric stethoscopes
-
- A—HUMAN NECESSITIES
- A61—MEDICAL OR VETERINARY SCIENCE; HYGIENE
- A61B—DIAGNOSIS; SURGERY; IDENTIFICATION
- A61B5/00—Measuring for diagnostic purposes; Identification of persons
- A61B5/02—Detecting, measuring or recording for evaluating the cardiovascular system, e.g. pulse, heart rate, blood pressure or blood flow
- A61B5/02007—Evaluating blood vessel condition, e.g. elasticity, compliance
-
- A—HUMAN NECESSITIES
- A61—MEDICAL OR VETERINARY SCIENCE; HYGIENE
- A61B—DIAGNOSIS; SURGERY; IDENTIFICATION
- A61B5/00—Measuring for diagnostic purposes; Identification of persons
- A61B5/40—Detecting, measuring or recording for evaluating the nervous system
- A61B5/4076—Diagnosing or monitoring particular conditions of the nervous system
-
- A—HUMAN NECESSITIES
- A61—MEDICAL OR VETERINARY SCIENCE; HYGIENE
- A61B—DIAGNOSIS; SURGERY; IDENTIFICATION
- A61B5/00—Measuring for diagnostic purposes; Identification of persons
- A61B5/68—Arrangements of detecting, measuring or recording means, e.g. sensors, in relation to patient
- A61B5/6801—Arrangements of detecting, measuring or recording means, e.g. sensors, in relation to patient specially adapted to be attached to or worn on the body surface
- A61B5/6813—Specially adapted to be attached to a specific body part
- A61B5/6814—Head
-
- G—PHYSICS
- G16—INFORMATION AND COMMUNICATION TECHNOLOGY [ICT] SPECIALLY ADAPTED FOR SPECIFIC APPLICATION FIELDS
- G16H—HEALTHCARE INFORMATICS, i.e. INFORMATION AND COMMUNICATION TECHNOLOGY [ICT] SPECIALLY ADAPTED FOR THE HANDLING OR PROCESSING OF MEDICAL OR HEALTHCARE DATA
- G16H30/00—ICT specially adapted for the handling or processing of medical images
- G16H30/40—ICT specially adapted for the handling or processing of medical images for processing medical images, e.g. editing
-
- G—PHYSICS
- G16—INFORMATION AND COMMUNICATION TECHNOLOGY [ICT] SPECIALLY ADAPTED FOR SPECIFIC APPLICATION FIELDS
- G16H—HEALTHCARE INFORMATICS, i.e. INFORMATION AND COMMUNICATION TECHNOLOGY [ICT] SPECIALLY ADAPTED FOR THE HANDLING OR PROCESSING OF MEDICAL OR HEALTHCARE DATA
- G16H50/00—ICT specially adapted for medical diagnosis, medical simulation or medical data mining; ICT specially adapted for detecting, monitoring or modelling epidemics or pandemics
- G16H50/20—ICT specially adapted for medical diagnosis, medical simulation or medical data mining; ICT specially adapted for detecting, monitoring or modelling epidemics or pandemics for computer-aided diagnosis, e.g. based on medical expert systems
-
- G—PHYSICS
- G16—INFORMATION AND COMMUNICATION TECHNOLOGY [ICT] SPECIALLY ADAPTED FOR SPECIFIC APPLICATION FIELDS
- G16H—HEALTHCARE INFORMATICS, i.e. INFORMATION AND COMMUNICATION TECHNOLOGY [ICT] SPECIALLY ADAPTED FOR THE HANDLING OR PROCESSING OF MEDICAL OR HEALTHCARE DATA
- G16H50/00—ICT specially adapted for medical diagnosis, medical simulation or medical data mining; ICT specially adapted for detecting, monitoring or modelling epidemics or pandemics
- G16H50/50—ICT specially adapted for medical diagnosis, medical simulation or medical data mining; ICT specially adapted for detecting, monitoring or modelling epidemics or pandemics for simulation or modelling of medical disorders
-
- G—PHYSICS
- G16—INFORMATION AND COMMUNICATION TECHNOLOGY [ICT] SPECIALLY ADAPTED FOR SPECIFIC APPLICATION FIELDS
- G16H—HEALTHCARE INFORMATICS, i.e. INFORMATION AND COMMUNICATION TECHNOLOGY [ICT] SPECIALLY ADAPTED FOR THE HANDLING OR PROCESSING OF MEDICAL OR HEALTHCARE DATA
- G16H70/00—ICT specially adapted for the handling or processing of medical references
-
- A—HUMAN NECESSITIES
- A61—MEDICAL OR VETERINARY SCIENCE; HYGIENE
- A61B—DIAGNOSIS; SURGERY; IDENTIFICATION
- A61B5/00—Measuring for diagnostic purposes; Identification of persons
- A61B5/72—Signal processing specially adapted for physiological signals or for diagnostic purposes
- A61B5/7235—Details of waveform analysis
- A61B5/7264—Classification of physiological signals or data, e.g. using neural networks, statistical classifiers, expert systems or fuzzy systems
- A61B5/7267—Classification of physiological signals or data, e.g. using neural networks, statistical classifiers, expert systems or fuzzy systems involving training the classification device
Definitions
- This invention concerns detection of conditions of human vasculature non-invasively, from outside the body, and in particular, locating aneurysms, partial or complete stenoses, ruptures, peripheral bleeding and other abnormal conditions pertaining to the cerebral vasculature, profiling blood or other fluid flow through or around the cerebral vasculature and mapping the resultant flow to provide a spatially resolved characterization of the major vasculature within the head.
- the system and method of the invention are also useful to detect vascular conditions in other parts of the body, especially the limbs and areas of other major vessels.
- Stroke is a manifestation of vascular injury to the brain which is commonly secondary to atherosclerosis or hypertension, and is the third leading cause of death in the United States. Stroke can be categorized into two types, ischemic stroke and hemorrhagic stroke. Additionally, a patient may experience transient ischemic attacks, which are in turn a high risk factor for the future development of a more severe episode.
- Ischemic stroke encompass thrombotic, embolic, lacunar and hypoperfusion types of strokes.
- Thrombi are occlusions of the arteries created in situ within the brain, while emboli are occlusions caused by material from a distant source, such as the heart and major vessels, often dislodged due to myocardial infarct or atrial fibrillation or carotid disease or surgical or percutaneous intervention.
- Thrombi or emboli can result from atherosclerosis or other disorders, for example, arteritis and lead to physical obstruction of arterial blood supply to the brain.
- Lacunar stroke refers to an infarct within non-cortical regions of the brain.
- Hypoperfusion embodies diffuse injury caused by non-localized cerebral ischemia secondary to low cerebral perfusion, typically caused by myocardial infarction, arrhythmia, blood loss or prolonged low blood pressure.
- Hemorrhagic stroke is caused by intra cerebral or subarachnoid hemorrhage, i.e., bleeding in to brain tissue, following blood vessel rapture within the brain or venous thrombosis.
- Intra cerebral and subarachnoid hemorrhages are subsets of a broader category of hemorrhage referred to as intracranial hemorrhage.
- Intra cerebral hemorrhage is typical due to chronic hypertension and a resulting rupture of an arteriosclerotic vessel.
- Stroke-associated symptom(s) of intra cerebral hemorrhage are abrupt, with the onset of headache and steadily increasing neurological deficits. Nausea, vomiting, delirium, paralysis , seizures and loss of consciousness are additional common stroke-associated symptoms.
- aneurysm rupture which is accompanied by high pressure blood release which also causes direct cellular trauma.
- aneurysms Prior to rupture, aneurysms may be asymptomatic, or occasionally associated with headaches. However, headache typical becomes acute and severe upon rupture and may be accompanied by varying degrees of neurological deficit, vomiting, dizziness, and altered pulse and respiratory rates, phobophobia and severe headache and or neck stiffness.
- CT scans can detect parenchymal bleeding greater than 5mm and 95% of all subarachnoid hemorrhages.
- CT scans often cannot detect ischemic strokes until 6 hours from onset, depending on infarct size.
- CT only identifies 48 % of acute strokes in the first 48 hours.
- MRI may be more effective than CT scan in early detection of ischemic from hemorrhagic stroke, and is not widely available.
- Angiography is a definitive test to identify stenosis or occlusion of large and small cranial blood vessels, and can locate the cause of subarachnoid hemorrhages, define aneurysms, and detect cerebral vasospasm. It is, however, an invasive procedure and is also limited by cost and availability.
- tissue plasminogen activator tPA
- thrombolytics and anticoagulants are strongly contraindicated in hemorrhagic strokes.
- delays in confirmation of stoke diagnosis and identification of stroke type limit the number of patients that may benefit from early intervention therapy.
- continuous monitoring of stroke patients is not possible with CT or MRI scanners thus only one snapshot in time is available for diagnosis and treatment.
- Clinical observations are the basic tool that is used to monitor the progress of stroke patients.
- aneurysm Early detection of an aneurysm is beneficial as it can frequently be treated either by surgical procedure of clip occlusion or by endovascular coil embolism. Presently, approximately three quarters of patients are treated with clip occlusion, the remainder with endosvascular coil embolism. Either surgery, particularly the endovascular procedure, can be performed with low complication rate and high rate of success.
- aneurysm Once an aneurysm ruptures, however, the patient declines rapidly due to major brain injury, and over 50% of aneurysm rupture patients die acutely. Thus detection of at risk aneurysms is of great benefit. Thus, a physician faced with possible aneurysm warning signs must judge whether the symptoms warrant the trauma, expense and morbidity of contrast angiography.
- US 4 928 705 A describes detection of an aneurysm by an acoustic system with hydrophone sensors against a patient's head at multiple locations for receiving sounds and after processing of the recorded signals for providing an indication of the frequency of the sound over a specified time range.
- US 4 226 248 A discloses microphones inserted in a patent's ear to detect sounds from the surface and cavities of the head.
- US 2002/183642 A1 and US 2004/249293 A1 also disclose use of microphones to detect abnormal sounds associated with the inspiration and expiration resp. the acoustic characteristics of vascular blood flow of a patient.
- the current invention is a method for detecting a vascular condition non-invasively in the human body, by a collection of signal (pressure wave/motion stimulation) information from local, small regions of the vasculature. This is accomplished by attaching, or contacting an array of accelerometers, or other sensors, to the head of a patient and recording blood flow pressure wave/motion stimulation signals caused by blood flow through vessel structures.
- the pressure wave signatures of blood vessel structures such as branches, aneurysms, stenosis or other structures using random, periodic, band limited or transient analysis provides a library for further processing.
- the library becomes part of a cerebral modeling arithmetic computer using basis functions, or other artificial neural network (NN).
- the developed signature library is then used to facilitate localizing the origin of the recognized vascular feature; the localized feature is then presented to the physician in a clinically relevant manner.
- the data to build the NN and/or data store for correlation are obtained by acquiring data from patients with known pathologies as well as controls, and optionally with studies of constructed or cadaver vasculatures.
- the data are formatted according to the requirements of each processing method before being used for training or algorithm construction.
- Periodic pulses from the heart produce waves of expanding blood vessels within the body.
- the tissue surrounding the blood vessels is displaced during the pulse and contracts again after the pulse.
- This displacement propagates outward from the blood vessel as a pressure wave with associated motion stimulation.
- this displacement reaches the skull and displaces the bone in response the displacement of the blood vessel wall.
- Extremely sensitive accelerometers record this displacement.
- the character of the signal recorded by the accelerometers is dependent on the nature of the displacement caused by the blood pulse.
- the displacement before the restriction is larger than it would be without the restriction and the displacement beyond the restriction is less.
- the spatial distribution of displacement produces a different signature than that recorded by an unrestricted vessel.
- an aneurysm allows a circulation of blood within the bulb of the aneurysm during the pulse and produces a periodic signal that modifies the displacement signal.
- Other geometric arrangements of vessels likewise produce unique signatures in displacement.
- the accelerometers are very sensitive, typically 500 mV/g or more.
- Just an accelerometer is model 3055B3 from Dytran Instruments, Inc., Chatsworth, California.
- Accelerometers have a distinct advantage over microphones since microphones require acoustic signals to propagate through the soft tissue of the brain, conduct through the hard bone of the skull, again transfer to the soft tissue of the skin and finally be transferred to the microphone. Such devices have been most successful when attached to the teeth, positioned within the ear or focused on the eye sockets. Thus the use of microphones has been more successful when they can either have direct bone contact or look where there is no skull present. Accelerometers measure the displacement of the entire structure.
- the microphone is also very sensitive to sound signals produced from outside the body, such as sirens, talking, doors slamming and other sound signals. Accelerometers are much less sensitive to acoustic signals and generally are only sensitive to signals along the primary axis of the detector.
- the use of multiple accelerometers positioned around the head allows signals from different parts of the brain to be distinguished by location. Beyond just the relative magnitude of the signals from each of the sensors the phase relationship of the signals between sensors is used to determine the location of the displacement source. Since there are a multitude of signals produced during the pulse from different spatial positions and with the pulse traveling from the distal to proximal portions of the vasculature, a means to distinguish each of these signals in needed. This differentiation is accomplished by using a priori information about the head and the approximate positions of each of the accelerometers. For example signals can not emulate from locations outside of the head nor at times that are not related to the blood pulse.
- a gating sensor an EKG electrode, is used to provide timing information to the system. Since the heart rate varies in a given person both at rest and with exertion, the timing signal is used as an approximate starting point for timing the signal arrival at the sensors but cannot determine the pulse timing. Leeway is still needed as the intra pulse timing may be increasing or decreasing for each pulse.
- Signal data are captured from multiple sensors during a pulse.
- the signals from the multiple sensors are shifted in time by a guessed amount and then added together.
- the resulting signal is then analyzed either by direct amplitude, by Fourier transform or by another algorithms. This process is continued over the valid range of phases from each sensor. If a given signal is correlated with the signal from another sensor then the resulting combined signal will have an enhanced signature when the phases represent the location of the signal and not for surrounding phases within the allowable phase space.
- the quality of a signature can be quantified and that quantification can be established for each phase shift between sensors. As the phase is shifted over the possible range the figure of merit (quantified result of a single phase relationship) will increase and decrease.
- the peaks represent recognized signatures at localized positions.
- the data needs to be presented in a recognized manner for the clinician to make use of it.
- the most prominent structures are most readily identified and localized. This is not a complete map of the brain vasculature.
- the identified structures can be placed onto a cartoon of the entire vasculature, replacing the typical cartoon representations with improved representations based on the data analysis.
- This synthetic image is then presented to the clinician; as a 3D representation, a simulated CT or MRI scan or angiogram. As data continues to be acquired and processed the synthetic image can be updated.
- Ultrasound contrast agents are materials that can be injected as an IV to improve the imaging of blood vessels by ultrasound.
- the contrast consists of very fine particles and a method of attaching very small bubbles to the particle.
- the particle and bubbles together are smaller than a typical red blood cell thus allowing the bubbles to pass through from the arteries to the veins.
- These bubbles are also engineered to not join together as they are formed about a tiny particle rather than free standing bubbles that might have a tendency to enlarge by combining.
- the purpose of injecting bubbles into the vasculature is to increase the ultrasonic contrast of the blood by adding well dispersed low density material. Contrast agent is rapidly eliminated in the blood by the breaking of the newly formed bubbles.
- the number of bubbles that break can be controlled to have, on average, a few milliseconds between bursts.
- a system that is sensing the breaks from multiple sensors can localize the position of the bubble when it broke to a few mm or better resolution. Summing over a large number of events will produce a 3D map of where the bubbles have reached.
- One of the major objectives of stroke treatment is determining whether a patient had a stroke at all and if they have had a stroke to differentiate an ischemic from a hemorrhagic. This differentiation is critical to caring for the patient. If clot dissolving drugs are used on a hemorrhagic patient the likely outcome is significantly worse, including death, over no treatment at all. Likewise not treating an ischemic stroke patient within the first three hours (for current drugs) of the stroke results in no treatment at all.
- a 3D bubble map will show areas that are not perfused, an area with little or no bubbles showing up; the signature of a vessel blockage or ischemic stroke.
- Aneurysms the typical cause of hemorrhagic strokes, will show up in both the direct sensor signals and in the 3D bubble map.
- a lack of perfusion in an area around the aneurysms would be a strong indicator of non flowing pooled blood.
- a perfused area distal to the aneurysm would be a further indication of no ischemic stroke.
- the system will allow rapid, clinically relevant, differentiation of stroke type enabling treatment to be delivered in a timely manner.
- the sensors deliver data on major unusual events in the vasculature. Merging this data into a "typical" 3D map of the complete vasculature ignores the real differences between individuals. It still provides clinically relevant data, such as lack of blood flow in an area of the brain and then a subsequent reperfusion of that area. This highlights the major advantage of having a continuous monitoring system over a snapshot monitoring such as CT, MRI or contrast angiography. Adding the bubble map would allow a complete map of the vasculature since the bubbles burst throughout all the perfused vessels within the brain. Since the same sensors, and sensor locations, are used to produce both maps, the two data sets can be merged to form a single complete map of the vasculature. In addition, this data set can be merged with the CT scan or other scans to combine the data from each to provide the clinician a better picture of the patient's condition.
- the array of different accelerometer signatures produced by features within the vasculature is quite large due to the variable physiology of patients but there are generally only a few major underlying features.
- This type of data is ideal for using neural networks to identify the features causing the signature to be categorized.
- the neural network will improve in correctly identifying features in patients.
- Neural networks typically are trained by inputting a set of known inputs and known outputs and allowing the weights of the neural connections to change to optimize the matching of the inputs and outputs. When a new input is presented to the neural network the output closest to the input is given the highest output even if the input is not a perfect match to any of the training set.
- beam forming In a process similar to localization previously discussed, beam forming varies the phase between data produced by different sensors. It is the purpose of beam forming to systematically vary the phase and retain the resulting signal. With small steps in the phase a very high spatial resolution map of the vasculature is produced. Beam forming is used when a feature of interest is localized and more detailed information is desired about that feature. Beam forming is computational intensive but lends itself to parallel processing and will be aided by improvements in processing power of both general purpose and special purpose processors.
- Figure 1A shows a patient with sensors attached to various places on the head.
- the sensors are attached by cables, but could be connected wirelessly, to the analysis portion of the system.
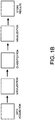
- Figure 1B shows a block diagram of the analysis and visualization portion of the system.
- the signal arrives from each sensor and is conditioned and processed in the data processing block.
- the processed signal is digitized and processed in parallel through each of the four signal type processors using the causal neural net. These processors analyze the signal for matches to library conditions and identify matches.
- the matched signals from multiple sensors are then processed by the signal localizer to localize the source of the matched signal. This process is repeated for each identified signal both by signal type and for multiple locations.
- Patient data is input into the control processor and provided to the causal neural network to further improve identification and localization.
- the collection of all the localized and identified data is processed by the image database for presentation.
- the digitized input signal is also stored in the ray data memory for further analysis.
- Localized features can be further characterized by using beam forming techniques. In the beamforming mode multiple sensors are used to "look" at the same location and the resulting signals analyzed for additional information. Beam forming can be used to shift or scan the region of interest to further characterized and localize the feature.
- FIG 2 is a more detailed block diagram of the sensor and data acquisition block in Figures 1A and 1B .
- the sensor signal is amplified and possibly filtered, sometimes dynamically, before being amplified and finally digitized.
- the signal from each of the sensors in Figure 1A is digitized maintaining the time relationship between each sensor.
- FIG. 3 shows a block diagram of the correlator bank that localizes the signals. All the sensor signals, with their timing information, are fed into to the correlator bank. The correlator determines, by changing the time relationship between different sensor signals, when two signals are from the same source and records those time relationships.
- Multipath rejection via modeling of the signal phase delay of the skull (or body) may be used to improve accuracy of the algorithms.
- the relative attenuation of the intervening materials may also be used.
- the signal that is common to the multiple sensor signals is recorded as the signal that was created at the location that is determined by the time differences between the arrival of the signal at each sensor, as will be further explained below.
- Figure 4 shows a simple trigger pulse test source signal in amplitude VS time.
- Figure 5 shows a diagram of the location of a signal source and three sensors, S1, S2 and S3, shown at different distances from the signal source.
- Figure 6 shows a time VS amplitude waveform of the trigger pulse and the arrival of the signal at sensor S1.
- the time that the signal takes to arrive at sensor S1 is delta t1.
- Figure 7 shows the superposition of the two signals in Figure 6 translated in time by delta t1.
- Figure 8 shows the same data as Figure 6 but for sensor S2 that is farther from the source than sensor S1.
- the time for the signal to arrive from the source at sensor S2 is delta t2.
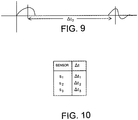
- Figure 9 shows that same data as Figures 6 and 8 but for sensor S3 with a transit time of delta t3.
- Figure 10 shows a table with the arrival time for the signal for each of the sensors, S1, S2 and S3.
- Figure 11 shows two different radius intersecting spheres with the dotted line showing the locus of points where the distance between the centers of sphere 1 and sphere 2 are constant. This locus of points represents the possible position of the source based on only the signal from two sensors. Adding a third sensor, not shown, would restrict the location of the source to a single location, thus fixing its location with respect to the three sensors.
- Figure 12 shows all the sensor signals from Figures 6, 8 and 10 translated by the times listed in Figure 9 .
- Figure 13 shows the sum of the three signals shown in Figure 12 .
- Figure 14 shows the typical signal noise that might be expected to be present on the sensor signal along with the sensor signal as shown in Figure 6 .
- Figure 15 shows how the sensor signal in Figure 14 would look for a typical signal noise environment.
- Figure 16 shows the same signal as Figure 15 but for sensor S2 rather than sensor S1.
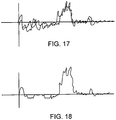
- Figure 17 shows superposition of the noisy signals from all the sensors, translated by the times shown in the table in Figure 10 .
- Figure 18 shows the sum of all the signals in Figure 17 with the noise reduced due to the summing of random noise and the signal increased by the superposition of the common signal.
- Figure 19A shows a pictorial diagram of a patient with sensors S 1 through S 4 attached to the head.
- a signal source at X is located at distances D 1 through D 4 from the respective sensors.
- a waveform is shown at X depicting the signal signature that is emitted at location X.
- Figure 19B shows a pictorial diagram of a patient as in Figure 19A .
- Four locations within the head of the patient are shown; points A, B C and C'.
- a centerline of symmetry is shown with point C' laying on the centerline and equal distance from sensors S 2 and S 4 .
- Point C is also on the centerline and a short distance from point C'.
- Small changes in the distances D 2 and D 3 represent the small distance from C' to C.
- Beamforming techniques depend on changing the phase relationship between data collected by each sensor in a precise and controlled way, such as represented by the example in Figure 19B .
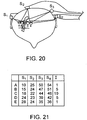
- Figure 20 shows a pictorial diagram of a patient with sensors S 1 through S 4 as is shown in Figure 19A with the additional points A-E shown.
- Points A through E represent small steps across a point of interest, as depicted by a segment of vessel shown across the points A- E.
- the distances from each point A - E to each sensor S1 - S4 is different and is shown in the table in Figure 20 .
- tPA to dissolve a clot.
- the clot region could be monitored and tPA administered while watching the blood flow and perfusion so that the right amount of tPA is administered. This would be possible even if the patient was not able to indicate physical improvements, i.e., asleep or in a natural or induced coma.
Landscapes
- Health & Medical Sciences (AREA)
- Life Sciences & Earth Sciences (AREA)
- Engineering & Computer Science (AREA)
- Medical Informatics (AREA)
- Public Health (AREA)
- General Health & Medical Sciences (AREA)
- Biomedical Technology (AREA)
- Physics & Mathematics (AREA)
- Pathology (AREA)
- Heart & Thoracic Surgery (AREA)
- Animal Behavior & Ethology (AREA)
- Surgery (AREA)
- Molecular Biology (AREA)
- Veterinary Medicine (AREA)
- Epidemiology (AREA)
- Primary Health Care (AREA)
- Biophysics (AREA)
- Acoustics & Sound (AREA)
- Physiology (AREA)
- Databases & Information Systems (AREA)
- Data Mining & Analysis (AREA)
- Neurology (AREA)
- Vascular Medicine (AREA)
- Cardiology (AREA)
- Radiology & Medical Imaging (AREA)
- Nuclear Medicine, Radiotherapy & Molecular Imaging (AREA)
- Neurosurgery (AREA)
- Measuring Pulse, Heart Rate, Blood Pressure Or Blood Flow (AREA)
- Magnetic Resonance Imaging Apparatus (AREA)
- Ultra Sonic Daignosis Equipment (AREA)
Description
- This invention concerns detection of conditions of human vasculature non-invasively, from outside the body, and in particular, locating aneurysms, partial or complete stenoses, ruptures, peripheral bleeding and other abnormal conditions pertaining to the cerebral vasculature, profiling blood or other fluid flow through or around the cerebral vasculature and mapping the resultant flow to provide a spatially resolved characterization of the major vasculature within the head.
- The system and method of the invention are also useful to detect vascular conditions in other parts of the body, especially the limbs and areas of other major vessels. Stroke is a manifestation of vascular injury to the brain which is commonly secondary to atherosclerosis or hypertension, and is the third leading cause of death in the United States. Stroke can be categorized into two types, ischemic stroke and hemorrhagic stroke. Additionally, a patient may experience transient ischemic attacks, which are in turn a high risk factor for the future development of a more severe episode.
- Examples of Ischemic stroke encompass thrombotic, embolic, lacunar and hypoperfusion types of strokes. Thrombi are occlusions of the arteries created in situ within the brain, while emboli are occlusions caused by material from a distant source, such as the heart and major vessels, often dislodged due to myocardial infarct or atrial fibrillation or carotid disease or surgical or percutaneous intervention. Thrombi or emboli can result from atherosclerosis or other disorders, for example, arteritis and lead to physical obstruction of arterial blood supply to the brain. Lacunar stroke refers to an infarct within non-cortical regions of the brain. Hypoperfusion embodies diffuse injury caused by non-localized cerebral ischemia secondary to low cerebral perfusion, typically caused by myocardial infarction, arrhythmia, blood loss or prolonged low blood pressure.
- Hemorrhagic stroke is caused by intra cerebral or subarachnoid hemorrhage, i.e., bleeding in to brain tissue, following blood vessel rapture within the brain or venous thrombosis. Intra cerebral and subarachnoid hemorrhages are subsets of a broader category of hemorrhage referred to as intracranial hemorrhage. Intra cerebral hemorrhage is typical due to chronic hypertension and a resulting rupture of an arteriosclerotic vessel. Stroke-associated symptom(s) of intra cerebral hemorrhage are abrupt, with the onset of headache and steadily increasing neurological deficits. Nausea, vomiting, delirium, paralysis , seizures and loss of consciousness are additional common stroke-associated symptoms.
- In contrast, most subarachnoid hemorrhage is caused by head trauma or aneurysm rupture which is accompanied by high pressure blood release which also causes direct cellular trauma. Prior to rupture, aneurysms may be asymptomatic, or occasionally associated with headaches. However, headache typical becomes acute and severe upon rupture and may be accompanied by varying degrees of neurological deficit, vomiting, dizziness, and altered pulse and respiratory rates, phobophobia and severe headache and or neck stiffness.
- Current diagnostic methods for stroke include costly and time-consuming procedures such as non-contrast computed tomography (CT) scans, electrocardiogram, magnetic resonance imaging (MRI) and angiography. Determining the immediate cause of stroke is difficult. CT scans can detect parenchymal bleeding greater than 5mm and 95% of all subarachnoid hemorrhages. CT scans often cannot detect ischemic strokes until 6 hours from onset, depending on infarct size. CT only identifies 48 % of acute strokes in the first 48 hours. MRI may be more effective than CT scan in early detection of ischemic from hemorrhagic stroke, and is not widely available. Angiography is a definitive test to identify stenosis or occlusion of large and small cranial blood vessels, and can locate the cause of subarachnoid hemorrhages, define aneurysms, and detect cerebral vasospasm. It is, however, an invasive procedure and is also limited by cost and availability.
- Immediate diagnosis and care of patient experiencing stroke can be critical. For example, tissue plasminogen activator (tPA) given within three hours of symptom onset in ischemic stroke is beneficial for selected acute stroke patients. In contrast, thrombolytics and anticoagulants are strongly contraindicated in hemorrhagic strokes. Thus early differentiation of ischemic events from hemorrhagic events is imperative. Moreover, delays in confirmation of stoke diagnosis and identification of stroke type limit the number of patients that may benefit from early intervention therapy. In addition, continuous monitoring of stroke patients is not possible with CT or MRI scanners thus only one snapshot in time is available for diagnosis and treatment. Clinical observations are the basic tool that is used to monitor the progress of stroke patients.
- Early detection of an aneurysm is beneficial as it can frequently be treated either by surgical procedure of clip occlusion or by endovascular coil embolism. Presently, approximately three quarters of patients are treated with clip occlusion, the remainder with endosvascular coil embolism. Either surgery, particularly the endovascular procedure, can be performed with low complication rate and high rate of success.
- Once an aneurysm ruptures, however, the patient declines rapidly due to major brain injury, and over 50% of aneurysm rupture patients die acutely. Thus detection of at risk aneurysms is of great benefit. Thus, a physician faced with possible aneurysm warning signs must judge whether the symptoms warrant the trauma, expense and morbidity of contrast angiography.
- Fergusion, in J. Neurosurg. 36:560-563 (1972), suggested detecting aneurismal signals by recording sounds from aneurysms exposed at operations using a cardiac phonocatheter.
- Kosugi et al., in Stroke 14 (1) 37-42 (1983), disclosed the use of a "cement wall microphone", (contact accelerometer) in contact with the cranium and the teeth in an attempt to detect aneurysms.
-
US 4 928 705 A describes detection of an aneurysm by an acoustic system with hydrophone sensors against a patient's head at multiple locations for receiving sounds and after processing of the recorded signals for providing an indication of the frequency of the sound over a specified time range. - In IEEE TRANSACTIONS ON BIOMEDICAL ENGINEERING, IEEE SERVICE CENTER, PISCATAWAY, NJ; USA, vol. BME-19, no. 3, 1 March 1987 (1987-03-01), pages 185 - 191, XP011174074, ISSN: 0018-9294 use of accelerometers is disclosed for sending acoustic bruit of blood flow in a frequency range of more than 100 Hz.
-
US 4 226 248 A discloses microphones inserted in a patent's ear to detect sounds from the surface and cavities of the head. -
US 2002/183642 A1 andUS 2004/249293 A1 also disclose use of microphones to detect abnormal sounds associated with the inspiration and expiration resp. the acoustic characteristics of vascular blood flow of a patient. - Despite these known devices, there remains a need for a signal detector that is designed to more effectively record, analyze, localize and present, in a clinically useful manner, cerebral arterial and venous conditions. Devices and methods to date have not localized the detected vascular conditions and do not present the collected data in a clinically useful way.
- It is the purpose of this invention to provide a noninvasive method for differentiating ischemic from hemorrhagic stroke and to continuously monitor the condition of stroke patients by providing clinically useful localized information. It is also the purpose to monitor or screen high risk patients to detect conditions that may lead to a first or subsequent stroke.
- The current invention is a method for detecting a vascular condition non-invasively in the human body, by a collection of signal (pressure wave/motion stimulation) information from local, small regions of the vasculature. This is accomplished
by attaching, or contacting an array of accelerometers, or other sensors, to the head
of a patient and recording blood flow pressure wave/motion stimulation signals caused by blood flow through vessel structures. The pressure wave signatures of blood vessel structures such as branches, aneurysms, stenosis or other structures using random, periodic, band limited or transient analysis provides a library for further processing. The library becomes part of a cerebral modeling arithmetic computer using basis functions, or other artificial neural network (NN). The developed signature library is then used to facilitate localizing the origin of the recognized vascular feature; the localized feature is then presented to the physician in a clinically relevant manner. - The data to build the NN and/or data store for correlation are obtained by acquiring data from patients with known pathologies as well as controls, and optionally with studies of constructed or cadaver vasculatures. The data are formatted according to the requirements of each processing method before being used for training or algorithm construction.
- These and other objects, advantages and features of the invention will be apparent from the following description of a preferred embodiment, considered along with the accompanying drawings.
-
-
Figure 1 is a plan and elevation view of sensors on a head. -
Figure 1A is a block diagram of the steps of the invention. -
Fig. 2 is a block diagram of the sensor processing steps. -
Fig. 3 is a diagram of the correlation circuit. -
Fig. 4 is a diagram of a trigger pulse amplitude VS time -
Fig. 5 is a diagram of sensors at various distances from a pressure wave/motion stimulation signal source. -
Figure 6 is a diagram of a trigger pulse and a received pulse at a distant sensor. -
Figure 7 is the overlay of the trigger pulse and the received pulse shifted by time delta t1. -
Figure 8 is a diagram of a trigger pulse and a received pulse from a further sensor. -
Figure 9 is a diagram of a trigger pulse and a received pulse from the furthest sensor. -
Figure 10 is a table the time of first signal arrival from the trigger pulse for each sensor. -
Figure 11 is a diagram of two intersecting spheres of different diameters. -
Figure 12 is a diagram of three sensor signals shifted according to the table inFigure 10 . -
Figure 13 is a diagram of the sum of the three sensor signals inFigure 12 . -
Figure 14 is a received sensor signal as shown inFigure 6 and typical noise signal. -
Figure 15 is a diagram of the sum of the noise signal and the signal fromsensor 1. -
Figure 16 is a diagram of the sum of noise signal and the signal fromsensor 2. -
Figure 17 is a diagram of the superposition of the noisy signals from each of the three sensors. -
Figure 18 is a diagram of the sum of the noisy signals from each of the three sensors. -
Figure 19A is a plan view in one plane of four sensors on a human head with the distances from a signal source to each sensor. -
Figure 19B is a plan view in one plane of four sensors on a human head with several possible sources of signal indicated. -
Figure 20 is a plan view of the head with sensors shown and the geometry of beam forming. -
Figure 21 is a table giving the distances for four sensors and five beam forming position. -
Figure 22 is a plot of the width of a blood vessel determined by beam forming. -
Figure 23 is a diagram indicating the width of a blood vessel based on merging the NN output and the beam forming data. -
Figure 24 is a figure of a patient being injected with ultrasound contrast agent. -
Figure 25A and 25B are figures of a branch in a blood vessel without and with ultrasound contrast. -
Figure 26 is a figure of an aneurysm in the branch of a vessel as imaged with bursting bubbles. -
Figure 27 is a figure of what image of the vessel and aneurysm would be displayed after processing. -
Figure 28 is a figure of a branching vessel and areas of perfusion and non-perfusion. -
Figure 29 is a figure of a vessel blocked by a stenosis. -
Figure 30 is a figure of a AVM (arterial venous malformation). -
Figure 31 is a diagram of how bursting bubbles combine with a NN image to produce an improved image. -
Figure 32 is a figure that depicts how two segments derived from imaging can be connected by knowledge of the anatomy. -
Figure 33 is a figure that depicts how two segments derived from imaging can be connected by bursting bubble data. -
Figure 34 is a figure that depicts an area of pooled blood in proximity to an aneurysm. -
Figure 35 is a flow diagram outlining the overall system. - Periodic pulses from the heart produce waves of expanding blood vessels within the body. The tissue surrounding the blood vessels is displaced during the pulse and contracts again after the pulse. This displacement propagates outward from the blood vessel as a pressure wave with associated motion stimulation. In the case of the brain, this displacement reaches the skull and displaces the bone in response the displacement of the blood vessel wall. Extremely sensitive accelerometers record this displacement. The character of the signal recorded by the accelerometers is dependent on the nature of the displacement caused by the blood pulse. At a restriction in the vessel the displacement before the restriction is larger than it would be without the restriction and the displacement beyond the restriction is less. The spatial distribution of displacement produces a different signature than that recorded by an unrestricted vessel. Likewise an aneurysm allows a circulation of blood within the bulb of the aneurysm during the pulse and produces a periodic signal that modifies the displacement signal. Other geometric arrangements of vessels likewise produce unique signatures in displacement.
- The accelerometers are very sensitive, typically 500 mV/g or more. Just an accelerometer is model 3055B3 from Dytran Instruments, Inc., Chatsworth, California.
- Accelerometers, as used herein, have a distinct advantage over microphones since microphones require acoustic signals to propagate through the soft tissue of the brain, conduct through the hard bone of the skull, again transfer to the soft tissue of the skin and finally be transferred to the microphone. Such devices have been most successful when attached to the teeth, positioned within the ear or focused on the eye sockets. Thus the use of microphones has been more successful when they can either have direct bone contact or look where there is no skull present. Accelerometers measure the displacement of the entire structure.
- The microphone is also very sensitive to sound signals produced from outside the body, such as sirens, talking, doors slamming and other sound signals. Accelerometers are much less sensitive to acoustic signals and generally are only sensitive to signals along the primary axis of the detector.
- The use of multiple accelerometers positioned around the head allows signals from different parts of the brain to be distinguished by location. Beyond just the relative magnitude of the signals from each of the sensors the phase relationship of the signals between sensors is used to determine the location of the displacement source. Since there are a multitude of signals produced during the pulse from different spatial positions and with the pulse traveling from the distal to proximal portions of the vasculature, a means to distinguish each of these signals in needed. This differentiation is accomplished by using a priori information about the head and the approximate positions of each of the accelerometers. For example signals can not emulate from locations outside of the head nor at times that are not related to the blood pulse.
- A gating sensor, an EKG electrode, is used to provide timing information to the system. Since the heart rate varies in a given person both at rest and with exertion, the timing signal is used as an approximate starting point for timing the signal arrival at the sensors but cannot determine the pulse timing. Leeway is still needed as the intra pulse timing may be increasing or decreasing for each pulse.
- Signal data are captured from multiple sensors during a pulse. The signals from the multiple sensors are shifted in time by a guessed amount and then added together. The resulting signal is then analyzed either by direct amplitude, by Fourier transform or by another algorithms. This process is continued over the valid range of phases from each sensor. If a given signal is correlated with the signal from another sensor then the resulting combined signal will have an enhanced signature when the phases represent the location of the signal and not for surrounding phases within the allowable phase space. The quality of a signature can be quantified and that quantification can be established for each phase shift between sensors. As the phase is shifted over the possible range the figure of merit (quantified result of a single phase relationship) will increase and decrease. The peaks represent recognized signatures at localized positions. While this process is straightforward it is very processor intensive. The allowable phase shifts for all the sensors can be calculated beforehand and this range used to limit the correlation space. The computational problem can be parsed such that parallel processors tackle the problem in parallel thus reducing the time from data collection to data presentation. It is important to note that once the initial data has been analyzed the relative phase between sensor data for the many signals within the brain is known, and continued analysis of captured data is much less computational intensive. This a priori knowledge vastly reduces the computational requirements of the system and allows near real time presentation of the data. Current computers are certainly capable of completing the vast amount of computations in times suitable for clinical use and this will just improve as the speed and processing throughput of computers increases.
- The data needs to be presented in a recognized manner for the clinician to make use of it. By the nature of the data capture and processing, the most prominent structures are most readily identified and localized. This is not a complete map of the brain vasculature. Using a priori knowledge of the typical structure of the vasculature (and noting that there are significant deviations from the "typical" structure) the identified structures can be placed onto a cartoon of the entire vasculature, replacing the typical cartoon representations with improved representations based on the data analysis. This synthetic image is then presented to the clinician; as a 3D representation, a simulated CT or MRI scan or angiogram. As data continues to be acquired and processed the synthetic image can be updated.
- Ultrasound contrast agents are materials that can be injected as an IV to improve the imaging of blood vessels by ultrasound. The contrast consists of very fine particles and a method of attaching very small bubbles to the particle. To avoid any associated problems with embolisms the particle and bubbles together are smaller than a typical red blood cell thus allowing the bubbles to pass through from the arteries to the veins. These bubbles are also engineered to not join together as they are formed about a tiny particle rather than free standing bubbles that might have a tendency to enlarge by combining.
- The purpose of injecting bubbles into the vasculature is to increase the ultrasonic contrast of the blood by adding well dispersed low density material. Contrast agent is rapidly eliminated in the blood by the breaking of the newly formed bubbles.
- An unrecognized feature of the contrast agents is that as each bubble breaks it creates a disturbance within the vasculature which is highly localized. Ultrasound contrast media are already FDA cleared for use in stroke diagnostics and vessel imaging. To ensure the safety of injecting bubbles into the blood the bubble size is very well controlled. Bubbles of the same size have a well defined and distinctive signature when they break. This consistency allows for precise localization of the resulting signal. Since the bubbles are smaller than a red blood cell, the bubbles are able to perfuse from the arteries to the veins. The bubbles break randomly over a controlled period of time, typically five to 20 minutes after injection. If the amount of contrast medium that is injected is reduced significantly from the amount typically given for ultrasound imaging the number of bubbles that break can be controlled to have, on average, a few milliseconds between bursts. Thus a system that is sensing the breaks from multiple sensors can localize the position of the bubble when it broke to a few mm or better resolution. Summing over a large number of events will produce a 3D map of where the bubbles have reached.
- One of the major objectives of stroke treatment is determining whether a patient had a stroke at all and if they have had a stroke to differentiate an ischemic from a hemorrhagic. This differentiation is critical to caring for the patient. If clot dissolving drugs are used on a hemorrhagic patient the likely outcome is significantly worse, including death, over no treatment at all. Likewise not treating an ischemic stroke patient within the first three hours (for current drugs) of the stroke results in no treatment at all.
- A 3D bubble map will show areas that are not perfused, an area with little or no bubbles showing up; the signature of a vessel blockage or ischemic stroke. Aneurysms, the typical cause of hemorrhagic strokes, will show up in both the direct sensor signals and in the 3D bubble map. A lack of perfusion in an area around the aneurysms would be a strong indicator of non flowing pooled blood. A perfused area distal to the aneurysm would be a further indication of no ischemic stroke. Thus the system will allow rapid, clinically relevant, differentiation of stroke type enabling treatment to be delivered in a timely manner.
- The sensors deliver data on major unusual events in the vasculature. Merging this data into a "typical" 3D map of the complete vasculature ignores the real differences between individuals. It still provides clinically relevant data, such as lack of blood flow in an area of the brain and then a subsequent reperfusion of that area. This highlights the major advantage of having a continuous monitoring system over a snapshot monitoring such as CT, MRI or contrast angiography. Adding the bubble map would allow a complete map of the vasculature since the bubbles burst throughout all the perfused vessels within the brain. Since the same sensors, and sensor locations, are used to produce both maps, the two data sets can be merged to form a single complete map of the vasculature. In addition, this data set can be merged with the CT scan or other scans to combine the data from each to provide the clinician a better picture of the patient's condition.
- The array of different accelerometer signatures produced by features within the vasculature is quite large due to the variable physiology of patients but there are generally only a few major underlying features. This type of data is ideal for using neural networks to identify the features causing the signature to be categorized. As the library of unique features and the associated signatures grows the neural network will improve in correctly identifying features in patients. Neural networks typically are trained by inputting a set of known inputs and known outputs and allowing the weights of the neural connections to change to optimize the matching of the inputs and outputs. When a new input is presented to the neural network the output closest to the input is given the highest output even if the input is not a perfect match to any of the training set.
- In a process similar to localization previously discussed, beam forming varies the phase between data produced by different sensors. It is the purpose of beam forming to systematically vary the phase and retain the resulting signal. With small steps in the phase a very high spatial resolution map of the vasculature is produced. Beam forming is used when a feature of interest is localized and more detailed information is desired about that feature. Beam forming is computational intensive but lends itself to parallel processing and will be aided by improvements in processing power of both general purpose and special purpose processors.
- In the drawings,
Figure 1A shows a patient with sensors attached to various places on the head. The sensors are attached by cables, but could be connected wirelessly, to the analysis portion of the system.Figure 1B shows a block diagram of the analysis and visualization portion of the system. The signal arrives from each sensor and is conditioned and processed in the data processing block. The processed signal is digitized and processed in parallel through each of the four signal type processors using the causal neural net. These processors analyze the signal for matches to library conditions and identify matches. The matched signals from multiple sensors are then processed by the signal localizer to localize the source of the matched signal. This process is repeated for each identified signal both by signal type and for multiple locations. Patient data is input into the control processor and provided to the causal neural network to further improve identification and localization. The collection of all the localized and identified data is processed by the image database for presentation. The digitized input signal is also stored in the ray data memory for further analysis. Localized features can be further characterized by using beam forming techniques. In the beamforming mode multiple sensors are used to "look" at the same location and the resulting signals analyzed for additional information. Beam forming can be used to shift or scan the region of interest to further characterized and localize the feature. - Some of the features of the system, as represented in
Figure 35 are: - The use of noise cancellation.
- The elimination of overriding signals.
- The localizers for each signal type.
- The use of the raw data memory.
- The causal network.
- The patient factors input and how it is used.
- The image database.
- The image.
- The dynamic filtering and its purpose.
-
Figure 2 is a more detailed block diagram of the sensor and data acquisition block inFigures 1A and1B . The sensor signal is amplified and possibly filtered, sometimes dynamically, before being amplified and finally digitized. The signal from each of the sensors inFigure 1A is digitized maintaining the time relationship between each sensor. -
Figure 3 shows a block diagram of the correlator bank that localizes the signals. All the sensor signals, with their timing information, are fed into to the correlator bank. The correlator determines, by changing the time relationship between different sensor signals, when two signals are from the same source and records those time relationships. - Multipath rejection via modeling of the signal phase delay of the skull (or body) may be used to improve accuracy of the algorithms.
- The relative attenuation of the intervening materials may also be used.
- The signal that is common to the multiple sensor signals is recorded as the signal that was created at the location that is determined by the time differences between the arrival of the signal at each sensor, as will be further explained below.
-
Figure 4 shows a simple trigger pulse test source signal in amplitude VS time. -
Figure 5 shows a diagram of the location of a signal source and three sensors, S1, S2 and S3, shown at different distances from the signal source. -
Figure 6 shows a time VS amplitude waveform of the trigger pulse and the arrival of the signal at sensor S1. The time that the signal takes to arrive at sensor S1 is delta t1. -
Figure 7 shows the superposition of the two signals inFigure 6 translated in time by delta t1. -
Figure 8 shows the same data asFigure 6 but for sensor S2 that is farther from the source than sensor S1. The time for the signal to arrive from the source at sensor S2 is delta t2. -
Figure 9 shows that same data asFigures 6 and 8 but for sensor S3 with a transit time of delta t3. -
Figure 10 shows a table with the arrival time for the signal for each of the sensors, S1, S2 and S3. -
Figure 11 shows two different radius intersecting spheres with the dotted line showing the locus of points where the distance between the centers ofsphere 1 andsphere 2 are constant. This locus of points represents the possible position of the source based on only the signal from two sensors. Adding a third sensor, not shown, would restrict the location of the source to a single location, thus fixing its location with respect to the three sensors.Figure 12 shows all the sensor signals fromFigures 6, 8 and10 translated by the times listed inFigure 9 . -
Figure 13 shows the sum of the three signals shown inFigure 12 . -
Figure 14 shows the typical signal noise that might be expected to be present on the sensor signal along with the sensor signal as shown inFigure 6 . -
Figure 15 shows how the sensor signal inFigure 14 would look for a typical signal noise environment. -
Figure 16 shows the same signal asFigure 15 but for sensor S2 rather than sensor S1. -
Figure 17 shows superposition of the noisy signals from all the sensors, translated by the times shown in the table inFigure 10 . -
Figure 18 shows the sum of all the signals inFigure 17 with the noise reduced due to the summing of random noise and the signal increased by the superposition of the common signal. -
Figure 19A shows a pictorial diagram of a patient with sensors S1 through S4 attached to the head. A signal source at X is located at distances D1 through D4 from the respective sensors. A waveform is shown at X depicting the signal signature that is emitted at location X. -
Figure 19B shows a pictorial diagram of a patient as inFigure 19A . Four locations within the head of the patient are shown; points A, B C and C'. A centerline of symmetry is shown with point C' laying on the centerline and equal distance from sensors S2 and S4. Point C is also on the centerline and a short distance from point C'. Small changes in the distances D2 and D3 represent the small distance from C' to C. Beamforming techniques depend on changing the phase relationship between data collected by each sensor in a precise and controlled way, such as represented by the example inFigure 19B . -
Figure 20 shows a pictorial diagram of a patient with sensors S1 through S4 as is shown inFigure 19A with the additional points A-E shown. Points A through E represent small steps across a point of interest, as depicted by a segment of vessel shown across the points A- E. The distances from each point A - E to each sensor S1 - S4 is different and is shown in the table inFigure 20 . - An example would be when giving tPA to dissolve a clot. The clot region could be monitored and tPA administered while watching the blood flow and perfusion so that the right amount of tPA is administered. This would be possible even if the patient was not able to indicate physical improvements, i.e., asleep or in a natural or induced coma.
- The preferred embodiments described above are intended to illustrate the principles of the invention, but not to limit its scope.
Claims (5)
- A method for detecting, recording, analyzing, classifying and storing data of cranial vasculature of a patient, including the steps of:(a) using an array of accelerometers (S1 - S4) engaged at a plurality of different positions against a patient's head, recording pressure wave/motion stimulation acceleration signal data from displacements of the skull at said plurality of positions on the head, such displacements occurring from heartbeat-induced repeated pulsing of blood flow into the vasculature of the brain and resultant expansion and subsequent contraction of the blood vessels which moves the brain tissue due to such pulsing, the brain tissue movement causing resultant displacement of the skull at said plurality of positions on the head, and(b) associating signal signatures of said signal data to known signals for type classification using a neural network, or correlations, with information from a data store, wherein said known signals comprise signatures of a restricted vessel or aneurism.
- The method according to claim 1 further including(c) correlating signal data from multiple accelerometers of said array to determine the phase relationship among the signal data from the multiple accelerometers to thereby determine origins of a series of signal data collected by the multiple accelerometers from said displacements of the skull, thus localizing a signal signature from the signal data of the multiple accelerometers, and(d) Inputting the localized signal structure to the neural network or for correlation with the data store to identify the structure that caused the localized signal signature.(e) Storing results of steps (c) and (d) as meta data in a data base.
- The method according to claims 1 or 2 wherein the accelerometers have a sensitivity of about 500 mV/g or greater.
- The method according to claims 1 or 2 or 3 wherein the array of accelerometers includes four accelerometers engaged at four different positions against the patient's head.
- The method according to claim 1 or 2, further including using an EKG electrode to provide timing information as a starting point for timing the pressure wave/motion stimulation acceleration signal arrival at the multiple accelerometers.
Applications Claiming Priority (2)
| Application Number | Priority Date | Filing Date | Title |
|---|---|---|---|
| US11/894,052 US8905932B2 (en) | 2006-08-17 | 2007-08-17 | Non-invasive characterization of human vasculature |
| PCT/US2008/009802 WO2009025769A1 (en) | 2007-08-17 | 2008-08-15 | Non-invasive characterization of human vasculature |
Publications (3)
| Publication Number | Publication Date |
|---|---|
| EP2182840A1 EP2182840A1 (en) | 2010-05-12 |
| EP2182840A4 EP2182840A4 (en) | 2015-03-04 |
| EP2182840B1 true EP2182840B1 (en) | 2017-05-03 |
Family
ID=40222026
Family Applications (1)
| Application Number | Title | Priority Date | Filing Date |
|---|---|---|---|
| EP08795384.0A Active EP2182840B1 (en) | 2007-08-17 | 2008-08-15 | Non-invasive characterization of human vasculature |
Country Status (3)
| Country | Link |
|---|---|
| US (1) | US8905932B2 (en) |
| EP (1) | EP2182840B1 (en) |
| WO (1) | WO2009025769A1 (en) |
Cited By (1)
| Publication number | Priority date | Publication date | Assignee | Title |
|---|---|---|---|---|
| CN110334321A (en) * | 2019-06-24 | 2019-10-15 | 天津城建大学 | A kind of city area Gui Jiaozhan identification of function method based on interest point data |
Families Citing this family (23)
| Publication number | Priority date | Publication date | Assignee | Title |
|---|---|---|---|---|
| US8920343B2 (en) | 2006-03-23 | 2014-12-30 | Michael Edward Sabatino | Apparatus for acquiring and processing of physiological auditory signals |
| US10076274B2 (en) | 2006-08-17 | 2018-09-18 | Jan Medical, Inc. | System and method for non-invasive detection of human cranial conditions |
| US10092195B2 (en) | 2006-08-17 | 2018-10-09 | Jan Medical, Inc. | Noninvasive detection of human brain conditions and anomalies |
| WO2010121146A2 (en) * | 2009-04-17 | 2010-10-21 | Malek Adel M | Aneurysm detection |
| IT1395277B1 (en) * | 2009-08-11 | 2012-09-05 | London Equitable Ltd In Its Capacity As Trustee Of The Think Tank Trust | SYSTEM TO DETECT ANOMALIES IN THE VENOUS FLOW AT EXTRACRANIC LEVEL |
| US8934636B2 (en) * | 2009-10-09 | 2015-01-13 | George S. Ferzli | Stethoscope, stethoscope attachment and collected data analysis method and system |
| EP3185761B1 (en) | 2014-08-29 | 2021-03-24 | Bionic Skins LLC | Instrument for determining viscoelastic properties of a body segment of a person |
| CZ2014696A3 (en) | 2014-10-11 | 2016-04-20 | Linet Spol. S.R.O. | Method of measuring intracranial pressure and apparatus for making the same |
| WO2016094586A1 (en) * | 2014-12-09 | 2016-06-16 | Jan Medical, Inc. | Noninvasive detection of human brain conditions and anomalies |
| US10307065B1 (en) | 2014-12-09 | 2019-06-04 | Jan Medical, Inc. | Non-invasive detection of cerebral vasospasm |
| US10765332B2 (en) | 2015-04-29 | 2020-09-08 | Brainlab Ag | Detection of the heartbeat in cranial accelerometer data using independent component analysis |
| JP6189486B2 (en) * | 2015-06-12 | 2017-08-30 | ダイキン工業株式会社 | Brain activity estimation device |
| WO2016205824A1 (en) | 2015-06-19 | 2016-12-22 | Neural Analytics, Inc. | Transcranial doppler probe |
| WO2017004445A1 (en) | 2015-06-30 | 2017-01-05 | Jan Medical, Inc. | Detection of concussion using cranial accelerometry |
| US11090026B2 (en) | 2016-01-05 | 2021-08-17 | Novasignal Corp. | Systems and methods for determining clinical indications |
| EP3399920B1 (en) | 2016-01-05 | 2020-11-04 | Neural Analytics, Inc. | Integrated probe structure |
| US11589836B2 (en) | 2016-01-05 | 2023-02-28 | Novasignal Corp. | Systems and methods for detecting neurological conditions |
| US10537300B2 (en) * | 2016-04-25 | 2020-01-21 | Wisconsin Alumni Research Foundation | Head mounted microphone array for tinnitus diagnosis |
| CA3062330A1 (en) | 2017-05-11 | 2018-11-15 | Verathon Inc. | Probability map-based ultrasound scanning |
| US11284827B2 (en) | 2017-10-21 | 2022-03-29 | Ausculsciences, Inc. | Medical decision support system |
| CA3096680A1 (en) | 2018-04-10 | 2019-10-17 | Cerenetex, Inc. | Systems and methods for the identification of medical conditions, and determination of appropriate therapies, by passively detecting acoustic signals |
| US12004846B2 (en) | 2018-04-10 | 2024-06-11 | Cerenetex, Inc. | Non-invasive systems and methods for the improved evaluation of patients suffering from undiagnosed headaches |
| US12678057B2 (en) | 2023-07-03 | 2026-07-14 | The Regents Of The University Of California | Method of determining recovery from concussion |
Family Cites Families (12)
| Publication number | Priority date | Publication date | Assignee | Title |
|---|---|---|---|---|
| US4226248A (en) | 1978-10-26 | 1980-10-07 | Manoli Samir H | Phonocephalographic device |
| US4928705A (en) * | 1987-12-08 | 1990-05-29 | University Of Pittsburgh Of The Commonwealth System Of Higher Education | Acoustic aneurysm detector and associated method |
| US5833613A (en) * | 1996-09-27 | 1998-11-10 | Advanced Technology Laboratories, Inc. | Ultrasonic diagnostic imaging with contrast agents |
| DE69634112T2 (en) | 1995-10-10 | 2005-12-08 | Advanced Technology Laboratories, Inc., Bothell | Ultrasound imaging for diagnostics using contrast agents |
| US6385474B1 (en) * | 1999-03-19 | 2002-05-07 | Barbara Ann Karmanos Cancer Institute | Method and apparatus for high-resolution detection and characterization of medical pathologies |
| US6790183B2 (en) * | 1998-10-14 | 2004-09-14 | Raymond L. H. Murphy | Method and apparatus for displaying body sounds and performing diagnosis based on body sound analysis |
| US6887199B2 (en) * | 1999-09-23 | 2005-05-03 | Active Signal Technologies, Inc. | Brain assessment monitor |
| US7037267B1 (en) * | 1999-11-10 | 2006-05-02 | David Lipson | Medical diagnostic methods, systems, and related equipment |
| US7527597B2 (en) * | 2001-01-16 | 2009-05-05 | Biomedical Acoustic Research Corporation | Acoustic detection of vascular conditions |
| JP4099357B2 (en) * | 2002-07-08 | 2008-06-11 | ジーイー・メディカル・システムズ・グローバル・テクノロジー・カンパニー・エルエルシー | Image processing method and apparatus |
| US20060161218A1 (en) * | 2003-11-26 | 2006-07-20 | Wicab, Inc. | Systems and methods for treating traumatic brain injury |
| US20050234309A1 (en) * | 2004-01-07 | 2005-10-20 | David Klapper | Method and apparatus for classification of movement states in Parkinson's disease |
-
2007
- 2007-08-17 US US11/894,052 patent/US8905932B2/en active Active
-
2008
- 2008-08-15 WO PCT/US2008/009802 patent/WO2009025769A1/en not_active Ceased
- 2008-08-15 EP EP08795384.0A patent/EP2182840B1/en active Active
Cited By (2)
| Publication number | Priority date | Publication date | Assignee | Title |
|---|---|---|---|---|
| CN110334321A (en) * | 2019-06-24 | 2019-10-15 | 天津城建大学 | A kind of city area Gui Jiaozhan identification of function method based on interest point data |
| CN110334321B (en) * | 2019-06-24 | 2023-03-31 | 天津城建大学 | City rail transit station area function identification method based on interest point data |
Also Published As
| Publication number | Publication date |
|---|---|
| US8905932B2 (en) | 2014-12-09 |
| US20090012430A1 (en) | 2009-01-08 |
| EP2182840A4 (en) | 2015-03-04 |
| WO2009025769A9 (en) | 2010-05-14 |
| EP2182840A1 (en) | 2010-05-12 |
| WO2009025769A1 (en) | 2009-02-26 |
Similar Documents
| Publication | Publication Date | Title |
|---|---|---|
| US8905932B2 (en) | Non-invasive characterization of human vasculature | |
| US10092195B2 (en) | Noninvasive detection of human brain conditions and anomalies | |
| EP3229669B1 (en) | Noninvasive detection of human brain conditions and anomalies | |
| Chakshu et al. | A semi‐active human digital twin model for detecting severity of carotid stenoses from head vibration—A coupled computational mechanics and computer vision method | |
| Markus | Transcranial Doppler detection of circulating cerebral emboli. A review. | |
| Siebler et al. | Silent cerebral embolism caused by neurologically symptomatic high-grade carotid stenosis: event rates before and after carotid endarterectomy | |
| EP4039180B1 (en) | Ischemic stroke detection and classification method based on medical image, apparatus and system | |
| US20140194740A1 (en) | Emboli detection in the brain using a transcranial doppler photoacoustic device capable of vasculature and perfusion measurement | |
| EP1779785B1 (en) | Ultrasonograph and ultrasonograph control method | |
| Schneider et al. | Transcranial Doppler in the management of extracranial cerebrovascular disease: implications in diagnosis and monitoring | |
| PETTY et al. | Transcranial Doppler ultrasonography: clinical applications in cerebrovascular disease | |
| JP5730879B2 (en) | Device and system for determining the likelihood of a patient having a clinical or clinical asymptomatic event based on identified physiological parameters | |
| JP7042814B2 (en) | A system that is placed on the patient's head and contains a transducer to measure the pulsation of cortical tissue in the patient's brain. | |
| US10076274B2 (en) | System and method for non-invasive detection of human cranial conditions | |
| JP6716604B2 (en) | Method and apparatus for non-invasive assessment of intracranial pressure | |
| CN118284365A (en) | Information processing device for epilepsy diagnosis, intravascular device, information processing method for epilepsy diagnosis, and computer program for epilepsy diagnosis | |
| Rosenberg et al. | Responses to direction and transparent motion stimuli in area FST of the macaque | |
| WO2024206291A2 (en) | A device to assess intracranial pressure (icp) noninvasively | |
| Meves et al. | Distribution of artificially-produced microembolic signals into the cerebral circulation | |
| Dickey et al. | Cortical ripples provide the conditions for consolidation during NREM sleep in humans | |
| Easton | Cerebral embolism and Doppler ultrasound | |
| Mitsumura et al. | Clinical characteristics of intracranial reversed vertebral artery flow evaluated by transcranial color flow imaging | |
| Onorato et al. | Echocardiographic detection and transcranial Doppler quantification of right-to-left shunting | |
| US12564374B2 (en) | Spinal cerebral artery rupture detector | |
| Németh et al. | Microembolic signal detection |
Legal Events
| Date | Code | Title | Description |
|---|---|---|---|
| PUAI | Public reference made under article 153(3) epc to a published international application that has entered the european phase |
Free format text: ORIGINAL CODE: 0009012 |
|
| 17P | Request for examination filed |
Effective date: 20100317 |
|
| AK | Designated contracting states |
Kind code of ref document: A1 Designated state(s): AT BE BG CH CY CZ DE DK EE ES FI FR GB GR HR HU IE IS IT LI LT LU LV MC MT NL NO PL PT RO SE SI SK TR |
|
| AX | Request for extension of the european patent |
Extension state: AL BA MK RS |
|
| RIN1 | Information on inventor provided before grant (corrected) |
Inventor name: LOVOI, PAUL, A. Inventor name: JARVELA, JEFF Inventor name: NEILD, PETE Inventor name: THOMAS, JOHN Inventor name: SCHUMACHER, RAY Inventor name: MACVEAN, CHARLIE Inventor name: MURPHY, KIERAN |
|
| RIN1 | Information on inventor provided before grant (corrected) |
Inventor name: MURPHY, KIERAN Inventor name: LOVOI, PAUL, A. Inventor name: NEILD, PETE Inventor name: SCHUMACHER, RAY Inventor name: JARVELA, JEFF Inventor name: THOMAS, JOHN Inventor name: MACVEAN, CHARLIE |
|
| DAX | Request for extension of the european patent (deleted) | ||
| A4 | Supplementary search report drawn up and despatched |
Effective date: 20150202 |
|
| RIC1 | Information provided on ipc code assigned before grant |
Ipc: A61B 7/04 20060101ALI20150127BHEP Ipc: G06F 19/00 20110101ALI20150127BHEP Ipc: A61B 5/026 20060101AFI20150127BHEP Ipc: A61B 5/00 20060101ALI20150127BHEP Ipc: A61B 5/02 20060101ALI20150127BHEP |
|
| 17Q | First examination report despatched |
Effective date: 20160314 |
|
| GRAP | Despatch of communication of intention to grant a patent |
Free format text: ORIGINAL CODE: EPIDOSNIGR1 |
|
| INTG | Intention to grant announced |
Effective date: 20170119 |
|
| RIN1 | Information on inventor provided before grant (corrected) |
Inventor name: SCHUMACHER, RAY Inventor name: NEILD, PETE Inventor name: JARVELA, JEFF Inventor name: THOMAS, JOHN Inventor name: MURPHY, KIERAN Inventor name: LOVOI, PAUL, A. Inventor name: MACVEAN, CHARLIE |
|
| GRAS | Grant fee paid |
Free format text: ORIGINAL CODE: EPIDOSNIGR3 |
|
| GRAA | (expected) grant |
Free format text: ORIGINAL CODE: 0009210 |
|
| AK | Designated contracting states |
Kind code of ref document: B1 Designated state(s): AT BE BG CH CY CZ DE DK EE ES FI FR GB GR HR HU IE IS IT LI LT LU LV MC MT NL NO PL PT RO SE SI SK TR |
|
| REG | Reference to a national code |
Ref country code: GB Ref legal event code: FG4D |
|
| REG | Reference to a national code |
Ref country code: AT Ref legal event code: REF Ref document number: 889033 Country of ref document: AT Kind code of ref document: T Effective date: 20170515 Ref country code: CH Ref legal event code: EP |
|
| REG | Reference to a national code |
Ref country code: IE Ref legal event code: FG4D |
|
| REG | Reference to a national code |
Ref country code: DE Ref legal event code: R096 Ref document number: 602008050105 Country of ref document: DE |
|
| REG | Reference to a national code |
Ref country code: FR Ref legal event code: PLFP Year of fee payment: 10 |
|
| REG | Reference to a national code |
Ref country code: NL Ref legal event code: MP Effective date: 20170503 |
|
| REG | Reference to a national code |
Ref country code: AT Ref legal event code: MK05 Ref document number: 889033 Country of ref document: AT Kind code of ref document: T Effective date: 20170503 |
|
| REG | Reference to a national code |
Ref country code: LT Ref legal event code: MG4D |
|
| PG25 | Lapsed in a contracting state [announced via postgrant information from national office to epo] |
Ref country code: FI Free format text: LAPSE BECAUSE OF FAILURE TO SUBMIT A TRANSLATION OF THE DESCRIPTION OR TO PAY THE FEE WITHIN THE PRESCRIBED TIME-LIMIT Effective date: 20170503 Ref country code: HR Free format text: LAPSE BECAUSE OF FAILURE TO SUBMIT A TRANSLATION OF THE DESCRIPTION OR TO PAY THE FEE WITHIN THE PRESCRIBED TIME-LIMIT Effective date: 20170503 Ref country code: GR Free format text: LAPSE BECAUSE OF FAILURE TO SUBMIT A TRANSLATION OF THE DESCRIPTION OR TO PAY THE FEE WITHIN THE PRESCRIBED TIME-LIMIT Effective date: 20170804 Ref country code: ES Free format text: LAPSE BECAUSE OF FAILURE TO SUBMIT A TRANSLATION OF THE DESCRIPTION OR TO PAY THE FEE WITHIN THE PRESCRIBED TIME-LIMIT Effective date: 20170503 Ref country code: LT Free format text: LAPSE BECAUSE OF FAILURE TO SUBMIT A TRANSLATION OF THE DESCRIPTION OR TO PAY THE FEE WITHIN THE PRESCRIBED TIME-LIMIT Effective date: 20170503 Ref country code: NO Free format text: LAPSE BECAUSE OF FAILURE TO SUBMIT A TRANSLATION OF THE DESCRIPTION OR TO PAY THE FEE WITHIN THE PRESCRIBED TIME-LIMIT Effective date: 20170803 Ref country code: AT Free format text: LAPSE BECAUSE OF FAILURE TO SUBMIT A TRANSLATION OF THE DESCRIPTION OR TO PAY THE FEE WITHIN THE PRESCRIBED TIME-LIMIT Effective date: 20170503 |
|
| PG25 | Lapsed in a contracting state [announced via postgrant information from national office to epo] |
Ref country code: BG Free format text: LAPSE BECAUSE OF FAILURE TO SUBMIT A TRANSLATION OF THE DESCRIPTION OR TO PAY THE FEE WITHIN THE PRESCRIBED TIME-LIMIT Effective date: 20170803 Ref country code: LV Free format text: LAPSE BECAUSE OF FAILURE TO SUBMIT A TRANSLATION OF THE DESCRIPTION OR TO PAY THE FEE WITHIN THE PRESCRIBED TIME-LIMIT Effective date: 20170503 Ref country code: SE Free format text: LAPSE BECAUSE OF FAILURE TO SUBMIT A TRANSLATION OF THE DESCRIPTION OR TO PAY THE FEE WITHIN THE PRESCRIBED TIME-LIMIT Effective date: 20170503 Ref country code: IS Free format text: LAPSE BECAUSE OF FAILURE TO SUBMIT A TRANSLATION OF THE DESCRIPTION OR TO PAY THE FEE WITHIN THE PRESCRIBED TIME-LIMIT Effective date: 20170903 Ref country code: PL Free format text: LAPSE BECAUSE OF FAILURE TO SUBMIT A TRANSLATION OF THE DESCRIPTION OR TO PAY THE FEE WITHIN THE PRESCRIBED TIME-LIMIT Effective date: 20170503 Ref country code: NL Free format text: LAPSE BECAUSE OF FAILURE TO SUBMIT A TRANSLATION OF THE DESCRIPTION OR TO PAY THE FEE WITHIN THE PRESCRIBED TIME-LIMIT Effective date: 20170503 |
|
| PG25 | Lapsed in a contracting state [announced via postgrant information from national office to epo] |
Ref country code: SK Free format text: LAPSE BECAUSE OF FAILURE TO SUBMIT A TRANSLATION OF THE DESCRIPTION OR TO PAY THE FEE WITHIN THE PRESCRIBED TIME-LIMIT Effective date: 20170503 Ref country code: CZ Free format text: LAPSE BECAUSE OF FAILURE TO SUBMIT A TRANSLATION OF THE DESCRIPTION OR TO PAY THE FEE WITHIN THE PRESCRIBED TIME-LIMIT Effective date: 20170503 Ref country code: EE Free format text: LAPSE BECAUSE OF FAILURE TO SUBMIT A TRANSLATION OF THE DESCRIPTION OR TO PAY THE FEE WITHIN THE PRESCRIBED TIME-LIMIT Effective date: 20170503 Ref country code: RO Free format text: LAPSE BECAUSE OF FAILURE TO SUBMIT A TRANSLATION OF THE DESCRIPTION OR TO PAY THE FEE WITHIN THE PRESCRIBED TIME-LIMIT Effective date: 20170503 Ref country code: DK Free format text: LAPSE BECAUSE OF FAILURE TO SUBMIT A TRANSLATION OF THE DESCRIPTION OR TO PAY THE FEE WITHIN THE PRESCRIBED TIME-LIMIT Effective date: 20170503 |
|
| REG | Reference to a national code |
Ref country code: DE Ref legal event code: R097 Ref document number: 602008050105 Country of ref document: DE |
|
| PG25 | Lapsed in a contracting state [announced via postgrant information from national office to epo] |
Ref country code: IT Free format text: LAPSE BECAUSE OF FAILURE TO SUBMIT A TRANSLATION OF THE DESCRIPTION OR TO PAY THE FEE WITHIN THE PRESCRIBED TIME-LIMIT Effective date: 20170503 |
|
| PLBE | No opposition filed within time limit |
Free format text: ORIGINAL CODE: 0009261 |
|
| STAA | Information on the status of an ep patent application or granted ep patent |
Free format text: STATUS: NO OPPOSITION FILED WITHIN TIME LIMIT |
|
| REG | Reference to a national code |
Ref country code: CH Ref legal event code: PL |
|
| PG25 | Lapsed in a contracting state [announced via postgrant information from national office to epo] |
Ref country code: MC Free format text: LAPSE BECAUSE OF FAILURE TO SUBMIT A TRANSLATION OF THE DESCRIPTION OR TO PAY THE FEE WITHIN THE PRESCRIBED TIME-LIMIT Effective date: 20170503 |
|
| 26N | No opposition filed |
Effective date: 20180206 |
|
| PG25 | Lapsed in a contracting state [announced via postgrant information from national office to epo] |
Ref country code: CH Free format text: LAPSE BECAUSE OF NON-PAYMENT OF DUE FEES Effective date: 20170831 Ref country code: LI Free format text: LAPSE BECAUSE OF NON-PAYMENT OF DUE FEES Effective date: 20170831 |
|
| REG | Reference to a national code |
Ref country code: IE Ref legal event code: MM4A |
|
| PG25 | Lapsed in a contracting state [announced via postgrant information from national office to epo] |
Ref country code: SI Free format text: LAPSE BECAUSE OF FAILURE TO SUBMIT A TRANSLATION OF THE DESCRIPTION OR TO PAY THE FEE WITHIN THE PRESCRIBED TIME-LIMIT Effective date: 20170503 |
|
| REG | Reference to a national code |
Ref country code: BE Ref legal event code: MM Effective date: 20170831 |
|
| PG25 | Lapsed in a contracting state [announced via postgrant information from national office to epo] |
Ref country code: LU Free format text: LAPSE BECAUSE OF NON-PAYMENT OF DUE FEES Effective date: 20170815 |
|
| PG25 | Lapsed in a contracting state [announced via postgrant information from national office to epo] |
Ref country code: IE Free format text: LAPSE BECAUSE OF NON-PAYMENT OF DUE FEES Effective date: 20170815 |
|
| PG25 | Lapsed in a contracting state [announced via postgrant information from national office to epo] |
Ref country code: BE Free format text: LAPSE BECAUSE OF NON-PAYMENT OF DUE FEES Effective date: 20170831 |
|
| REG | Reference to a national code |
Ref country code: FR Ref legal event code: PLFP Year of fee payment: 11 |
|
| PG25 | Lapsed in a contracting state [announced via postgrant information from national office to epo] |
Ref country code: MT Free format text: LAPSE BECAUSE OF NON-PAYMENT OF DUE FEES Effective date: 20170815 |
|
| PG25 | Lapsed in a contracting state [announced via postgrant information from national office to epo] |
Ref country code: HU Free format text: LAPSE BECAUSE OF FAILURE TO SUBMIT A TRANSLATION OF THE DESCRIPTION OR TO PAY THE FEE WITHIN THE PRESCRIBED TIME-LIMIT; INVALID AB INITIO Effective date: 20080815 |
|
| PG25 | Lapsed in a contracting state [announced via postgrant information from national office to epo] |
Ref country code: CY Free format text: LAPSE BECAUSE OF NON-PAYMENT OF DUE FEES Effective date: 20170503 |
|
| PG25 | Lapsed in a contracting state [announced via postgrant information from national office to epo] |
Ref country code: TR Free format text: LAPSE BECAUSE OF FAILURE TO SUBMIT A TRANSLATION OF THE DESCRIPTION OR TO PAY THE FEE WITHIN THE PRESCRIBED TIME-LIMIT Effective date: 20170503 |
|
| PG25 | Lapsed in a contracting state [announced via postgrant information from national office to epo] |
Ref country code: PT Free format text: LAPSE BECAUSE OF FAILURE TO SUBMIT A TRANSLATION OF THE DESCRIPTION OR TO PAY THE FEE WITHIN THE PRESCRIBED TIME-LIMIT Effective date: 20170503 |
|
| REG | Reference to a national code |
Ref country code: DE Ref legal event code: R082 Ref document number: 602008050105 Country of ref document: DE Representative=s name: SSM SANDMAIR PATENTANWAELTE RECHTSANWALT PARTN, DE |
|
| P01 | Opt-out of the competence of the unified patent court (upc) registered |
Effective date: 20230428 |
|
| PGFP | Annual fee paid to national office [announced via postgrant information from national office to epo] |
Ref country code: DE Payment date: 20250820 Year of fee payment: 18 |
|
| PGFP | Annual fee paid to national office [announced via postgrant information from national office to epo] |
Ref country code: GB Payment date: 20250820 Year of fee payment: 18 |
|
| PGFP | Annual fee paid to national office [announced via postgrant information from national office to epo] |
Ref country code: FR Payment date: 20250829 Year of fee payment: 18 |
|
| REG | Reference to a national code |
Ref country code: DE Ref legal event code: R081 Ref document number: 602008050105 Country of ref document: DE Owner name: BRAIN-PULSE, INC., WESTCHESTER, US Free format text: FORMER OWNER: JAN MEDICAL, INC., MOUNTAIN VIEW, CALIF., US |