EP2157912B1 - Multiparameter perfusion imaging with leakage correction - Google Patents
Multiparameter perfusion imaging with leakage correction Download PDFInfo
- Publication number
- EP2157912B1 EP2157912B1 EP08769657.1A EP08769657A EP2157912B1 EP 2157912 B1 EP2157912 B1 EP 2157912B1 EP 08769657 A EP08769657 A EP 08769657A EP 2157912 B1 EP2157912 B1 EP 2157912B1
- Authority
- EP
- European Patent Office
- Prior art keywords
- echo
- mri
- dce
- contrast
- sinθ
- Prior art date
- Legal status (The legal status is an assumption and is not a legal conclusion. Google has not performed a legal analysis and makes no representation as to the accuracy of the status listed.)
- Active
Links
- 238000003384 imaging method Methods 0.000 title claims description 11
- 230000010412 perfusion Effects 0.000 title description 16
- 238000012937 correction Methods 0.000 title description 14
- 230000000694 effects Effects 0.000 claims description 77
- 239000002872 contrast media Substances 0.000 claims description 48
- 238000002595 magnetic resonance imaging Methods 0.000 claims description 45
- 238000000034 method Methods 0.000 claims description 43
- 210000001519 tissue Anatomy 0.000 claims description 28
- 230000003727 cerebral blood flow Effects 0.000 claims description 18
- 230000008859 change Effects 0.000 claims description 11
- 230000035699 permeability Effects 0.000 claims description 10
- 238000001208 nuclear magnetic resonance pulse sequence Methods 0.000 claims description 9
- 206010015866 Extravasation Diseases 0.000 claims description 8
- 210000004369 blood Anatomy 0.000 claims description 8
- 239000008280 blood Substances 0.000 claims description 8
- 210000001723 extracellular space Anatomy 0.000 claims description 8
- 230000036251 extravasation Effects 0.000 claims description 8
- 238000012905 input function Methods 0.000 claims description 6
- 230000002490 cerebral effect Effects 0.000 claims description 5
- 230000008569 process Effects 0.000 claims description 4
- 238000012546 transfer Methods 0.000 claims description 4
- 210000004204 blood vessel Anatomy 0.000 claims description 3
- 210000000056 organ Anatomy 0.000 claims description 3
- WTFXARWRTYJXII-UHFFFAOYSA-N iron(2+);iron(3+);oxygen(2-) Chemical compound [O-2].[O-2].[O-2].[O-2].[Fe+2].[Fe+3].[Fe+3] WTFXARWRTYJXII-UHFFFAOYSA-N 0.000 claims description 2
- 238000004519 manufacturing process Methods 0.000 claims description 2
- 230000001413 cellular effect Effects 0.000 claims 2
- 238000012986 modification Methods 0.000 claims 2
- 230000004048 modification Effects 0.000 claims 2
- FGUUSXIOTUKUDN-IBGZPJMESA-N C1(=CC=CC=C1)N1C2=C(NC([C@H](C1)NC=1OC(=NN=1)C1=CC=CC=C1)=O)C=CC=C2 Chemical compound C1(=CC=CC=C1)N1C2=C(NC([C@H](C1)NC=1OC(=NN=1)C1=CC=CC=C1)=O)C=CC=C2 FGUUSXIOTUKUDN-IBGZPJMESA-N 0.000 claims 1
- 238000013535 dynamic contrast enhanced MRI Methods 0.000 description 43
- 206010028980 Neoplasm Diseases 0.000 description 14
- 229910052688 Gadolinium Inorganic materials 0.000 description 12
- UIWYJDYFSGRHKR-UHFFFAOYSA-N gadolinium atom Chemical compound [Gd] UIWYJDYFSGRHKR-UHFFFAOYSA-N 0.000 description 12
- 238000013459 approach Methods 0.000 description 11
- 238000004458 analytical method Methods 0.000 description 10
- 208000003174 Brain Neoplasms Diseases 0.000 description 9
- 230000005291 magnetic effect Effects 0.000 description 9
- 230000008901 benefit Effects 0.000 description 6
- 238000002592 echocardiography Methods 0.000 description 6
- 210000002381 plasma Anatomy 0.000 description 6
- 230000008728 vascular permeability Effects 0.000 description 6
- 210000004556 brain Anatomy 0.000 description 5
- 238000005534 hematocrit Methods 0.000 description 5
- 230000005415 magnetization Effects 0.000 description 5
- 238000005259 measurement Methods 0.000 description 5
- 238000012935 Averaging Methods 0.000 description 4
- 230000008499 blood brain barrier function Effects 0.000 description 4
- 239000003795 chemical substances by application Substances 0.000 description 4
- 230000005284 excitation Effects 0.000 description 4
- HZHFFEYYPYZMNU-UHFFFAOYSA-K gadodiamide Chemical compound [Gd+3].CNC(=O)CN(CC([O-])=O)CCN(CC([O-])=O)CCN(CC([O-])=O)CC(=O)NC HZHFFEYYPYZMNU-UHFFFAOYSA-K 0.000 description 4
- 230000014509 gene expression Effects 0.000 description 4
- 230000001052 transient effect Effects 0.000 description 4
- XLYOFNOQVPJJNP-UHFFFAOYSA-N water Substances O XLYOFNOQVPJJNP-UHFFFAOYSA-N 0.000 description 4
- 238000004364 calculation method Methods 0.000 description 3
- 229940079593 drug Drugs 0.000 description 3
- 239000003814 drug Substances 0.000 description 3
- 230000009977 dual effect Effects 0.000 description 3
- 229960005063 gadodiamide Drugs 0.000 description 3
- 230000000004 hemodynamic effect Effects 0.000 description 3
- 238000011084 recovery Methods 0.000 description 3
- 239000000523 sample Substances 0.000 description 3
- 238000004904 shortening Methods 0.000 description 3
- 239000000126 substance Substances 0.000 description 3
- 230000002792 vascular Effects 0.000 description 3
- 210000005166 vasculature Anatomy 0.000 description 3
- 208000003510 Nephrogenic Fibrosing Dermopathy Diseases 0.000 description 2
- 206010067467 Nephrogenic systemic fibrosis Diseases 0.000 description 2
- 230000002491 angiogenic effect Effects 0.000 description 2
- 210000001367 artery Anatomy 0.000 description 2
- 210000001218 blood-brain barrier Anatomy 0.000 description 2
- 238000007796 conventional method Methods 0.000 description 2
- 230000001186 cumulative effect Effects 0.000 description 2
- 238000009795 derivation Methods 0.000 description 2
- JXSJBGJIGXNWCI-UHFFFAOYSA-N diethyl 2-[(dimethoxyphosphorothioyl)thio]succinate Chemical compound CCOC(=O)CC(SP(=S)(OC)OC)C(=O)OCC JXSJBGJIGXNWCI-UHFFFAOYSA-N 0.000 description 2
- 238000009792 diffusion process Methods 0.000 description 2
- 201000010099 disease Diseases 0.000 description 2
- 208000037265 diseases, disorders, signs and symptoms Diseases 0.000 description 2
- 230000001939 inductive effect Effects 0.000 description 2
- 238000002347 injection Methods 0.000 description 2
- 239000007924 injection Substances 0.000 description 2
- 230000003993 interaction Effects 0.000 description 2
- 239000011159 matrix material Substances 0.000 description 2
- 230000005298 paramagnetic effect Effects 0.000 description 2
- 230000035945 sensitivity Effects 0.000 description 2
- 230000003068 static effect Effects 0.000 description 2
- 230000002123 temporal effect Effects 0.000 description 2
- 238000012360 testing method Methods 0.000 description 2
- UFHFLCQGNIYNRP-UHFFFAOYSA-N Hydrogen Chemical compound [H][H] UFHFLCQGNIYNRP-UHFFFAOYSA-N 0.000 description 1
- 239000002616 MRI contrast agent Substances 0.000 description 1
- 206010028813 Nausea Diseases 0.000 description 1
- 206010047700 Vomiting Diseases 0.000 description 1
- 230000003321 amplification Effects 0.000 description 1
- 210000005013 brain tissue Anatomy 0.000 description 1
- 210000000481 breast Anatomy 0.000 description 1
- 210000001175 cerebrospinal fluid Anatomy 0.000 description 1
- 238000007405 data analysis Methods 0.000 description 1
- 238000000354 decomposition reaction Methods 0.000 description 1
- 230000003247 decreasing effect Effects 0.000 description 1
- 230000001419 dependent effect Effects 0.000 description 1
- 238000001514 detection method Methods 0.000 description 1
- 238000011161 development Methods 0.000 description 1
- 206010012601 diabetes mellitus Diseases 0.000 description 1
- 238000003745 diagnosis Methods 0.000 description 1
- 238000010790 dilution Methods 0.000 description 1
- 239000012895 dilution Substances 0.000 description 1
- 230000003467 diminishing effect Effects 0.000 description 1
- 239000006185 dispersion Substances 0.000 description 1
- 238000006073 displacement reaction Methods 0.000 description 1
- 238000009826 distribution Methods 0.000 description 1
- 238000005516 engineering process Methods 0.000 description 1
- 239000012530 fluid Substances 0.000 description 1
- 150000002251 gadolinium compounds Chemical class 0.000 description 1
- 210000004884 grey matter Anatomy 0.000 description 1
- 229910052739 hydrogen Inorganic materials 0.000 description 1
- 239000001257 hydrogen Substances 0.000 description 1
- 125000004435 hydrogen atom Chemical group [H]* 0.000 description 1
- 238000010348 incorporation Methods 0.000 description 1
- 230000006698 induction Effects 0.000 description 1
- 150000002632 lipids Chemical class 0.000 description 1
- 230000000873 masking effect Effects 0.000 description 1
- 210000003657 middle cerebral artery Anatomy 0.000 description 1
- 210000002346 musculoskeletal system Anatomy 0.000 description 1
- 239000002105 nanoparticle Substances 0.000 description 1
- 229940031182 nanoparticles iron oxide Drugs 0.000 description 1
- 230000008693 nausea Effects 0.000 description 1
- 210000005036 nerve Anatomy 0.000 description 1
- 210000002569 neuron Anatomy 0.000 description 1
- 238000003199 nucleic acid amplification method Methods 0.000 description 1
- 230000007310 pathophysiology Effects 0.000 description 1
- 238000012805 post-processing Methods 0.000 description 1
- 230000036316 preload Effects 0.000 description 1
- 210000002307 prostate Anatomy 0.000 description 1
- 230000009467 reduction Effects 0.000 description 1
- 238000002271 resection Methods 0.000 description 1
- 238000005070 sampling Methods 0.000 description 1
- 238000009738 saturating Methods 0.000 description 1
- 208000007056 sickle cell anemia Diseases 0.000 description 1
- 230000005747 tumor angiogenesis Effects 0.000 description 1
- 230000008673 vomiting Effects 0.000 description 1
- 238000010792 warming Methods 0.000 description 1
- 238000005303 weighing Methods 0.000 description 1
- 210000004885 white matter Anatomy 0.000 description 1
Images




Classifications
-
- A—HUMAN NECESSITIES
- A61—MEDICAL OR VETERINARY SCIENCE; HYGIENE
- A61B—DIAGNOSIS; SURGERY; IDENTIFICATION
- A61B5/00—Measuring for diagnostic purposes; Identification of persons
- A61B5/02—Detecting, measuring or recording for evaluating the cardiovascular system, e.g. pulse, heart rate, blood pressure or blood flow
- A61B5/026—Measuring blood flow
- A61B5/0263—Measuring blood flow using NMR
-
- G—PHYSICS
- G01—MEASURING; TESTING
- G01R—MEASURING ELECTRIC VARIABLES; MEASURING MAGNETIC VARIABLES
- G01R33/00—Arrangements or instruments for measuring magnetic variables
- G01R33/20—Arrangements or instruments for measuring magnetic variables involving magnetic resonance
- G01R33/44—Arrangements or instruments for measuring magnetic variables involving magnetic resonance using nuclear magnetic resonance [NMR]
- G01R33/48—NMR imaging systems
- G01R33/54—Signal processing systems, e.g. using pulse sequences ; Generation or control of pulse sequences; Operator console
- G01R33/56—Image enhancement or correction, e.g. subtraction or averaging techniques, e.g. improvement of signal-to-noise ratio and resolution
- G01R33/5601—Image enhancement or correction, e.g. subtraction or averaging techniques, e.g. improvement of signal-to-noise ratio and resolution involving use of a contrast agent for contrast manipulation, e.g. a paramagnetic, super-paramagnetic, ferromagnetic or hyperpolarised contrast agent
-
- G—PHYSICS
- G01—MEASURING; TESTING
- G01R—MEASURING ELECTRIC VARIABLES; MEASURING MAGNETIC VARIABLES
- G01R33/00—Arrangements or instruments for measuring magnetic variables
- G01R33/20—Arrangements or instruments for measuring magnetic variables involving magnetic resonance
- G01R33/44—Arrangements or instruments for measuring magnetic variables involving magnetic resonance using nuclear magnetic resonance [NMR]
- G01R33/48—NMR imaging systems
- G01R33/54—Signal processing systems, e.g. using pulse sequences ; Generation or control of pulse sequences; Operator console
- G01R33/56—Image enhancement or correction, e.g. subtraction or averaging techniques, e.g. improvement of signal-to-noise ratio and resolution
- G01R33/563—Image enhancement or correction, e.g. subtraction or averaging techniques, e.g. improvement of signal-to-noise ratio and resolution of moving material, e.g. flow contrast angiography
- G01R33/56366—Perfusion imaging
-
- A—HUMAN NECESSITIES
- A61—MEDICAL OR VETERINARY SCIENCE; HYGIENE
- A61B—DIAGNOSIS; SURGERY; IDENTIFICATION
- A61B5/00—Measuring for diagnostic purposes; Identification of persons
- A61B5/41—Detecting, measuring or recording for evaluating the immune or lymphatic systems
- A61B5/413—Monitoring transplanted tissue or organ, e.g. for possible rejection reactions after a transplant
-
- G—PHYSICS
- G01—MEASURING; TESTING
- G01R—MEASURING ELECTRIC VARIABLES; MEASURING MAGNETIC VARIABLES
- G01R33/00—Arrangements or instruments for measuring magnetic variables
- G01R33/20—Arrangements or instruments for measuring magnetic variables involving magnetic resonance
- G01R33/44—Arrangements or instruments for measuring magnetic variables involving magnetic resonance using nuclear magnetic resonance [NMR]
- G01R33/48—NMR imaging systems
- G01R33/4818—MR characterised by data acquisition along a specific k-space trajectory or by the temporal order of k-space coverage, e.g. centric or segmented coverage of k-space
- G01R33/4824—MR characterised by data acquisition along a specific k-space trajectory or by the temporal order of k-space coverage, e.g. centric or segmented coverage of k-space using a non-Cartesian trajectory
Definitions
- Magnetic resonance imaging relies on the relaxation properties of excited hydrogen nuclei in water and lipids to create images.
- the forces in the magnetic field cause the spins of atomic nuclei having a non-zero spin to align in a particular manner with the applied magnetic field.
- hydrogen atoms have a simple spin (1/2) and therefore align either parallel or anti-parallel to the magnetic field.
- a radio frequency pulse RF is then applied in a direction perpendicular to the magnetic field and removed. When the RF signal is removed, the atomic nuclei relax.
- the nuclei release energy by emitting an RF signal unique to the nuclei, which may be measured by a conductive field coil placed around the target object. This measurement is processed or reconstructed to obtain the magnetic resonance images.
- T1 defines the time required for the displaced nuclei to return to equilibrium, that is to say, the time required for the nuclei to realign themselves in the magnetic field.
- T2 is the time required for the signal emitted by a specific tissue type to decay.
- Image contrast is created by using a selection of image acquisition parameters that weights signals by T1, T2 or T2*, or no relaxation time, which are known in the art as proton density images.
- T1-weighting causes the nerve connections of white matter to appear white, and the congregations of neurons of gray matter to appear gray. Cerebrospinal fluid appears dark.
- Dynamic Susceptibility Contrast (DSC) MRI and Dynamic Contrast Enhanced (DCE) MRI are two minimally-invasive imaging techniques frequently employed to probe the angiogenic activity of brain neoplasms based on estimates of vascularity and vascular permeability.
- Contrast agents may be used to enhance tissue contrast in MRI images by inducing susceptibility contrast effects when injected.
- a paramagnetic contrast agent typically a gadolinium compound is employed for this purpose; although, as will be discussed in greater detail below, several different contrast agents may also be used.
- Gadolinium-enhanced tissues and fluids appear extremely bright in T1-weighted images, thereby providing high contrast sensitivity which facilitates the detection of vascular issues (tumors) and permits assessment of brain perfusion, such as that which occurs following a stroke. Cerebral blood volume (CBV) and cerebral blood flow (CBF) can be measured, and other hemodynamic and vascular parameters can be derived from these measurements.
- CBV Cerebral blood volume
- CBF cerebral blood flow
- a significant problem associated with the use of gadolinium-based contrast agents is that they leave or leak from the blood vessels. This leakage results in undesirable T1 and T2 relaxation effects that confound the measurement of perfusion.
- the present invention addresses the afore-mentioned and other problems by providing a new and useful MRI methodology which uses a combination of dual-echo acquisition and SPIRAL acquisition to eliminate T1 leakage effects and post-processing algorithms to eliminate T2/T2* effects resulting from contrast agent leakage, thereby permitting accurate and robust measures of blood volume and flow, as well as vascular permeability.
- tissue perfusion outside of the brain such as in and around cancers of the breast, prostate, and musculoskeletal system may be measured. Organ perfusion may also be measured in other normal and disease states as well, including but not limited to organ transplants, sickle cell disease and diabetes.
- the technique herein disclosed may also be applied to studies related to the development and testing of drugs and may preclude the need for a loading dose of Gd contrast agent, thus decreasing the cumulative dose needed for each patient's study.
- the methodology of the present invention permits the calculation of vascular permeability using well-known T1-based modeling algorithms. No other technology enables the collection of both T2/T2* perfusion data and T1-based permeability data at the same time.
- Dynamic Susceptibility Contrast (DSC) MRI and Dynamic Contrast Enhanced (DCE) MRI are two minimally invasive imaging techniques frequently employed to probe the angiogenic activity of brain neoplasms based on estimates of vascularity and vascular permeability. It is well known that gadolinium produces simultaneous T1, T2, and T2* shortening effects in tissue, and these properties are uniquely exploited in DSC- and DCE-MRI. However; several different MRI contrast agents are capable of inducing susceptibility contrast effects when injected. Therefore, several different contrast agents can be used in conjunction with the described invention. Most commonly, paramagnetic agents such as Gd (gadolinium)-chelated contrast agents are used.
- Gd(III)-chelated agents When Gd(III)-chelated agents are injected quickly, under bolus-like conditions, they induce susceptibility contrast in tissues, notable as a transient decrease in a T2 or T2*-weighted MRI signal.
- contrast agents can be used. These agents are superparamagnetic iron-oxide contrast agents, such as MION (monocrystalline iron oxide nanoparticles), or USPIO (ultra-small polycrystalline nanoparticles). These agents can also cause the necessary susceptibility contrast for this invention.
- DSC-MRI a concentrated bolus of gadolinium, confined to the intravascular space and flowing through a tissue capillary bed, induces transient signal loss through spin dephasing caused by vascular-extravascular susceptibility gradients. So long as recirculation effects are eliminated, analysis of DSC-MRI data, using indicator dilution theory provides hemodynamic estimates of relative cerebral blood volume (rCBV), cerebral blood flow (CBF), and mean transit time (MTT).
- rCBV relative cerebral blood volume
- CBF cerebral blood flow
- MTT mean transit time
- contrast agent extravasation arising from disruptions of the blood-brain barrier, gives rise to signal enhancement through dipolar interaction between gadolinium's unpaired electrons and local tissue protons.
- Pharmacokinetic analysis of DCE-MRI data provides insight into the underlying tissue pathophysiology, through estimation of the blood-brain volume transfer constant (K trans ), fractional extravascular, extracellular space (EES) volume (Ve), and the efflux rate constant from EES to plasma (Kep).
- K trans blood-brain volume transfer constant
- EES extravascular, extracellular space
- Kep efflux rate constant from EES to plasma
- Dual-echo MRI acquisition methods offer a robust alternative to single-echo acquisitions following loading doses when collecting DSC-MRI data, in brain tumor patients.
- brain tumor vascularity and vascular permeability parameters corrected for confounding contrast agent leakage and recirculation effects, can be obtained simultaneously with a dual-echo acquisition using a standard dose of contrast agent.
- both DSC- and DCE-MRI parameters are corrected for residual susceptibility effects and T1/T2* effects arising from contrast agent recirculation and leakage.
- a 30 second delay was inserted between prescan and the beginning of the dual-echo acquisition to allow full recovery of longitudinal magnetization. This facilitated estimation of the equilibrium magnetization from the first time point of the dual-echo acquisition and eliminated the necessity of collecting a separate pre-contrast calibration scan (see Appendix B).
- a standard dose of Gadodiamide (0.1 mmol/kg, Omniscan) was injected at 3 mL/sec using a power injector 60 seconds after the start of acquisition. Post-contrast T1W images were then acquired as part of the standard clinical protocol.
- the pulse sequence acquired two echoes sequentially within a free induction decay (FID) immediately following a spatial-spectral excitation pulse, which was used to reduce the chemical shift influence on off resonance effects through selective excitation of water.
- FID free induction decay
- Steady-state signal incoherency was established by applying a killer pulse to spoil the transverse magnetization before acquisition of each subsequent shot.
- the killer was applied along the slice select axis, since this axis had the lowest gradient duty cycle.
- the Ernst angle (72 degrees) was chosen to maximize the signal-to-noise ratio of the dual-echo acquisition in an effort to prevent the second-echo signal, particularly in large vessels, from saturating at the rectified noise floor during the first pass of the bolus. Saturation of the signal can result in nonlinearities in the relationship between signal changes and contrast agent concentration, which can introduce error in the estimate of the arterial input function.
- the spiral gradient waveforms were implemented using the Glover approach, as is known in the art. Although reversed spiral readouts would have produced better edge definition, the spiral-out direction was chosen to increase the signal to noise ratio SNR, and minimize the TE of the first echo in order to maximize T1 weighting for DCE-MRI parameter estimation.
- the spiral waveforms consisted of 3892 points corresponding to a readout duration of approximately 38 msec. Although insignificant for single-shot spiral, hysteresis correction gradients were implemented to reduce artifacts associated with gradient amplifier current monitor hysteresis. In dual-echo acquisitions, the first echo readout results in an apparent diffusion weighting for the second echo.
- G is the spiral readout gradient waveform
- y is the gyromagnetic ratio
- ⁇ t is the gradient update time (4 ⁇ sec for scanner employed in the test).
- the b-value was estimated to be 0.0123 s/mm2.
- the raw spiral data was transferred to a remote Linux workstation (quad AMD dual-core 2.4 GHz CPUs, 16GB RAM, SUSE 1 0.3) and reconstructed offline using custom Matlab (Version 7.5. R2007b, The MathWorks, Inc.) software. Sample reconstructed spiral images from the first- and second echoes are displayed in Figures 1b-c .
- DSC-MRI parameters were estimated using conventional DSC-MRI algorithms.
- the arterial input function (AIF) was generated by averaging the ⁇ R2*(t) time courses from three voxels manually selected in regions of the middle cerebral arteries.
- rCBV k h ⁇ ⁇ 0 ⁇ ⁇ R 2 ⁇ ⁇ d ⁇ ⁇ 0 ⁇ AIF ⁇ d ⁇
- ⁇ the density of brain tissue (1.04 g/ml)
- k h a correction factor for the difference in large versus small vessel hematocrit
- k h 1 ⁇ 0.45 1 ⁇ 0.25
- CBF max R t
- C T (t) tissue concentration-time curves
- R 1 is the longitudinal relaxivity of Gadodiamide at I.5T (approximately 4.39 s -1 mM -1 at 37° C).
- a surrogate for the plasma concentration-time curve, C p (t) was determined in a two step process.
- volume transfer constant between blood plasma and EES, K trans , and the fractional volume of the plasma space, v P were determined on a voxel-by-voxel basis by linear least squares fitting of the linearized Patlak model to the tissue and plasma concentration-time curves:
- C T t K trans ⁇ 0 t C p t ′ dt ′ + v p ⁇ C p t
- Figure 2 displays the dual-echo time series for the representative tumor voxel depicted on the first and second echo spiral images shown in Figures 2b-c . Note that the signals have been truncated to remove the first few points during which the signal approached steady-state. Extravasation of contrast agent is apparent from the increase in signal intensity demonstrated on both the first and second echo signals.
- leakage of contrast agent begins at the appearance time of the bolus, occurs during the first pass of the bolus, and continues after the first pass of the bolus.
- Figures 2d-f display the ⁇ R2*(t) curve (for the same tumor voxel) obtained from the second-echo signal only (equation 19), along with corresponding rCBV and CBF maps. Note that the curve in 2d is confounded by T1 leakage effects, which causes the post-bolus ⁇ R2*(t) to fall below the pre-bolus baseline and results in an underestimation of rCBV. This effect is apparent by a lack of blood volume in Figure 2e , which is exacerbated in regions of tumor.
- Figures 2g-i display the ⁇ R2*(t) curve (for the same tumor voxel) obtained from the ratio of the dual-echo signals (equation 34), along with corresponding rCBV and CBF maps.
- Figures 2j-l display representative ⁇ R2*(t)' (red) and ⁇ R2*(t) (blue) curves obtained using equations 35 and 36, along with corresponding rCBV and CBF maps from equation 36. Note that, after this correction, the blue curve shown in Figure 2j and rCBV and CBF maps in Figures 2k-l are no longer confounded by recirculation nor any dipolar T1 and T2 and/or residual susceptibility leakage effects. This results in lower rCBV values seen in Figure 2k relative to Figure 2h , most notably in tumor, a result more representative of the true blood volume.
- Figure 4 demonstrates the effect of correcting DCE-MRI time series for T2/T2* effects.
- Figure 4a displays the first, corrected first, and second echo signals for a voxel in an artery.
- a concentrated bolus of gadolinium produces a transient signal decrease in both the first and second echo signals during the first pass.
- Figure 5 demonstrates the influence of S 0 on DCE-MRI concentration-time curves calculated using equations 54 and 85.
- Tissue concentration-time curves generated using an underestimated value of S 0 exhibit amplified noise when the increased signal intensity approaches the value of S 0 ( Figure 5b ). This effect can be caused by not waiting long enough for full recovery of longitudinal magnetization between prescan and beginning acquisition. Allowing full recovery of longitudinal magnetization prevents noise amplification and produces a concentration-time curve profile ( Figure 5c ) that matches the signal time course ( Figure 5a ).
- Figure 6 displays conventional images along with perfusion and permeability parameter maps obtained with the proposed method used for diagnosis of a brain tumor patient: (a) pre-contrast FLAIR, (b) post-contrast T1, (c) rCBV, (d) CBF, (e) K trans , (f) v p .
- Perfusion parameters i.e., rCBV and CBF
- Permeability parameters i.e., K trans and v p
- the new and novel method of the instant invention permits simultaneous estimation of DSC- and DCE-MRI parameters from a single acquisition using a standard dose of contrast agent.
- Perfusion and permeability parameters are estimated using conventional algorithms and have been corrected for confounding recirculation effects as well as any additional dipolar or residual susceptibility leakage effects.
- the disclosed method presents several significant advantages, including:
- spiral-based dual-echo approach described herein offers some important advantages for perfusion imaging. While previous methods for simultaneously acquiring dual echo time courses have relied on keyhole acquisitions or segmented echo-planar imaging, spiral reduces readout times by eliminating the filling of unused data in the corners of k-space and, consequently, permits an increased slice number, increased resolution, or shorter TR capabilities. The shorter readout duration reduces resolution loss due to T2* decay, which diminishes vessel blooming. Specific to DCE-MRI, because the readout starts in the center of k-space, spirals can achieve very short minimum echo times, producing images with good T1 weighting. Second, by starting at the center of k-space, spiral is gradient moment compensated to all orders, which diminishes flow displacement artifacts.
- Parallel imaging would facilitate the ability to acquire higher increased number of slices within a given TR or additional echoes. Most importantly, by reducing the length of the spiral readout with parallel imaging, off resonance and susceptibility effects would be reduced. This would greatly improve data, quality in regions of static susceptibility differences, such as resection cavities.
- the present invention does not require estimation of a precontrast T1 map, there is a dependence on the signal-to-noise ratio and number of precontrast baseline points sampled in the DCE acquisition. Poor signal-to-noise ratio and a small number of pre-contrast baseline points could affect the accuracy of the baseline signal estimate, and thus, initial T1 estimate. However, errors associated with determining precontrast T1 from a separate calibration scan could also propogate into estimation of ⁇ R1. A flip angle of 72 degrees (the Ernst angle) was used in an embodiment to maximize signal-to-noise ratio, and 60 baseline points were acquired. Both of these factors were selected to improve the accuracy of the precontrast baseline signal intensity.
- the method of the instant invention allows simultaneous estimation of DSC- and DCE-MRI in one acquisition, using a single dose of contrast agent.
- Conventional algorithms are used to obtain the perfusion and permeability parameters corrected for recirculation and leakage effects.
- This method does not require administration of a loading dose of contrast agent, and pre-contrast spin density and native T1 calibration scans (traditionally required for DCE) have been eliminated, resulting in a superior technique performing DSC- and DCE-MRI studies in brain tumors.
- k is a constant dependent on transverse relaxivity, field strength, pulse sequence, and vascular morphology.
- a rapid acquisition method is used to acquire susceptibility-weighted images and the pulse sequences typically employed are of the spoiled gradient-echo family (i.e., echo-planar, spiral. FLASH, etc).
- Equation 18 demonstrates the potential influence of dipolar T1 effects on concentration-time curves obtained with DSC-MRI.
- the contrast agent remains confined to the vasculature (i.e., no extravasation occurs).
- Dual-echo acquisition methods provide an effective means by which confounding dipolar T1 leakage effects can be eliminated from DSC-MRI time courses.
- Equation 34 is the DSC-MRI concentration-time curve free from dipolar T1 leakage effects.
- DSC concentration-time curves characterized as elevated endlines that develop after the first pass of contrast agent has been observed. The effect seems to be exacerbated in tumors relative to normal brain, which implies that there could be a susceptibility or T2 leakage effect in these regions in addition to recirculation.
- the source of the elevated endlines could therefore be due to dipolar T2 effects, residual susceptibility effects from the contrast agent, or some combination of both.
- the DCE-MRI technique relies on the sensitivity of the pulse sequence to changes in signal intensity caused by T1 shortening.
- conventional 2D or 3D spoiled gradient echo sequences are often used in DCE-MRI because they provide good image quality with sufficient temporal resolution.
- Analogous to DSC-MRI, the generalized signal equation for DCE-MRI is then equivalent to that in equation 10.
- Equation 53 demonstrates the potential influence of T2* effects on concentration-time curves obtained with DCE-MRI. Since minimum echo times are used in DCE-MRI to obtain good T1 weighting, it is widely assumed that insignificant phase dispersion will occur over time scales of short TE (i.e., TE ⁇ T2*). Consequently, T2* effects are generally ignored, which results in the following approximation: ⁇ R 1 t ⁇ ⁇ 1 TR ln S 0 sin ⁇ ⁇ S t S 0 sin ⁇ ⁇ S t cos ⁇ S 0 sin ⁇ ⁇ S B cos ⁇ S 0 sin ⁇ ⁇ S B
- Equation 54 does not exhibit a dependence on the initial pre-contrast spin lattice relaxation time (i.e., T1 0 ), which eliminates the requirement of having to acquire a separate pre-contrast calibration scan. Instead, T1 0 is determined directly from the pre-contrast baseline signal intensity. In addition, notice that ⁇ R1(t) can be estimated directly from S(t), provided that an estimate of S 0 be obtained.
- S 0 can be estimated from a single-shot, single repetition (i.e., infinite TR), dual-echo scan.
- TR ⁇ ⁇ which is valid for a single repetition
- the signal equations for the first and second echoes reduce to:
- S TE 1 0 S 0 sin ⁇ e ⁇ TE 1 T 2 0 ⁇
- S TE 2 0 S 0 sin ⁇ e ⁇ TE 2 T 2 0 ⁇
- Dual-echo acquisitions offer two significant advantages for DCE-MR1.
- One advantage is that, assuming spins had fully relaxed prior to beginning the scan, S 0 can be determined from the first time point (i.e.. first repetition) of a single-shot. Dual-echo acquisition using the methodology described in equations 55-65. This factor results in a significant time savings in that no additional pre-contrast calibration scans are required to convert the DCE-MRI signal time courses into concentration-time curves.
- Equation 85 is the ⁇ R1(t) curve corrected for confounding T2* effects.
- An estimate of S 0 determined from the first time point of the single-shot, dual-echo acquisition, is then substituted into equation 85 to yield the change in spin lattice relaxation rate, which is then used to determine the concentration-time curves using equation 37.
Landscapes
- Health & Medical Sciences (AREA)
- Physics & Mathematics (AREA)
- Nuclear Medicine, Radiotherapy & Molecular Imaging (AREA)
- Life Sciences & Earth Sciences (AREA)
- General Health & Medical Sciences (AREA)
- Engineering & Computer Science (AREA)
- Radiology & Medical Imaging (AREA)
- Signal Processing (AREA)
- High Energy & Nuclear Physics (AREA)
- Condensed Matter Physics & Semiconductors (AREA)
- General Physics & Mathematics (AREA)
- Cardiology (AREA)
- Heart & Thoracic Surgery (AREA)
- Physiology (AREA)
- Vascular Medicine (AREA)
- Biophysics (AREA)
- Pathology (AREA)
- Biomedical Technology (AREA)
- Hematology (AREA)
- Medical Informatics (AREA)
- Molecular Biology (AREA)
- Surgery (AREA)
- Animal Behavior & Ethology (AREA)
- Public Health (AREA)
- Veterinary Medicine (AREA)
- Magnetic Resonance Imaging Apparatus (AREA)
Description
- Magnetic resonance imaging (MRI) relies on the relaxation properties of excited hydrogen nuclei in water and lipids to create images. When the target object to be imaged is placed in a uniform magnetic field, the forces in the magnetic field cause the spins of atomic nuclei having a non-zero spin to align in a particular manner with the applied magnetic field. By way of example, hydrogen atoms have a simple spin (1/2) and therefore align either parallel or anti-parallel to the magnetic field. A radio frequency pulse (RF) is then applied in a direction perpendicular to the magnetic field and removed. When the RF signal is removed, the atomic nuclei relax. During the relaxation process, the nuclei release energy by emitting an RF signal unique to the nuclei, which may be measured by a conductive field coil placed around the target object. This measurement is processed or reconstructed to obtain the magnetic resonance images.
- The signal intensity of a given tissue type depends upon the density of the protons in the tissue. However, the contrast of the image also depends on two other tissue-specific parameters: the longitudinal relaxation time (T1) and the transverse relaxation time (T2). T1 defines the time required for the displaced nuclei to return to equilibrium, that is to say, the time required for the nuclei to realign themselves in the magnetic field. T2 is the time required for the signal emitted by a specific tissue type to decay.
- Image contrast is created by using a selection of image acquisition parameters that weights signals by T1, T2 or T2*, or no relaxation time, which are known in the art as proton density images. For example, in the brain, T1-weighting causes the nerve connections of white matter to appear white, and the congregations of neurons of gray matter to appear gray. Cerebrospinal fluid appears dark.
- Dynamic Susceptibility Contrast (DSC) MRI and Dynamic Contrast Enhanced (DCE) MRI are two minimally-invasive imaging techniques frequently employed to probe the angiogenic activity of brain neoplasms based on estimates of vascularity and vascular permeability. Contrast agents may be used to enhance tissue contrast in MRI images by inducing susceptibility contrast effects when injected. Most commonly, a paramagnetic contrast agent, typically a gadolinium compound is employed for this purpose; although, as will be discussed in greater detail below, several different contrast agents may also be used. Gadolinium-enhanced tissues and fluids appear extremely bright in T1-weighted images, thereby providing high contrast sensitivity which facilitates the detection of vascular issues (tumors) and permits assessment of brain perfusion, such as that which occurs following a stroke. Cerebral blood volume (CBV) and cerebral blood flow (CBF) can be measured, and other hemodynamic and vascular parameters can be derived from these measurements. However, a significant problem associated with the use of gadolinium-based contrast agents is that they leave or leak from the blood vessels. This leakage results in undesirable T1 and T2 relaxation effects that confound the measurement of perfusion.
- Efforts to correct contrast leakage effects on measurements for rCBV are discussed in
U. S. Patent No. 6,807,441 B2 issued on October 19, 2004 , and in U. S. Patent Application Publication No.US2006/0034765 A1 published on February 16, 2006 . These disclosures entail the use of gradient-echo and spin-echo NMR signals and either a ΔR2 weighing ratio or the T2* and T2 relaxation rates to measure tumor angiogenesis. - However, the results of both DSC- and DCE-MRI may be confounded by the opposing effects of gadolinium. While necessary for the DCE-MRI technique, the shift in compartmental distribution of the contrast agent from the intravascular space to the EES results in T1 shortening effects that compete with the susceptibility-induced signal dropout, which can confound DSC-MRI signal time courses. The most well characterized DSC-MRI parameter affected by T1 leakage effects is rCBV.
- Accordingly, a need exists for a method of measure and assessing the hemodynamic properties of a tumor where extravasation of a contrast agent is present, not only in brain tumors where the blood-brain barrier may be disrupted by disease, but also in tumors present in other parts of the body where extravasation may be present.
- A paper entitled "Compensation of Confounding T1 and T2 Dipolar and Residual Susceptibility Effects in DSC-MRI using Dual-Echo SPIRAL" authored by E S Paulson et al (Proceedings of the International Society for Magnetic Resonance in Medicine, Joint Annual meeting ISMRM-ESMRMB, Berlin, Germany, 19-25 May 2007, 5 May 2007(2007-05-05), page 2811, XP55019564) describes a method for producing an image with a magnetic resonance imaging system using Gadodiamide as a contrast agent, and which provides for correction of leakage effects in the measurement of relative cerebral blood volume (rCBV). A further paper referenced in this paper and entitled "Quantitative assessment of tumor perfusion and Ktrans using dual-echo DSC-MRI signals compensated for extravascular tissue T1 and T2 relaxation" authored by C C Quarles et al (Proceedings of the International Society for Magnetic Resonance in Medicine, 13th Scientific Meeting and Exhibition, Miami Beach, Florida, USA, 7-13 May 2005, 23 April 2005 (2005-04-23), Page 2099, XP55019567) outlines a method for calculation of volume transfer constant Ktrans and EES volume fraction ve.
- The present invention addresses the afore-mentioned and other problems by providing a new and useful MRI methodology which uses a combination of dual-echo acquisition and SPIRAL acquisition to eliminate T1 leakage effects and post-processing algorithms to eliminate T2/T2* effects resulting from contrast agent leakage, thereby permitting accurate and robust measures of blood volume and flow, as well as vascular permeability. Moreover, tissue perfusion outside of the brain, such as in and around cancers of the breast, prostate, and musculoskeletal system may be measured. Organ perfusion may also be measured in other normal and disease states as well, including but not limited to organ transplants, sickle cell disease and diabetes. The technique herein disclosed may also be applied to studies related to the development and testing of drugs and may preclude the need for a loading dose of Gd contrast agent, thus decreasing the cumulative dose needed for each patient's study.
- The methodology of the present invention permits the calculation of vascular permeability using well-known T1-based modeling algorithms. No other technology enables the collection of both T2/T2* perfusion data and T1-based permeability data at the same time.
-
-
Figure 1(a) is an example of a single shot, dual echo, spiral out MRI pulse sequence that can be used in an embodiment of the invention, wherein the pulse sequence as such is outside the scope of the invention; -
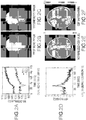
Figures 1(b) and 1(c) are echo images of a brain tumor that were reconstructed from MRI data acquired using the pulse sequence shown inFig. 1(a) ; -
Figures 2(a) - (I) are examples of dual-echo correction of DSC-MRI data and corresponding images of a brain; -
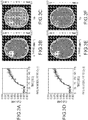
Figures 3(a) - (h) illustrate dual-echo correction of DCE-MRI data; -
Figures 4(a) and (b) illustrate the confounding effects of T2* on signals used to generate DCE-MRI data; -
Figures 5(a) - (c) illustrate the effects of So estimates on DCE-MRI tissue concentration time curves; and -
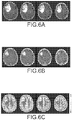
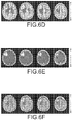
Figure 6 illustrates various perfusion and permeability parameter maps for a brain tumor. - Dynamic Susceptibility Contrast (DSC) MRI and Dynamic Contrast Enhanced (DCE) MRI are two minimally invasive imaging techniques frequently employed to probe the angiogenic activity of brain neoplasms based on estimates of vascularity and vascular permeability. It is well known that gadolinium produces simultaneous T1, T2, and T2* shortening effects in tissue, and these properties are uniquely exploited in DSC- and DCE-MRI. However; several different MRI contrast agents are capable of inducing susceptibility contrast effects when injected. Therefore, several different contrast agents can be used in conjunction with the described invention. Most commonly, paramagnetic agents such as Gd (gadolinium)-chelated contrast agents are used. When Gd(III)-chelated agents are injected quickly, under bolus-like conditions, they induce susceptibility contrast in tissues, notable as a transient decrease in a T2 or T2*-weighted MRI signal. Alternatively, another category of contrast agents can be used. These agents are superparamagnetic iron-oxide contrast agents, such as MION (monocrystalline iron oxide nanoparticles), or USPIO (ultra-small polycrystalline nanoparticles). These agents can also cause the necessary susceptibility contrast for this invention.
- In DSC-MRI, a concentrated bolus of gadolinium, confined to the intravascular space and flowing through a tissue capillary bed, induces transient signal loss through spin dephasing caused by vascular-extravascular susceptibility gradients. So long as recirculation effects are eliminated, analysis of DSC-MRI data, using indicator dilution theory provides hemodynamic estimates of relative cerebral blood volume (rCBV), cerebral blood flow (CBF), and mean transit time (MTT). In DCE-MRI, contrast agent extravasation, arising from disruptions of the blood-brain barrier, gives rise to signal enhancement through dipolar interaction between gadolinium's unpaired electrons and local tissue protons. Pharmacokinetic analysis of DCE-MRI data provides insight into the underlying tissue pathophysiology, through estimation of the blood-brain volume transfer constant (Ktrans), fractional extravascular, extracellular space (EES) volume (Ve), and the efflux rate constant from EES to plasma (Kep).
- Dual-echo MRI acquisition methods offer a robust alternative to single-echo acquisitions following loading doses when collecting DSC-MRI data, in brain tumor patients. According to an embodiment of the present invention, it has been demonstrated that brain tumor vascularity and vascular permeability parameters, corrected for confounding contrast agent leakage and recirculation effects, can be obtained simultaneously with a dual-echo acquisition using a standard dose of contrast agent. There are several differences between the method herein disclosed and previous prior art methods. First, in addition to correcting DSC-MRI parameters for T1 leakage effects, both DSC- and DCE-MRI parameters are corrected for residual susceptibility effects and T1/T2* effects arising from contrast agent recirculation and leakage. A formalism for the correction of both DSC- and DCE-MRI parameters in accordance with the present invention is presented in the Appendices. Second, the method herein disclosed facilitates estimation of corrected DSC- and DCE-MRI parameters using conventional algorithms found in the literature. Third, a pre-load or loading dose of contrast agent is no longer required to estimate DSC-MRI parameters in regions of tumor. Fourth, pre-contrast S0 and T1 calibration scans, traditionally required for DCE-MRI analysis, have been eliminated. Finally, a spiral approach, which encodes two echoes simultaneously is employed for the dual-echo acquisition.
- Images were acquired on a 1.5T GE CV scanner (GE Healthcare, Milwaukee, Wisconsin), running software version 12.0, equipped with 40 mT/m gradients (150 T/m/s slew rate), and using a, commercial quadrature RF coil. The basic system configuration and operation are disclosed in the '441 patent and '765 publication cited above. Pre-contrast FLAIR, DWI, T1, and T2 images were collected as part of the standard clinical protocol. Perfusion-weighted images were then acquired using a custom, single-shot, dual-echo, FID spiral-out sequence with the following parameters: FOV=22 cm2, matrix=962. TE2=2.6 msec, TE2=41 msec, TR=1350 msec, θ=72 degrees, slice thickness=5 mm, skip=1.5 mm, number of slices= 13, number of samples (reps)= 180. A 30 second delay was inserted between prescan and the beginning of the dual-echo acquisition to allow full recovery of longitudinal magnetization. This facilitated estimation of the equilibrium magnetization from the first time point of the dual-echo acquisition and eliminated the necessity of collecting a separate pre-contrast calibration scan (see Appendix B). A standard dose of Gadodiamide (0.1 mmol/kg, Omniscan) was injected at 3 mL/sec using a power injector 60 seconds after the start of acquisition. Post-contrast T1W images were then acquired as part of the standard clinical protocol.
- As shown in
Figure 1a , the pulse sequence acquired two echoes sequentially within a free induction decay (FID) immediately following a spatial-spectral excitation pulse, which was used to reduce the chemical shift influence on off resonance effects through selective excitation of water. Steady-state signal incoherency was established by applying a killer pulse to spoil the transverse magnetization before acquisition of each subsequent shot. To reduce nonlinearities resulting from gradient warming, the killer was applied along the slice select axis, since this axis had the lowest gradient duty cycle. - The Ernst angle (72 degrees) was chosen to maximize the signal-to-noise ratio of the dual-echo acquisition in an effort to prevent the second-echo signal, particularly in large vessels, from saturating at the rectified noise floor during the first pass of the bolus. Saturation of the signal can result in nonlinearities in the relationship between signal changes and contrast agent concentration, which can introduce error in the estimate of the arterial input function.
- The spiral gradient waveforms were implemented using the Glover approach, as is known in the art. Although reversed spiral readouts would have produced better edge definition, the spiral-out direction was chosen to increase the signal to noise ratio SNR, and minimize the TE of the first echo in order to maximize T1 weighting for DCE-MRI parameter estimation. For a 96x96 matrix, the spiral waveforms consisted of 3892 points corresponding to a readout duration of approximately 38 msec. Although insignificant for single-shot spiral, hysteresis correction gradients were implemented to reduce artifacts associated with gradient amplifier current monitor hysteresis. In dual-echo acquisitions, the first echo readout results in an apparent diffusion weighting for the second echo. The amount of diffusion weighting is characterized by the b-value, calculated using:

- The raw spiral data was transferred to a remote Linux workstation (quad AMD dual-core 2.4 GHz CPUs, 16GB RAM,
SUSE 1 0.3) and reconstructed offline using custom Matlab (Version 7.5. R2007b, The MathWorks, Inc.) software. Sample reconstructed spiral images from the first- and second echoes are displayed inFigures 1b-c . - Simple algebraic derivations for DSC-MRI concentration-time curves without and with correction for confounding leakage effects can be found in Appendix A. For comparison of the new and novel method of the instant invention to conventional methods, three versions of ΔR2*(t) concentration-time curves were generated and used in the analysis: 1) ΔR2*(t) generated using the second-echo signal of the dual-echo acquisition (equation 19), 2) ΔR2*(t) generated using the ratio of the dual-echo signals (equation 34), and 3) ΔR2*(t) generated using the ratio of the dual-echo signals and corrected for recirculation and any additional T2/T2* leakage effects (equation 36). After truncating the ΔR2*(t) curves to remove signal transients during the approach to steady-state, DSC-MRI parameters were estimated using conventional DSC-MRI algorithms. The arterial input function (AIF) was generated by averaging the ΔR2*(t) time courses from three voxels manually selected in regions of the middle cerebral arteries. Estimates of rCBV were obtained using:


- Simple algebraic derivations for DCE-MRI concentration-time curves without and with correction for confounding T2* recirculation effects can be found in Appendix B. For comparison of the invention method to conventional methods, two versions of ΔR1(t) concentration-time curves were generated and used in the analysis: 1) ΔR1(t) generated using the first echo signal of the dual-echo acquisition (equation 54), and 2) ΔR1(t) generated by extrapolating the first-echo back to TE=O using the dual-echo signals (equation 85). The ΔR1(t) curves were then converted into tissue concentration-time curves, CT(t), using equation 37:




- The methodology and results of correcting DSC-MRI concentration-time curves for confounding recirculation and leakage effects are demonstrated in
Figure 2 .Figure 2a displays the dual-echo time series for the representative tumor voxel depicted on the first and second echo spiral images shown inFigures 2b-c . Note that the signals have been truncated to remove the first few points during which the signal approached steady-state. Extravasation of contrast agent is apparent from the increase in signal intensity demonstrated on both the first and second echo signals. By comparing the dual-echo signals, note that leakage of contrast agent begins at the appearance time of the bolus, occurs during the first pass of the bolus, and continues after the first pass of the bolus. -
Figures 2d-f display the ΔR2*(t) curve (for the same tumor voxel) obtained from the second-echo signal only (equation 19), along with corresponding rCBV and CBF maps. Note that the curve in 2d is confounded by T1 leakage effects, which causes the post-bolus ΔR2*(t) to fall below the pre-bolus baseline and results in an underestimation of rCBV. This effect is apparent by a lack of blood volume inFigure 2e , which is exacerbated in regions of tumor. -
Figures 2g-i display the ΔR2*(t) curve (for the same tumor voxel) obtained from the ratio of the dual-echo signals (equation 34), along with corresponding rCBV and CBF maps. By using the ratio of the dual-echo signals when constructing ΔR2*(t), confounding T1 effects are eliminated, resulting in an increased peak height of ΔR2*(t) relative to 2d and the unmasking of the recirculation and T2/T2* leakage effects (evident from the elevated post-bolus baseline). While correction for T1 effects prevents the underestimation of rCRV, an overestimation of rCBV can result from recirculation and any residual susceptibility or dipolar T2 leakage effects. -
Figures 2j-l display representative ΔR2*(t)' (red) and ΔR2*(t) (blue) curves obtained usingequations 35 and 36, along with corresponding rCBV and CBF maps from equation 36. Note that, after this correction, the blue curve shown inFigure 2j and rCBV and CBF maps inFigures 2k-l are no longer confounded by recirculation nor any dipolar T1 and T2 and/or residual susceptibility leakage effects. This results in lower rCBV values seen inFigure 2k relative toFigure 2h , most notably in tumor, a result more representative of the true blood volume. - The results of extrapolating the first-echo signal back to TE=O to correct DCE-MRI concentration-time curves for confounding recirculation and T2/T2* leakage effects is demonstrated in
Figure 3 (a-c), the first echo of the dual-echo time series with corresponding Ktrans, and vp, parameter maps; (d-f), the corrected first-echo time series with corresponding Ktrans and vp parameter maps; ΔR2*(t), tissue concentration-time curves, and nonlinear least squares fits of the Patlak model for the conventional and proposed approaches of estimating ΔR1(t). -
Figure 4 demonstrates the effect of correcting DCE-MRI time series for T2/T2* effects.Figure 4a displays the first, corrected first, and second echo signals for a voxel in an artery. A concentrated bolus of gadolinium produces a transient signal decrease in both the first and second echo signals during the first pass. The fact that a transient signal decrease is observed in the first (strongly T1W) signal demonstrates the potentially confounding effects of T2/T2* on DCE-MRI signals, which are recovered in the corrected signal by using the dual echo signals to extrapolate the first echo signal back to TE=O. This suggests that, even through DCE-MRI data is strongly T1-weighted, arterial input functions may be confounded by T2* effects during the first pass of the bolus and should not be neglected. In addition, residual susceptibility effects due to recirculation, evident from the post-bolus portion of the second echo signal remaining below its pre-bolus baseline, are also recovered in the corrected signal. However, it is unlikely that residual susceptibility effects would affect DCE-MRI tissue concentration-time curves due to strong T1 masking effect of the contrast agent.Figure 4b displays the first, corrected first, and second echo signals for a voxel in tumor. Correction for T2/T2* effects results in a slight increase in the rate of signal enhancement. This suggests that heuristic analysis of DCE-MRI data, based on signal characteristics, could be affected by T2* effects. -
Figure 5 demonstrates the influence of S0 on DCE-MRI concentration-time curves calculated using equations 54 and 85. Tissue concentration-time curves generated using an underestimated value of S0 exhibit amplified noise when the increased signal intensity approaches the value of S0 (Figure 5b ). This effect can be caused by not waiting long enough for full recovery of longitudinal magnetization between prescan and beginning acquisition. Allowing full recovery of longitudinal magnetization prevents noise amplification and produces a concentration-time curve profile (Figure 5c ) that matches the signal time course (Figure 5a ). -
Figure 6 displays conventional images along with perfusion and permeability parameter maps obtained with the proposed method used for diagnosis of a brain tumor patient: (a) pre-contrast FLAIR, (b) post-contrast T1, (c) rCBV, (d) CBF, (e) Ktrans, (f) vp. Using the method of the present invention, one injection of a standard dose of gadolinium permits calculation of perfusion and permeability parameters corrected for confounding leakage and residual susceptibility effects. Perfusion parameters (i.e., rCBV and CBF) have been corrected for dipolar T1 and T2 leakage and residual susceptibility effects. Permeability parameters (i.e., Ktrans and vp) have been corrected for dipolar T2 and residual susceptibility effects. - The new and novel method of the instant invention permits simultaneous estimation of DSC- and DCE-MRI parameters from a single acquisition using a standard dose of contrast agent. Perfusion and permeability parameters are estimated using conventional algorithms and have been corrected for confounding recirculation effects as well as any additional dipolar or residual susceptibility leakage effects. In the context of clinical utility, the disclosed method presents several significant advantages, including:
- Reduced total dose of contrast agent. Using the method of the present invention, only a single dose of contrast agent is required to obtain both DSC- and DCE-MRI parameters. Traditionally, estimation of vascularity and vascular permeability required multiple injections of contrast agent. For example, a fairly common approach is to inject a loading dose of contrast agent prior to DSC-MRI acquisition to pre-hance EES tissue thus diminishing confounding T1 leakage effects. In accordance with the present invention, loading doses are no longer required to achieve robust estimates of perfusion parameters in regions of BBB disruptions. Furthermore, minimizing the total dose of contrast agent reduces the risk of developing side effects associated with the contrast agent, including nausea, vomiting, and nephrogenic systemic fibrosis (NSF).
- Reduced total acquisition time. This invention facilitates estimation of both DSC- and DCE-MRI parameters in a single acquisition. Traditionally, these parameters were obtained separately using independent acquisitions. Furthermore, separate pre-contrast So and T1 calibration scans were required for DCE-MRI analysis. The method herein disclosed provides an alternative approach for estimating ΔR1(t) curves for DCE-MRI. Rather than using the difference between the dynamic signal and its pre-contrast baseline (as commonly done to eliminate the signal from unsuppressed fat), it estimates ΔR1(t) directly from the relaxivity equation, requiring only an estimate of S0. Using this approach, a pre-contrast T1 map is not required. In addition, S0 can be estimated internally using the first time point of the single-shot, dual-echo acquisition. By reducing total scan time, increased patient throughput can be achieved.
- Improved accuracy of perfusion and permeability estimates while maintaining good, normal brain-to tumor contrast T1 and T2 leakage and residual susceptibility effects confound DSC-MRI parameters. Dual-echo acquisitions allows for estimation of T2* effects directly from the signal equations, which can then be used to extrapolate the DCE signal back to TE=0, thus eliminating the influence of T2 or T2* effects on the dynamic time series. Note that the novel methodology permits both heuristic and pharmacokinetic analysis of DCE-MRI data. Moreover, by correcting for recirculation effects, the accuracy of both DCE approaches should be improved. By correcting for recirculation, errors in the AIF for DCE should be improved. The shorter TR achieved improves temporal resolution, corresponding to better sampling for ATF selection.
- DSC and DCE-MRI parameters can be estimated using conventional algorithms. In accordance with the present invention, exotic models are not required to estimate DSC- and DCE-MRI parameters simultaneously. Although the Patlak model was used for pharmacokinetic analysis, other DCE-MRI models could be readily applied.
- The spiral-based dual-echo approach described herein offers some important advantages for perfusion imaging. While previous methods for simultaneously acquiring dual echo time courses have relied on keyhole acquisitions or segmented echo-planar imaging, spiral reduces readout times by eliminating the filling of unused data in the corners of k-space and, consequently, permits an increased slice number, increased resolution, or shorter TR capabilities. The shorter readout duration reduces resolution loss due to T2* decay, which diminishes vessel blooming. Specific to DCE-MRI, because the readout starts in the center of k-space, spirals can achieve very short minimum echo times, producing images with good T1 weighting. Second, by starting at the center of k-space, spiral is gradient moment compensated to all orders, which diminishes flow displacement artifacts.
- The major disadvantage of spiral is off-resonance induced blurring, which is exacerbated by the time duration of the spiral readout. Off-resonance effects arise from chemical shift differences (i.e., fat and water resonant frequency difference), field inhomogeneity effects, and local static susceptibility differences. Selective excitation of water using spatial-spectral excitation pulses reduces the chemical shift influence of blurring. Reduction of field inhomogeneity effects is accomplished by good shimming and application of off resonance correction algorithms. Several of these algorithms require estimation of field maps which can be easily incorporated into the dual-echo acquisition. Incorporation of parallel imaging (e.g., spiral SENSE) would provide substantial benefits for the single-shot dual-echo spiral acquisition herein described. Parallel imaging would facilitate the ability to acquire higher increased number of slices within a given TR or additional echoes. Most importantly, by reducing the length of the spiral readout with parallel imaging, off resonance and susceptibility effects would be reduced. This would greatly improve data, quality in regions of static susceptibility differences, such as resection cavities.
- Although the present invention does not require estimation of a precontrast T1 map, there is a dependence on the signal-to-noise ratio and number of precontrast baseline points sampled in the DCE acquisition. Poor signal-to-noise ratio and a small number of pre-contrast baseline points could affect the accuracy of the baseline signal estimate, and thus, initial T1 estimate. However, errors associated with determining precontrast T1 from a separate calibration scan could also propogate into estimation of ΔR1. A flip angle of 72 degrees (the Ernst angle) was used in an embodiment to maximize signal-to-noise ratio, and 60 baseline points were acquired. Both of these factors were selected to improve the accuracy of the precontrast baseline signal intensity.
- The method of the instant invention allows simultaneous estimation of DSC- and DCE-MRI in one acquisition, using a single dose of contrast agent. Conventional algorithms are used to obtain the perfusion and permeability parameters corrected for recirculation and leakage effects. This method does not require administration of a loading dose of contrast agent, and pre-contrast spin density and native T1 calibration scans (traditionally required for DCE) have been eliminated, resulting in a superior technique performing DSC- and DCE-MRI studies in brain tumors.
- The concentration-time curves in DSC-MRI are generated based on an assumed linear relationship between gadolinium concentration and the change in apparent transverse relaxation rate induced by first passage of the contrast agent through the vasculature:


- In order to determine the change in apparent transverse relaxation rate (i.e., ΔR2*(t)) an estimate of the pre-contrast apparent transverse relaxation rate (i.e., T20*) must be obtained. This is achieved in two steps. First, the pre-contrast baseline signal. SB, is determined by averaging S(t) over the first NB baseline points:

- Note that because the contrast agent has not yet been administered, constant initial values of T10 and T20 are used in the expression. Second, the result of equation 12 is solved for 1/T20*, which yields:

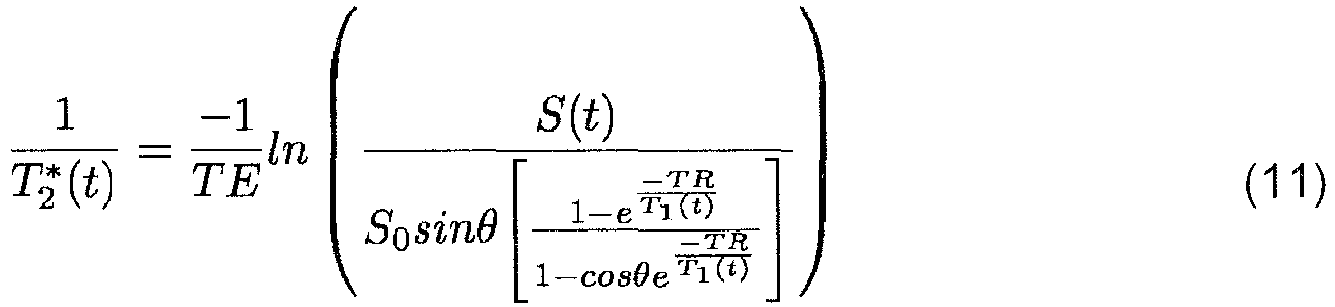
- Substituting the results of equations 11 and 13 into equation 9:


- Equation 18 demonstrates the potential influence of dipolar T1 effects on concentration-time curves obtained with DSC-MRI. In the presence of an intact BBB, the contrast agent remains confined to the vasculature (i.e., no extravasation occurs). T1(t) is reduced to T10* (i.e., its pre-contrast value), and ΔR2*(t) reduces to its usual form:

- Dual-echo acquisition methods provide an effective means by which confounding dipolar T1 leakage effects can be eliminated from DSC-MRI time courses. The signal equations for the first and second echoes are:


- Solving for 1/T2*(t) using the ration of the two signal equations yields:


- Again, the pre-contrast apparent transverse relaxation rate (i.e., 1/T20*) must be estimated in order to determine the change in apparent transverse relaxation rate. The first step is to average the signals over the first NB baseline points:


- Because contrast agent has not yet been administered, constant initial values of T10* and T20* are used in the expressions. Solving for I/T20* using the ratio of the baseline signals yields:

- Substituting the results of equations 27 and 30 into equation 9, the following relationship is obtained:


- Equation 34 is the DSC-MRI concentration-time curve free from dipolar T1 leakage effects. In practice, another potential confounding effect on DSC concentration-time curves characterized as elevated endlines that develop after the first pass of contrast agent has been observed. The effect seems to be exacerbated in tumors relative to normal brain, which implies that there could be a susceptibility or T2 leakage effect in these regions in addition to recirculation. The source of the elevated endlines could therefore be due to dipolar T2 effects, residual susceptibility effects from the contrast agent, or some combination of both. Correction for these effects is performed by non-linear least squares fitting of a model to the corrupted ΔR2*(t) concentration-time curves that accounts for both the first pass and recirculation:


- Conventional algorithms can then be applied to generate estimates of DSC-MRI parameters free from confounding contrast agent effects using equation 36.
- The concentration-time curves in DCE-MRI are generated based on an assumed linear relationship between gadolinium concentration and the change in spinlattice relaxation rate induced by extravasation of the contrast agent from the vasculature to the extracellular, extravascular space, where dipolar interaction between the unpaired electrons of the contrast agent and local tissue protons ensues:

- The DCE-MRI technique relies on the sensitivity of the pulse sequence to changes in signal intensity caused by T1 shortening. Traditionally, conventional 2D or 3D spoiled gradient echo sequences are often used in DCE-MRI because they provide good image quality with sufficient temporal resolution. Analogous to DSC-MRI, the generalized signal equation for DCE-MRI is then equivalent to that in equation 10.
- Several methods have been used in the literature to convert the dynamic signal intensity time courses into tissue gadolinium concentration-time curves. In the method used here (which is similar to the Hittmair approach). 1/T1(t) and 1/T10 are obtained directly by solving the pre- and post-contrast signal equations and the results, along with equation 37, are used to determine the ΔR1(t). To begin, equation 10 is solved for 1/T1(t):






- In order to determine the change in spin lattice relaxation rate (i.e., ΔR1(t)), an estimate of the pre-contrast spin lattice relaxation rate (i.e., T10) must be obtained. This is achieved in two steps. First, the pre-contrast baseline signal, SB, is determined by averaging S(t) over the first NB baseline points:

- Note that because the contrast agent has not yet been administered, constant initial values of T10 and 1/T10 are used in the expression. Second, the result of equation 48 is then solved for 1/T10), which yields:

- Substituting equations 47 and 49 into equation 37:


- Equation 53 demonstrates the potential influence of T2* effects on concentration-time curves obtained with DCE-MRI. Since minimum echo times are used in DCE-MRI to obtain good T1 weighting, it is widely assumed that insignificant phase dispersion will occur over time scales of short TE (i.e., TE << T2*). Consequently, T2* effects are generally ignored, which results in the following approximation:

- Equation 54 does not exhibit a dependence on the initial pre-contrast spin lattice relaxation time (i.e., T10), which eliminates the requirement of having to acquire a separate pre-contrast calibration scan. Instead, T10 is determined directly from the pre-contrast baseline signal intensity. In addition, notice that ΔR1(t) can be estimated directly from S(t), provided that an estimate of S0 be obtained.
- Assuming fully relaxed spins, S0 can be estimated from a single-shot, single repetition (i.e., infinite TR), dual-echo scan. In the limit that TR → ∞ (which is valid for a single repetition), the signal equations for the first and second echoes (i.e.. equations 20 and 21) reduce to:


- Using the same methodology that was used to generate
equation 30, 1/T20** is estimated as:
- Substituting equation 57 into equation 55 and rearranging. S0 is estimated as:


- Note that if a 90 degree flip angle is used the sine term in the denominator vanishes. The estimate of S0 is then substituted into equation 54 to yield the change in spin lattice relaxation rate, which is then used to determine the concentration-time curves using equation 37.
- Dual-echo acquisitions offer two significant advantages for DCE-MR1. One advantage is that, assuming spins had fully relaxed prior to beginning the scan, S0 can be determined from the first time point (i.e.. first repetition) of a single-shot. dual-echo acquisition using the methodology described in equations 55-65. This factor results in a significant time savings in that no additional pre-contrast calibration scans are required to convert the DCE-MRI signal time courses into concentration-time curves.
- The second advantage of dual-echo acquisitions is that confounding T2* effects can be eliminated from the DCE concentration-time curves. This is performed in a two-step process. First, 1/ T2*(t) is estimated at each time point from the first and second echo signal equations (i.e., equations 20 and 21) using the same methodology to that used to generate equation 27. Second, a corrected first echo signal, STE1c(t) is obtained by extrapolating each time point of the first echo signal in equation 20 back to TE=O using:

- Substituting equations 20 and 27 into equation 66:


- Notice that T2* effects have been eliminated in the corrected signal equation. Solving equation 69 for 1/T1(t) yields:


- In order to determine the change in spin lattice relaxation rate (i.e. ΔR1(t)), an estimate of the pre-contrast spin lattice relaxation rate (i.e., T10) must be obtained. This is achieved in two steps. First, the corrected pre-contrast baseline signal, SBC, is determined by averaging STE1c(t) over the first NB baseline points:

- Note that because the contrast agent has not yet been administered, constant initial values of T10, and 1/ T20* are used in the expression. Second, equation 80 is then solved for 1/T10, which yields:

- Substituting equations 79 and 81 into equation 37:


- Equation 85 is the ΔR1(t) curve corrected for confounding T2* effects. An estimate of S0, determined from the first time point of the single-shot, dual-echo acquisition, is then substituted into equation 85 to yield the change in spin lattice relaxation rate, which is then used to determine the concentration-time curves using equation 37.
- Changes may be made in the above methodology without departing from the scope of the invention as defined by the claims.
Claims (8)
- A method for producing an image of an organ or tissue of a subject with a magnetic resonance imaging (MRI) system comprising the steps of:a) injecting a contrast agent into a blood vessel of the subject which induces a differential between the susceptibilities of the blood vessel and the tissue of interest;b) acquiring MRI image data sets during a first passage of the contrast agent through the tissue of interest using an imaging sequence adapted to collect image data at both short and long echo times (TE);c) computing image maps of relative cerebral blood volume (rCBV) from data in the acquired MRI image data sets;d) computing image maps of absolute cerebral blood volume (CBV), cerebral blood flow (CBF) and mean transit time (MTT) from data in the acquired image data sets;e) correcting the rCBV, CBV, CBF and MTT image maps for variations to T1, T2 and T2* relaxation rates caused by contrast agent extravasation or recirculation, wherein the correcting of the rCBV image maps includes computing the T2* relaxation rate R2*(t) at each time point from the image data signals collected at the short and long echo times; fitting a model to the R2*(t) data to account for confounding modifications to T2 or T2*; and selecting an arterial input function (AIF) from the R2*(t) data, or wherein, if step b) comprises the acquisition of T2-weighted spin echo MRI signals, the correcting of the rCBV image maps includes computing the T2 relaxation rate R2(t) at each time point from the image data signals collected at the short and long echo times, fitting a model to the R2(t) data to account for the confounding modifications to T2 and selecting an arterial input function (AIF) from the R2(t) data;f) creating T1-weighted DCE parameter maps for preselected DCE permeability parameters from the short echo time (TE) data, wherein a DCE concentration-time curve is derived from data in the acquired image data sets, wherein a two-step process for eliminating confounding T2* effects from the DCE concentration-time curve is performed, wherein, in a first step, 1/T2*(t) is estimated at each time point from short and long TE echo data and wherein, in a second step, a corrected short TE echo signal is obtained by extrapolating each time point of the short TE echo signal back to TE=0, and wherein a change in a spin lattice relaxation rate ΔR1(t) curve corrected for confounding T2* effects is calculated from the corrected short TE echo signal using an estimate of a pre-contrast spin lattice relaxation rate obtained from a corrected pre-contrast baseline signal and an estimate of a baseline signal determined from a first time point of the collected image data at short and long echo times, the change in the spin lattice relaxation rate ΔR1(t) curve then being used to determine the DCE concentration time curve;g) computing image maps that provide measures of tissue recirculation, tissue leakage volumes, cellular volumes and cellular density.
- The method of claim 1, wherein step b) comprises the acquisition of spin echo, i.e. T2-weighted, MRI signals.
- The method of claim 1 or 2, wherein the preselected permeability parameters of step f) include the blood-brain volume transfer constant Ktrans, the fractional extravascular, extracellular space volume ve and the fractional volume of the plasma space vp.
- The method of claim 1 or 2, wherein the pulse sequence is a spiral imaging sequence.
- The method of claim 1 or 2, wherein the pulse sequence is an echo planar imaging (EPI) sequence.
- The method of claim 1 or 2, wherein step b) includes parallel image data acquisition methods.
- The method of claim 1, wherein step b) comprises the acquisition of gradient echo, i.e. T2*-weighted, MRI signals.
- The method of claim 1 or 2, wherein the contrast agent of step a) is selected from a group consisting of Gadolinium-chelated contrast agents and superparamagnetic iron-oxide contrast agents.
Applications Claiming Priority (2)
| Application Number | Priority Date | Filing Date | Title |
|---|---|---|---|
| US93953907P | 2007-05-22 | 2007-05-22 | |
| PCT/US2008/064597 WO2008147921A1 (en) | 2007-05-22 | 2008-05-22 | Multiparameter perfusion imaging with leakage correction |
Publications (3)
| Publication Number | Publication Date |
|---|---|
| EP2157912A1 EP2157912A1 (en) | 2010-03-03 |
| EP2157912A4 EP2157912A4 (en) | 2012-03-28 |
| EP2157912B1 true EP2157912B1 (en) | 2021-07-07 |
Family
ID=40075497
Family Applications (1)
| Application Number | Title | Priority Date | Filing Date |
|---|---|---|---|
| EP08769657.1A Active EP2157912B1 (en) | 2007-05-22 | 2008-05-22 | Multiparameter perfusion imaging with leakage correction |
Country Status (3)
| Country | Link |
|---|---|
| US (1) | US8670602B2 (en) |
| EP (1) | EP2157912B1 (en) |
| WO (1) | WO2008147921A1 (en) |
Families Citing this family (38)
| Publication number | Priority date | Publication date | Assignee | Title |
|---|---|---|---|---|
| US8046044B2 (en) * | 2004-08-25 | 2011-10-25 | Washington University | Method and apparatus for acquiring overlapped medical image slices |
| US9788771B2 (en) | 2006-10-23 | 2017-10-17 | Abbott Diabetes Care Inc. | Variable speed sensor insertion devices and methods of use |
| US8085044B2 (en) * | 2008-08-20 | 2011-12-27 | The General Hospital Corporation | Method for producing spectral-spatial parallel RF excitation pulses for magnetic resonance imaging |
| US9402544B2 (en) | 2009-02-03 | 2016-08-02 | Abbott Diabetes Care Inc. | Analyte sensor and apparatus for insertion of the sensor |
| US9232907B2 (en) * | 2009-04-03 | 2016-01-12 | New York University | System, method and computer-accessible medium for utilizing cardiac output to improve measurement of tracer input function in dynamic contrast-enhanced magnetic resonance imaging |
| CA2766685A1 (en) | 2010-03-24 | 2011-12-29 | Abbott Diabetes Care Inc. | Medical device inserters and processes of inserting and using medical devices |
| US8022703B1 (en) | 2010-05-06 | 2011-09-20 | Kai-Wen Huang | Method for rapid detecting tumor |
| DE102010041450B4 (en) * | 2010-09-27 | 2012-11-08 | Siemens Aktiengesellschaft | Automatic creation of a selectively tissue-type MR image |
| NO20101638A1 (en) * | 2010-11-22 | 2012-05-23 | Sunnmore Mr Klinikk As | Method of ex vivo distinguishing between malignant and benign tumors using contrast agent-based MRI scan |
| JP5877000B2 (en) * | 2011-07-12 | 2016-03-02 | 株式会社根本杏林堂 | MRI equipment |
| GB201117808D0 (en) * | 2011-10-14 | 2011-11-30 | Siemens Medical Solutions | SUV correction following dose infiltration |
| JP6209520B2 (en) | 2011-10-24 | 2017-10-04 | コーニンクレッカ フィリップス エヌ ヴェKoninklijke Philips N.V. | Perfusion imaging |
| WO2013090215A2 (en) | 2011-12-11 | 2013-06-20 | Abbot Diabetes Care Inc. | Analyte sensor devices, connections, and methods |
| US11813100B2 (en) | 2012-01-04 | 2023-11-14 | The Trustees Of Dartmouth College | Methods for quantitative and enhanced-contrast molecular medical imaging using cross-modality correction for differing tracer kinetics |
| EP2879580B1 (en) | 2012-08-06 | 2022-03-02 | Koninklijke Philips N.V. | Dynamic contrast-enhanced imaging based permeability metric |
| US11937951B2 (en) | 2013-02-13 | 2024-03-26 | The Trustees Of Dartmouth College | Method and apparatus for medical imaging using differencing of multiple fluorophores |
| WO2014162246A1 (en) * | 2013-04-03 | 2014-10-09 | Koninklijke Philips N.V. | Determination of physiological parameters of tissue from dynamic contrast-enhanced mr data |
| US10353040B2 (en) | 2013-12-02 | 2019-07-16 | Northwestern University | System and method for acquiring both T2*-weighted and T1-weighted data in a single acquisition using a single dose of contrast agent |
| US10545209B2 (en) | 2013-12-02 | 2020-01-28 | Northwestern University | System and method for acquiring both T2*-weighted and T1-weighted data in a single acquisition using a single dose of contrast agent |
| EP3133994A4 (en) * | 2014-04-24 | 2018-06-20 | Oregon Health & Science University | Contrast reagent leakage correction in dynamic susceptibility contrast magnetic resonance imaging |
| WO2016004061A1 (en) * | 2014-06-30 | 2016-01-07 | University Of Washington | Mri signal supression agents, compositions, and methods |
| US10213139B2 (en) | 2015-05-14 | 2019-02-26 | Abbott Diabetes Care Inc. | Systems, devices, and methods for assembling an applicator and sensor control device |
| AU2016260547B2 (en) | 2015-05-14 | 2020-09-03 | Abbott Diabetes Care Inc. | Compact medical device inserters and related systems and methods |
| US10973433B2 (en) | 2015-08-30 | 2021-04-13 | The Regents Of The University Of California | Leakage correction for DSC-perfusion MRI by accounting for bidirectional contrast agent exchange |
| EP3393357A4 (en) * | 2015-12-21 | 2019-08-28 | The Regents of the University of California | ANGIOGRAPHY OF INFUSION BY DIGITAL SUBTRACTION |
| WO2017182557A1 (en) | 2016-04-21 | 2017-10-26 | Oslo Universitetssykehus Hf | Processing mri data for analysis of tumors |
| US10213178B2 (en) * | 2016-09-22 | 2019-02-26 | Algotec Systems Ltd. | Calculation of perfusion parameters in medical imaging |
| CN115444410B (en) | 2017-01-23 | 2025-08-15 | 雅培糖尿病护理公司 | Applicator and assembly for insertion into an in vivo analyte sensor |
| CN107243093B (en) * | 2017-06-07 | 2020-05-29 | 上海联影医疗科技有限公司 | Method and device for perfusion treatment |
| AU2019282729B2 (en) | 2018-06-07 | 2022-03-17 | Abbott Diabetes Care Inc. | Focused sterilization and sterilized sub-assemblies for analyte monitoring systems |
| US11172903B2 (en) * | 2018-08-01 | 2021-11-16 | Uih America, Inc. | Systems and methods for determining kinetic parameters in dynamic positron emission tomography imaging |
| WO2020131159A1 (en) | 2018-12-21 | 2020-06-25 | Abbott Diabetes Care Inc. | Systems, devices, and methods for analyte sensor insertion |
| WO2021257742A1 (en) * | 2020-06-16 | 2021-12-23 | Cedars-Sinai Medical Center | Systems and methods for mr multitasking-based dynamic imaging for cerebrovascular evaluation |
| CN115942909A (en) | 2020-08-31 | 2023-04-07 | 雅培糖尿病护理公司 | Systems, devices, and methods for analyte sensor insertion |
| JP2023541266A (en) | 2020-09-15 | 2023-09-29 | アボット ダイアベティス ケア インコーポレイテッド | Systems, devices, and methods for analyte sensors |
| ES3000715T3 (en) | 2020-09-15 | 2025-03-03 | Abbott Diabetes Care Inc | Device for analyte monitoring |
| CN113317770B (en) * | 2021-06-09 | 2023-11-24 | 北京汉世医疗科技有限公司 | A dual-contrast perfusion magnetic resonance imaging method and system |
| MY202051A (en) | 2021-07-16 | 2024-03-30 | Abbott Diabetes Care Inc | Systems, devices, and methods for analyte monitoring |
Family Cites Families (6)
| Publication number | Priority date | Publication date | Assignee | Title |
|---|---|---|---|---|
| US6807441B2 (en) * | 2000-05-19 | 2004-10-19 | The Mcw Research Foundation Inc. | Evaluation of tumor angiogenesis using magnetic resonance imaging |
| US20050283053A1 (en) * | 2002-01-30 | 2005-12-22 | Decharms Richard C | Methods for physiological monitoring, training, exercise and regulation |
| US6792302B2 (en) * | 2001-02-21 | 2004-09-14 | Universite De Lausanne | Method and apparatus for determining treatment for stroke |
| JP2007525250A (en) * | 2003-06-02 | 2007-09-06 | ザ・ジェネラル・ホスピタル・コーポレイション | Tissue blood flow delay-compensated calculation method |
| US7567832B2 (en) * | 2004-08-13 | 2009-07-28 | The Mcw Research Foundation | MRI method for measuring tumor hemodynamic parameters in the presence of contrast agent extravasation |
| US8233965B2 (en) * | 2007-03-08 | 2012-07-31 | Oslo Universitetssykehus Hf | Tumor grading from blood volume maps |
-
2008
- 2008-05-22 EP EP08769657.1A patent/EP2157912B1/en active Active
- 2008-05-22 WO PCT/US2008/064597 patent/WO2008147921A1/en not_active Ceased
- 2008-05-22 US US12/601,241 patent/US8670602B2/en not_active Expired - Fee Related
Non-Patent Citations (1)
| Title |
|---|
| None * |
Also Published As
| Publication number | Publication date |
|---|---|
| EP2157912A1 (en) | 2010-03-03 |
| EP2157912A4 (en) | 2012-03-28 |
| US8670602B2 (en) | 2014-03-11 |
| WO2008147921A1 (en) | 2008-12-04 |
| US20100296714A1 (en) | 2010-11-25 |
Similar Documents
| Publication | Publication Date | Title |
|---|---|---|
| US8670602B2 (en) | Multiparameter perfusion imaging with leakage correction | |
| Donato et al. | Liver MRI: From basic protocol to advanced techniques | |
| Paulson et al. | Spiral perfusion imaging with consecutive echoes (SPICE™) for the simultaneous mapping of DSC-and DCE-MRI parameters in brain tumor patients: theory and initial feasibility | |
| Buxton et al. | A general kinetic model for quantitative perfusion imaging with arterial spin labeling | |
| Sharma et al. | Effect of Gd‐DTPA‐BMA on blood and myocardial T1 at 1.5 T and 3T in humans | |
| Lüdemann et al. | Brain tumor perfusion: Comparison of dynamic contrast enhanced magnetic resonance imaging using T1, T2, and T2* contrast, pulsed arterial spin labeling, and H215O positron emission tomography | |
| Çavuşoğlu et al. | Comparison of pulsed arterial spin labeling encoding schemes and absolute perfusion quantification | |
| US8344730B2 (en) | Magnetic resonance imaging apparatus | |
| US8143889B2 (en) | Simultaneous acquisitions of spin- and stimulated-echo planar imaging | |
| Sakaie et al. | Method for improving the accuracy of quantitative cerebral perfusion imaging | |
| Skinner et al. | Evaluation of a multiple spin-and gradient-echo (SAGE) EPI acquisition with SENSE acceleration: applications for perfusion imaging in and outside the brain | |
| EP3325992B1 (en) | Quantitative magnetic resonance imaging of the vasculature | |
| Ma et al. | Cardiac measurement of hyperpolarized 13C metabolites using metabolite‐selective multi‐echo spiral imaging | |
| Jochimsen et al. | Whole-brain mapping of venous vessel size in humans using the hypercapnia-induced BOLD effect | |
| Boss et al. | High resolution MR perfusion imaging of the kidneys at 3 Tesla without administration of contrast media | |
| Domsch et al. | Non-invasive multiparametric qBOLD approach for robust mapping of the oxygen extraction fraction | |
| Wirestam | Using contrast agents to obtain maps of regional perfusion and capillary wall permeability | |
| US11061094B2 (en) | Simultaneous pH and oxygen weighted MRI contrast using multi-echo chemical exchange saturation transfer imaging (ME-CEST) | |
| Pell et al. | Pulsed arterial spin labeling using TurboFLASH with suppression of intravascular signal | |
| Gambarota et al. | Assessment of absolute blood volume in carcinoma by USPIO contrast-enhanced MRI | |
| Tran-Gia et al. | A model-based reconstruction technique for fast dynamic T1 mapping | |
| McKinstry et al. | Ultrafast MR imaging of water mobility: animal models of altered cerebral perfusion | |
| Liu et al. | Dynamic T 2* relaxometry of hyperpolarized [1‐13C] pyruvate MRI in the human brain and kidneys | |
| Deh et al. | Dynamic volumetric hyperpolarized 13C imaging with multi‐echo EPI | |
| Braren et al. | Free-breathing quantitative dynamic contrast-enhanced magnetic resonance imaging in a rat liver tumor model using dynamic radial T1 mapping |
Legal Events
| Date | Code | Title | Description |
|---|---|---|---|
| PUAI | Public reference made under article 153(3) epc to a published international application that has entered the european phase |
Free format text: ORIGINAL CODE: 0009012 |
|
| 17P | Request for examination filed |
Effective date: 20091222 |
|
| AK | Designated contracting states |
Kind code of ref document: A1 Designated state(s): AT BE BG CH CY CZ DE DK EE ES FI FR GB GR HR HU IE IS IT LI LT LU LV MC MT NL NO PL PT RO SE SI SK TR |
|
| AX | Request for extension of the european patent |
Extension state: AL BA MK RS |
|
| RIN1 | Information on inventor provided before grant (corrected) |
Inventor name: PRAH, DOUGLAS E. Inventor name: PAULSON, ERIC S. Inventor name: SCHMAINDA, KATHLEEN |
|
| DAX | Request for extension of the european patent (deleted) | ||
| A4 | Supplementary search report drawn up and despatched |
Effective date: 20120224 |
|
| RIC1 | Information provided on ipc code assigned before grant |
Ipc: G01R 33/56 20060101ALI20120220BHEP Ipc: G01R 33/563 20060101ALI20120220BHEP Ipc: A61B 5/055 20060101AFI20120220BHEP |
|
| 17Q | First examination report despatched |
Effective date: 20150716 |
|
| STAA | Information on the status of an ep patent application or granted ep patent |
Free format text: STATUS: EXAMINATION IS IN PROGRESS |
|
| GRAP | Despatch of communication of intention to grant a patent |
Free format text: ORIGINAL CODE: EPIDOSNIGR1 |
|
| STAA | Information on the status of an ep patent application or granted ep patent |
Free format text: STATUS: GRANT OF PATENT IS INTENDED |
|
| RAP1 | Party data changed (applicant data changed or rights of an application transferred) |
Owner name: SCHMAINDA, KATHLEEN Owner name: IMAGING BIOMETRICS Owner name: PAULSON, ERIC S. Owner name: PRAH, DOUGLAS E. |
|
| INTG | Intention to grant announced |
Effective date: 20210113 |
|
| GRAS | Grant fee paid |
Free format text: ORIGINAL CODE: EPIDOSNIGR3 |
|
| GRAA | (expected) grant |
Free format text: ORIGINAL CODE: 0009210 |
|
| STAA | Information on the status of an ep patent application or granted ep patent |
Free format text: STATUS: THE PATENT HAS BEEN GRANTED |
|
| AK | Designated contracting states |
Kind code of ref document: B1 Designated state(s): AT BE BG CH CY CZ DE DK EE ES FI FR GB GR HR HU IE IS IT LI LT LU LV MC MT NL NO PL PT RO SE SI SK TR |
|
| REG | Reference to a national code |
Ref country code: GB Ref legal event code: FG4D |
|
| REG | Reference to a national code |
Ref country code: AT Ref legal event code: REF Ref document number: 1407770 Country of ref document: AT Kind code of ref document: T Effective date: 20210715 |
|
| REG | Reference to a national code |
Ref country code: DE Ref legal event code: R096 Ref document number: 602008064074 Country of ref document: DE |
|
| REG | Reference to a national code |
Ref country code: IE Ref legal event code: FG4D |
|
| REG | Reference to a national code |
Ref country code: NL Ref legal event code: FP |
|
| REG | Reference to a national code |
Ref country code: LT Ref legal event code: MG9D |
|
| REG | Reference to a national code |
Ref country code: AT Ref legal event code: MK05 Ref document number: 1407770 Country of ref document: AT Kind code of ref document: T Effective date: 20210707 |
|
| PG25 | Lapsed in a contracting state [announced via postgrant information from national office to epo] |
Ref country code: NO Free format text: LAPSE BECAUSE OF FAILURE TO SUBMIT A TRANSLATION OF THE DESCRIPTION OR TO PAY THE FEE WITHIN THE PRESCRIBED TIME-LIMIT Effective date: 20211007 Ref country code: PT Free format text: LAPSE BECAUSE OF FAILURE TO SUBMIT A TRANSLATION OF THE DESCRIPTION OR TO PAY THE FEE WITHIN THE PRESCRIBED TIME-LIMIT Effective date: 20211108 Ref country code: ES Free format text: LAPSE BECAUSE OF FAILURE TO SUBMIT A TRANSLATION OF THE DESCRIPTION OR TO PAY THE FEE WITHIN THE PRESCRIBED TIME-LIMIT Effective date: 20210707 Ref country code: FI Free format text: LAPSE BECAUSE OF FAILURE TO SUBMIT A TRANSLATION OF THE DESCRIPTION OR TO PAY THE FEE WITHIN THE PRESCRIBED TIME-LIMIT Effective date: 20210707 Ref country code: AT Free format text: LAPSE BECAUSE OF FAILURE TO SUBMIT A TRANSLATION OF THE DESCRIPTION OR TO PAY THE FEE WITHIN THE PRESCRIBED TIME-LIMIT Effective date: 20210707 Ref country code: BG Free format text: LAPSE BECAUSE OF FAILURE TO SUBMIT A TRANSLATION OF THE DESCRIPTION OR TO PAY THE FEE WITHIN THE PRESCRIBED TIME-LIMIT Effective date: 20211007 Ref country code: LT Free format text: LAPSE BECAUSE OF FAILURE TO SUBMIT A TRANSLATION OF THE DESCRIPTION OR TO PAY THE FEE WITHIN THE PRESCRIBED TIME-LIMIT Effective date: 20210707 Ref country code: HR Free format text: LAPSE BECAUSE OF FAILURE TO SUBMIT A TRANSLATION OF THE DESCRIPTION OR TO PAY THE FEE WITHIN THE PRESCRIBED TIME-LIMIT Effective date: 20210707 Ref country code: SE Free format text: LAPSE BECAUSE OF FAILURE TO SUBMIT A TRANSLATION OF THE DESCRIPTION OR TO PAY THE FEE WITHIN THE PRESCRIBED TIME-LIMIT Effective date: 20210707 |
|
| PG25 | Lapsed in a contracting state [announced via postgrant information from national office to epo] |
Ref country code: PL Free format text: LAPSE BECAUSE OF FAILURE TO SUBMIT A TRANSLATION OF THE DESCRIPTION OR TO PAY THE FEE WITHIN THE PRESCRIBED TIME-LIMIT Effective date: 20210707 Ref country code: LV Free format text: LAPSE BECAUSE OF FAILURE TO SUBMIT A TRANSLATION OF THE DESCRIPTION OR TO PAY THE FEE WITHIN THE PRESCRIBED TIME-LIMIT Effective date: 20210707 Ref country code: GR Free format text: LAPSE BECAUSE OF FAILURE TO SUBMIT A TRANSLATION OF THE DESCRIPTION OR TO PAY THE FEE WITHIN THE PRESCRIBED TIME-LIMIT Effective date: 20211008 |
|
| REG | Reference to a national code |
Ref country code: DE Ref legal event code: R097 Ref document number: 602008064074 Country of ref document: DE |
|
| PG25 | Lapsed in a contracting state [announced via postgrant information from national office to epo] |
Ref country code: DK Free format text: LAPSE BECAUSE OF FAILURE TO SUBMIT A TRANSLATION OF THE DESCRIPTION OR TO PAY THE FEE WITHIN THE PRESCRIBED TIME-LIMIT Effective date: 20210707 |
|
| PLBE | No opposition filed within time limit |
Free format text: ORIGINAL CODE: 0009261 |
|
| STAA | Information on the status of an ep patent application or granted ep patent |
Free format text: STATUS: NO OPPOSITION FILED WITHIN TIME LIMIT |
|
| PG25 | Lapsed in a contracting state [announced via postgrant information from national office to epo] |
Ref country code: SK Free format text: LAPSE BECAUSE OF FAILURE TO SUBMIT A TRANSLATION OF THE DESCRIPTION OR TO PAY THE FEE WITHIN THE PRESCRIBED TIME-LIMIT Effective date: 20210707 Ref country code: RO Free format text: LAPSE BECAUSE OF FAILURE TO SUBMIT A TRANSLATION OF THE DESCRIPTION OR TO PAY THE FEE WITHIN THE PRESCRIBED TIME-LIMIT Effective date: 20210707 Ref country code: EE Free format text: LAPSE BECAUSE OF FAILURE TO SUBMIT A TRANSLATION OF THE DESCRIPTION OR TO PAY THE FEE WITHIN THE PRESCRIBED TIME-LIMIT Effective date: 20210707 Ref country code: CZ Free format text: LAPSE BECAUSE OF FAILURE TO SUBMIT A TRANSLATION OF THE DESCRIPTION OR TO PAY THE FEE WITHIN THE PRESCRIBED TIME-LIMIT Effective date: 20210707 |
|
| 26N | No opposition filed |
Effective date: 20220408 |
|
| PG25 | Lapsed in a contracting state [announced via postgrant information from national office to epo] |
Ref country code: IT Free format text: LAPSE BECAUSE OF FAILURE TO SUBMIT A TRANSLATION OF THE DESCRIPTION OR TO PAY THE FEE WITHIN THE PRESCRIBED TIME-LIMIT Effective date: 20210707 |
|
| REG | Reference to a national code |
Ref country code: DE Ref legal event code: R119 Ref document number: 602008064074 Country of ref document: DE |
|
| REG | Reference to a national code |
Ref country code: CH Ref legal event code: PL |
|
| REG | Reference to a national code |
Ref country code: NL Ref legal event code: MM Effective date: 20220601 |
|
| REG | Reference to a national code |
Ref country code: BE Ref legal event code: MM Effective date: 20220531 |
|
| GBPC | Gb: european patent ceased through non-payment of renewal fee |
Effective date: 20220522 |
|
| PG25 | Lapsed in a contracting state [announced via postgrant information from national office to epo] |
Ref country code: MC Free format text: LAPSE BECAUSE OF FAILURE TO SUBMIT A TRANSLATION OF THE DESCRIPTION OR TO PAY THE FEE WITHIN THE PRESCRIBED TIME-LIMIT Effective date: 20210707 Ref country code: LU Free format text: LAPSE BECAUSE OF NON-PAYMENT OF DUE FEES Effective date: 20220522 Ref country code: LI Free format text: LAPSE BECAUSE OF NON-PAYMENT OF DUE FEES Effective date: 20220531 Ref country code: CH Free format text: LAPSE BECAUSE OF NON-PAYMENT OF DUE FEES Effective date: 20220531 |
|
| PG25 | Lapsed in a contracting state [announced via postgrant information from national office to epo] |
Ref country code: IE Free format text: LAPSE BECAUSE OF NON-PAYMENT OF DUE FEES Effective date: 20220522 Ref country code: FR Free format text: LAPSE BECAUSE OF NON-PAYMENT OF DUE FEES Effective date: 20220531 |
|
| PG25 | Lapsed in a contracting state [announced via postgrant information from national office to epo] |
Ref country code: GB Free format text: LAPSE BECAUSE OF NON-PAYMENT OF DUE FEES Effective date: 20220522 Ref country code: DE Free format text: LAPSE BECAUSE OF NON-PAYMENT OF DUE FEES Effective date: 20221201 Ref country code: BE Free format text: LAPSE BECAUSE OF NON-PAYMENT OF DUE FEES Effective date: 20220531 |
|
| PG25 | Lapsed in a contracting state [announced via postgrant information from national office to epo] |
Ref country code: NL Free format text: LAPSE BECAUSE OF NON-PAYMENT OF DUE FEES Effective date: 20220601 |
|
| PG25 | Lapsed in a contracting state [announced via postgrant information from national office to epo] |
Ref country code: HU Free format text: LAPSE BECAUSE OF FAILURE TO SUBMIT A TRANSLATION OF THE DESCRIPTION OR TO PAY THE FEE WITHIN THE PRESCRIBED TIME-LIMIT; INVALID AB INITIO Effective date: 20080522 |
|
| PG25 | Lapsed in a contracting state [announced via postgrant information from national office to epo] |
Ref country code: CY Free format text: LAPSE BECAUSE OF FAILURE TO SUBMIT A TRANSLATION OF THE DESCRIPTION OR TO PAY THE FEE WITHIN THE PRESCRIBED TIME-LIMIT Effective date: 20210707 |
|
| PG25 | Lapsed in a contracting state [announced via postgrant information from national office to epo] |
Ref country code: TR Free format text: LAPSE BECAUSE OF FAILURE TO SUBMIT A TRANSLATION OF THE DESCRIPTION OR TO PAY THE FEE WITHIN THE PRESCRIBED TIME-LIMIT Effective date: 20210707 |
|
| PG25 | Lapsed in a contracting state [announced via postgrant information from national office to epo] |
Ref country code: MT Free format text: LAPSE BECAUSE OF FAILURE TO SUBMIT A TRANSLATION OF THE DESCRIPTION OR TO PAY THE FEE WITHIN THE PRESCRIBED TIME-LIMIT Effective date: 20210707 |