EP2149996B1 - Method and device to manufacture a quantifiable phase coherence between two high frequency signals - Google Patents
Method and device to manufacture a quantifiable phase coherence between two high frequency signals Download PDFInfo
- Publication number
- EP2149996B1 EP2149996B1 EP20080018961 EP08018961A EP2149996B1 EP 2149996 B1 EP2149996 B1 EP 2149996B1 EP 20080018961 EP20080018961 EP 20080018961 EP 08018961 A EP08018961 A EP 08018961A EP 2149996 B1 EP2149996 B1 EP 2149996B1
- Authority
- EP
- European Patent Office
- Prior art keywords
- signal
- phase
- frequency signal
- amplitude
- frequency
- Prior art date
- Legal status (The legal status is an assumption and is not a legal conclusion. Google has not performed a legal analysis and makes no representation as to the accuracy of the status listed.)
- Active
Links
- 238000000034 method Methods 0.000 title claims description 39
- 238000004519 manufacturing process Methods 0.000 title claims description 4
- 238000005259 measurement Methods 0.000 claims description 50
- 230000003321 amplification Effects 0.000 claims description 9
- 238000003199 nucleic acid amplification method Methods 0.000 claims description 9
- 238000001228 spectrum Methods 0.000 claims description 8
- 239000000654 additive Substances 0.000 claims description 6
- 230000000996 additive effect Effects 0.000 claims description 6
- 230000002441 reversible effect Effects 0.000 claims description 3
- 238000012935 Averaging Methods 0.000 claims description 2
- 230000001629 suppression Effects 0.000 claims 1
- 238000010586 diagram Methods 0.000 description 6
- 239000013598 vector Substances 0.000 description 6
- 230000005540 biological transmission Effects 0.000 description 4
- 230000010363 phase shift Effects 0.000 description 4
- 230000001419 dependent effect Effects 0.000 description 2
- 238000010587 phase diagram Methods 0.000 description 2
- 238000012546 transfer Methods 0.000 description 2
- 238000007796 conventional method Methods 0.000 description 1
- 230000001360 synchronised effect Effects 0.000 description 1
- 230000002123 temporal effect Effects 0.000 description 1
- 238000012360 testing method Methods 0.000 description 1
Images


Classifications
-
- H—ELECTRICITY
- H04—ELECTRIC COMMUNICATION TECHNIQUE
- H04B—TRANSMISSION
- H04B17/00—Monitoring; Testing
- H04B17/0082—Monitoring; Testing using service channels; using auxiliary channels
- H04B17/0085—Monitoring; Testing using service channels; using auxiliary channels using test signal generators
-
- G—PHYSICS
- G01—MEASURING; TESTING
- G01R—MEASURING ELECTRIC VARIABLES; MEASURING MAGNETIC VARIABLES
- G01R31/00—Arrangements for testing electric properties; Arrangements for locating electric faults; Arrangements for electrical testing characterised by what is being tested not provided for elsewhere
- G01R31/28—Testing of electronic circuits, e.g. by signal tracer
- G01R31/2832—Specific tests of electronic circuits not provided for elsewhere
- G01R31/2836—Fault-finding or characterising
- G01R31/2839—Fault-finding or characterising using signal generators, power supplies or circuit analysers
- G01R31/2841—Signal generators
-
- H—ELECTRICITY
- H04—ELECTRIC COMMUNICATION TECHNIQUE
- H04B—TRANSMISSION
- H04B7/00—Radio transmission systems, i.e. using radiation field
- H04B7/02—Diversity systems; Multi-antenna system, i.e. transmission or reception using multiple antennas
- H04B7/04—Diversity systems; Multi-antenna system, i.e. transmission or reception using multiple antennas using two or more spaced independent antennas
- H04B7/0413—MIMO systems
Definitions
- the invention relates to a method and a device for producing or restoring a quantizable phase coherence between two high-frequency signals.
- Multi-antenna transmission - multiple-in-multiple-out (MIMO) transmission - is becoming increasingly important in the future.
- MIMO receivers with several receiving antennas already exist.
- the testing of such MIMO receivers requires the generation of several mutually phase-coherent high-frequency signals.
- Phase coherence demands in the strict sense a fixed phase difference ⁇ between two high-frequency carrier signals which have the same frequency or differ in multiples of a frequency, while phase synchrony as a special case of phase coherence requires a same phase angle for the two high-frequency signals.
- phase difference In order to recover a quantizable phase coherence that occurs between two high-frequency signals generated in a signal generator, a phase difference must be determined in a first step.
- Several different methods of measuring a phase difference between two high frequency signals are known.
- the easiest way is to route the two RF signals to one input of an oscilloscope and simultaneously display the two RF signals on the display of the oscilloscope over time. From the set time resolution of the oscilloscope and the readable distance on the display of the zero crossings of the two high-frequency signals can be easily determined, the phase difference. Due to the poor time or phase resolution of conventional oscilloscopes, the phase difference measurement of a 5 GHz RF signal requires a comparatively expensive oscilloscope with a bandwidth of 70 GHz. Also, with an oscilloscope, signal levels below -30 dBm can not be measured, making them unsuitable for measurement in MIMO transmission systems with signal levels as low as -100 dBm.
- One known method for measuring a phase difference between two high-frequency signals generated in a signal generator is the use of a network analyzer.
- the signal generator of the network analyzer is deactivated while the two high-frequency signals are routed to port 1 and port 2 of the network analyzer.
- An S21 measurement can be used to determine the phase difference between the high-frequency signal connected to port 1 and the high-frequency signal connected to port 2.
- a network analyzer is relatively expensive and not suitable for signal levels below -50 dBm.
- the unknown quantities A and B can be determined and subsequently by applying the arccos function to the measured DC component of the output signal of the HF mixer 11, the phase difference ⁇ between the two high-frequency signals HF 1 and HF 2 are determined.
- the measurement of the phase difference between the two high-frequency signals by means of the RF mixer 11 and the DC voltmeter 12 is not suitable for signal levels below +10 dBm and due to the measurement of the DC component does not allow a signed measurement of the phase difference between two high-frequency signals, hereinafter also HF Called signals.
- the object of the invention is therefore to provide a method
- the invention is achieved by a method for producing a quantizable phase coherence between two RF signals having the features of patent claim 1 and by an apparatus for producing a quantizable phase coherence between two RF signals having the features of patent claim 11.
- Advantageous technical extensions are listed in the dependent claims.
- the two radio-frequency signals are additively linked in a signal linking unit and the amplitude of the measurement signal resulting from the additive combination is measured with a spectrum analyzer.
- a spectrum analyzer By successive variation of the phase of one of the two high-frequency signals -. B. the first high-frequency signal - in relation to the phase of the other high-frequency signal - z. B. of the second high-frequency signal - when a minimum amplitude of the measurement signal is measured, using a summer as a signal combining unit, a phase difference of 180 ° and thus a quantizable phase coherence between the two high-frequency signals produced.
- a subtractor as a signal combining unit is produced by successively varying the phase of the first high frequency signal in relation to the phase of the second high frequency signal, a phase difference of 0 ° and thus a phase synchrony - as a special case of a quantizable phase coherence - between the two high frequency signals, if a minimum Amplitude of the measuring signal is measured.
- the amplitude of one of the two high-frequency signal is successively varied in relation to the amplitude of the other high-frequency signal, in turn to the successive variation of the phase of one of the two high-frequency signal in relation to the phase of the other high-frequency signal until, in turn, the amplitude the measuring signal is minimal.
- a first step only an approximation of the amplitude minimum of the measurement signal - a rough value of the amplitude minimum of the measurement signal - and thus an approximation for the phase determined.
- the phase of one of the two high-frequency signals is reduced in relation to the phase of the other high-frequency signal until a first phase occurs, at which a certain previously determined amplitude value of the Measurement signal is reached.
- the phase of one of the two high-frequency signals is increased in relation to the phase of the other high-frequency signal until a second phase occurs, at which in turn the previously determined amplitude value of the measuring signal is reached.
- An exact value for the phase at which the amplitude of the measurement signal has an exact minimum results from the average of the first and second phases.
- the variation of the phase of the first high-frequency signal in relation to the phase of the second high-frequency signal takes place within the signal generator generating the two high-frequency signals, either manually or manually automated adjustment of the phase of the first baseband signal associated with the first RF signal in relation to the phase of the second baseband signal associated with the second RF signal or the phase of the first RF signal associated with the first RF signal in relation to the phase of the second carrier signal associated with the second RF signal.
- the variation of the amplitude of the first high-frequency signal in relation to the amplitude of the second high-frequency signal occurs within the signal generator generating the two high-frequency signals by manual or automated adjustment of the amplification factor (s) of the amplifier unit (s) in the signal path of the first high-frequency signal Relation of the amplification factor (s) of the amplifier unit (s) located in the signal path of the second high-frequency signal.
- the automated adjustment of the phase of the first or second baseband signal or of the first or second carrier signal is carried out once at a time-invariant phase difference and at a time-variant phase difference continuously in a certain time interval within a certain time interval. If the two high-frequency signals either have the same frequency or differ in an integer ratio between their frequencies, but the frequency is varied over time, the phase of the first or second baseband signal or the first and second carrier signal in a certain frequency grid within a certain frequency spectrum - Sweep réelle - be adjusted to compensate for frequency-dependent phase differences.
- the adjustment of the phase can also be either once at a specific time or continuously in a certain time frame within a certain time interval - "three-dimensional phase adjustment" - take place.
- the two high frequency signals each represent (pseudo) continuous wave signals (pseudo CW signals) and thus each have a constant amplitude and a constant frequency and are modulated with DC baseband signals.
- this noise signal component is eliminated by averaging over a plurality of successive amplitude values of the measurement signal.
- a phase drift of a baseband signal in relation to the phase of the other baseband signal caused by different amplification factors in the in-phase and quadrature channels of the IQ modulator is compensated for by deliberate temporal changes of the symbols used for the two baseband signals.
- the signal combining unit for the additive combination of the two high-frequency signals is realized either as an adder or as a subtractor.
- an ohmic power divider connected in the reverse signal path direction is preferably used.
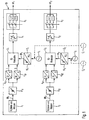
- the signal linking unit 13 may be as shown in FIG Fig. 3 indicating either an adder which sums the two high-frequency signals HF 1 and HF 2 , or theoretically also a subtractor, which subtracts the two high-frequency signals HF 1 and HF 2 from one another.
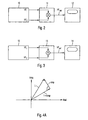
- a symmetrically constructed ohmic power divider is used, which is designed in accordance with FIG Fig. 5 is connected in a direction opposite to power dividers signal flow direction reverse signal flow direction.
- the power divider has a high temperature stability. Due to its ohmic transfer characteristic, there are none in the power divider and thus in the adder additional phase shift.
- the phase of the measurement signal HF out at the output of the signal combining unit 13 follows the phases of the two high-frequency signals HF 1 and HF 2 at the input of the signal combining unit 13.
- the amplitude of the measurement signal HF Out is measured by a spectrum analyzer 14. All connectors used in the device according to the invention for restoring a quantizable phase coherence between two high-frequency signals have an equivalent phase-transfer behavior - minimized phase shifts - equivalent to the signal combining unit 13.
- the output signal HF Out of the first embodiment of the signal combining unit 13 - adder - results according to equation (3), wherein the amplitude A of the first RF signal HF 1 and the amplitude B of the second RF signal HF 2 assumed identical to L in the first step becomes.
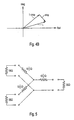
- the measurement signal HF out according to equation (3) results according to Fig. 4A as a vector in the complex plane rotating at the angular frequency ⁇ , which consists of two mutually orthogonal vectors - L ⁇ sin ( ⁇ ⁇ t ) ⁇ (1 + cos ( ⁇ )) and L ⁇ cos ( ⁇ ⁇ t ) ⁇ sin ( ⁇ ) - which also rotate at the angular frequency ⁇ .
- Fig. 6A is the context of the amplitude Out of the measured signal HF Out as a function of the phase difference ⁇ between the two high-frequency signals HF 1 and HF 2 in a connected as a summer signal linking unit 13.
- the phase of one of the two radio-frequency signals in relation to the phase of the other radio-frequency signal is varied by certain measures, which are described below in more detail, so that the amplitude of the measurement signal HF Out reaches its minimum over time
- the two radio-frequency signals HF 1 and HF 2 according to Fig. 6A a phase difference ⁇ of 180 ° and due to the uniqueness of the minimum there is a quantizable phase coherence in the amount of 180 ° between the two high-frequency signals HF 1 and HF 2 .
- the measurement signal HF out according to equation (5) results according to Fig. 4B as a vector in the complex plane rotating at the angular frequency ⁇ , which consists of two mutually orthogonal vectors - L ⁇ sin ( ⁇ ⁇ t ) ⁇ (1-cos ( ⁇ )) and - L ⁇ cos ( ⁇ ⁇ t ) ⁇ sin ( ⁇ ) - which also rotate with the angular frequency ⁇ .
- the amplitudes of these two mutually orthogonal vectors are each L * (1-cos ( ⁇ ) and L * sin ( ⁇ ).) If the phase difference ⁇ between the two high-frequency signals HF 1 and HF 2 is 0 °, the amplitude is obtained Out of the measurement signal HF out a minimum ordinate value of zero. On the other hand, if the phase difference ⁇ between the two high-frequency signals HF 1 and HF 2 is 180 °, the result is the amplitude Out of the measurement signal HF Out a maximum ordinate value of 2 ⁇ L.
- Fig. 6B the relationship of the amplitude HF Out of the measurement signal HF Out is shown as a function of the phase difference ⁇ between the two high-frequency signals HF 1 and HF 2 in a signal combining unit 13 implemented as a subtractor.
- the phase of one of the two radio-frequency signals in relation to the phase of the other radio-frequency signal is varied by certain measures, which are described below in more detail, so that the amplitude of the measurement signal HF Out reaches its minimum over time
- the two radio-frequency signals HF 1 and HF 2 according to Fig. 6B a phase difference ⁇ of 0 ° over time and it is due to the uniqueness of the minimum a quantizable phase synchrony - as a special case of a quantizable phase coherence in the amount of 0 ° - between the two high-frequency signals HF 1 and HF 2 .
- a relationship for the amplitude results from equation (4) Out of the measurement signal Out according to equation (7) and in the case of a signal combining unit 13 implemented as a subtractor, a relationship for the amplitude is based on equation (6) Out of the measurement signal HF Out according to equation (8).
- the minimum of the amplitude Out of the measurement signal HF Out equivalent to the case at identical amplitudes of the two high-frequency signals HF 1 and HF 2 at a phase difference ⁇ of 180 ° and the ordinate A 2 + B 2 + 2 ⁇ FROM
- the minimum of the amplitude HF out of the measurement signal HF Out is equivalent to the case of identical amplitudes of the two high frequency signals HF 1 and HF 2 at a phase difference ⁇ of 0 ° and has the ordinate value A 2 + B 2 - 2 ⁇ FROM on.
- the two amplitudes A and B of the first and second high-frequency signal HF 1 and HF 2 which are usually indicated on a logarithmic scale, must be converted to a linear scale, then an amplitude Res of the residual signal from the difference of the present in the linear scale amplitudes A and B of the first and second high-frequency signal HF 1 and HF 2 to calculate in a linear scale. Finally, there is a logarithmization of the amplitude Res of the residual signal which is present in the linear scale.
- Fig. 7 the relationship between the amplitude Res of the residual signal on a logarithmic scale as a function of the also determined on a logarithmic scale amplitude difference ⁇ between the amplitudes A and B of the first and second high frequency signals HF 1 and HF 2 is shown.
- Fig. 7 in that, given an exemplary amplitude difference ⁇ , between the two amplitudes A and B of the first and second high-frequency signals HF 1 and HF 2 in the amount of 0.2 dB sets an amplitude Re s of the residual signal in the amount of about -27 dB. Since this amplitude value according to Fig. 6A or 6B also sets at identical amplitudes A and B of the first and second high-frequency signal HF 1 and HF 2 at a phase difference between the two high-frequency signals HF 1 and HF 2 in the amount of 2.5 °, is with a pure determination of the amplitude minimum of the measurement signal HF Out still no exact quantisable phase coherence determined.
- step S10 with the signal linking of the two generated by the signal generator 10 high-frequency signals HF 1 and HF 2 with one of the two inputs of the signal linking unit 13.
- the generated at the output of the signal combining unit 13 measurement signal HF Out which corresponds to the case of using an adder to the sum of the first and second high-frequency signal RF 1 and RF 2 and in the case of using a subtracter the difference between the first and second high frequency signal RF 1 and RF 2, is fed to the input of a spectrum analyzer 14, the amplitude Out of the measuring signal HF Out measures.
- the phase of the first high-frequency signal HF 1 is related to the phase of the second high-frequency signal HF 2 as long as varied in the spectrum analyzer 14 for the amplitude Out of the measurement signal HF out a minimum is measured.
- the variation of the phase of the first high-frequency signal HF 1 in relation to the phase of the second high-frequency signal HF 2 either by adjusting the phase of the belonging to the first high-frequency signal HF 1 first baseband signal BB 1 in relation to the phase of the corresponding second high-frequency signal HF 2 second baseband signal BB 2 by means of the present in the signal path of the first baseband signal BB 1 phase shifter 15 1 and the phase shifter 15 2 or, alternatively, by adjusting the phase of the belonging to the first high-frequency signal HF 1 first carrier signal TR 1 in relation to the phase of the located in the signal path of the second baseband signal BB 2 second high-frequency signal HF 2 corresponding second carrier signal TR 2 by means of the present in the signal path of the first carrier signal TR 1 phase shifter 16 of the phase shifter 1 and 16 2 located in the signal path of the second carrier signal TR.
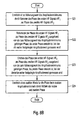
- the method step S20 is characterized by that in the flow chart of Fig. 8B Process steps S21 to S24 replaced:
- step S21 of the embodiment of the method according to the invention analogous to method step S20 in FIG Fig. 6A by varying the phase of the first high-frequency signal HF 1 in relation to the phase of the second high-frequency signal HF 2 no exact value for the minimum of the amplitude Out of the measurement signal HF Out and thus for the associated phase of the first high frequency signal HF 1 in relation to the phase of the second high frequency signal HF 2 , but only a rough approximation value for the minimum of the amplitude Out of the measurement signal HF Out and thus for the associated phase of the first high-frequency signal HF 1 in relation to the phase of the second high-frequency signal HF 2 determined.
- step S24 the exact value for the phase of the first high-frequency signal HF 1 in relation to the phase of the second high-frequency signal HF 2 at the exact minimum of the amplitude Out of the measured signal HF Out calculated as the average value of the first phase ⁇ 1 and the second phase ⁇ 2 .
- the method step S30 following the method step S20 involves the successive variation of the amplitude A of the first high-frequency signal HF 1 in relation to the amplitude B of the second high-frequency signal HF 2 to possibly - in the case of different amplitudes A and B of the first high-frequency signal HF 1 and the second High frequency signal HF 2 - to determine a new minimum of the amplitude HF Out of the measurement signal HF Out , which is minimized compared to the obtained by variation of the phase amplitude minimum of the measurement signal HF Out .
- the variation of the amplitude A of the first high-frequency signal HF 1 in relation to the amplitude B of the second high-frequency signal HF 2 is effected by adjusting the gain of the power amplifier 5 1 located in the signal path of the first high-frequency signal HF 1 in relation to the amplification factor of the present in the signal path of the second high-frequency signal HF 2 Power amplifier 5 2 or by connecting resistor elements in the electronically switchable attenuator 6 1 of the signal path of the first high-frequency signal HF 1 in relation to the connection of resistor elements in the electronically switchable attenuator 6 2 in the signal path of the second high-frequency signal HF second
- step S40 it is determined whether the phase accuracy required for restoring the quantizable phase coherence between the two high-frequency signals HF 1 and HF 2 is achieved by the phase of the first high-frequency signal HF 1 determined in the previous method steps in relation to the phase of the second high-frequency signal HF 2 , If the accuracy of the determined phase of the first high-frequency signal HF 1 in relation to the phase of the second high-frequency signal HF 2 does not meet the requirements, the phase of the first high-frequency signal HF 1 is repeatedly varied slightly in step S20 in relation to the phase of the second high-frequency signal HF 2 to achieve a result with increased accuracy. Otherwise the desired result is available and the procedure is finished.
Description
Die Erfindung betrifft ein Verfahren und eine Vorrichtung zur Herstellung bzw. Wiederherstellung einer quantisierbaren Phasenkohärenz zwischen zwei Hochfrequenzsignalen.The invention relates to a method and a device for producing or restoring a quantizable phase coherence between two high-frequency signals.
Die Mehrantennenübertragung - Multiple-In-Multiple-Out (MIMO)-Übertragung - gewinnt zukünftig immer mehr an Bedeutung. Entsprechende MIMO-Empfänger mit mehreren Empfangsantennen existieren bereits. Das Testen derartiger MIMO-Empfänger erfordert die Erzeugung mehrerer zueinander phasenkohärenter Hochfrequenzsignale. Phasenkohärenz fordert im strengen Sinne eine fixe Phasendifferenz Δϕ zwischen zwei Hochfrequenz-Trägersignalen, die die gleiche Frequenz aufweisen oder sich in Vielfachen einer Frequenz unterscheiden, während Phasensynchronität als Spezialfall einer Phasenkohärenz einen gleichen Phasenwinkel für die beiden Hochfrequenzsignale voraussetzt.Multi-antenna transmission - multiple-in-multiple-out (MIMO) transmission - is becoming increasingly important in the future. Corresponding MIMO receivers with several receiving antennas already exist. The testing of such MIMO receivers requires the generation of several mutually phase-coherent high-frequency signals. Phase coherence demands in the strict sense a fixed phase difference Δφ between two high-frequency carrier signals which have the same frequency or differ in multiples of a frequency, while phase synchrony as a special case of phase coherence requires a same phase angle for the two high-frequency signals.
Die Erzeugung von zwei oder mehreren zueinander phasenkohärenten Hochfrequenzsignalen in einem Signalgenerator ist in der Praxis nicht unproblematisch, da innerhalb eines Signalgenerator mehrere Störquellen für eine Phasenverschiebung der generierten Signale existieren, die zu einer unerwünschten Phaseninkohärenz zwischen zwei oder mehreren Hochfrequenzsignalen an den jeweiligen HF-Ausgängen des Signalgenerators führt.The generation of two or more mutually phase-coherent high-frequency signals in a signal generator is not without problems in practice, since within a signal generator several sources of interference for a phase shift of the generated signals exist, leading to an undesirable phase incoherence between two or more high-frequency signals at the respective RF outputs of Signal generator leads.
Hierzu sei auf die
- Phasenrauschen in den beiden
Frequenzsynthesizern 21 bzw. 22, die jeweils von einem internen oderexternen Oszillator 11, 11' bzw. 12, 12' gespeist werden, bei voneinander entkoppelter Erzeugung zweier Trägersignale für die beiden HF-Signale HF1 bzw. HF2, - Phasendrift eines oder beider
Frequenzsynthesizer 21 bzw. 22 aufgrund beispielsweise eines Offset-Fehlers im jeweiligen Phasendetektor, - unterschiedliche elektrische Längen Δx der zu den beiden HF-Signalen HF1 bzw. HF2 jeweils gehörigen Signalpfade und damit unterschiedliche Phasen der beiden HF-Signale HF1 bzw. HF2 aufgrund temperaturbedingter unterschiedlicher Ausdehnungen der beiden Signalpfade, wobei der Phasenunterschied zwischen den beiden HF-Signalen HF1 bzw. HF2 durch eine überlagerte Änderung der Frequenz der beiden HF-Signale gemäß Gleichung (1) zusätzlich verstärkt wird,
- Phasendrift zwischen den von den beiden Kodierern/Mappern 71 bzw. 72 erzeugten Basisbandsignalen BB1 bzw. BB2 und damit zwischen den beiden HF-Signalen HF1 bzw. HF2 aufgrund jeweils unterschiedlicher Verstärkungsfaktoren im Inphase- und Quadraturkanal der zugehörigen IQ-
Modulatoren 31 bzw. 32, - Phasendrift zwischen beiden Hochfrequenz-Signalen (HF-Signalen) HF1 bzw. HF2 aufgrund von unterschiedlichen Gruppenlaufzeiten in den jeweiligen Analog-Digital-
Wandlern Modulatoren 31 bzw. 32,Leistungsverstärkern 51 bzw. 52 und elektronisch schaltbaren Dämpfungsgliedern 61 bzw. 62 und - Phasendrift zwischen den beiden HF-Signalen HF1 bzw. HF2 bei Änderung des Signalpegels der beiden HF-Signale HF1 bzw. HF2 aufgrund unterschiedlicher Amplituden-Phasen-Kennlinien der zum jeweiligen HF-Signal HF1 bzw. HF2
gehörigen Leistungsverstärker 51 bzw. 52 und elektronisch schaltbaren Dämpfungsglieder 61 bzw. 62:
- Phase noise in the two
frequency synthesizers external oscillator - Phase drift of one or both
frequency synthesizers - different electrical lengths Δx of the two RF signals HF 1 and HF 2 respectively associated signal paths and thus different phases of the two RF signals HF 1 and HF 2 due to temperature-induced different extents of the two signal paths, wherein the phase difference between the two RF Signals HF 1 or HF 2 is additionally amplified by a superimposed change in the frequency of the two RF signals according to equation (1),
- Phase drift between the signals generated by the two encoders / mappers 7 1 and 7 2 baseband signals BB 1 and BB2, and thus between the two RF signals RF 1 and RF 2 due to respectively different amplification factors in the in-phase and quadrature channel of the associated
IQ Modulators - Phase drift between the two high-frequency signals (RF signals) HF 1 and HF 2 due to different group delay in the respective analog-to-
digital converters IQ modulators power amplifiers - Phase drift between the two RF signals HF 1 and HF 2 when changing the signal level of the two RF signals HF 1 and HF 2 due to different amplitude-phase characteristics of the respective RF signal HF 1 and HF 2 associated
power amplifier
Um eine quantisierbare Phasenkohärenz, die zwischen zwei in einem Signalgenerator erzeugten Hochfrequenz-Signalen auftritt, wiederherzustellen, muss in einem ersten Schritt eine Phasendifferenz ermittelt werden. Es sind mehrere verschiedene Verfahren zur Messung einer Phasendifferenz zwischen zwei Hochfrequenzsignalen bekannt.In order to recover a quantizable phase coherence that occurs between two high-frequency signals generated in a signal generator, a phase difference must be determined in a first step. Several different methods of measuring a phase difference between two high frequency signals are known.
Am einfachsten ist es, die beiden Hochfrequenzsignale jeweils an einen Eingang eines Oszilloskops zu führen und die beiden Hochfrequenzsignale gleichzeitig am Display des Oszilloskops über der Zeit darzustellen. Aus der eingestellten Zeitauflösung des Oszilloskops und dem am Display ablesbaren Abstands der Nulldurchgänge der beiden Hochfrequenzsignale kann sehr einfach die Phasendifferenz ermittelt werden. Aufgrund der schlechten Zeit- bzw. Phasenauflösung herkömmlicher Oszilloskope ist zur Phasendifferenzmessung eines 5 GHz HF-Signals ein vergleichsweise teueres Oszilloskop mit einer Bandbreite in der Höhe von 70 GHz erforderlich. Auch können mit einem Oszilloskop keine Signalpegel unterhalb von -30 dBm gemessen werden, so dass sie für die Messung in MIMO-Übertragungssystemen mit Signalpegeln in der Höhe von -100 dBm nicht geeignet sind.The easiest way is to route the two RF signals to one input of an oscilloscope and simultaneously display the two RF signals on the display of the oscilloscope over time. From the set time resolution of the oscilloscope and the readable distance on the display of the zero crossings of the two high-frequency signals can be easily determined, the phase difference. Due to the poor time or phase resolution of conventional oscilloscopes, the phase difference measurement of a 5 GHz RF signal requires a comparatively expensive oscilloscope with a bandwidth of 70 GHz. Also, with an oscilloscope, signal levels below -30 dBm can not be measured, making them unsuitable for measurement in MIMO transmission systems with signal levels as low as -100 dBm.
Ein bekanntes Verfahren zur Messung einer Phasendifferenz zwischen zwei in einem Signalgenerator erzeugten Hochfrequenzsignalen liegt in der Verwendung eines Netzwerkanalysators. Hierzu ist der Signalgenerator des Netzwerkanalysators deaktiviert, während die beiden Hochfrequenzsignale an Port 1 und Port 2 des Netzwerkanalysators geführt werden. Über eine S21-Messung kann die Phasendifferenz zwischen dem am Port 1 angeschlossenen Hochfrequenzsignal und dem am Port 2 angeschlossenen Hochfrequenzsignal ermittelt werden. Als Messgerät zur Messung einer Phasendifferenz zwischen zwei Hochfrequenzsignalen ist ein Netzwerkanalysator relativ teuer und für Signalpegel unter -50 dBm nicht geeignet.One known method for measuring a phase difference between two high-frequency signals generated in a signal generator is the use of a network analyzer. For this purpose, the signal generator of the network analyzer is deactivated while the two high-frequency signals are routed to
Schließlich wird die Phasendifferenz zwischen zwei Hochfrequenzsignalen HF 1 und HF 2, gemäß 
Über ein Gleichspannungsvoltmeter 12 kann der Gleichanteil des Ausgangssignals des HF-Mischers 11 gemessen werden. Wird im Rahmen einer Kalibriermessung der maximale und der minimale Signalpegel des Ausgangssignal HFOut des HF-Mischers 11 gemessen, so können die unbekannten Größen A und B bestimmt werden und anschießend durch Anwendung der arccos-Funktion auf den gemessenen Gleichanteil des Ausgangssignals des HF-Mischers 11 die Phasendifferenz ϕ zwischen den beiden Hochfrequenzsignalen HF 1 und HF 2 ermittelt werden.Finally, the phase difference between two high-frequency signals HF 1 and HF 2 , according to
About a
Die Messung der Phasendifferenz zwischen den beiden Hochfrequenzsignalen mittels des HF-Mischers 11 und des Gleichspannungsvoltmeters 12 ist aber für Signalpegel unter +10 dBm nicht geeignet und ermöglicht aufgrund der Messung des Gleichanteils keine vorzeichenbehaftete Messung der Phasendifferenz zwischen zwei Hochfrequenz-Signalen, im Folgenden auch HF-Signale genannt.However, the measurement of the phase difference between the two high-frequency signals by means of the
Aufgabe der Erfindung ist es deshalb, ein Verfahren undThe object of the invention is therefore to provide a method and
Vorrichtung zur Herstellung einer quantisierbaren Phasenkohärenz zwischen zwei in einem Signalgenerator erzeugten Hochfrequenzsignalen zu schaffen, das die erwähnten Nachteile herkömmlicher Verfahren und Vorrichtungen zur Phasendifferenzmessung zweier Hochfrequenz-Signale beseitigt und insbesondere für kleine Signalpegel bei der Messung in MIMO-Übertragungssystemen geeignet ist.To provide a device for producing a quantizable phase coherence between two high-frequency signals generated in a signal generator, which eliminates the mentioned disadvantages of conventional methods and devices for phase difference measurement of two high-frequency signals and is particularly suitable for small signal levels in the measurement in MIMO transmission systems.
Die Erfindung wird durch ein Verfahren zur Herstellung einer quantisierbaren Phasenkohärenz zwischen zwei HF-Signalen mit den Merkmalen des Patentanspruchs 1 und durch eine Vorrichtung zur Herstellung einer quantisierbaren Phasenkohärenz zwischen zwei HF-Signalen mit den Merkmalen des Patentanspruchs 11 gelöst. Vorteilhafte technische Erweiterungen sind in den abhängigen Patentansprüchen aufgeführt.The invention is achieved by a method for producing a quantizable phase coherence between two RF signals having the features of
Erfindungsgemäß werden die beiden Hochfrequenzsignale in einer Signalverknüpfungseinheit additiv verknüpft und die Amplitude des aus der additiven Verknüpfung entstandenen Messsignals mit einem Spektrumanalysator gemessen. Durch sukzessive Variation der Phase eines der beiden Hochfrequenzsignale - z. B. des ersten Hochfrequenzsignals - in Relation zur Phase des anderen Hochfrequenzsignals - z. B. des zweiten Hochfrequenzsignals - wird, wenn eine minimale Amplitude des Messsignals gemessen wird, bei Verwendung eines Summierers als Signalverknüpfungseinheit eine Phasendifferenz von 180° und damit eine quantisierbare Phasenkohärenz zwischen den beiden Hochfrequenzsignalen hergestellt. Bei theoretisch auch denkbarer Verwendung eines Subtrahierers als Signalverknüpfungseinheit wird durch sukzessives Variieren der Phase des ersten Hochfrequenzsignals in Relation zur Phase des zweiten Hochfrequenzsignals eine Phasedifferenz von 0° und damit eine Phasensynchronität - als Spezialfall einer quantisierbaren Phasenkohärenz - zwischen den beiden Hochfrequenzsignalen hergestellt, falls eine minimale Amplitude des Messsignals gemessen wird.According to the invention, the two radio-frequency signals are additively linked in a signal linking unit and the amplitude of the measurement signal resulting from the additive combination is measured with a spectrum analyzer. By successive variation of the phase of one of the two high-frequency signals -. B. the first high-frequency signal - in relation to the phase of the other high-frequency signal - z. B. of the second high-frequency signal - when a minimum amplitude of the measurement signal is measured, using a summer as a signal combining unit, a phase difference of 180 ° and thus a quantizable phase coherence between the two high-frequency signals produced. In theoretically conceivable use of a subtractor as a signal combining unit is produced by successively varying the phase of the first high frequency signal in relation to the phase of the second high frequency signal, a phase difference of 0 ° and thus a phase synchrony - as a special case of a quantizable phase coherence - between the two high frequency signals, if a minimum Amplitude of the measuring signal is measured.
Falls die Amplituden der beiden Hochfrequenzsignale unterschiedlich ist, wird im Wechsel zur sukzessiven Variation der Phase des einen der beiden Hochfrequenzsignals in Relation zur Phase des anderen Hochfrequenzsignals die Amplitude des einen der beiden Hochfrequenzsignals in Relation zur Amplitude des anderen Hochfrequenzsignals sukzessive variiert, bis wiederum die Amplitude des Messsignals minimal wird.If the amplitudes of the two high-frequency signals are different, the amplitude of one of the two high-frequency signal is successively varied in relation to the amplitude of the other high-frequency signal, in turn to the successive variation of the phase of one of the two high-frequency signal in relation to the phase of the other high-frequency signal until, in turn, the amplitude the measuring signal is minimal.
Um ein zeitaufwendiges iteratives Suchen der minimalen Amplitude des Messsignals zu vermeiden, wird in einem ersten Schritt nur eine Näherung des Amplitudenminimums des Messsignals - ein grober Wert des Amplitudenminimums des Messsignals - und damit eine Näherung für die Phase ermittelt. Ausgehend von der zu dieser Näherung des Amplitudenminimums des Messsignals gehörigen Näherung der Phasendifferenz zwischen den beiden Hochfrequenzsignalen wird die Phase eines der beiden Hochfrequenzsignale in Relation zur Phase des anderen Hochfrequenzsignals soweit reduziert, bis sich eine erste Phase einstellt, bei der ein bestimmter vorher festgelegter Amplitudenwert des Messsignals erreicht ist. Daraufhin wird ausgehend von der zur ermittelten Näherung des Amplitudenminimums des Messsignals gehörigen Näherung der Phasendifferenz zwischen den beiden Hochfrequenzsignalen die Phase eines der beiden Hochfrequenzsignale in Relation zur Phase des anderen Hochfrequenzsignals soweit erhöht, bis sich eine zweite Phase einstellt, bei der wiederum der vorher festgelegte Amplitudenwert des Messsignals erreicht ist. Ein exakter Wert für die Phase, bei der die Amplitude des Messsignals ein exaktes Minimum aufweist, ergibt sich aus dem Mittelwert der ersten und zweiten Phase.To avoid a time-consuming iterative search of the minimum amplitude of the measurement signal, in a first step, only an approximation of the amplitude minimum of the measurement signal - a rough value of the amplitude minimum of the measurement signal - and thus an approximation for the phase determined. Starting from the approximation of the phase difference between the two high-frequency signals associated with this approximation of the amplitude minimum of the measuring signal, the phase of one of the two high-frequency signals is reduced in relation to the phase of the other high-frequency signal until a first phase occurs, at which a certain previously determined amplitude value of the Measurement signal is reached. Then, starting from the approximation of the phase difference between the two high-frequency signals belonging to the determined approximation of the amplitude minimum of the measuring signal, the phase of one of the two high-frequency signals is increased in relation to the phase of the other high-frequency signal until a second phase occurs, at which in turn the previously determined amplitude value of the measuring signal is reached. An exact value for the phase at which the amplitude of the measurement signal has an exact minimum results from the average of the first and second phases.
Die Variation der Phase des ersten Hochfrequenzsignals in Relation zur Phase des zweiten Hochfrequenzsignals erfolgt innerhalb des die beiden Hochfrequenzsignale erzeugenden Signalgenerators entweder durch manuelles oder automatisiertes Verstellen der Phase des zum ersten Hochfrequenzsignal gehörigen ersten Basisbandsignals in Relation zur Phase des zum zweiten Hochfrequenzsignal gehörigen zweiten Basisbandsignals oder der Phase des zum ersten Hochfrequenzsignal gehörigen ersten Trägersignals in Relation zur Phase des zum zweiten Hochfrequenzsignal gehörigen zweiten Trägersignals.The variation of the phase of the first high-frequency signal in relation to the phase of the second high-frequency signal takes place within the signal generator generating the two high-frequency signals, either manually or manually automated adjustment of the phase of the first baseband signal associated with the first RF signal in relation to the phase of the second baseband signal associated with the second RF signal or the phase of the first RF signal associated with the first RF signal in relation to the phase of the second carrier signal associated with the second RF signal.
Die Variation der Amplitude des ersten Hochfrequenzsignals in Relation zur Amplitude des zweiten Hochfrequenzsignals erfolgt innerhalb des die beiden Hochfrequenzsignale erzeugenden Signalgenerators durch manuelles oder automatisiertes Verstellen des bzw. der Verstärkungsfaktors(en) des bzw. der im Signalpfad des ersten Hochfrequenzsignals befindlichen Verstärkereinheit(en) in Relation des bzw. der Verstärkungsfaktors(en) des bzw. der im Signalpfad des zweiten Hochfrequenzsignals befindlichen Verstärkereinheit(en).The variation of the amplitude of the first high-frequency signal in relation to the amplitude of the second high-frequency signal occurs within the signal generator generating the two high-frequency signals by manual or automated adjustment of the amplification factor (s) of the amplifier unit (s) in the signal path of the first high-frequency signal Relation of the amplification factor (s) of the amplifier unit (s) located in the signal path of the second high-frequency signal.
Das automatisierte Verstellen der Phase des ersten bzw. zweiten Basisbandsignals oder des ersten bzw. zweiten Trägersignals erfolgt bei einer zeitinvarianten Phasendifferenz einmalig und bei einer zeitvarianten Phasendifferenz zeitkontinuierlich in einem bestimmten Zeitraster innerhalb eines bestimmten Zeitintervalls. Falls die beiden Hochfrequenzsignale entweder dieselbe Frequenz aufweisen oder sich in einem ganzzahligen Verhältnis zwischen ihren Frequenzen unterscheiden, die Frequenz aber über der Zeit variiert wird, so kann die Phase des ersten bzw. zweiten Basisbandsignals oder des ersten bzw. zweiten Trägersignals auch in einem bestimmten Frequenzraster innerhalb eines bestimmten Frequenzspektrums - Sweepbetrieb - zur Kompensation von frequenzabhängigen Phasendifferenzen verstellt werden. Hierbei kann die Verstellung der Phase auch entweder einmalig zu einem bestimmten Zeitpunkt oder zeitkontinuierlich in einem bestimmten Zeitraster innerhalb eines bestimmten Zeitintervalls - "dreidimensionale Phasenverstellung" - erfolgen.The automated adjustment of the phase of the first or second baseband signal or of the first or second carrier signal is carried out once at a time-invariant phase difference and at a time-variant phase difference continuously in a certain time interval within a certain time interval. If the two high-frequency signals either have the same frequency or differ in an integer ratio between their frequencies, but the frequency is varied over time, the phase of the first or second baseband signal or the first and second carrier signal in a certain frequency grid within a certain frequency spectrum - Sweepbetrieb - be adjusted to compensate for frequency-dependent phase differences. Here, the adjustment of the phase can also be either once at a specific time or continuously in a certain time frame within a certain time interval - "three-dimensional phase adjustment" - take place.
Die beiden Hochfrequenzsignale stellen jeweils (Pseudo)-Continous-Wave-Signale (Pseudo-CW-Signale) dar und weisen folglich jeweils eine konstante Amplitude und eine konstante Frequenz auf und sind mit DC-Basisbandsignalen moduliert.The two high frequency signals each represent (pseudo) continuous wave signals (pseudo CW signals) and thus each have a constant amplitude and a constant frequency and are modulated with DC baseband signals.
Falls den Amplituden der beiden Hochfrequenzsignale und damit der Amplitude des Messsignals ein störender Rauschsignalanteil überlagert ist, wird dieser Rauschsignalanteil durch Mitteln über mehrere aufeinander folgende Amplitudenwerte des Messsignals beseitigt.If a disturbing noise signal component is superimposed on the amplitudes of the two high-frequency signals and thus the amplitude of the measurement signal, this noise signal component is eliminated by averaging over a plurality of successive amplitude values of the measurement signal.
Eine durch unterschiedliche Verstärkungsfaktoren im Inphase- und Quadraturkanal des IQ-Modultors hervorgerufene Phasendrift eines Basisbandsignals in Relation zur Phase des anderen Basisbandsignals wird durch bewusstes zeitliches Wechseln der verwendeten Symbole der beiden Basisbandsignale ausgeglichen.A phase drift of a baseband signal in relation to the phase of the other baseband signal caused by different amplification factors in the in-phase and quadrature channels of the IQ modulator is compensated for by deliberate temporal changes of the symbols used for the two baseband signals.
Die Signalverknüpfungseinheit zur additiven Verknüpfung der beiden Hochfrequenzsignale ist entweder als Addierer oder als Subtrahierer realisiert. Im Fall eines Addierers wird bevorzugt ein in umgekehrter Signalpfadrichtung geschalteter ohmscher Leistungsteiler verwendet.The signal combining unit for the additive combination of the two high-frequency signals is realized either as an adder or as a subtractor. In the case of an adder, an ohmic power divider connected in the reverse signal path direction is preferably used.
Das erfindungsgemäße Verfahren und die erfindungsgemäße Vorrichtung zur Wiederherstellung einer quantisierbaren Phasenkohärenz zwischen zwei Hochfrequenzsignalen werden im Folgenden anhand der Zeichnung erläutert. Die Figuren der Zeichnung zeigen:
- Fig. 1
- ein Blockdiagramm zweier in üblicher Weise synchronisierter Signalgeneratoren,
- Fig. 2
- ein Blockdiagramm einer üblichen Vorrichtung zur Phasendifferenzmessung mit einem HF-Mischer und einem DC-Voltmeter,
- Fig. 3
- ein Blockdiagramm einer erfindungsgemäßen Vorrichtung zur Wiederherstellung einer quantisierbaren Phasenkohärenz zwischen zwei Hochfrequenzsignalen,
- Fig. 4A
- ein Zustandsdiagramm mit dem Messsignal, das in einer ersten Ausführungsform der erfindungsgemäßen Vorrichtung zur Wiederherstellung einer quantisierbaren Phasenkohärenz zwischen zwei Hochfrequenzsignalen erzeugt wird,
- Fig. 4B
- ein Zustandsdiagramm mit dem Messsignal, das in einer zweiten Ausführungsform der erfindungsgemäßen Vorrichtung zur Wiederherstellung einer quantisierbaren Phasenkohärenz zwischen zwei Hochfrequenzsignalen erzeugt wird,
- Fig. 5
- eine Schaltungsanordnung einer additiven Signalverknüpfungseinheit,
- Fig. 6A
- ein Amplitude-Phasen-Diagramm zur ersten Ausführungsform der erfindungsgemäßen Wiederherstellung einer quantisierbaren Phasenkohärenz zwischen zwei Hochfrequenzsignalen,
- Fig. 6B
- ein Amplitude-Phasen-Diagramm zur zweiten Ausführungsform der erfindungsgemäßen Wiederherstellung einer quantisierbaren Phasenkohärenz zwischen zwei Hochfrequenzsignalen,
- Fig. 7
- ein Amplituden-Amplitudendifferenz-Diagramm zur erfindungsgemäßen Wiederherstellung einer quantisierbaren Phasenkohärenz zwischen zwei Hochfrequenzsignalen,
- Fig. 8A
- ein Flussdiagramm eines Beispiels zur Wiederherstellung einer quantisierbaren Phasenkohärenz zwischen zwei Hochfrequenzsignalen und
- Fig. 8B
- ein Flussdiagramm einer Ausführungsform eines erfindungsgemäßen Verfahrens zur Wiederherstellung einer quantisierbaren Phasenkohärenz zwischen zwei Hochfrequenzsignalen.
- Fig. 1
- a block diagram of two commonly synchronized signal generators,
- Fig. 2
- a block diagram of a conventional device for phase difference measurement with an RF mixer and a DC voltmeter,
- Fig. 3
- a block diagram of a device according to the invention for restoring a quantizable phase coherence between two high-frequency signals,
- Fig. 4A
- a state diagram with the measurement signal, which is generated in a first embodiment of the inventive apparatus for restoring a quantizable phase coherence between two high-frequency signals,
- Fig. 4B
- a state diagram with the measurement signal, which is generated in a second embodiment of the inventive apparatus for restoring a quantizable phase coherence between two high-frequency signals,
- Fig. 5
- a circuit arrangement of an additive signal linking unit,
- Fig. 6A
- an amplitude-phase diagram for the first embodiment of the inventive restoration of a quantizable phase coherence between two high-frequency signals,
- Fig. 6B
- an amplitude-phase diagram for the second embodiment of the inventive restoration of a quantizable phase coherence between two high-frequency signals,
- Fig. 7
- an amplitude-amplitude difference diagram for restoring a quantizable phase coherence according to the invention between two high-frequency signals,
- Fig. 8A
- a flowchart of an example for restoring a quantizable phase coherence between two high-frequency signals and
- Fig. 8B
- a flowchart of an embodiment of a method according to the invention for restoring a quantizable phase coherence between two high-frequency signals.
Erfindungsgemäß werden, wie in
Im Fall einer als Addierer geschalteten Signalverknüpfungseinheit 13 wird ein symmetrisch aufgebauter ohmscher Leistungsteiler eingesetzt, der gemäß
Die Amplitude des Messsignals HFOut wird von einem Spektrumanalysator 14 gemessen. Sämtlich in der erfindungsgemäßen Vorrichtung zur Wiederherstellung einer quantisierbaren Phasenkohärenz zwischen zwei Hochfrequenzsignalen verwendeten Stecker weisen äquivalent zur Signalverknüpfungseinheit 13 ein optimiertes Phasenübertragungsverhalten - minimierte Phasenverschiebungen - auf.The amplitude of the measurement signal HF Out is measured by a
Das Ausgangssignal HFOut der ersten Ausführungsform der Signalverknüpfungseinheit 13 - Addierer - ergibt sich gemäß Gleichung (3), wobei die Amplitude A des ersten HF-Signals HF 1 und die Amplitude B des zweiten HF-Signals HF2 im ersten Schritt identisch zu L angenommen wird. 
Das Messsignal HFOut gemäß Gleichung (3) ergibt sich gemäß
Die Amplituden dieser beiden zueinander orthogonalen Vektoren betragen jeweils L·(1+cos(ϕ)) und L·sin(ϕ). Die Amplitude ![]()
![]()
![]()
![]()
Beträgt folglich die Phasendifferenz ϕ zwischen den beiden Hochfrequenzsignalen HF 1 und HF 2 0°, so ergibt sich für die Amplitude ![]()
![]()
![]()
![]()
![]()
![]()
Wird durch bestimmte Maßnahmen, die weiter unten noch im Detail ausgeführt werden, die Phase eines der beiden Hochfrequenzsignale in Relation zur Phase des anderen Hochfrequenzsignals soweit variiert, dass die Amplitude des Messsignals HFOut ihr Minimum auf Dauer erreicht, so weisen die beiden Hochfrequenzsignale HF 1 und HF 2 gemäß
Wird in der zweiten Ausführungsform der Signalverknüpfungseinheit 13 dagegen ein Subtrahierer verwendet, so ergibt sich für das Ausgangssignal HFOut die Beziehung gemäß Gleichung (5), wobei auch hier im ersten Schritt die Amplitude A des ersten HF-Signals HF 1 und die Amplitude B des zweiten HF-Signals HF 2 identisch zu L angenommen wird. 
Die Amplitude ![]()

![]()
Das Messsignal HFOut gemäß Gleichung (5) ergibt sich gemäß
Die Amplituden dieser beiden zueinander orthogonalen Vektoren betragen jeweils L·(1-cos(ϕ) und L·sin(ϕ). Beträgt folglich die Phasendifferenz ϕ zwischen den beiden Hochfrequenzsignalen HF 1 und HF 2 0°, so ergibt sich für die Amplitude ![]()
![]()
![]()
![]()
Wird durch bestimmte Maßnahmen, die weiter unten noch im Detail ausgeführt werden, die Phase eines der beiden Hochfrequenzsignale in Relation zur Phase des anderen Hochfrequenzsignals soweit variiert, dass die Amplitude des Messsignals HFOut ihr Minimum auf Dauer erreicht, so weisen die beiden Hochfrequenzsignale HF 1 und HF 2 gemäß
Ist die Amplitude A des ersten HF-Signals HF 1 nicht identisch zur Amplitude B des zweiten HF-Signals HF 2, so ergibt sich im Fall einer als Summierer realisierten Signalverknüpfungseinheit 13 ausgehend von Gleichung (4) eine Beziehung für die Amplitude ![]()
![]()
![]()

![]()
![]()
![]()
![]()
![]()
Während im Fall einer als Summierer realisierten Signalverknüpfungseinheit 13 das Minimum der Amplitude ![]()
![]()
![]()
![]()
![]()
![]()
Die Bestimmung des Minimums der Amplitude HFOut des Messsignals HFOut bei den von Null verschiedenen Ordinatenwerten ![]()
![]()
![]()
![]()
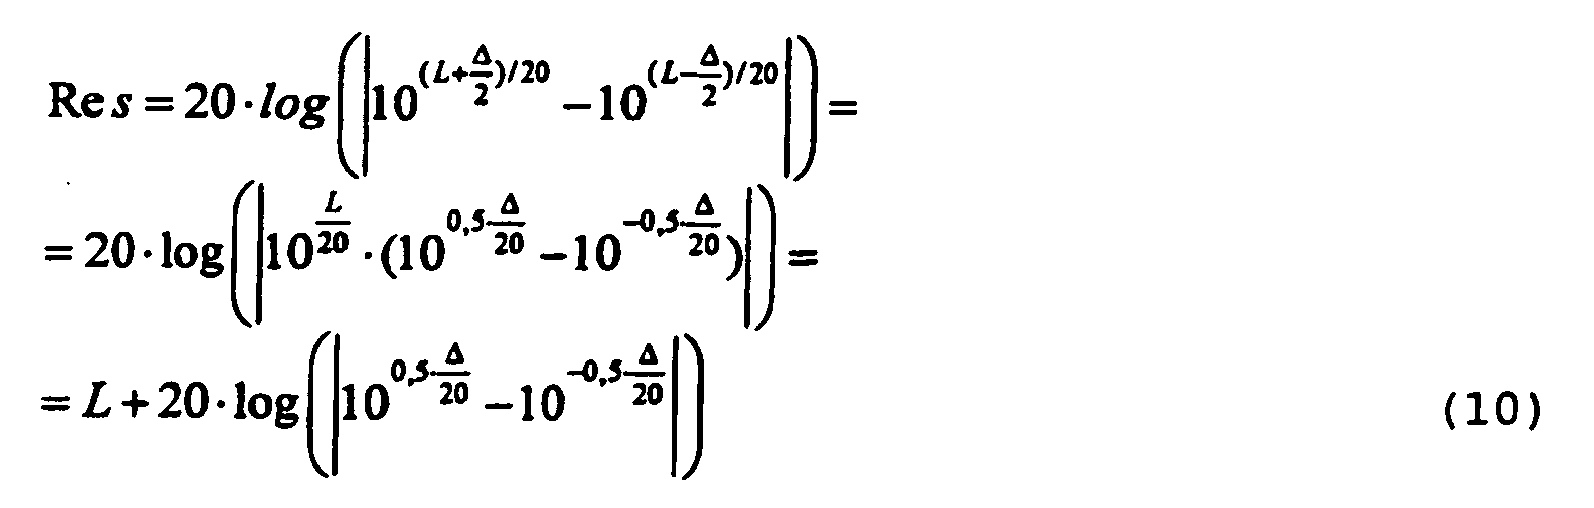
Hierzu müssen die beiden Amplituden A und B des ersten und zweiten Hochfrequenzsignals HF 1 und HF 2, die üblicherweise im logarithmischen Maßstab angegeben werden, in einen linearen Maßstab überführt werden, um anschließend eine Amplitude Res des Restsignals aus der Differenz der im linearen Maßstab vorliegenden Amplituden A und B des ersten und zweiten Hochfrequenzsignals HF 1 und HF 2 im linearen Maßstab zu berechnen. Schließlich erfolgt daraufhin eine Logarithmierung der im linearen Maßstab vorliegenden Amplitude Res des Restsignals. Die im logarithmischen Maßstab vorliegende Amplitude Res des Restsignals aus der Differenz der im linearen Maßstab vorliegenden Amplituden A und B des ersten und zweiten Hochfrequenzsignals HF1 und HF2 ergibt sich folglich gemäß Gleichung (9). ![]()
![]()
Unter der Annahme, dass der Mittelwert zwischen den beiden Amplituden A und B des ersten und zweiten Hochfrequenzsignals HF 1 und HF 2 der Größe L entspricht und die beiden Amplituden A und B des ersten und zweiten Hochfrequenzsignals HF 1 und HF 2 jeweils einen Abstand ![]()
![]()
In
Man erkennt aus
Das in ![]()
![]()
Im darauffolgenden Verfahrensschritt S20 wird in der ersten Ausführungsform des erfindungsgemäßen Verfahrens die Phase des ersten Hochfrequenzsignals HF 1 in Relation zur Phase des zweiten Hochfrequenzsignals HF2 solange variiert, bis im Spektrumanalysator 14 für die Amplitude ![]()
![]()
Die Variation der Phase des ersten Hochfrequenzsignals HF 1 in Relation zur Phase des zweiten Hochfrequenzsignals HF 2 kann entweder durch Verstellen der Phase des zum ersten Hochfrequenzsignals HF 1 gehörigen ersten Basisbandsignals BB1 in Relation zur Phase des zum zweiten Hochfrequenzsignals HF 2 gehörigen zweiten Basisbandsignals BB2 mittels des im Signalpfad des ersten Basisbandsignals BB 1 befindlichen Phasenschiebers 151 bzw. des im Signalpfad des zweiten Basisbandsignals BB2 befindlichen Phasenschiebers 152 oder alternativ durch Verstellen der Phase des zum ersten Hochfrequenzsignals HF 1 gehörigen ersten Trägersignals TR 1 in Relation zur Phase des zum zweiten Hochfrequenzsignals HF 2 gehörigen zweiten Trägersignals TR 2 mittels des im Signalpfad des ersten Trägersignals TR 1 befindlichen Phasenschiebers 161 bzw. des im Signalpfad des zweiten Trägersignals TR 2 befindlichen Phasenschiebers 162 erfolgen.The variation of the phase of the first high-frequency signal HF 1 in relation to the phase of the second high-frequency signal HF 2, either by adjusting the phase of the belonging to the first high-frequency signal HF 1 first baseband signal BB 1 in relation to the phase of the corresponding second high-frequency signal HF 2 second baseband signal BB 2 by means of the present in the signal path of the first baseband signal BB 1 phase shifter 15 1 and the phase shifter 15 2 or, alternatively, by adjusting the phase of the belonging to the first high-frequency signal HF 1 first carrier signal TR 1 in relation to the phase of the located in the signal path of the second baseband signal BB 2 second high-frequency signal HF 2 corresponding second carrier signal TR 2 by means of the present in the signal path of the first carrier signal TR 1 phase shifter 16 of the phase shifter 1 and 16 2 located in the signal path of the second carrier signal TR. 2
In der Ausführungsform des erfindungsgemäßen Verfahrens wird der Verfahrensschritt S20 durch die im Flussdiagramm der
Im Verfahrensschritt S21 der Ausführungsform des erfindungsgemäßen Verfahrens wird analog zu Verfahrensschritt S20 in ![]()
![]()
![]()
![]()
Ausgehend von der in Verfahrensschritt S21 zum Näherungswert des Amplitudenminimums ermittelten Phase des ersten Hochfrequenzsignals HF 1 in Relation zur Phase des zweiten Hochfrequenzsignals HF2 wird diese im nächsten Verfahrensschritt S22 bis zu einer ersten Phase ϕ1 reduziert, bei der für die Amplitude ![]()
![]()
Analog wird im darauffolgenden Verfahrensschritt S23 ausgehend von der in Verfahrensschritt S21 zum Näherungswert des Amplitudenminimums ermittelten Phase des ersten Hochfrequenzsignals HF 1 in Relation zur Phase des zweiten Hochfrequenzsignals HF2 diese Phase des ersten Hochfrequenzsignals HF 1 in Relation zur Phase des zweiten Hochfrequenzsignals HF 2 bis zu einer zweiten Phase ϕ2 erhöht, bei der für die Amplitude ![]()
![]()
In Verfahrensschritt S24 wird der exakte Wert für die Phase des ersten Hochfrequenzsignals HF 1 in Relation zur Phase des zweiten Hochfrequenzsignals HF 2 beim exakten Minimum der Amplitude ![]()
![]()
Der auf den Verfahrensschritt S20 folgende Verfahrenschritt S30 beinhaltet die sukzessive Variation der Amplitude A des ersten Hochfrequenzsignals HF 1 in Relation zur Amplitude B des zweiten Hochfrequenzsignals HF 2, um eventuell - im Fall des Vorliegens unterschiedlicher Amplituden A und B des ersten Hochfrequenzsignals HF 1 und des zweiten Hochfrequenzsignals HF2 - ein neues Minimum der Amplitude HFOut des Messsignals HFOut zu ermitteln, das gegenüber dem durch Variation der Phase gewonnenen Amplitudenminimum des Messsignals HFOut minimiert ist.The method step S30 following the method step S20 involves the successive variation of the amplitude A of the first high-frequency signal HF 1 in relation to the amplitude B of the second high-frequency signal HF 2 to possibly - in the case of different amplitudes A and B of the first high-frequency signal HF 1 and the second High frequency signal HF 2 - to determine a new minimum of the amplitude HF Out of the measurement signal HF Out , which is minimized compared to the obtained by variation of the phase amplitude minimum of the measurement signal HF Out .
Die Variation der Amplitude A des ersten Hochfrequenzsignals HF 1 in Relation zur Amplitude B des zweiten Hochfrequenzsignals HF 2 erfolgt durch Verstellen des Verstärkungsfaktors des im Signalpfad des ersten Hochfrequenzsignals HF 1 befindlichen Leistungsverstärkers 51 in Relation zum Verstärkungsfaktor des im Signalpfad des zweiten Hochfrequenzsignals HF 2 befindlichen Leistungsverstärkers 52 oder durch Zuschalten von Widerstandselementen im elektronisch schaltbaren Dämpfungsglied 61 des Signalpfads des ersten Hochfrequenzsignals HF 1 in Relation zum Zuschalten von Widerstandselementen im elektronisch schaltbaren Dämpfungsglied 62 im Signalpfad des zweiten Hochfrequenzsignals HF 2.The variation of the amplitude A of the first high-frequency signal HF 1 in relation to the amplitude B of the second high-frequency signal HF 2 is effected by adjusting the gain of the
Im darauffolgenden Verfahrensschritt S40 wird festgestellt, ob die für die Wiederherstellung der quantisierbaren Phasenkohärenz zwischen den beiden Hochfrequenzsignalen HF 1 und HF 2 erforderliche Phasengenauigkeit durch die in den vorherigen Verfahrensschritten ermittelte Phase des ersten Hochfrequenzsignals HF 1 in Relation zur Phase des zweiten Hochfrequenzsignals HF2 erreicht ist. Genügt die Genauigkeit der ermittelten Phase des ersten Hochfrequenzsignals HF 1 in Relation zur Phase des zweiten Hochfrequenzsignals HF 2 den Anforderungen nicht, so wird wiederholt in Verfahrensschritt S20 die Phase des ersten Hochfrequenzsignals HF 1 in Relation zur Phase des zweiten Hochfrequenzsignals HF 2 geringfügig variiert, um ein Ergebnis mit erhöhter Genauigkeit zu erzielen. Andernfalls liegt das gewünschte Ergebnis vor und das Verfahren ist beendet.In the subsequent method step S40, it is determined whether the phase accuracy required for restoring the quantizable phase coherence between the two high-frequency signals HF 1 and HF 2 is achieved by the phase of the first high-frequency signal HF 1 determined in the previous method steps in relation to the phase of the second high-frequency signal HF 2 , If the accuracy of the determined phase of the first high-frequency signal HF 1 in relation to the phase of the second high-frequency signal HF 2 does not meet the requirements, the phase of the first high-frequency signal HF 1 is repeatedly varied slightly in step S20 in relation to the phase of the second high-frequency signal HF 2 to achieve a result with increased accuracy. Otherwise the desired result is available and the procedure is finished.
Claims (13)
- A method for manufacturing a quantisable phase coherence between a first and second high-frequency signal (HF 1,HF 2 ) with the following method steps:- additive linking of the first and second high-frequency signal (HF 1,HF 2 ) to form a measured signal (HFOut) and measurement of the amplitude (HFOut) of the measured signal (HFOut) with a spectrum analyser (14),- successive variation of the phase of the first high-frequency signal (HF 1) relative to the phase of the second high-frequency signal (HF2) until the amplitude (HFOut ) of the measured signal (HFOut) provides a minimal value,
characterised in that
the phase of the first high-frequency signal (HF 1 ) associated with the minimum of the amplitude (Out ) of the measured signal (HFOut ) relative to the phase of the second high-frequency signal (HF2) is determined as a mean value of a first phase (ϕ1) of the first high-frequency signal (HF 1) determined at a freely selectable amplitude value (C), which is reduced by comparison with a phase determined at an approximate value for the minimum of the amplitude ( Out) of the measured signal (HFOut), and a second phase (ϕ2) of the first high-frequency signal (HF1) determined at the freely selectable amplitude value (C) of the measured signal (HFOut) relative to the phase of the second high-frequency signal (HF 2 ), which is increased by comparison with a phase determined at an approximate value for the minimum of the amplitude (Out) of the measured signal (HFOut).
 - The method according to claim 1,
characterised in that
the additive linking of the first and second high-frequency signal (HF 1 ,HF 2) to form a measured signal (HFOut) contains a summation or a subtraction of the first and second high-frequency signal (HF 1,HF 2) . - The method according to claim 1 or 2,
characterised in that,
in alternation with the successive variation of the phase of the first high-frequency signal (HF 1) relative to the phase of the second high-frequency signal (HF 2), a successive variation of the amplitude (A) of the first high-frequency signal (HF 1) relative to the amplitude (B) of the second high-frequency signal (HF2) is implemented until the amplitude (HFOut) of the measured signal (HFOut) provides a minimum value. - The method according to any one of claims 1 to 3,
characterised in that,
for the determination of the phase of the first high-frequency signal (HF 1 ) associated with the minimum of the amplitude (HFOut ) of the measured signal (HFOut) relative to the phase of the second high-frequency signal (HF 2), the following method steps are implemented:- determination of an approximate value for the phase of the first high-frequency signal (HF 1) associated with the minimum of the amplitude (Out) of the measured signal (HFOut ) relative to the phase of the second high-frequency signal (HF 2),- determination of a first phase (ϕ1) by reducing the phase of the first high-frequency signal (HF 1 ) relative to the phase of the second high-frequency signal (HF 2) from the determined approximate value of the phase of the first high-frequency signal (HF 1) relative to the phase of the second high-frequency signal (HF2) until a freely selectable amplitude value (C) of the measured signal (HFOut ) is reached,- determination of a second phase (ϕ2) by increasing the phase of the first high-frequency signal (HF 1) relative to the phase of the second high-frequency signal (HF2) from the determined approximate value of the phase of the first high-frequency signal (HF 1) relative to the phase of the second high-frequency signal (HF 2) until the freely selectable amplitude value (C) of the measured signal (HFOut) is reached, and- determination of an exact value of the phase of the first high-frequency signal (HF 1) relative to the phase of the second high-frequency signal (HF 2) as a mean value of the determined first and second phase (ϕ1,ϕ2) of the first high-frequency signal. - The method according to any one of claims 1 to 4,
characterised in that
the successive variation of the phase of the first high-frequency signal (HF 1 ) relative to the phase of the second high-frequency signal (HF2 ) is implemented in a signal generator (10) by adjusting the phase of the first carrier signal (TR 1) associated with the first high-frequency signal (HF 1) in relation to the phase of the second carrier signal (TR 2) associated with the second high-frequency signal (HF 2) or by adjusting the phase of the first baseband signal (BB 1) associated with the first high-frequency signal (HF 1) in relation to the phase of the second baseband signal (BB 2) associated with the second high-frequency signal (HF 2). - The method according to any one of claims 1 to 5,
characterised in that
the successive variation of the amplitude (A) of the first high-frequency signal (HF1 ) to the amplitude (B) of the second high-frequency signal (HF2) is implemented in a signal generator (10) by adjusting the amplification factor of amplifiers (51, 61) disposed in a signal path of the first high-frequency signal (HF 1) in relation to the amplification factor of amplifiers (52, 62) disposed in a signal path of the second high-frequency signal (HF 2). - The method according to claim 5 or 6,
characterised in that
the automated adjustment of the phase of the first or respectively second baseband signal (BB 1,BB 2), of the phase of the first or respectively second carrier signal (TR1 ,TR 2) and/or of the amplification factor of the amplifiers (51, 61, 52, 62) disposed in the signal path of the first or respectively second high-frequency signal (HF 1,HF 2) is implemented uniquely, continuously in a given time raster within a given time interval and/or in a given frequency raster within a given frequency spectrum. - The method according to any one of claims 5 to 7,
characterised in that
the first and second high-frequency signal (HF 1,HF 2) in each case provides a constant amplitude and frequency, and the first and second baseband signal (BB 1,BB 2) in each case is a DC signal. - The method according to any one of claims 1 to 8,
characterised in that
the amplitude of the measured signal (HFOut ) is averaged for the suppression of a superimposed noise component. - The method according to claim 5,
characterised in that,
for the first and second baseband signal (BB 1,BB 2) in time alternation, several different symbols of the symbol alphabet used in a modulator of the signal generator (10) are used for the time averaging of a phase drift of the phase of the first and/or second baseband signal (BB 1,BB 2) on the basis of different level amplifications between inphase and quadrature channel. - A device for manufacturing a quantisable phase coherence between a first and second high-frequency signal (HF,HF 2) set up for the implementation of the method according to any one of claims 1 to 10, with
a signal generator (10) generating a first and second high-frequency signal (HF 1,HF 2),
a signal-linking unit (13) linking the first and second high-frequency signal (HF 1,HF 2) in an additive manner to a measured signal (HF Out), and a spectrum analyser (14) measuring the measured signal (HFOut ). - The device according to claim 11,
characterised in that
the signal linking unit (13) is an adder or a subtractor. - The device according to claim 12,
characterised in that
the adder is an ohmic power splitter connected in reverse signal-path direction.
Priority Applications (1)
| Application Number | Priority Date | Filing Date | Title |
|---|---|---|---|
| EP20080018961 EP2149996B1 (en) | 2008-07-31 | 2008-10-30 | Method and device to manufacture a quantifiable phase coherence between two high frequency signals |
Applications Claiming Priority (2)
| Application Number | Priority Date | Filing Date | Title |
|---|---|---|---|
| EP08013745 | 2008-07-31 | ||
| EP20080018961 EP2149996B1 (en) | 2008-07-31 | 2008-10-30 | Method and device to manufacture a quantifiable phase coherence between two high frequency signals |
Publications (2)
| Publication Number | Publication Date |
|---|---|
| EP2149996A1 EP2149996A1 (en) | 2010-02-03 |
| EP2149996B1 true EP2149996B1 (en) | 2011-01-26 |
Family
ID=40552003
Family Applications (1)
| Application Number | Title | Priority Date | Filing Date |
|---|---|---|---|
| EP20080018961 Active EP2149996B1 (en) | 2008-07-31 | 2008-10-30 | Method and device to manufacture a quantifiable phase coherence between two high frequency signals |
Country Status (2)
| Country | Link |
|---|---|
| EP (1) | EP2149996B1 (en) |
| DE (1) | DE502008002482D1 (en) |
Cited By (2)
| Publication number | Priority date | Publication date | Assignee | Title |
|---|---|---|---|---|
| US20210195545A1 (en) * | 2019-12-18 | 2021-06-24 | GiaX GmbH | Apparatus and method for detecting group delay information and apparatus and method for transmitting a measurement signal via a transmission medium |
| US11265090B2 (en) | 2019-11-08 | 2022-03-01 | Rohde & Schwarz Gmbh & Co. Kg | Method and system for determining and/or adjusting phases of at least two electrical signals |
Family Cites Families (4)
| Publication number | Priority date | Publication date | Assignee | Title |
|---|---|---|---|---|
| DE10130687A1 (en) | 2001-06-26 | 2003-01-02 | Rohde & Schwarz | Measuring system with a reference signal between a signal generator and a signal analyzer |
| DE10219340B4 (en) * | 2002-04-30 | 2014-02-20 | Rohde & Schwarz Gmbh & Co. Kg | Method and device for measuring intermodulation distortion |
| DE102006057316B4 (en) * | 2006-12-05 | 2020-12-03 | Rohde & Schwarz GmbH & Co. Kommanditgesellschaft | Measurement method and device for assessing an OFDM multi-antenna transmitter |
| DE102007013757A1 (en) * | 2007-03-22 | 2008-09-25 | Rohde & Schwarz Gmbh & Co. Kg | Method and measuring device for measuring emissions with active carrier suppression |
-
2008
- 2008-10-30 EP EP20080018961 patent/EP2149996B1/en active Active
- 2008-10-30 DE DE200850002482 patent/DE502008002482D1/en active Active
Cited By (3)
| Publication number | Priority date | Publication date | Assignee | Title |
|---|---|---|---|---|
| US11265090B2 (en) | 2019-11-08 | 2022-03-01 | Rohde & Schwarz Gmbh & Co. Kg | Method and system for determining and/or adjusting phases of at least two electrical signals |
| US20210195545A1 (en) * | 2019-12-18 | 2021-06-24 | GiaX GmbH | Apparatus and method for detecting group delay information and apparatus and method for transmitting a measurement signal via a transmission medium |
| US11729734B2 (en) * | 2019-12-18 | 2023-08-15 | GiaX GmbH | Apparatus and method for detecting group delay information and apparatus and method for transmitting a measurement signal via a transmission medium |
Also Published As
| Publication number | Publication date |
|---|---|
| EP2149996A1 (en) | 2010-02-03 |
| DE502008002482D1 (en) | 2011-03-10 |
Similar Documents
| Publication | Publication Date | Title |
|---|---|---|
| DE102012106101B4 (en) | Receiver circuits, circuitry and methods for testing one or more receive paths of a receiver circuit | |
| EP2376931B1 (en) | Method and device for measuring group delay caused by a device under test | |
| EP1759508B1 (en) | Method and device for the simultaneous compensation of signal errors in iq-modulators | |
| US9933467B1 (en) | Group delay measurement apparatus and method | |
| DE10023734A1 (en) | Quadrature demodulator, adds user signal to pseudo=noise giving pseudo=noise superimposed signal, mixes this with local signal giving converted signal, multiplies this with pseudo=noise giving correlated signal, then integrates | |
| DE102013213657A1 (en) | Method and device for measuring the amplitude and / or phase noise of a signal | |
| DE102015121297A1 (en) | Distance-simulating radar target | |
| DE102021104133A1 (en) | METHOD AND DEVICE FOR IQ TRANSMIT MISMAP CALIBRATION | |
| EP2926152A1 (en) | Method for locating defective points in a hf signal transmission path | |
| EP1782085B1 (en) | Method for measuring the phase jitter of a high-frequency signal, and measuring unit for carrying out this method | |
| EP2149996B1 (en) | Method and device to manufacture a quantifiable phase coherence between two high frequency signals | |
| DE69831789T2 (en) | CALIBRATION OF AN N-PORT RECEIVER | |
| DE112004000516B4 (en) | Apparatus for orthogonal modulation, method, program, recording medium and modulation device | |
| DE2827422C3 (en) | Method and circuit arrangement for measuring characteristic values of a quadrupole, in particular a data transmission link | |
| EP1273098B1 (en) | Method for determining the parameters of an n-gate | |
| DE102004050912A1 (en) | Method and device for increasing the dynamic range and the measuring accuracy of a measuring device for spectrum and / or network analysis | |
| DE19531998C2 (en) | Method and device for compensating the DC voltage component and for correcting the quadrature error of a baseband conversion device of radio receivers for a received signal to be detected | |
| DE102014116338A1 (en) | METHOD AND DEVICES FOR DETERMINING INTERMODULATION DISTORTIONS | |
| DE112004001695T5 (en) | An apparatus for generating an error correction signal and a quadrature modulator, which is equipped with the device for generating an error correction signal | |
| EP1626285A1 (en) | Method for Determining the Complex Spectral Lines of a Signal | |
| DE19926101B4 (en) | Arrangement for error compensation when converting high-frequency signals into the baseband | |
| DE102005061337B3 (en) | Phase-noise measuring signal`s frequency offset and/or frequency drift compensating method, involves determining frequency offset and/or drift by maximum-likelihood-estimator by minimizing error squares between phase characteristics | |
| DE10022853A1 (en) | Parameter determining method for high frequency power amplifier involves plotting amplitudes of series of modulated signals, and obtaining time breaks through cross correlation of signals | |
| DE877046C (en) | Substitution method for phase and amplitude measurement of alternating voltages | |
| DE10342583B4 (en) | A method for determining carrier residue in an arrangement comprising a vector modulator |
Legal Events
| Date | Code | Title | Description |
|---|---|---|---|
| PUAI | Public reference made under article 153(3) epc to a published international application that has entered the european phase |
Free format text: ORIGINAL CODE: 0009012 |
|
| 17P | Request for examination filed |
Effective date: 20090519 |
|
| AK | Designated contracting states |
Kind code of ref document: A1 Designated state(s): AT BE BG CH CY CZ DE DK EE ES FI FR GB GR HR HU IE IS IT LI LT LU LV MC MT NL NO PL PT RO SE SI SK TR |
|
| AX | Request for extension of the european patent |
Extension state: AL BA MK RS |
|
| GRAP | Despatch of communication of intention to grant a patent |
Free format text: ORIGINAL CODE: EPIDOSNIGR1 |
|
| AKX | Designation fees paid |
Designated state(s): DE |
|
| GRAS | Grant fee paid |
Free format text: ORIGINAL CODE: EPIDOSNIGR3 |
|
| GRAA | (expected) grant |
Free format text: ORIGINAL CODE: 0009210 |
|
| AK | Designated contracting states |
Kind code of ref document: B1 Designated state(s): DE |
|
| REF | Corresponds to: |
Ref document number: 502008002482 Country of ref document: DE Date of ref document: 20110310 Kind code of ref document: P |
|
| REG | Reference to a national code |
Ref country code: DE Ref legal event code: R096 Ref document number: 502008002482 Country of ref document: DE Effective date: 20110310 |
|
| PLBE | No opposition filed within time limit |
Free format text: ORIGINAL CODE: 0009261 |
|
| STAA | Information on the status of an ep patent application or granted ep patent |
Free format text: STATUS: NO OPPOSITION FILED WITHIN TIME LIMIT |
|
| 26N | No opposition filed |
Effective date: 20111027 |
|
| REG | Reference to a national code |
Ref country code: DE Ref legal event code: R097 Ref document number: 502008002482 Country of ref document: DE Effective date: 20111027 |
|
| P01 | Opt-out of the competence of the unified patent court (upc) registered |
Effective date: 20230525 |
|
| PGFP | Annual fee paid to national office [announced via postgrant information from national office to epo] |
Ref country code: DE Payment date: 20231018 Year of fee payment: 16 |