EP2093573A2 - Automatic analyzer - Google Patents
Automatic analyzer Download PDFInfo
- Publication number
- EP2093573A2 EP2093573A2 EP09001326A EP09001326A EP2093573A2 EP 2093573 A2 EP2093573 A2 EP 2093573A2 EP 09001326 A EP09001326 A EP 09001326A EP 09001326 A EP09001326 A EP 09001326A EP 2093573 A2 EP2093573 A2 EP 2093573A2
- Authority
- EP
- European Patent Office
- Prior art keywords
- measurement
- quality control
- automatic analyzer
- variation
- uncertainty
- Prior art date
- Legal status (The legal status is an assumption and is not a legal conclusion. Google has not performed a legal analysis and makes no representation as to the accuracy of the status listed.)
- Granted
Links
- 238000005259 measurement Methods 0.000 claims abstract description 107
- 239000013062 quality control Sample Substances 0.000 claims description 16
- 238000004364 calculation method Methods 0.000 claims description 13
- 238000003908 quality control method Methods 0.000 abstract description 71
- 238000000034 method Methods 0.000 abstract description 26
- 239000003153 chemical reaction reagent Substances 0.000 abstract description 23
- 239000000126 substance Substances 0.000 abstract description 13
- 239000007788 liquid Substances 0.000 abstract description 5
- 238000012423 maintenance Methods 0.000 abstract description 2
- 239000000523 sample Substances 0.000 description 21
- 238000012360 testing method Methods 0.000 description 9
- DDRJAANPRJIHGJ-UHFFFAOYSA-N creatinine Chemical compound CN1CC(=O)NC1=N DDRJAANPRJIHGJ-UHFFFAOYSA-N 0.000 description 8
- 230000002159 abnormal effect Effects 0.000 description 6
- LEHOTFFKMJEONL-UHFFFAOYSA-N Uric Acid Chemical compound N1C(=O)NC(=O)C2=C1NC(=O)N2 LEHOTFFKMJEONL-UHFFFAOYSA-N 0.000 description 5
- TVWHNULVHGKJHS-UHFFFAOYSA-N Uric acid Natural products N1C(=O)NC(=O)C2NC(=O)NC21 TVWHNULVHGKJHS-UHFFFAOYSA-N 0.000 description 5
- 229940116269 uric acid Drugs 0.000 description 5
- 102100036475 Alanine aminotransferase 1 Human genes 0.000 description 4
- 108010082126 Alanine transaminase Proteins 0.000 description 4
- QGZKDVFQNNGYKY-UHFFFAOYSA-N Ammonia Chemical compound N QGZKDVFQNNGYKY-UHFFFAOYSA-N 0.000 description 4
- 108010003415 Aspartate Aminotransferases Proteins 0.000 description 4
- 102000004625 Aspartate Aminotransferases Human genes 0.000 description 4
- LCTONWCANYUPML-UHFFFAOYSA-N Pyruvic acid Chemical compound CC(=O)C(O)=O LCTONWCANYUPML-UHFFFAOYSA-N 0.000 description 4
- 238000004458 analytical method Methods 0.000 description 4
- 238000011088 calibration curve Methods 0.000 description 4
- 229940109239 creatinine Drugs 0.000 description 4
- 230000007423 decrease Effects 0.000 description 4
- 238000001514 detection method Methods 0.000 description 4
- 230000003203 everyday effect Effects 0.000 description 4
- JVTAAEKCZFNVCJ-UHFFFAOYSA-N lactic acid Chemical compound CC(O)C(O)=O JVTAAEKCZFNVCJ-UHFFFAOYSA-N 0.000 description 4
- 210000002966 serum Anatomy 0.000 description 4
- 239000004382 Amylase Substances 0.000 description 3
- 102000013142 Amylases Human genes 0.000 description 3
- 108010065511 Amylases Proteins 0.000 description 3
- 102000004420 Creatine Kinase Human genes 0.000 description 3
- 108010042126 Creatine kinase Proteins 0.000 description 3
- 235000019418 amylase Nutrition 0.000 description 3
- 238000003909 pattern recognition Methods 0.000 description 3
- 238000009666 routine test Methods 0.000 description 3
- 108010088751 Albumins Proteins 0.000 description 2
- 102000009027 Albumins Human genes 0.000 description 2
- 102000002260 Alkaline Phosphatase Human genes 0.000 description 2
- 108020004774 Alkaline Phosphatase Proteins 0.000 description 2
- 108010074051 C-Reactive Protein Proteins 0.000 description 2
- 102100032752 C-reactive protein Human genes 0.000 description 2
- 102000003914 Cholinesterases Human genes 0.000 description 2
- 108090000322 Cholinesterases Proteins 0.000 description 2
- 238000008789 Direct Bilirubin Methods 0.000 description 2
- 101710107035 Gamma-glutamyltranspeptidase Proteins 0.000 description 2
- 101710173228 Glutathione hydrolase proenzyme Proteins 0.000 description 2
- 108010023302 HDL Cholesterol Proteins 0.000 description 2
- 102000003855 L-lactate dehydrogenase Human genes 0.000 description 2
- 108700023483 L-lactate dehydrogenases Proteins 0.000 description 2
- 108010028554 LDL Cholesterol Proteins 0.000 description 2
- 238000008214 LDL Cholesterol Methods 0.000 description 2
- 102000002704 Leucyl aminopeptidase Human genes 0.000 description 2
- 108010004098 Leucyl aminopeptidase Proteins 0.000 description 2
- 238000008050 Total Bilirubin Reagent Methods 0.000 description 2
- 230000032683 aging Effects 0.000 description 2
- 229910021529 ammonia Inorganic materials 0.000 description 2
- 239000012472 biological sample Substances 0.000 description 2
- 210000004369 blood Anatomy 0.000 description 2
- 239000008280 blood Substances 0.000 description 2
- 239000011575 calcium Substances 0.000 description 2
- HVYWMOMLDIMFJA-DPAQBDIFSA-N cholesterol Chemical compound C1C=C2C[C@@H](O)CC[C@]2(C)[C@@H]2[C@@H]1[C@@H]1CC[C@H]([C@H](C)CCCC(C)C)[C@@]1(C)CC2 HVYWMOMLDIMFJA-DPAQBDIFSA-N 0.000 description 2
- 229940048961 cholinesterase Drugs 0.000 description 2
- 230000002354 daily effect Effects 0.000 description 2
- 230000000694 effects Effects 0.000 description 2
- 235000021588 free fatty acids Nutrition 0.000 description 2
- 102000006640 gamma-Glutamyltransferase Human genes 0.000 description 2
- 229940099472 immunoglobulin a Drugs 0.000 description 2
- 229940027941 immunoglobulin g Drugs 0.000 description 2
- 238000007689 inspection Methods 0.000 description 2
- 238000011835 investigation Methods 0.000 description 2
- 235000014655 lactic acid Nutrition 0.000 description 2
- 239000004310 lactic acid Substances 0.000 description 2
- 150000003904 phospholipids Chemical class 0.000 description 2
- 229940107700 pyruvic acid Drugs 0.000 description 2
- 238000013214 routine measurement Methods 0.000 description 2
- 239000011734 sodium Substances 0.000 description 2
- 210000002700 urine Anatomy 0.000 description 2
- NNJPGOLRFBJNIW-HNNXBMFYSA-N (-)-demecolcine Chemical compound C1=C(OC)C(=O)C=C2[C@@H](NC)CCC3=CC(OC)=C(OC)C(OC)=C3C2=C1 NNJPGOLRFBJNIW-HNNXBMFYSA-N 0.000 description 1
- OYPRJOBELJOOCE-UHFFFAOYSA-N Calcium Chemical compound [Ca] OYPRJOBELJOOCE-UHFFFAOYSA-N 0.000 description 1
- 108010028780 Complement C3 Proteins 0.000 description 1
- 102000016918 Complement C3 Human genes 0.000 description 1
- 108010028778 Complement C4 Proteins 0.000 description 1
- 102000004190 Enzymes Human genes 0.000 description 1
- 108090000790 Enzymes Proteins 0.000 description 1
- WQZGKKKJIJFFOK-GASJEMHNSA-N Glucose Natural products OC[C@H]1OC(O)[C@H](O)[C@@H](O)[C@@H]1O WQZGKKKJIJFFOK-GASJEMHNSA-N 0.000 description 1
- 102000001554 Hemoglobins Human genes 0.000 description 1
- 108010054147 Hemoglobins Proteins 0.000 description 1
- DGAQECJNVWCQMB-PUAWFVPOSA-M Ilexoside XXIX Chemical compound C[C@@H]1CC[C@@]2(CC[C@@]3(C(=CC[C@H]4[C@]3(CC[C@@H]5[C@@]4(CC[C@@H](C5(C)C)OS(=O)(=O)[O-])C)C)[C@@H]2[C@]1(C)O)C)C(=O)O[C@H]6[C@@H]([C@H]([C@@H]([C@H](O6)CO)O)O)O.[Na+] DGAQECJNVWCQMB-PUAWFVPOSA-M 0.000 description 1
- 108060003951 Immunoglobulin Proteins 0.000 description 1
- XEEYBQQBJWHFJM-UHFFFAOYSA-N Iron Chemical compound [Fe] XEEYBQQBJWHFJM-UHFFFAOYSA-N 0.000 description 1
- 102000008133 Iron-Binding Proteins Human genes 0.000 description 1
- 108010035210 Iron-Binding Proteins Proteins 0.000 description 1
- OAICVXFJPJFONN-UHFFFAOYSA-N Phosphorus Chemical compound [P] OAICVXFJPJFONN-UHFFFAOYSA-N 0.000 description 1
- PNNCWTXUWKENPE-UHFFFAOYSA-N [N].NC(N)=O Chemical compound [N].NC(N)=O PNNCWTXUWKENPE-UHFFFAOYSA-N 0.000 description 1
- 238000013459 approach Methods 0.000 description 1
- 229910052791 calcium Inorganic materials 0.000 description 1
- 230000015556 catabolic process Effects 0.000 description 1
- 235000012000 cholesterol Nutrition 0.000 description 1
- 230000001186 cumulative effect Effects 0.000 description 1
- 230000002950 deficient Effects 0.000 description 1
- 238000006731 degradation reaction Methods 0.000 description 1
- 230000003111 delayed effect Effects 0.000 description 1
- 238000010586 diagram Methods 0.000 description 1
- 239000006185 dispersion Substances 0.000 description 1
- 229940088598 enzyme Drugs 0.000 description 1
- 239000008103 glucose Substances 0.000 description 1
- 238000002649 immunization Methods 0.000 description 1
- 230000003053 immunization Effects 0.000 description 1
- 102000018358 immunoglobulin Human genes 0.000 description 1
- 150000002505 iron Chemical class 0.000 description 1
- 238000004020 luminiscence type Methods 0.000 description 1
- 230000007246 mechanism Effects 0.000 description 1
- 230000007935 neutral effect Effects 0.000 description 1
- 230000003287 optical effect Effects 0.000 description 1
- 229910052698 phosphorus Inorganic materials 0.000 description 1
- 239000011574 phosphorus Substances 0.000 description 1
- 238000012545 processing Methods 0.000 description 1
- 235000018102 proteins Nutrition 0.000 description 1
- 102000004169 proteins and genes Human genes 0.000 description 1
- 108090000623 proteins and genes Proteins 0.000 description 1
- 230000000630 rising effect Effects 0.000 description 1
- 229910052708 sodium Inorganic materials 0.000 description 1
- 238000007619 statistical method Methods 0.000 description 1
- 238000003756 stirring Methods 0.000 description 1
- 238000010998 test method Methods 0.000 description 1
- 230000007704 transition Effects 0.000 description 1
- 230000000007 visual effect Effects 0.000 description 1
Images

Classifications
-
- G—PHYSICS
- G01—MEASURING; TESTING
- G01N—INVESTIGATING OR ANALYSING MATERIALS BY DETERMINING THEIR CHEMICAL OR PHYSICAL PROPERTIES
- G01N35/00—Automatic analysis not limited to methods or materials provided for in any single one of groups G01N1/00 - G01N33/00; Handling materials therefor
- G01N35/00584—Control arrangements for automatic analysers
- G01N35/00594—Quality control, including calibration or testing of components of the analyser
- G01N35/00613—Quality control
- G01N35/00663—Quality control of consumables
-
- Y—GENERAL TAGGING OF NEW TECHNOLOGICAL DEVELOPMENTS; GENERAL TAGGING OF CROSS-SECTIONAL TECHNOLOGIES SPANNING OVER SEVERAL SECTIONS OF THE IPC; TECHNICAL SUBJECTS COVERED BY FORMER USPC CROSS-REFERENCE ART COLLECTIONS [XRACs] AND DIGESTS
- Y10—TECHNICAL SUBJECTS COVERED BY FORMER USPC
- Y10T—TECHNICAL SUBJECTS COVERED BY FORMER US CLASSIFICATION
- Y10T436/00—Chemistry: analytical and immunological testing
- Y10T436/10—Composition for standardization, calibration, simulation, stabilization, preparation or preservation; processes of use in preparation for chemical testing
- Y10T436/101666—Particle count or volume standard or control [e.g., platelet count standards, etc.]
Definitions
- the present invention relates to an automatic analyzer which performs qualitative and quantitative analyses of a biological sample, such as blood, urine, etc. More particularly, the invention relates to an automatic analyzer which is provided with the quality control function.
- the automatic analyzer performing qualitative and quantitative analyses of a biological sample, such as blood, urine, etc. mixes a reagent which reacts with a component under measurement in the sample, and measures reagent color variations and the luminescence of a labeled substance contained in the reagent in order to perform analysis.
- measurement values may vary by aging of the reagent, aging of the optical system including a photometer, photoelectron multiplier, etc., and variations in the dispensing quality of dispensing and stirring mechanisms, and the like. Therefore, today's automatic analyzers periodically create a calibration curve by using a known amount of standard sample (calibrator) and check the validity of a measured concentration by using a quality control sample (control substance), thus controlling the measurement quality.
- quality control procedures are periodically performed in order to ensure that measurement results of the sample are correct.
- quality control for clinical testing equipment such as a biochemistry automatic analyzer, etc. is indispensable for stably acquiring exact data without being affected by reagent properties, machine troubles, and the like.
- Approaches for quality control include internal quality control and external quality control.
- measurement value variations are observed for each individual apparatus on a daily basis (individual variation) and in unit of several days to several months (day-to-day variation).
- external quality control in order to obtain the same measurement results in every hospital, measurements are performed by using the same standard samples in different inspection institutions for correcting measurement variations among the different inspection institutions.
- One quality control method is to evaluate the accuracy of measurements by using standard substances. Specifically, this method performs the steps of: repetitively performing measurement with a target measuring instrument by using standard substances (quality control samples such as standard liquids, control substances, etc.) having a known or constant concentration; and determining the average, variation range, etc. of measurement values to supervise whether or not the measurement process is stable.
- standard substances quality control samples such as standard liquids, control substances, etc.
- the above-mentioned controlled data is generally represented as a control chart which is a statistical method for setting a quality control limit range statistically obtained and checking whether the measurement process is stable or maintained in a stable state.
- the above-mentioned measurement value deviation is possibly caused by various factors such as the standard liquids, control substances, or reagents used for measurement, as well as experimental environment (temperature, humidity, etc.) and facilities or measuring instruments (abnormal temperature of constant-temperature bath, degraded lamp, etc. in the case of biochemistry analyzers).
- Non-patent Reference 1 Academic Journal of Japanese Association of Clinical Laboratory Automation (JSCLA), Vol. 32, No. 1, pp. 19-25 : A Study for Measurement Uncertainty in Routine Test using Automatic Analyzer
- Non-patent Reference 2 Clinical Chemistry, Vol. 36, Supplementary No. 1, pp. 151-153, 2007 : Uncertainty of Routine Test Values Transmitted from Standard System
- test in order to remove the cause, the test must be once stopped. This may cause test results to be significantly delayed or force the medical technologist to proceed with the test without sufficiently maintaining the quality.
- techniques for maintaining a constant quality and systems for warning degraded quality have been studied and improved.
- the importance of a unified view or unified judgment system increases when unifying of the quality and measurement values with respect to the outside facilities is required as well as internal quantity.
- Non-patent Reference 1 describes data uncertainty measurement conducted in recent years, wherein quality control samples having different concentrations are used. According to the measurement, measurement values of medium-and high-concentration quality control samples are stable but data variation of measurement values of low-concentration quality control samples increase. This means that the measurement value of a sample with low existential quantity of a target measurement item may not be accurate during measurement of an actual patient body even if results of measurement with quality control samples having a single concentration fall within a permissible variation range.
- An object of the present invention is to provide an automatic analyzer provided with a function for automatically determining the factor in such complicated uncertainty without relying on medical technologist's judgment, and provide a related analysis method.
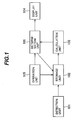
- the automatic analyzer includes a detection unit 101, a storage unit 102, a calculation unit 103, a display unit 104, an operation unit 105, and a determination unit 106, as shown in Fig. 1 .
- the storage unit 102 such as a hard disk stores measurement data output from the detection unit 101 of the automatic analyzer, and stores and updates concentrations and types of standard liquids and control substances at a plurality of levels.
- the calculation unit 103 calculates the concentration, standard deviation, coefficient of variation, date, time, etc. for each measurement from the output measurement data.
- the display unit 104 including the storage unit 102 for storing and updating calculated data, displays control charts and numerical values.
- the operation unit 105 including a keyboard, CRT, etc., sets a judgment value (boundary value for determining whether or not measured values are abnormal) and types and concentrations of samples.
- the determination unit including a logic having a plurality of branch points to compare a calculated numerical value with a judgment value, determines whether or not an abnormal condition occurs and the cause thereof.
- the result of judgment output from the determination unit 106 is displayed on the display unit 104 and an alarm is generated.
- the automatic analyzer When a measurement value deviates from a quality control range, the automatic analyzer according to the present invention investigates the cause of deviation thus remarkably saving labor and time consumed to recover a state where normal values can be measured. This makes it possible to reduce the load to and artificial judgment mistakes by the medical technologist, thus avoiding a judgment error due to individual difference. Further, since the automatic analyzer accumulates data in the storage unit and analyzes how an interval or what cause tends to make a measurement value deviate from the quality control limit range occur, it is expected that quality deviation be prevented previously.
- Fig. 1 is the best mode of the automatic analyzer according to the present invention.
- the automatic analyzer inputs directly or through a barcode reader the information on a plurality of quality control samples and information on measurement items, and then starts measurement.
- This measurement can be implemented in various ways: before or after starting a test every day, at intervals of a predetermined number of samples during tests, and at predetermined time.
- Measurement data output from the detection unit 101 is once stored in computer memory, and then read by the calculation unit 103 to calculate the average, measurement range, standard deviation, coefficient of variation, and the like.
- the calculated numerical values can be accumulated in the storage unit and then integrated with previously measured data to create a control chart.
- the determination unit 106 compares numerical values calculated by the calculation unit with a judgment value input from the operation unit to determine whether or not numerical value variations occur as well as the cause of variations.
- the determination unit is provided with the information required for judgment.
- the factor obtained by the judgment can be displayed on the display unit or notified as an alarm.
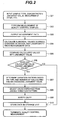
- Fig. 2 is a flow chart showing a logic from quality control measurement to judgment.
- Step 301 names and types of reagents to be used, measurement items, user-defined judgment value, etc. are set and stored by the operation from the operation unit such as the keyboard, CRT, etc. connected to the computer.
- the automatic analyzer measures the registered quality control samples. The automatic analyzer, after calibration is completed every day, measures the quality control samples before, during, or after measurement of a patient body or a plurality of times.
- the detection unit outputs the obtained measurement data to the computer.
- Step 304 the computer calculates the average, standard deviation, etc. based on the received data.
- Step 305 the determination unit compares values obtained by calculation with the judgment value previously input or a default judgment value.
- the determination unit determines a sample with which the calculated value exceeds the judgment value for each item.
- the determination unit determines that the certainty is maintained and stores the data in the storage unit in Step 310.
- the determination unit determines variation patterns, i.e., types and number of variations for each item in Step 307, and then selects the factor in uncertainty presumed from the judged variation patterns in Step 308.
- the judged factor and control chart are displayed on the display unit together with items and other data. When this measurement is performed during tests, the display screen may not be selected and therefore it is desirable to generate an alarm.
- the obtained data is accumulated in the storage unit such as a database. Accuracy control is performed according to the above-mentioned flow.
- L low level
- M middle level
- H high level
- Main items include total protein (TP), albumin (ALB), lactate dehydrogenase (LD), aspartate aminotransferase (AST), alanine aminotransferase (ALT), alkaline phosphatase (ALP), amylase (AMY), pancreatic amylase (P-AMY), leucine aminopeptidase (LAP), ⁇ -glutamyl transpeptidase (yGT), cholinesterase (CHE), creatine kinase (CK), total cholesterol (T-Cho), neutral fat (TG), HDL-cholesterol (HDL-C), LDL-cholesterol (LDL-C), free fatty acid (FEA), urea nitrogen (UN), creatinine (CRE), uric acid (UA), glucose (Glu), hemoglobin A1C (HbA1c
- uric acid aspartate aminotransferase (AST), alanine aminotransferase (ALT), creatinine (CRE), ⁇ -glutamyl transpeptidase ( ⁇ GT), etc. are known for the dispersion tendency of low-concentration regions, and therefore it is more desirable to apply these measurement items to the present invention.
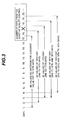
- Data variation can be measured by measuring the same sample a plurality of times. Actually in measurement of simultaneous repeatability of reagents, independent data for 20 to 30 measurements are used. Also in individual or day-to-day quality control, although the availability of more data items for more number of measurements provides higher quality, measurement is possible with data for at least two measurements. Since at least 15 independent measurement values is recommended for presuming the uncertainty in ordinary quality control, measurement procedures using data of 15 times measurement will be described for the present embodiment. Average, standard deviation, etc. can be used for quality measurement. For example, Fig. 3 shows quality control based on SD values by using data for 15 measurements as the parent population. The data for 15 days from the first day on which measurement is started is used to accumulate quality control data and calculate SD values used as a judgment value.
- the same sample is measured a plurality of times and then the average is used as the measurement value of the day.
- the data for the past 15 days including the measurement date is used.
- the data for the relevant day is not used since it affects subsequent SD values. For example, when data obtained on the 17th day exceeds a judgment value, SD values of the next day (18th day) are calculated based on the data of 15 days excluding the 17th day, i.e., the third to 16th days and the 18th day.
- SD values are calculated based on the data for 15 days, i.e., the fourth to 16th days and the 18th to 19th days.
- quality control measurement is performed several times a day, it is desirable to calculate SD values based on the data for the past 15 measurements.
- the most basic and most commonly used quality control limit range uses a value twice or three times the variation (standard deviation). (Hereinafter, this value is referred to as the ⁇ value.) When the distribution of variation is 1 ⁇ , 2 ⁇ , and 3 ⁇ of the normal distribution, 68%, 95%, and 99% of data fall within the quality control limit, respectively. In actual measurement, severer quality control limit increases the possibility that even a value variation not due to abnormal cause may be out of the quality control limit range, disturbing ordinary test procedures. Since quality requirements differ for each institution and measurement item, the medical technologist can arbitrarily set a judgment value. The judgment value can be input or changed before or after measurement of quality control samples.
- the same item is measured five times and an average is calculated in each of the first 15 days. Then, the standard deviation for the 15 days is calculated and the 2 ⁇ (SD X 2) value is set as a judgment value.
- control chart method for quality control it is possible to use known techniques, for example, X-R control chart method, X bar-R control chart method, X bar-Rs-R control chart method, twin plot method, plus-minus control chart method, multi-rule control chart method, cumulative sum control chart method, scatter chart method, and the like.
- X-R control chart method X bar-R control chart method
- X bar-Rs-R control chart method twin plot method
- plus-minus control chart method multi-rule control chart method
- multi-rule control chart method multi-rule control chart method
- cumulative sum control chart method scatter chart method, and the like.
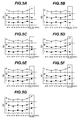
- control charts are a general control chart having a horizontal axis 201 assigned the measurement date and a vertical axis 202 assigned the SD value. Control charts can be displayed independently for each concentration and, more preferably, a plurality of control charts can be overlapped or arranged on the same screen. For example, in Fig. 4 , control charts for a high-concentration level sample (H) 203, a medium-concentration level sample (M) 204, and a low-concentration level sample (L) 205 are vertically arranged.
- H high-concentration level sample
- M medium-concentration level sample
- L low-concentration level sample
- control charts for each concentration are arranged or overlapped, although calculated numerical values such as average, SD value, etc. can be displayed according to the original ⁇ -axis scale, it is more desirable to display the numerical values with a fixed scale regardless of numerical value for each concentration, for example, so as to fit into the span between specified upper- and lower-limit control values, thereby making it easier to compare variations for each concentration with each other.
- the horizontal axis is assigned the date for a fixed time period in unit of week, month, and year (for example, 30 days), and updated on a daily basis. Further, control charts for a plurality of items specified by the user can be displayed on the same screen.
- the number of combination of variation patterns of the SD values is (2 3 ).
- a state where the SD value remains unchanged (or changes very slightly) in three different-level concentration samples means that normal measurement can be achieved seven (8-1) different combinations of variation patterns of the SD value are used to indicate the factor in uncertainty.
- These seven different combinations of variation patterns are shown in Figs. 5A to 5G .
- Figs. 5A to 5G When data variation on the date enclosed by a frame (June 16) is noticed in Figs. 5A to 5G , there are three different combinations of variation patterns in which one of three values abnormally increases: increase only in H ( Fig. 5A ), increase only in M ( Fig. 5B ), and increase only in L ( Fig.
- SD values abnormally increase when the increase is specific to a measurement item, the cause is degraded reagent for the measurement item.
- the cause may not be the reagent but be the lamp, the temperature of the constant-temperature bath, and other mechanical factors.
- the cause of variation can be determined by classifying variation patterns into the above-mentioned seven different combinations of variation patterns for quality control samples having three different concentrations.
- a judgment value is set for each quality control sample.
- the medical technologist can optimally set the value with the setup screen. For example, when the SD value calculated on the 15th day from the start of measurement is used as a reference value, a numerical value (2SD) twice the SD value is set as the judgment value.
- 2SD a numerical value twice the SD value is set as the judgment value.
- routine measurement when the data is stable as shown in Table 1, the SD values of H, M, and L do not exceed the judgment value.
- pattern a the SD value of H exceeds the judgment value.
- pattern b the SD value of M exceeds the judgment value.
- pattern c the SD value of L exceeds the judgment value.
- pattern d the SD values of H and M exceed the reference range.
- pattern e the SD values of M and L exceed the reference range.
- pattern f the SD values of H and L exceed the reference range.
- pattern g the SD values of H, M, and L exceed the reference range.
- Pattern recognition when the SD value is exceeded is performed using the judgment value. Calculations for this pattern recognition are automatically performed each time a quality control sample is measured, and a judged cause is displayed on the screen showing the quality control together with the control chart.
- Results of sample measurement are displayed as a control chart.
- the control chart provides a line of the judgment value for each of H, M, and L, Facilitating the visual recognition of a case where the three different quality control samples have variations correlating each other.
- the pattern of the control chart shown in Fig. 5 is overlapped with the obtained control chart on the same screen, and the medical technologist visually judges pattern matching. The medical technologist clicks or checks the control chart having the same pattern on the screen to indicate the result of judgment based on a correspondence table like Table 2. Checking completes the registration of judgment results.
Landscapes
- Engineering & Computer Science (AREA)
- Quality & Reliability (AREA)
- Physics & Mathematics (AREA)
- Health & Medical Sciences (AREA)
- Life Sciences & Earth Sciences (AREA)
- Chemical & Material Sciences (AREA)
- Analytical Chemistry (AREA)
- Biochemistry (AREA)
- General Health & Medical Sciences (AREA)
- General Physics & Mathematics (AREA)
- Immunology (AREA)
- Pathology (AREA)
- Automatic Analysis And Handling Materials Therefor (AREA)
- Investigating Or Analysing Biological Materials (AREA)
Abstract
Description
- The present invention relates to an automatic analyzer which performs qualitative and quantitative analyses of a biological sample, such as blood, urine, etc. More particularly, the invention relates to an automatic analyzer which is provided with the quality control function.
- The automatic analyzer performing qualitative and quantitative analyses of a biological sample, such as blood, urine, etc. mixes a reagent which reacts with a component under measurement in the sample, and measures reagent color variations and the luminescence of a labeled substance contained in the reagent in order to perform analysis. In this case, measurement values may vary by aging of the reagent, aging of the optical system including a photometer, photoelectron multiplier, etc., and variations in the dispensing quality of dispensing and stirring mechanisms, and the like. Therefore, today's automatic analyzers periodically create a calibration curve by using a known amount of standard sample (calibrator) and check the validity of a measured concentration by using a quality control sample (control substance), thus controlling the measurement quality. These quality control procedures are periodically performed in order to ensure that measurement results of the sample are correct. In routine tests, quality control for clinical testing equipment such as a biochemistry automatic analyzer, etc. is indispensable for stably acquiring exact data without being affected by reagent properties, machine troubles, and the like. Approaches for quality control include internal quality control and external quality control. With internal quality control, measurement value variations are observed for each individual apparatus on a daily basis (individual variation) and in unit of several days to several months (day-to-day variation). With external quality control, in order to obtain the same measurement results in every hospital, measurements are performed by using the same standard samples in different inspection institutions for correcting measurement variations among the different inspection institutions.
- One quality control method is to evaluate the accuracy of measurements by using standard substances. Specifically, this method performs the steps of: repetitively performing measurement with a target measuring instrument by using standard substances (quality control samples such as standard liquids, control substances, etc.) having a known or constant concentration; and determining the average, variation range, etc. of measurement values to supervise whether or not the measurement process is stable.
- The above-mentioned controlled data is generally represented as a control chart which is a statistical method for setting a quality control limit range statistically obtained and checking whether the measurement process is stable or maintained in a stable state.
- When a measurement value controlled in this way exceeds the quality control limit range, it is necessary to investigate the cause and restore the measurement process to the stable state. The above-mentioned measurement value deviation is possibly caused by various factors such as the standard liquids, control substances, or reagents used for measurement, as well as experimental environment (temperature, humidity, etc.) and facilities or measuring instruments (abnormal temperature of constant-temperature bath, degraded lamp, etc. in the case of biochemistry analyzers).
- Conventional automatic analyzers, on the contrary, performs quality control through the steps of: plotting a control chart; recording information such as the replacement date of reagent, lamp, etc. in a recording section; and displaying the information in the control chart together with quality control values. In this case, the user visually determines the cause of control value deviation based on user's experiences. Recent years have seen an international trend of numerical value calibration and certainty check based not on the former quality control techniques but on the uncertainty (parameters accompanying measurement results for characterizing value variation which can rationally be associated with measured quantities). The definition and calculation method of the uncertainty used for quality control have come to be widely known by the establishment of ISO15189 (Medical laboratories -- Particular requirements for quality and competence) and the promotion activities of the Japanese Standards Association, and the like. The above-mentioned former techniques are disclosed in
JP-A-6-281656 3420791 JP-A-2000-266756 JP-A-2000-187037 - Non-patent Reference 1: Academic Journal of Japanese Association of Clinical Laboratory Automation (JSCLA), Vol. 32, No. 1, pp. 19-25: A Study for Measurement Uncertainty in Routine Test using Automatic Analyzer
- Non-patent Reference 2: Clinical Chemistry, Vol. 36, Supplementary No. 1, pp. 151-153, 2007: Uncertainty of Routine Test Values Transmitted from Standard System
- Both in the former quality control techniques based centering on the reproducibility and accuracy and in the recently regarded quality control technique based on the uncertainty, it was possible to detect a problem on quality control when a numerical value abnormally varies. However, although the uncertainty serves as an index for representing the technical reliability, there is no unified view for in-depth investigation of the cause when the uncertainty exceeds a clinical permissible value, i.e., whether the problem is caused by equipment or reagent. Since measurement of the uncertainty involves many factors such as equipment state including its maintenance control, reagent, and quality control sample, time-consuming and labor is required for an ordinary medical technologist to investigate the factor in uncertainty. In particular, it is commonly not easy for the technologist to determine the factor during a routine clinical test. Therefore, in order to remove the cause, the test must be once stopped. This may cause test results to be significantly delayed or force the medical technologist to proceed with the test without sufficiently maintaining the quality. As mentioned earlier as related art, techniques for maintaining a constant quality and systems for warning degraded quality have been studied and improved. However, while the investigation of the factor in uncertainty relies on the judgment of the medical technologist, the importance of a unified view or unified judgment system increases when unifying of the quality and measurement values with respect to the outside facilities is required as well as internal quantity.
- In particular, among the factors in uncertainty, reagents are subject to quality change by storage conditions of lots. Therefore, it is difficult to investigate the factor in uncertainty, whether the problem is caused by quality control sample or measurement reagent. Nevertheless, there has been no choice but to rely on medical technologist's experiences to determine the factor in uncertainty.
- Non-patent Reference 1 describes data uncertainty measurement conducted in recent years, wherein quality control samples having different concentrations are used. According to the measurement, measurement values of medium-and high-concentration quality control samples are stable but data variation of measurement values of low-concentration quality control samples increase. This means that the measurement value of a sample with low existential quantity of a target measurement item may not be accurate during measurement of an actual patient body even if results of measurement with quality control samples having a single concentration fall within a permissible variation range.
- An object of the present invention is to provide an automatic analyzer provided with a function for automatically determining the factor in such complicated uncertainty without relying on medical technologist's judgment, and provide a related analysis method.
- In order to attain the above-mentioned object, the automatic analyzer according to the present invention includes a
detection unit 101, astorage unit 102, acalculation unit 103, adisplay unit 104, anoperation unit 105, and adetermination unit 106, as shown inFig. 1 . Thestorage unit 102 such as a hard disk stores measurement data output from thedetection unit 101 of the automatic analyzer, and stores and updates concentrations and types of standard liquids and control substances at a plurality of levels. Thecalculation unit 103 calculates the concentration, standard deviation, coefficient of variation, date, time, etc. for each measurement from the output measurement data. Thedisplay unit 104, including thestorage unit 102 for storing and updating calculated data, displays control charts and numerical values. Theoperation unit 105, including a keyboard, CRT, etc., sets a judgment value (boundary value for determining whether or not measured values are abnormal) and types and concentrations of samples. The determination unit including a logic having a plurality of branch points to compare a calculated numerical value with a judgment value, determines whether or not an abnormal condition occurs and the cause thereof. The result of judgment output from thedetermination unit 106 is displayed on thedisplay unit 104 and an alarm is generated. - The automatic analyzer uses quality control samples having a plurality of concentration levels for quality control to calculate the average, coefficient of variation, standard deviation, etc. of measurement values. Numerical value variations can be classified into three different variation patterns: falling, stable, and rising patterns. Therefore, when quality control samples having n (n>=2) different concentration levels are measured, the automatic analyzer presumes the factor in uncertainty specific to each of 3n different combinations of variation patterns.
- When a measurement value deviates from a quality control range, the automatic analyzer according to the present invention investigates the cause of deviation thus remarkably saving labor and time consumed to recover a state where normal values can be measured. This makes it possible to reduce the load to and artificial judgment mistakes by the medical technologist, thus avoiding a judgment error due to individual difference. Further, since the automatic analyzer accumulates data in the storage unit and analyzes how an interval or what cause tends to make a measurement value deviate from the quality control limit range occur, it is expected that quality deviation be prevented previously.
-
-
Fig. 1 is a block diagram showing the overview configuration of an automatic analyzer according to the present invention. -
Fig. 2 is a flow chart of processing from measurement of a quality control sample to judgment of cause of variation. -
Fig. 3 is an exemplary method for calculating SD values used for routine quality control. -
Fig. 4 is an example of quality control chart. -
Figs. 5A to 5G show variation patterns of quality control samples shown in the control chart,Fig. 5A . showing SD value when only H abnormally increases,Fig. 5B showing SD value when only M abnormally increases,Fig. 5C showing SD value when only L abnormally increases,Fig. 5D showing SD values when H and M abnormally increase,Fig. 5E showing SD values when M and L abnormally increase,Fig. 5F showing SD values when H and L abnormally increase,Fig. 5G showing SD values when H, M, and L abnormally increase. - Embodiments of the present invention will be explained below with reference to the accompanying drawings. First Embodiment
-
Fig. 1 is the best mode of the automatic analyzer according to the present invention. - In order to perform quality control, the automatic analyzer inputs directly or through a barcode reader the information on a plurality of quality control samples and information on measurement items, and then starts measurement. This measurement can be implemented in various ways: before or after starting a test every day, at intervals of a predetermined number of samples during tests, and at predetermined time. Measurement data output from the
detection unit 101 is once stored in computer memory, and then read by thecalculation unit 103 to calculate the average, measurement range, standard deviation, coefficient of variation, and the like. The calculated numerical values can be accumulated in the storage unit and then integrated with previously measured data to create a control chart. Then, thedetermination unit 106 compares numerical values calculated by the calculation unit with a judgment value input from the operation unit to determine whether or not numerical value variations occur as well as the cause of variations. The determination unit is provided with the information required for judgment. The factor obtained by the judgment can be displayed on the display unit or notified as an alarm. -
Fig. 2 is a flow chart showing a logic from quality control measurement to judgment. - In
Step 301, names and types of reagents to be used, measurement items, user-defined judgment value, etc. are set and stored by the operation from the operation unit such as the keyboard, CRT, etc. connected to the computer. InStep 302, the automatic analyzer measures the registered quality control samples. The automatic analyzer, after calibration is completed every day, measures the quality control samples before, during, or after measurement of a patient body or a plurality of times. InStep 303, the detection unit outputs the obtained measurement data to the computer. InStep 304, the computer calculates the average, standard deviation, etc. based on the received data. InStep 305, the determination unit compares values obtained by calculation with the judgment value previously input or a default judgment value. As a result of comparison, the determination unit determines a sample with which the calculated value exceeds the judgment value for each item. When the calculated value does not exceed the judgment value, the determination unit determines that the certainty is maintained and stores the data in the storage unit inStep 310. When the calculated value exceeds the judgment value, the determination unit determines variation patterns, i.e., types and number of variations for each item inStep 307, and then selects the factor in uncertainty presumed from the judged variation patterns inStep 308. InStep 309, the judged factor and control chart are displayed on the display unit together with items and other data. When this measurement is performed during tests, the display screen may not be selected and therefore it is desirable to generate an alarm. Then, inStep 310, the obtained data is accumulated in the storage unit such as a database. Accuracy control is performed according to the above-mentioned flow. - Although any types of standard serums, pool serums, and control substances containing more than a certain quantity of substances of measurement items can be used for uncertainty measurement, quality control samples having a plurality of concentration levels are prepared for each measurement item. It is necessary that the concentration levels be within the measurement range of the reagents and equipment used. Samples having three different concentration levels are used in the present embodiment. It is particularly preferable to use three levels with certain intervals, for example, the low level (hereinafter referred to as L), middle level (hereinafter referred to as M), and high level (hereinafter referred to as H). L denotes the vicinity of a lower limit of the reference range of the normal measurement value; M denotes the vicinity of an upper limit of the reference range thereof; and H denotes a level which is at least twice the normal measurement value.
- Although any measurement items that can be measured with the automatic analyzer can be used, it is desirable that each item can be measured with both the enzyme method and immunization. More than about 300 measurement items are known. Main items include total protein (TP), albumin (ALB), lactate dehydrogenase (LD), aspartate aminotransferase (AST), alanine aminotransferase (ALT), alkaline phosphatase (ALP), amylase (AMY), pancreatic amylase (P-AMY), leucine aminopeptidase (LAP), γ-glutamyl transpeptidase (yGT), cholinesterase (CHE), creatine kinase (CK), total cholesterol (T-Cho), neutral fat (TG), HDL-cholesterol (HDL-C), LDL-cholesterol (LDL-C), free fatty acid (FEA), urea nitrogen (UN), creatinine (CRE), uric acid (UA), glucose (Glu), hemoglobin A1C (HbA1c), lactic acid (LA), pyruvic acid (PA), total bilirubin (T-BIL), direct bilirubin (D-BIL), calcium (Ca), sodium (Na), inorganic phosphorus (IP), serum iron (Fe), unsaturated iron binding capacity (UIBC), creatine kinase MB (CK-MB), phospholipid (PL), C reactive protein (CRP), rheumatoid cause (RF), immunoglobulin G (IgG), immunoglobulin A (IgA), immunoglobulin M (IgM), complement 3 (C3), complement 4 (C4), antistreptolysin-O (ASO), etc. In particular, uric acid (UA), aspartate aminotransferase (AST), alanine aminotransferase (ALT), creatinine (CRE), γ-glutamyl transpeptidase (γGT), etc. are known for the dispersion tendency of low-concentration regions, and therefore it is more desirable to apply these measurement items to the present invention.
- Data variation can be measured by measuring the same sample a plurality of times. Actually in measurement of simultaneous repeatability of reagents, independent data for 20 to 30 measurements are used. Also in individual or day-to-day quality control, although the availability of more data items for more number of measurements provides higher quality, measurement is possible with data for at least two measurements. Since at least 15 independent measurement values is recommended for presuming the uncertainty in ordinary quality control, measurement procedures using data of 15 times measurement will be described for the present embodiment. Average, standard deviation, etc. can be used for quality measurement. For example,
Fig. 3 shows quality control based on SD values by using data for 15 measurements as the parent population. The data for 15 days from the first day on which measurement is started is used to accumulate quality control data and calculate SD values used as a judgment value. For each quality control sample, the same sample is measured a plurality of times and then the average is used as the measurement value of the day. In order to equalize the reference values used for judgment and parent population of measurement values subjected to comparison, the data for the past 15 days including the measurement date is used. However, when any of these measurement values of three different concentration level samples exceeds a judgment value, the data for the relevant day is not used since it affects subsequent SD values. For example, when data obtained on the 17th day exceeds a judgment value, SD values of the next day (18th day) are calculated based on the data of 15 days excluding the 17th day, i.e., the third to 16th days and the 18th day. Likewise, on the 19th day of the month after the next month, SD values are calculated based on the data for 15 days, i.e., the fourth to 16th days and the 18th to 19th days. When quality control measurement is performed several times a day, it is desirable to calculate SD values based on the data for the past 15 measurements. - It is very rare that the same measurement values and the same SD values are obtained every day. Since numerical values will vary even slightly, it is important to determine whether or not the variation is within an ordinary data spread range, not to determine whether or not SD value variation occurs.
- The most basic and most commonly used quality control limit range uses a value twice or three times the variation (standard deviation). (Hereinafter, this value is referred to as the σ value.) When the distribution of variation is 1σ, 2σ, and 3σ of the normal distribution, 68%, 95%, and 99% of data fall within the quality control limit, respectively. In actual measurement, severer quality control limit increases the possibility that even a value variation not due to abnormal cause may be out of the quality control limit range, disturbing ordinary test procedures. Since quality requirements differ for each institution and measurement item, the medical technologist can arbitrarily set a judgment value. The judgment value can be input or changed before or after measurement of quality control samples.
- In order to set a pertinent judgment value, collection of preliminary data is required. When the measurement process is in a stable state, different types of standard serums having a constant concentration are measured n times every day, and data is continuously accumulated for K days. It is desirable that the same quality control samples and reagents are used during this period. The average, standard deviation, coefficient of variation, etc. are calculated based on the accumulated data. These values are multiplied by X or Z% is added to or subtracted from them to derive a judgment value. The judgment value can be fixed or variable. It can be made variable by increasing the parent population each time quality measurement is performed.
- In the present embodiment, the same item is measured five times and an average is calculated in each of the first 15 days. Then, the standard deviation for the 15 days is calculated and the 2 σ (SD X 2) value is set as a judgment value.
- It is also possible to display measured or calculated data in numerical form. As the control chart method for quality control, it is possible to use known techniques, for example, X-R control chart method, X bar-R control chart method, X bar-Rs-R control chart method, twin plot method, plus-minus control chart method, multi-rule control chart method, cumulative sum control chart method, scatter chart method, and the like. For example, for facilitating the viewing of measurement value variations, it is more desirable to create a control chart having a horizontal axis assigned the measurement date and a vertical axis assigned the normalized value not affected by the concentration of quality control samples, such as CV value, SD value, etc.
Fig. 4 is a general control chart having ahorizontal axis 201 assigned the measurement date and avertical axis 202 assigned the SD value. Control charts can be displayed independently for each concentration and, more preferably, a plurality of control charts can be overlapped or arranged on the same screen. For example, inFig. 4 , control charts for a high-concentration level sample (H) 203, a medium-concentration level sample (M) 204, and a low-concentration level sample (L) 205 are vertically arranged. - When control charts for each concentration are arranged or overlapped, although calculated numerical values such as average, SD value, etc. can be displayed according to the original γ-axis scale, it is more desirable to display the numerical values with a fixed scale regardless of numerical value for each concentration, for example, so as to fit into the span between specified upper- and lower-limit control values, thereby making it easier to compare variations for each concentration with each other.
- In
Fig. 4 , the horizontal axis is assigned the date for a fixed time period in unit of week, month, and year (for example, 30 days), and updated on a daily basis. Further, control charts for a plurality of items specified by the user can be displayed on the same screen. - In routine measurements, when each measurement value is compared with a target value, three different variation patterns are considered, that is, the value remains unchanged, decreases, and increases. Therefore, in the case where n different quality control samples are measured, 3n (n-th power of 3) different combinations of variation patterns are considered. Specifically, when quality control is performed by using three different quality control samples, the number of combinations of variation patterns is 27 (33). In calculation of the average, for example, these 27 different combinations must be examined. However, since the measurement range, SD value, CV value, etc., increase with increasing data variation, a decrease in these values means a decrease in variation. In quality control with biochemistry analyzers, therefore, a decrease in the SD value is not regarded as a problem but regarded as the same meaning as no variation, that is, maintained stability. Accordingly, an increase in the SD value means that the stability of the measurement process is not maintained, arising a problem which must be noticed. As for SD value variation, therefore, only two different variation patterns may be considered: whether the SD value increases or not. Thus, when n (n≥2) different quality control samples are used, 2n (n-th power of 2) different combinations of variation patterns may be considered.
- In the present embodiment, since quality control samples having three different concentration levels are measured, the number of combination of variation patterns of the SD values is (23). However, since a state where the SD value remains unchanged (or changes very slightly) in three different-level concentration samples means that normal measurement can be achieved, seven (8-1) different combinations of variation patterns of the SD value are used to indicate the factor in uncertainty. These seven different combinations of variation patterns are shown in
Figs. 5A to 5G . When data variation on the date enclosed by a frame (June 16) is noticed inFigs. 5A to 5G , there are three different combinations of variation patterns in which one of three values abnormally increases: increase only in H (Fig. 5A ), increase only in M (Fig. 5B ), and increase only in L (Fig. 5C ). There are three different combinations of variation patterns in which two out of three values abnormally increase: increase in H and M (Fig. 5D ), increase in M and L (Fig. 5E ), and increase in H and L (Fig. 5F ). Then, there is a case where, in all of H, M, and L, SD values abnormally increase (Fig. 5G ). - The factors of these seven different combinations of variation patterns will be considered below. In the case where an abnormal increase in one of three values (
Figs. 5A, 5B, and 5C ), when the peculiarity is specific not to a measurement item but to a quality control sample having the relevant concentration, there is a high possibility that the quality control sample may have been degraded or defective. - In the case where, in H and M out of three concentration level sample, SD values abnormally increase (
Fig. 5D ), while the quality of values in low-concentration sample which is liable to cause data spread is maintained, the values in medium-concentration sample and high-concentration sample are abnormal. In this case, degradation of the measurement reagent is estimated since absence of linearity in the reagent is considered. - In the case where, in M and L out of three concentration level sample, SD values abnormally increase (
Fig. 5E ), since values in high-concentration sample are not affectable but incorrect measurement values arise with use of medium- and low-concentration samples, there is a high possibility that the quality control sample may have been degraded. Depending on the measurement item, the effect caused by the concentration arises. For example, in the case of uric acid (UN), when ammonia in air is captured into the quality control sample, the concentration of ammonia in the sample is likely to change. Further, since a standard liquid having a lower concentration generally provides more unstable quality, it is presumed that a quality control sample having a lower concentration provides a shorter usable life even if three different quality control samples are opened on the same date. - In the case where, in H and L out of three concentration level samples, SD values abnormally increase (
Fig. 5F ), since the measurement values of medium-concentration sample are stable, the inclination of the calibration curve measured before the test is assumed to be fluctuating centering on medium-concentration values. Therefore, it is presumed that the calibration curve of relevant date may not to have been correctly drawn. - In the case where, in all of the three concentration level samples, SD values abnormally increase (
Fig. 5G ), when the increase is specific to a measurement item, the cause is degraded reagent for the measurement item. When values in all measurement items abnormally increase, the cause may not be the reagent but be the lamp, the temperature of the constant-temperature bath, and other mechanical factors. - From these considerations, the cause of variation can be determined by classifying variation patterns into the above-mentioned seven different combinations of variation patterns for quality control samples having three different concentrations.
- Calculation-based presumption of the cause of day-to-day variation by noticing the SD value will be explained below. A judgment value is set for each quality control sample. The medical technologist can optimally set the value with the setup screen. For example, when the SD value calculated on the 15th day from the start of measurement is used as a reference value, a numerical value (2SD) twice the SD value is set as the judgment value. In routine measurement, when the data is stable as shown in Table 1, the SD values of H, M, and L do not exceed the judgment value.
Table 1 Relation between variation patterns of quality control samples and transition of SD values SD value Judgment value (example) Variation patterns of quality control samples having three different concentrations Stable a b c d e f g H <2SD(H) (Within limit) over over over over M <2SD(M) (Within limit) over over over over L <2SD(L) (Within limit) over over over over - In pattern a, the SD value of H exceeds the judgment value. In pattern b, the SD value of M exceeds the judgment value. In pattern c, the SD value of L exceeds the judgment value. In pattern d, the SD values of H and M exceed the reference range. In pattern e, the SD values of M and L exceed the reference range. In pattern f, the SD values of H and L exceed the reference range. Further, in pattern g, the SD values of H, M, and L exceed the reference range. As mentioned above, the types and number of quality control samples exceeding the judgment value differ for each variation pattern. Pattern recognition when the SD value is exceeded is performed using the judgment value.
Calculations for this pattern recognition are automatically performed each time a quality control sample is measured, and a judged cause is displayed on the screen showing the quality control together with the control chart. - If pattern recognition can be automatically performed, it is possible to display the judged cause, together with an alarm, with reference to the judgment list shown in Table 2.
Table 2 Judgment list of possible causes Patt ern State of control chart Detailed Description Possible cause a One of three SD values
increases.Only H (high concentration) Degraded quality control substance H b Only M (medium concentration) Degraded quality control substance M c Only L (low concentration) Degraded quality control substance L d Two out of three SD values
increase.H and M Degraded measurement reagent e M and L Degraded quality control substance f H and L Incorrect calibration curve g Three SD values increase. Specific to item Degraded measurement reagent All items Mechanical factor (lamp, temperature, etc.) - Results of sample measurement are displayed as a control chart. The control chart provides a line of the judgment value for each of H, M, and L, Facilitating the visual recognition of a case where the three different quality control samples have variations correlating each other. The pattern of the control chart shown in
Fig. 5 is overlapped with the obtained control chart on the same screen, and the medical technologist visually judges pattern matching. The medical technologist clicks or checks the control chart having the same pattern on the screen to indicate the result of judgment based on a correspondence table like Table 2. Checking completes the registration of judgment results.
Claims (6)
- An automatic analyzer comprising:storage means for storing a measurement result of a quality control sample having a known concentration;calculation means for calculating at least the average, coefficient of variation, and standard deviation, of the measurement result stored in said storage means;classification means for classifying the average, coefficient of variation, and standard deviation, calculated by said calculation means in terms of the concentration of the measured quality control sample; andregistration means for registering variation patterns of the average, coefficient of variation, and standard deviation, classified by said classification means.
- The automatic analyzer according to Claim 1,
wherein the automatic analyzer includes means for associating the cause of measurement uncertainty with each of the variation patterns registered by said registration means. - The automatic analyzer according to Claim 1,
wherein, when a measurement result of the quality control sample does not match any of the variation patterns registered by the registration means, the automatic analyzer registers the measurement result to said registration means as a new variation pattern. - The automatic analyzer according to Claim 1,
wherein at least one of said calculation means, classification means, and registration means is included in a host computer connected with the automatic analyzer through a communication line. - The automatic analyzer according to Claim 2,
wherein the automatic analyzer includes setup means for setting a judgment value for judging the cause of uncertainty. - The automatic analyzer according to Claim 2,
wherein the automatic analyzer includes display means for displaying the average, coefficient of variation, and standard deviation of the quality control sample as well as the related cause of uncertainty.
Applications Claiming Priority (1)
| Application Number | Priority Date | Filing Date | Title |
|---|---|---|---|
| JP2008020039A JP4991586B2 (en) | 2008-01-31 | 2008-01-31 | Automatic analyzer |
Publications (3)
| Publication Number | Publication Date |
|---|---|
| EP2093573A2 true EP2093573A2 (en) | 2009-08-26 |
| EP2093573A3 EP2093573A3 (en) | 2015-08-05 |
| EP2093573B1 EP2093573B1 (en) | 2022-08-10 |
Family
ID=40481856
Family Applications (1)
| Application Number | Title | Priority Date | Filing Date |
|---|---|---|---|
| EP09001326.9A Active EP2093573B1 (en) | 2008-01-31 | 2009-01-30 | Automatic analyzer |
Country Status (4)
| Country | Link |
|---|---|
| US (1) | US8150645B2 (en) |
| EP (1) | EP2093573B1 (en) |
| JP (1) | JP4991586B2 (en) |
| CN (1) | CN101498735B (en) |
Cited By (3)
| Publication number | Priority date | Publication date | Assignee | Title |
|---|---|---|---|---|
| CN108697141A (en) * | 2015-12-29 | 2018-10-23 | N·V·努特里奇亚 | Nutrient formulation object containing indigestible oligosaccharides and non-replicating lactic acid producing bacteria |
| US20200103333A1 (en) * | 2018-09-28 | 2020-04-02 | Sysmex Corporation | Measurement apparatus and quality control method |
| EP3985398A4 (en) * | 2019-06-11 | 2023-05-10 | Hitachi High-Tech Corporation | Automated analysis device, and abnormality detecting method |
Families Citing this family (20)
| Publication number | Priority date | Publication date | Assignee | Title |
|---|---|---|---|---|
| US9229015B2 (en) * | 2008-12-26 | 2016-01-05 | Hitachi High-Technologies Corporation | Accuracy management method |
| JP5711564B2 (en) * | 2011-02-17 | 2015-05-07 | ベックマン コールター, インコーポレイテッド | Automatic analyzer |
| JP5771060B2 (en) * | 2011-05-02 | 2015-08-26 | シスメックス株式会社 | Sample analyzer and data processing apparatus |
| CN103930762B (en) | 2011-06-17 | 2018-03-20 | 罗氏血液诊断股份有限公司 | The system and method with checking are shown for sample |
| JP5855372B2 (en) * | 2011-07-07 | 2016-02-09 | シスメックス株式会社 | Sample analyzer and computer program |
| AU2015261699B2 (en) * | 2011-07-22 | 2017-07-27 | Roche Diagnostics Hematology, Inc. | Blood analyzer calibration and assessment |
| US9459196B2 (en) | 2011-07-22 | 2016-10-04 | Roche Diagnostics Hematology, Inc. | Blood analyzer calibration and assessment |
| ES2920751T3 (en) * | 2011-07-22 | 2022-08-09 | Roche Diagnostics Hematology Inc | Calibration and evaluation of blood analyzer |
| JP5841766B2 (en) * | 2011-07-25 | 2016-01-13 | 株式会社 堀場アドバンスドテクノ | Water quality analyzer display device, water quality analyzer display program, and water quality analysis system |
| EP2767835B1 (en) * | 2013-02-14 | 2018-10-24 | Mettler-Toledo GmbH | Method for checking an analytical instrument |
| JP2014202608A (en) * | 2013-04-04 | 2014-10-27 | 日本光電工業株式会社 | Method of displaying data for evaluation of external precision management |
| US9916505B2 (en) * | 2014-09-22 | 2018-03-13 | Deere & Company | Method and system for collecting image data |
| TWI770189B (en) * | 2017-07-21 | 2022-07-11 | 日商日立高新技術科學股份有限公司 | Mass analysis device and mass analysis method |
| US20210078006A1 (en) * | 2017-12-20 | 2021-03-18 | Hach Lange Gmbh | A photometer arrangement for determining an analyte in a liquid sample and a method for determining a concentration of an analyte in a liquid sample |
| WO2020021837A1 (en) * | 2018-07-27 | 2020-01-30 | 株式会社日立ハイテクノロジーズ | Automatic analysis system |
| CN109765390A (en) * | 2018-09-14 | 2019-05-17 | 苏州帕诺米克生物医药科技有限公司 | The method of quality control and device of liquid quality detection result |
| US20220034923A1 (en) * | 2018-12-11 | 2022-02-03 | Hitachi High-Tech Corporation | Automatic analyzer |
| WO2021186874A1 (en) * | 2020-03-19 | 2021-09-23 | 株式会社日立ハイテク | Automatic analysis device |
| CN111551978B (en) * | 2020-05-08 | 2022-09-27 | 中国辐射防护研究院 | Method for evaluating uncertainty of radioactive soil sample sampling process |
| CN117434289B (en) * | 2023-12-20 | 2024-02-27 | 北京众驰伟业科技发展有限公司 | Quality control system of full-automatic coagulation tester |
Citations (3)
| Publication number | Priority date | Publication date | Assignee | Title |
|---|---|---|---|---|
| JPH06281656A (en) | 1993-03-29 | 1994-10-07 | Olympus Optical Co Ltd | Analyzer |
| JP2000187037A (en) | 1998-12-24 | 2000-07-04 | Sysmex Corp | Sample analyzing device provided with function of controlling accuracy |
| JP2000266756A (en) | 1999-03-18 | 2000-09-29 | Hitachi Ltd | Automatic analyzer |
Family Cites Families (11)
| Publication number | Priority date | Publication date | Assignee | Title |
|---|---|---|---|---|
| MY107650A (en) * | 1990-10-12 | 1996-05-30 | Exxon Res & Engineering Company | Method of estimating property and / or composition data of a test sample |
| US6509192B1 (en) * | 1992-02-24 | 2003-01-21 | Coulter International Corp. | Quality control method |
| JP3212922B2 (en) * | 1997-09-18 | 2001-09-25 | 株式会社堀場製作所 | Equipment management system in analysis system |
| JP3438607B2 (en) * | 1998-09-25 | 2003-08-18 | 株式会社日立製作所 | Automatic analyzer |
| JP2000105239A (en) * | 1998-09-29 | 2000-04-11 | Hitachi Ltd | Biochemical automatic analyzer |
| JP2003083981A (en) * | 2001-09-14 | 2003-03-19 | Horiba Ltd | Accuracy control system of clinical inspection apparatus |
| US7079986B2 (en) * | 2003-12-31 | 2006-07-18 | Sieracki Jeffrey M | Greedy adaptive signature discrimination system and method |
| JP4500749B2 (en) * | 2005-09-05 | 2010-07-14 | 株式会社日立ハイテクノロジーズ | Automatic analyzer |
| JP4576307B2 (en) * | 2005-09-12 | 2010-11-04 | 株式会社日立ハイテクノロジーズ | Automatic analyzer |
| JP4948020B2 (en) * | 2006-04-12 | 2012-06-06 | ベックマン コールター, インコーポレイテッド | Liquid quality control method and automatic analyzer for analysis support of automatic analyzer |
| EP2042853B1 (en) * | 2006-07-12 | 2014-04-23 | Toyobo Co., Ltd. | Analyzer and use thereof |
-
2008
- 2008-01-31 JP JP2008020039A patent/JP4991586B2/en active Active
-
2009
- 2009-01-24 CN CN200910002828XA patent/CN101498735B/en active Active
- 2009-01-30 US US12/362,818 patent/US8150645B2/en active Active
- 2009-01-30 EP EP09001326.9A patent/EP2093573B1/en active Active
Patent Citations (4)
| Publication number | Priority date | Publication date | Assignee | Title |
|---|---|---|---|---|
| JPH06281656A (en) | 1993-03-29 | 1994-10-07 | Olympus Optical Co Ltd | Analyzer |
| JP3420791B2 (en) | 1993-03-29 | 2003-06-30 | オリンパス光学工業株式会社 | Analysis equipment |
| JP2000187037A (en) | 1998-12-24 | 2000-07-04 | Sysmex Corp | Sample analyzing device provided with function of controlling accuracy |
| JP2000266756A (en) | 1999-03-18 | 2000-09-29 | Hitachi Ltd | Automatic analyzer |
Non-Patent Citations (2)
| Title |
|---|
| ACADEMIC JOURNAL OF JAPANESE ASSOCIATION OF CLINICAL LABORATORY AUTOMATION (JSCLA), vol. 32, no. 1, pages 19 - 25 |
| CLINICAL CHEMISTRY, vol. 36, no. 1, 2007, pages 151 - 153 |
Cited By (3)
| Publication number | Priority date | Publication date | Assignee | Title |
|---|---|---|---|---|
| CN108697141A (en) * | 2015-12-29 | 2018-10-23 | N·V·努特里奇亚 | Nutrient formulation object containing indigestible oligosaccharides and non-replicating lactic acid producing bacteria |
| US20200103333A1 (en) * | 2018-09-28 | 2020-04-02 | Sysmex Corporation | Measurement apparatus and quality control method |
| EP3985398A4 (en) * | 2019-06-11 | 2023-05-10 | Hitachi High-Tech Corporation | Automated analysis device, and abnormality detecting method |
Also Published As
| Publication number | Publication date |
|---|---|
| US8150645B2 (en) | 2012-04-03 |
| JP4991586B2 (en) | 2012-08-01 |
| CN101498735A (en) | 2009-08-05 |
| US20090198463A1 (en) | 2009-08-06 |
| EP2093573B1 (en) | 2022-08-10 |
| EP2093573A3 (en) | 2015-08-05 |
| JP2009180616A (en) | 2009-08-13 |
| CN101498735B (en) | 2012-10-17 |
Similar Documents
| Publication | Publication Date | Title |
|---|---|---|
| EP2093573B1 (en) | Automatic analyzer | |
| US11280733B2 (en) | Automatic analyzer | |
| Kumar et al. | Sigma metrics as a tool for evaluating the performance of internal quality control in a clinical chemistry laboratory | |
| JP5557750B2 (en) | Automatic analyzer | |
| Harr et al. | ASVCP guidelines: allowable total error guidelines for biochemistry | |
| JP5693960B2 (en) | Improved quality assurance system and method for point-of-care testing | |
| EP1835291B1 (en) | Quality control system | |
| US6512986B1 (en) | Method for automated exception-based quality control compliance for point-of-care devices | |
| US11002749B2 (en) | Calibration method | |
| EP2932234B1 (en) | Calibration process and system | |
| Miller et al. | Quality control | |
| Zeng et al. | Practical application of the sigma-metric run size nomogram for multistage bracketed statistical quality control analysis of eight enzymes | |
| US20240044926A1 (en) | System and method for conducting automated clinical diagnostic crossover studies | |
| Garcia | Quality Management | |
| Huang et al. | User competency is still a major factor affecting analytical performance of glucose meters in patient service | |
| Belsey et al. | Evaluation of a laboratory system intended for use in physicians' offices: I. Reliability of results produced by trained laboratory technologists | |
| Ahmed El‐Neanaey et al. | Evaluation of Sigma metric approach for monitoring the performance of automated analyzers in hematology unit of Alexandria Main University Hospital | |
| KR102599838B1 (en) | Lab target range setting method using pooled standard deviation | |
| Huang et al. | Three-year monitoring and comparison of results from two identical blood gas analyzers | |
| Orzechowski et al. | Ensuring suitable quality of clinical measurements through design | |
| Magar et al. | Application of Sigma Metrics for Evaluating Analytical Performance of HbA1C Testing on D10-HbA1C Analyzer | |
| Miller | 10 QUALITY CONTROL | |
| WO2024020392A1 (en) | System and method for customized automated clinical diagnostic crossover studies | |
| Sheik et al. | QUALITY CONTROL IN CLINICAL BIOCHEMISTRY LABORATORY: A GLIMPSE. | |
| Rizk et al. | The Need for Quality for Better Laboratory Performance, Alexandria University Experience |
Legal Events
| Date | Code | Title | Description |
|---|---|---|---|
| PUAI | Public reference made under article 153(3) epc to a published international application that has entered the european phase |
Free format text: ORIGINAL CODE: 0009012 |
|
| AK | Designated contracting states |
Kind code of ref document: A2 Designated state(s): AT BE BG CH CY CZ DE DK EE ES FI FR GB GR HR HU IE IS IT LI LT LU LV MC MK MT NL NO PL PT RO SE SI SK TR |
|
| AX | Request for extension of the european patent |
Extension state: AL BA RS |
|
| 17P | Request for examination filed |
Effective date: 20100211 |
|
| PUAL | Search report despatched |
Free format text: ORIGINAL CODE: 0009013 |
|
| AK | Designated contracting states |
Kind code of ref document: A3 Designated state(s): AT BE BG CH CY CZ DE DK EE ES FI FR GB GR HR HU IE IS IT LI LT LU LV MC MK MT NL NO PL PT RO SE SI SK TR |
|
| AX | Request for extension of the european patent |
Extension state: AL BA RS |
|
| RIC1 | Information provided on ipc code assigned before grant |
Ipc: G01N 35/00 20060101AFI20150630BHEP |
|
| AKX | Designation fees paid |
Designated state(s): DE FR |
|
| AXX | Extension fees paid |
Extension state: BA Extension state: RS Extension state: AL |
|
| STAA | Information on the status of an ep patent application or granted ep patent |
Free format text: STATUS: EXAMINATION IS IN PROGRESS |
|
| 17Q | First examination report despatched |
Effective date: 20191217 |
|
| STAA | Information on the status of an ep patent application or granted ep patent |
Free format text: STATUS: EXAMINATION IS IN PROGRESS |
|
| RAP1 | Party data changed (applicant data changed or rights of an application transferred) |
Owner name: HITACHI HIGH-TECH CORPORATION |
|
| GRAP | Despatch of communication of intention to grant a patent |
Free format text: ORIGINAL CODE: EPIDOSNIGR1 |
|
| STAA | Information on the status of an ep patent application or granted ep patent |
Free format text: STATUS: GRANT OF PATENT IS INTENDED |
|
| INTG | Intention to grant announced |
Effective date: 20220330 |
|
| GRAS | Grant fee paid |
Free format text: ORIGINAL CODE: EPIDOSNIGR3 |
|
| GRAA | (expected) grant |
Free format text: ORIGINAL CODE: 0009210 |
|
| STAA | Information on the status of an ep patent application or granted ep patent |
Free format text: STATUS: THE PATENT HAS BEEN GRANTED |
|
| AK | Designated contracting states |
Kind code of ref document: B1 Designated state(s): DE FR |
|
| RIN1 | Information on inventor provided before grant (corrected) |
Inventor name: FUKUZONO, SHINICHI Inventor name: MIMURA, TOMONORI Inventor name: KAMIHARA, KUMIKO |
|
| REG | Reference to a national code |
Ref country code: DE Ref legal event code: R096 Ref document number: 602009064550 Country of ref document: DE |
|
| PGFP | Annual fee paid to national office [announced via postgrant information from national office to epo] |
Ref country code: FR Payment date: 20230124 Year of fee payment: 15 |
|
| REG | Reference to a national code |
Ref country code: DE Ref legal event code: R097 Ref document number: 602009064550 Country of ref document: DE |
|
| PLBE | No opposition filed within time limit |
Free format text: ORIGINAL CODE: 0009261 |
|
| STAA | Information on the status of an ep patent application or granted ep patent |
Free format text: STATUS: NO OPPOSITION FILED WITHIN TIME LIMIT |
|
| 26N | No opposition filed |
Effective date: 20230511 |
|
| PGFP | Annual fee paid to national office [announced via postgrant information from national office to epo] |
Ref country code: DE Payment date: 20231205 Year of fee payment: 16 |