EP2088813A2 - Method, system and apparatus for modifying a mobile network signal propagation prediction - Google Patents
Method, system and apparatus for modifying a mobile network signal propagation prediction Download PDFInfo
- Publication number
- EP2088813A2 EP2088813A2 EP08253199A EP08253199A EP2088813A2 EP 2088813 A2 EP2088813 A2 EP 2088813A2 EP 08253199 A EP08253199 A EP 08253199A EP 08253199 A EP08253199 A EP 08253199A EP 2088813 A2 EP2088813 A2 EP 2088813A2
- Authority
- EP
- European Patent Office
- Prior art keywords
- prediction
- signal
- predictions
- values
- module
- Prior art date
- Legal status (The legal status is an assumption and is not a legal conclusion. Google has not performed a legal analysis and makes no representation as to the accuracy of the status listed.)
- Granted
Links
- 238000000034 method Methods 0.000 title claims abstract description 32
- 230000001902 propagating effect Effects 0.000 claims abstract description 4
- 238000012937 correction Methods 0.000 claims description 50
- 238000005259 measurement Methods 0.000 claims description 17
- 238000003860 storage Methods 0.000 claims description 15
- 239000011159 matrix material Substances 0.000 claims description 9
- 238000009826 distribution Methods 0.000 description 17
- 238000010586 diagram Methods 0.000 description 12
- 238000007726 management method Methods 0.000 description 8
- 238000005516 engineering process Methods 0.000 description 7
- 230000008569 process Effects 0.000 description 6
- 238000012360 testing method Methods 0.000 description 5
- 238000004422 calculation algorithm Methods 0.000 description 4
- 238000004891 communication Methods 0.000 description 4
- 238000004364 calculation method Methods 0.000 description 3
- 238000009795 derivation Methods 0.000 description 3
- 238000005457 optimization Methods 0.000 description 3
- 230000008859 change Effects 0.000 description 2
- 238000012986 modification Methods 0.000 description 2
- 230000004048 modification Effects 0.000 description 2
- 238000012545 processing Methods 0.000 description 2
- 238000010521 absorption reaction Methods 0.000 description 1
- 238000013459 approach Methods 0.000 description 1
- 238000013480 data collection Methods 0.000 description 1
- 230000000694 effects Effects 0.000 description 1
- 238000011156 evaluation Methods 0.000 description 1
- 230000006870 function Effects 0.000 description 1
- 230000002452 interceptive effect Effects 0.000 description 1
- 238000004519 manufacturing process Methods 0.000 description 1
- 238000010295 mobile communication Methods 0.000 description 1
- 238000012544 monitoring process Methods 0.000 description 1
- 230000003287 optical effect Effects 0.000 description 1
- 238000013439 planning Methods 0.000 description 1
- 230000009467 reduction Effects 0.000 description 1
- 238000012552 review Methods 0.000 description 1
- 239000000523 sample Substances 0.000 description 1
- 239000007787 solid Substances 0.000 description 1
- 238000012546 transfer Methods 0.000 description 1
- 238000013024 troubleshooting Methods 0.000 description 1
Images


Classifications
-
- H—ELECTRICITY
- H04—ELECTRIC COMMUNICATION TECHNIQUE
- H04L—TRANSMISSION OF DIGITAL INFORMATION, e.g. TELEGRAPHIC COMMUNICATION
- H04L41/00—Arrangements for maintenance, administration or management of data switching networks, e.g. of packet switching networks
- H04L41/14—Network analysis or design
- H04L41/147—Network analysis or design for predicting network behaviour
-
- H—ELECTRICITY
- H04—ELECTRIC COMMUNICATION TECHNIQUE
- H04L—TRANSMISSION OF DIGITAL INFORMATION, e.g. TELEGRAPHIC COMMUNICATION
- H04L41/00—Arrangements for maintenance, administration or management of data switching networks, e.g. of packet switching networks
- H04L41/14—Network analysis or design
- H04L41/142—Network analysis or design using statistical or mathematical methods
-
- H—ELECTRICITY
- H04—ELECTRIC COMMUNICATION TECHNIQUE
- H04L—TRANSMISSION OF DIGITAL INFORMATION, e.g. TELEGRAPHIC COMMUNICATION
- H04L43/00—Arrangements for monitoring or testing data switching networks
- H04L43/08—Monitoring or testing based on specific metrics, e.g. QoS, energy consumption or environmental parameters
- H04L43/0823—Errors, e.g. transmission errors
-
- H—ELECTRICITY
- H04—ELECTRIC COMMUNICATION TECHNIQUE
- H04W—WIRELESS COMMUNICATION NETWORKS
- H04W48/00—Access restriction; Network selection; Access point selection
- H04W48/16—Discovering, processing access restriction or access information
Definitions
- This invention relates to a method of and a system for modifying mobile network signal propagation predictions.
- Path loss (also called path attenuation) is the reduction in the power of an electromagnetic wave as it travels from one location to another. Path loss may be due to many effects, such as, for example, a signal being partially absorbed or deflected by trees and buildings along the signal path. Path loss is influenced by terrain contours, environment (e.g., urban vs. rural), propagation medium (dry vs. moist air), the distance between a transmitter and a receiver, and the height and location of antennas.
- environment e.g., urban vs. rural
- propagation medium dry vs. moist air
- Propagation predictions are commonly used in radio network planning and optimization tools. In order to improve prediction accuracy, most propagation models have internal parameters that can be used to fine tune predictions to account for specific propagation conditions over a certain area. Test data is traditionally used to fine-tune propagation models based on a comparison of predicted versus measured signal strength for each location. Optimum propagation model parameters can be derived that minimize the error of the predicted signal strengths. The main disadvantage of this approach, however, is the need for extensive drive testing, which is very time-consuming and not scalable.
- a computer-implemented method for modifying mobile network signal propagation predictions comprises:
- signal characteristics are received from a network management system.
- the signal characteristics correspond to signals propagating in a predetermined portion of a mobile telephone network. Examples of the signal characteristics include values for received signal strength indicators, signal timing advance, and a signal interference matrix.
- An initial signal propagation prediction that corresponds to the predetermined portion of the mobile telephone network is also received.
- the initial signal propagation prediction is modified based on the received signal characteristics to produce a more accurate signal propagation prediction.
- the initial signal propagation prediction may also be modified based on estimated signal characteristics corresponding to the predetermined portion of the mobile telephone network.
- Path loss normally includes propagation losses such as, for example, losses due to absorption and diffraction of the electromagnetic waves.
- a signal radiated by a transmitter may travel along many and different paths to a receiver. This propagation of a signal is called multipath. Multipath can either increase or decrease received signal strength, depending on whether the individual multipath wave fronts interfere constructively or destructively. The total power of interfering waves may vary quickly as a function of location resulting in fast fades which are very sensitive to receiver position.
- Path loss is usually expressed in dB.
- Calculation of the path loss is usually called propagation prediction. Exact propagation predictions are possible only for simple cases. For practical cases the propagation predications are calculated using a variety of methods. Among the most commonly used methods for propagation predictions are COST-231, Okumura-Hata, and W.C.Y.Lee.
- Radio measurement information reported by mobile network stations can be used for propagation model tuning.
- measurement reports are received and processed by a mobile network, which computes a set of radio statistics that are made available for optimization and troubleshooting purposes in general.
- NMS network management system
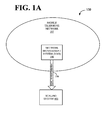
- FIGURE 1A is a block diagram illustrating a communication system 109, according to exemplary features of the invention.
- the communication system 109 includes a network management system (NMS) 106 and a scaling system 100.
- the NMS 106 is a tool for monitoring and managing the mobile telephone network 107.
- the NMS 106 provides the scaling system 100 with signal characteristics 108 corresponding to mobile telephone communications within the mobile telephone network 107.
- the signal characteristics 108 may include, for example, values for received signal strength indicators, signal timing advance, and/or a signal interference matrix.
- An interference matrix includes rows and columns of values that indicate interference between mobile phones or mobile phone sectors.
- a timing advance value is based on a length of time that a signal takes to travel between a mobile phone and a base station.
- a timing advance distribution per sector includes timing advance values for various sectors or portions of sectors.
- the scaling system 100 uses the signal characteristics 108 to revise signal propagation predications for the mobile telephone network 107. For example, the scaling system 100 may compare the signal characteristics 108 with corresponding estimated signal characteristics to determine one or more error factors. Correction factors for scaling propagation predictions may then be determined based on the error factors. For example, correction factors corresponding to a minimum error factor may be selected. Optimum correction factors per sector can be determined using an iterative algorithm. For example, after changing predictions for each sector, the dominance areas, prediction statistics, and prediction correction factors can be re-calculated.
- signal propagation predictions for respective locations within the mobile telephone network are corrected based on one or more correction factors that account for the distance between a mobile telephone and a corresponding base station, the macro-cell propagation model to be optimized, and the clutter type of the location.
- correction factors also referred to herein as path loss correction factors, can be expressed in mathematical terms. Path loss correction factors can be determined for each sector so that an error term corresponding to predicted vs. measured radio performance metrics is minimized.
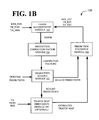
- FIGURE 1B is a block diagram illustrating a scaling system 100 for propagation prediction scaling.
- the scaling system 100 includes a prediction scaling module 101, a prediction statistics module 102, an error measurement module 103, and a prediction correction factor module 104.
- the prediction scaling module 101 computes new scaled predictions based on correction factors received from the prediction correction factor module 104 and on original propagation predictions.
- K1 is a correction for intercept distance attenuation and K2 is a correction prediction attenuation slope with distance.
- Alternative propagation scaling formulas can also be utilized in other features of the invention.
- the prediction statistics module 102 computes estimates for received signal strength indicator (RSSI) levels, an interference matrix (IM), and time advance (TA) values based on the scaled predictions from the prediction scaling module 101 and on a traffic map.
- a traffic map identifies the concentration or intensity of mobile phone signals in corresponding geographical areas.
- the traffic map received by the prediction statistics module 102 may be an actual traffic map or an estimated traffic map.
- An optional traffic map derivation module 105 may be used to provide an estimated traffic map to the prediction statistics module 102.
- the predication statistics module provides the estimates for RSSI, IM, and TA values to the error measurement module 103.
- the error measurement module 103 computes an error metric based on a comparison of estimates for RSSI, IM and TA values with corresponding values received from the NMS.
- An example of IM error metric applicable to individual sectors is illustrated in FIGURE 3 .
- the error measurement module 103 provides the error metric to the prediction correction factor module 104 which uses the error metric to select new K1 and K2 values.
- the correction factor module 104 then provides the new K1 and K2 value to the prediction scaling module 101.
- the prediction correction can be, for example, K1 (area) +K2 (area)*log (distance).
- each predetermined area would have corresponding correction variables K1 and K2.
- This type of correction allows more flexibility in matching RSSI and IM predictions but may create prediction discontinuities between different dominance areas.
- the prediction statistics module 102 computes the new sector dominance areas after prediction scaling. An RSSI probability distribution per pixel is computed on each sector dominance area. The distribution may be calculated over the same RSSI intervals used the by network management system.
- An IM is computed based on average signal-to-interference ratio, probability of signal-to-interference ratio falling below a certain threshold, or a similar metric. This measurement may use the same threshold definitions used in the network management system.
- Time advance probability distribution is computed on each sector dominance area as the percentage of pixels at the different distance intervals from the BTS. The distance intervals for time advance distribution may be fixed and mobile technology dependant.
- FIGURE 2 is a schematic diagram illustrating a traffic map sector 200, according to exemplary features of the invention.
- the traffic map sector 200 includes four time advance zones: zone 201, zone 202, zone 203, and zone 204.
- the traffic map value corresponding to each zone is equal to the time advance value for the zone divided by the area of the zone.
- the traffic map value for zone 202 is equal to the time advance value for zone 202 divided by the area of zone 202.
- a traffic map may be considered when computing prediction statistics.
- a traffic map is often unknown and can be a significant source of uncertainty.
- the traffic map derivation module 105 can be used to provide an estimated traffic map based on time advance distribution information provided by the NMS and on scaled predictions provided by the prediction scaling module 101.
- the units for calculating traffic map intensity may be, for example, Erlangs.
- An Erlang is a dimensionless unit used in telephony as a statistical measure of the volume of telecommunication traffic.
- a time advance distribution defines an amount of traffic at different distance intervals from a base transceiver station (BTS). In Global System for Mobile communications (GSM) systems, distance intervals of, for example, 550 meters may be used.
- a traffic map can be derived by dividing each NMS time advance value by the number of pixels in the corresponding time advance area.
- FIGURE 3 is a block diagram illustrating an example of calculating an IM error metric applicable to individual sectors.
- the error measurement module 3 compares the predicted RSSI, IM and time advance values with corresponding values provided by the NMS. For example, rows and columns from a first IM 310 provided by the NMS may be compared with corresponding rows and columns from a second IM 320 that is based on predicted values.
- An IM row error represents the error in the interference generated to the rest of the sectors by a particular sector.
- An IM column error represents the error of the interference suffered by a particular sector from the rest of the sectors.
- a row 311 from the first IM 310 is compared with a corresponding row 321 from the second IM 320 to determine a sector row error.
- a column 312 from the first IM 310 is compared with a corresponding column 322 from the second IM 320 to determine a sector column error.
- RSSI and TA errors per sector may also computed based on comparisons of predicted RSSI values and RSSI values received from the NMS.
- a global error metric can be computed as a weighted combination of RSSI, IM and TA errors as illustrated, for example, in FIGURE 4 .
- FIGURE 4 is a flow diagram illustrating an example of global error calculation, according to exemplary features of the invention.
- a global error metric may be defined as a weighted addition of RSSI, IM and time advance errors. By setting different weights it is possible to obtain a better matching of some statistics at the expense of the others.
- an IM row error 402 is multiplied by a row error weight 404 to determine a weighted IM row error 406.
- the IM column error 408 is multiplied by a column error weight 410 to determine a weighted IM column error 412.
- the weighted IM row error 406 is added to the weighted IM column error 412 to determine the IM error 414.
- the IM error 414 is multiplied by an IM error weight 416 to determine a weighted IM error 418.
- the RSSI error 420 is multiplied by an RSSI error weight 422 to determine a weighted RSSI error 424.
- a TA error 426 is multiplied by a TA error weight 428 to determine a weighted TA error 430.
- the weighted IM error 418, the weighted RSSI error 424, and the weighted TA error 430 are then summed to determine the global error 432.
- FIGURE 5 is a table illustrating a solution area 500, according to exemplary features of the invention.
- a correction factor can be equal to K1+K2 * log (distance).
- the prediction correction factor module 104 searches K1 and K2 values per sector that minimize the global error as measured by the error measurement module 103. Searching systematically for the optimum K1 and K2 values thorough all possible sectors may or may not be practical, depending on computing capacity. For example for a 300 sector network and fifteen possible values for K1 and K2, the number of evaluations is equal to 47,500.
- FIGURE 6 is a table illustrating an iterative method for determining optimum K1 and K2 values for the solution area 500 shown in FIG. 5 , according to exemplary features of the invention.
- a two-dimensional sliding window 602 is used for each sector.
- An algorithm iterates over all sectors following, for example, either a random or a predetermined order.
- Optimum K1 and K2 values inside the sliding window 602 are found by systematically evaluating the error for each pair of K1 and K2 values.
- the sliding window 602 for each sector is updated after each iteration so that the center of the window is the local minimum of the error. After a number of iterations or when the sliding window cannot be moved within the table so as to be centered on a local minimum, the process stops.
- FIGURE 7 is a flow chart illustrating a routine 700 for scaling predictions for signal propagation, in accordance with exemplary features of the invention.
- the prediction scaling module 101 computes scaled predictions for signal propagation based on correction factors received from the prediction correction factor module 104 and on original propagation predictions.
- the prediction correction can be, for example, K1 (area) +K2 (area)*log (distance).
- the prediction scaling module 101 provides the scaled predictions for signal propagation to the prediction statistics module 102.
- the prediction statistics module 102 computes estimates for received signal strength indicator (RSSI), interference matrix (IM), and/or timing advance (TA) values based on the scaled predictions from the prediction scaling module 101 and on a traffic map.
- the traffic map received by the prediction statistics module 102 may be an actual traffic map or an estimated traffic map.
- An optional traffic map derivation module 105 may be used to provide an estimated traffic map to the prediction statistics module 102.
- the prediction statistics module provides the estimates for RSSI, IM, and TA values to the error measurement module 103.
- the error measurement module 103 then computes an error metric based on a comparison of estimates for RSSI, IM and/or TA values with corresponding values received from the NMS, as implemented at operation 705.
- the error metric may be based on a weighted combination of RSSI, IM, and/or TA errors.
- the error measurement module then provides the error metric to the prediction correction factor module 104, as implemented at operation 706.
- the prediction correction factor module 104 uses error metric to select new correction factor values K1 and K2, as implemented at operation 707.
- a determination is then made as to whether optimal K1 and K2 scaling factors have been identified, as implemented at operation 708. If optimal K1 and K2 scaling factors have been identified, then the routine 700 ends. If optimal K1 and K2 scaling factors have not been identified, then the method 700 returns to operation 701, where the prediction scaling module 101 computes revised scaled predictions based on the new K1 and K2 values.
- FIGURE 8 is a flow chart illustrating an operation 800 for determining optimum correction factors.
- a sector iteration order is defined.
- a new sector is then selected, as implemented at operation 802.
- New K1 and K2 values are selected from a sliding window, as implemented at operation 803.
- An example of a sliding window is shown in FIGURE 6 .
- An error corresponding to the selected K1 and K2 values is then computed, as implemented at operation 804.
- a determination is then made at operation 805 as to whether all K1 and K2 values in the sliding window have been evaluated, as implemented at operation 805.
- the method returns to operation 803 where new K1 and K2 values are selected from the sliding window. However, if it is determined that all K1 and K2 values in the sliding window have been evaluated, then the method proceeds to operation 806 where the best K1 and K2 values are restored, and the sliding window is updated. A determination is then made as to whether there are more sectors to be evaluated, as implemented at operation 807.
- routine 800 returns to operation 802 where a new sector is selected. If, however, a determination is made at operation 808 that there are no more sectors to be evaluated, then a determination is made as whether a total number of iterations has been exceeded. If it is determined that a total number of iterations has not been exceeded, then the routine 800 returns to operation 801, where a sector iteration order is defined. If, however, it is determined that a total number of iterations has been exceeded, then the routine 800 is terminated.
- the same correction factor may initially be applied to all sectors in a network. After a certain time period, the same correction factor may then be applied to sectors belonging to a common site. Eventually, correction factors may be applied individually to each sector such that each sector may have a different correction factor.
- FIGURE 9 is a block diagram illustrating a computer 900 capable of executing the software components presented herein.
- the computer 900 includes a central processing unit (CPU) 902, a system memory 908, including a random access memory (RAM) 914 and a read-only memory (ROM) 916, and a system bus 904 that couples the memory 908 to the CPU 902.
- the computer 900 further includes a mass storage device 910 for storing an operating system 920 and other program modules, which will be described in greater detail below.
- the mass storage device 910 is connected to the CPU 902 through a mass storage controller (not shown) connected to the bus 904.
- the mass storage device 910 and its associated computer-readable media provide non-volatile storage for the computer 900.
- computer-readable media can be any available media that can be accessed by the computer 900.
- computer-readable media may include volatile and non-volatile, removable and non-removable media implemented in any method or technology for storage of information such as computer-readable instructions, data structures, program modules or other data.
- computer-readable media includes, but is not limited to, RAM, ROM, EPROM, EEPROM, flash memory or other solid state memory technology, CD-ROM, digital versatile disks (DVD), HD-DVD, BLU-RAY, or other optical storage, magnetic cassettes, magnetic tape, magnetic disk storage or other magnetic storage devices, or any other medium which can be used to store the desired information and which can be accessed by the computer 900.
- the computer 900 may connect to a network through a network interface unit 906 connected to the bus 904. It should be appreciated that the network interface unit 906 may also be utilized to connect to other types of networks and remote computer systems.
- the computer 900 may also include an input/output controller 912 for receiving and processing input from a number of other devices, including a keyboard, mouse, or electronic stylus (not shown in FIGURE 9 ). Similarly, an input/output controller may provide output to a display screen, a printer, or other type of output device (also not shown in FIGURE 9 ).
- a number of program modules and data files may be stored in the mass storage device 910 and RAM 914 of the computer 900, including the operating system 920 suitable for controlling the operation of the computer 900.
- the mass storage device 910 and RAM 914 may also store one or more program modules.
- the mass storage device 910 and the RAM 914 may store a scaling system 100.
- the scaling system 100 may include a prediction scaling module 101, a prediction statistics module 102, an error measurement module 103, and a prediction correction factor module 104, as shown in FIGURE 1 . These modules 101-104 may be configured to operate as illustrated, for example, in FIGURE 7 .
- Other program modules may also be stored in the mass storage device 910 and utilized by the computer 900.
- any OSS counter like RSSI and IM probability distribution, may be matched by performing pixel scaling.
- matching may be performed by defining the RSSI values per pixel that result in a match with OSS statistics.
- the OSS statistics are known inside the dominance area of the strongest server.
- a dominance area of N pixels There are many different ways to assign N RSSI values to N pixels. According to features of the invention, this may be done following different algorithms and, depending on the information available, based on a most probably location principle. For example, lowest scaled RSSI values may be assigned to pixels with lowest predicted RSSI values.
- Some OSS statistics are not a direct measure of RSSI values, but are influenced by them. For example, C/I distributions in GSM systems or Ec/Io distributions in UMTS systems. In those cases, the N values that match the C/I or Ec/Io distribution are identified and, in a second phase, the RSSI pixel values that result in the N scaled C/I or Ec/Io pixel values are located.
- the objective is to identify RSSI pixel values for serving cells and the interferers that match RxLEV and C/I distributions reported by the OSS.
- OSS statistics are computed in a dominance area. Therefore, the number of RSSI and C/I samples coincides with the number of pixels of the dominance area. For a dominance area with N pixels the following samples are found: N RSSI values of serving cell that matches with serving cell level distribution; N C/I values that matches with C/I distribution of interferer 1; N C/I values that matches with C/I distribution of interferer 2; N C/I values that matches with C/I distribution of interferer 3; and so on. Algorithms for finding a number of samples that match optimally with a specific probability distribution are known to those in the art.
- the N RSSI values may then be assigned to pixels in the dominance area.
- the lowest RSSI value is assigned to the pixel with the lowest predicted RSSI values, which is considered to be scaled. This process is repeated until all N values have been assigned to all available pixels (all pixels are scaled). While scaling RSSI values of the serving cell, all interferers are scaled up or down in order to keep C/I per pixel unchanged.
- FIGURE 10 The pixel scaling process for best server RSSI and one of the interferers is depicted in FIGURE 10 .
- FIGURE 11 A comparison of OSS C/I statistics vs. predicted C/I before and after pixel scaling is depicted in FIGURE 11 . Note that because of the limited number of pixels in the dominance area, the matching is not perfect for some interferer-victims relationships.
Abstract
Description
- This invention relates to a method of and a system for modifying mobile network signal propagation predictions.
- A wireless telephone signal experiences path loss as it propagates from a mobile telephone to a mobile network transceiver. Path loss (also called path attenuation) is the reduction in the power of an electromagnetic wave as it travels from one location to another. Path loss may be due to many effects, such as, for example, a signal being partially absorbed or deflected by trees and buildings along the signal path. Path loss is influenced by terrain contours, environment (e.g., urban vs. rural), propagation medium (dry vs. moist air), the distance between a transmitter and a receiver, and the height and location of antennas.
- Propagation predictions are commonly used in radio network planning and optimization tools. In order to improve prediction accuracy, most propagation models have internal parameters that can be used to fine tune predictions to account for specific propagation conditions over a certain area. Test data is traditionally used to fine-tune propagation models based on a comparison of predicted versus measured signal strength for each location. Optimum propagation model parameters can be derived that minimize the error of the predicted signal strengths. The main disadvantage of this approach, however, is the need for extensive drive testing, which is very time-consuming and not scalable.
- It is with respect to these considerations and others that the disclosure presented herein has been made.
- According to the present invention, a computer-implemented method for modifying mobile network signal propagation predictions, comprises:
- i) receiving from a network management system first signal characteristics corresponding to signals propagating in a predetermined portion of a mobile telephone network;
- ii) receiving a first signal propagation prediction corresponding to the predetermined portion of the mobile telephone network; and
- iii) modifying the first signal propagation prediction to produce a second signal propagation prediction based on the first signal characteristics.
- This and further features of the present invention are set forth in the appended claims.
- Technologies are provided herein for modifying mobile network signal propagation predictions. According to features of the invention, signal characteristics are received from a network management system. The signal characteristics correspond to signals propagating in a predetermined portion of a mobile telephone network. Examples of the signal characteristics include values for received signal strength indicators, signal timing advance, and a signal interference matrix.
- An initial signal propagation prediction that corresponds to the predetermined portion of the mobile telephone network is also received. The initial signal propagation prediction is modified based on the received signal characteristics to produce a more accurate signal propagation prediction. The initial signal propagation prediction may also be modified based on estimated signal characteristics corresponding to the predetermined portion of the mobile telephone network.
- It should be appreciated that the above-described subject matter may also be implemented as a computer-controlled apparatus, a computer process, a computing system, or as an article of manufacture such as a computer-readable medium. These and various other features will be apparent from a reading of the following Detailed Description and a review of the associated drawings.
- This Summary is provided to introduce a selection of concepts in a simplified form that are further described below in the Detailed Description. This Summary is not intended to identify key features or essential features of the claimed subject matter, nor is it intended that this Summary be used to limit the scope of the claimed subject matter. Furthermore, the claimed subject matter is not limited to implementations that solve any or all disadvantages noted in any part of this disclosure.
-
-
FIGURE 1A is a block diagram illustrating a communication system, according to exemplary features of the invention; -
FIGURE 1B is a block diagram illustrating a scaling system for propagation prediction scaling in one exemplary feature of the invention; -
FIGURE 2 is a schematic diagram illustrating a traffic map sector, according to exemplary features of the invention; -
FIGURE 3 is a block diagram illustrating an example of calculating an interference matrix error metric applicable to individual sectors in one embodiment; -
FIGURE 4 is a flow diagram illustrating an example of global error calculation, according to exemplary features of the invention; -
FIGURE 5 is a table illustrating a solution area used to determine a correction factor, according to exemplary features of the invention; -
FIGURE 6 is a table illustrating an iterative method for determining optimum correction factors for the solution area shown inFIGURE 5 , according to exemplary features of the invention; -
FIGURE 7 is a flow chart illustrating a method for scaling predictions for signal propagation, in accordance with exemplary features of the invention; -
FIGURE 8 is a flow chart illustrating a method for determining optimum correction factors; -
FIGURE 9 is a block diagram illustrating a computer capable of implementing aspects of the technologies presented herein, in accordance with exemplary features of the invention; -
FIGURE 10 illustrates a pixel scaling process for best server RSSI and one of the interferers in one embodiment; and -
FIGURE 11 shows a comparison of OSS C/I statistics vs. predicted C/I before and after pixel scaling is depicted according to one embodiment. - The following detailed description is directed to technologies for modifying mobile network signal propagation predictions. In the following detailed description, references are made to the accompanying drawings that form a part hereof, and which are shown by way of exemplary features of the invention and implementations.
- Note that although the subject matter presented herein has been described in conjunction with one or more particular features of the invention and implementations, it is to be understood that the features of the invention are not necessarily limited to the specific structure, configuration, or functionality described herein. Rather, the specific structure, configuration, and functionality described herein are disclosed as examples. Various modifications and changes may be made to the subject matter described herein without following the exemplary features of the invention and applications illustrated and described, and without departing from the scope of the features of the invention.
- Referring now to the FIGURES, technologies for modifying mobile network signal propagation predictions will be described. Path loss normally includes propagation losses such as, for example, losses due to absorption and diffraction of the electromagnetic waves. Furthermore, a signal radiated by a transmitter may travel along many and different paths to a receiver. This propagation of a signal is called multipath. Multipath can either increase or decrease received signal strength, depending on whether the individual multipath wave fronts interfere constructively or destructively. The total power of interfering waves may vary quickly as a function of location resulting in fast fades which are very sensitive to receiver position.
- Path loss is usually expressed in dB. In its simplest form, the path loss can be calculated using the formula L = 10 n log10 (d) + C, where L is the path loss in decibels, n is the path loss exponent, d is the distance between the transmitter and the receiver (usually measured in meters), and C is a constant which accounts for system losses. Calculation of the path loss is usually called propagation prediction. Exact propagation predictions are possible only for simple cases. For practical cases the propagation predications are calculated using a variety of methods. Among the most commonly used methods for propagation predictions are COST-231, Okumura-Hata, and W.C.Y.Lee.
- Propagation models having optimized model parameters can be used to provide more accurate signal strength predictions. Radio measurement information reported by mobile network stations can be used for propagation model tuning. For example, measurement reports are received and processed by a mobile network, which computes a set of radio statistics that are made available for optimization and troubleshooting purposes in general. Using processed statistics from a network management system (NMS) instead of test measurements substantially reduces the amount of data to be managed and reduces or eliminates the need for special features or probes for collecting mobile network test measurement data and for manual data collection (e.g., drive tests).
-
FIGURE 1A is a block diagram illustrating acommunication system 109, according to exemplary features of the invention. Thecommunication system 109 includes a network management system (NMS) 106 and ascaling system 100. TheNMS 106 is a tool for monitoring and managing themobile telephone network 107. TheNMS 106 provides thescaling system 100 withsignal characteristics 108 corresponding to mobile telephone communications within themobile telephone network 107. Thesignal characteristics 108 may include, for example, values for received signal strength indicators, signal timing advance, and/or a signal interference matrix. An interference matrix includes rows and columns of values that indicate interference between mobile phones or mobile phone sectors. A timing advance value is based on a length of time that a signal takes to travel between a mobile phone and a base station. A timing advance distribution per sector includes timing advance values for various sectors or portions of sectors. - The
scaling system 100 uses thesignal characteristics 108 to revise signal propagation predications for themobile telephone network 107. For example, thescaling system 100 may compare thesignal characteristics 108 with corresponding estimated signal characteristics to determine one or more error factors. Correction factors for scaling propagation predictions may then be determined based on the error factors. For example, correction factors corresponding to a minimum error factor may be selected. Optimum correction factors per sector can be determined using an iterative algorithm. For example, after changing predictions for each sector, the dominance areas, prediction statistics, and prediction correction factors can be re-calculated. - According to exemplary features of the invention, signal propagation predictions for respective locations within the mobile telephone network are corrected based on one or more correction factors that account for the distance between a mobile telephone and a corresponding base station, the macro-cell propagation model to be optimized, and the clutter type of the location. These correction factors, also referred to herein as path loss correction factors, can be expressed in mathematical terms. Path loss correction factors can be determined for each sector so that an error term corresponding to predicted vs. measured radio performance metrics is minimized.
-
FIGURE 1B is a block diagram illustrating ascaling system 100 for propagation prediction scaling. Thescaling system 100 includes aprediction scaling module 101, a prediction statistics module 102, anerror measurement module 103, and a prediction correction factor module 104. Theprediction scaling module 101 computes new scaled predictions based on correction factors received from the prediction correction factor module 104 and on original propagation predictions. According to exemplary features of the invention, theprediction scaling module 101 uses the following formula: scaled predictions (azimuth, distance) = original predictions (azimuth, distance) + K1 + K2 * log10 (distance), where K1 and K2 are correction factors that can have positive or negative values. K1 is a correction for intercept distance attenuation and K2 is a correction prediction attenuation slope with distance. Alternative propagation scaling formulas can also be utilized in other features of the invention. - The prediction statistics module 102 computes estimates for received signal strength indicator (RSSI) levels, an interference matrix (IM), and time advance (TA) values based on the scaled predictions from the
prediction scaling module 101 and on a traffic map. A traffic map identifies the concentration or intensity of mobile phone signals in corresponding geographical areas. The traffic map received by the prediction statistics module 102 may be an actual traffic map or an estimated traffic map. An optional trafficmap derivation module 105 may be used to provide an estimated traffic map to the prediction statistics module 102. The predication statistics module provides the estimates for RSSI, IM, and TA values to theerror measurement module 103. - The
error measurement module 103 computes an error metric based on a comparison of estimates for RSSI, IM and TA values with corresponding values received from the NMS. An example of IM error metric applicable to individual sectors is illustrated inFIGURE 3 . Theerror measurement module 103 provides the error metric to the prediction correction factor module 104 which uses the error metric to select new K1 and K2 values. The correction factor module 104 then provides the new K1 and K2 value to theprediction scaling module 101. - Since network management system statistics are associated with sectors, it is also possible to correct predictions depending on which sector dominance area the pixels to be scaled are located in. In this case, the prediction correction can be, for example, K1 (area) +K2 (area)*log (distance). In other words, each predetermined area would have corresponding correction variables K1 and K2. This type of correction allows more flexibility in matching RSSI and IM predictions but may create prediction discontinuities between different dominance areas. According to exemplary features of the invention, the prediction statistics module 102 computes the new sector dominance areas after prediction scaling. An RSSI probability distribution per pixel is computed on each sector dominance area. The distribution may be calculated over the same RSSI intervals used the by network management system.
- An IM is computed based on average signal-to-interference ratio, probability of signal-to-interference ratio falling below a certain threshold, or a similar metric. This measurement may use the same threshold definitions used in the network management system. Time advance probability distribution is computed on each sector dominance area as the percentage of pixels at the different distance intervals from the BTS. The distance intervals for time advance distribution may be fixed and mobile technology dependant.
-
FIGURE 2 is a schematic diagram illustrating atraffic map sector 200, according to exemplary features of the invention. Thetraffic map sector 200 includes four time advance zones:zone 201,zone 202,zone 203, andzone 204. The traffic map value corresponding to each zone is equal to the time advance value for the zone divided by the area of the zone. For example, the traffic map value forzone 202 is equal to the time advance value forzone 202 divided by the area ofzone 202. - A traffic map may be considered when computing prediction statistics. A traffic map is often unknown and can be a significant source of uncertainty. The traffic
map derivation module 105 can be used to provide an estimated traffic map based on time advance distribution information provided by the NMS and on scaled predictions provided by theprediction scaling module 101. - The units for calculating traffic map intensity may be, for example, Erlangs. An Erlang is a dimensionless unit used in telephony as a statistical measure of the volume of telecommunication traffic. A time advance distribution defines an amount of traffic at different distance intervals from a base transceiver station (BTS). In Global System for Mobile communications (GSM) systems, distance intervals of, for example, 550 meters may be used. A traffic map can be derived by dividing each NMS time advance value by the number of pixels in the corresponding time advance area.
-
FIGURE 3 is a block diagram illustrating an example of calculating an IM error metric applicable to individual sectors. Theerror measurement module 3 compares the predicted RSSI, IM and time advance values with corresponding values provided by the NMS. For example, rows and columns from afirst IM 310 provided by the NMS may be compared with corresponding rows and columns from asecond IM 320 that is based on predicted values. An IM row error represents the error in the interference generated to the rest of the sectors by a particular sector. An IM column error represents the error of the interference suffered by a particular sector from the rest of the sectors. As an example, arow 311 from thefirst IM 310 is compared with acorresponding row 321 from thesecond IM 320 to determine a sector row error. Similarly, acolumn 312 from thefirst IM 310 is compared with acorresponding column 322 from thesecond IM 320 to determine a sector column error. RSSI and TA errors per sector may also computed based on comparisons of predicted RSSI values and RSSI values received from the NMS. A global error metric can be computed as a weighted combination of RSSI, IM and TA errors as illustrated, for example, inFIGURE 4 . -
FIGURE 4 is a flow diagram illustrating an example of global error calculation, according to exemplary features of the invention. A global error metric may be defined as a weighted addition of RSSI, IM and time advance errors. By setting different weights it is possible to obtain a better matching of some statistics at the expense of the others. In the example shown inFIGURE 4 , anIM row error 402 is multiplied by arow error weight 404 to determine a weightedIM row error 406. TheIM column error 408 is multiplied by acolumn error weight 410 to determine a weightedIM column error 412. The weightedIM row error 406 is added to the weightedIM column error 412 to determine theIM error 414. TheIM error 414 is multiplied by anIM error weight 416 to determine aweighted IM error 418. TheRSSI error 420 is multiplied by anRSSI error weight 422 to determine aweighted RSSI error 424. ATA error 426 is multiplied by aTA error weight 428 to determine aweighted TA error 430. Theweighted IM error 418, theweighted RSSI error 424, and theweighted TA error 430 are then summed to determine theglobal error 432. -
FIGURE 5 is a table illustrating asolution area 500, according to exemplary features of the invention. As mentioned above, a correction factor can be equal to K1+K2 * log (distance). The prediction correction factor module 104 searches K1 and K2 values per sector that minimize the global error as measured by theerror measurement module 103. Searching systematically for the optimum K1 and K2 values thorough all possible sectors may or may not be practical, depending on computing capacity. For example for a 300 sector network and fifteen possible values for K1 and K2, the number of evaluations is equal to 47,500. -
FIGURE 6 is a table illustrating an iterative method for determining optimum K1 and K2 values for thesolution area 500 shown inFIG. 5 , according to exemplary features of the invention. For each sector, a two-dimensional slidingwindow 602 is used. An algorithm iterates over all sectors following, for example, either a random or a predetermined order. Optimum K1 and K2 values inside the slidingwindow 602 are found by systematically evaluating the error for each pair of K1 and K2 values. The slidingwindow 602 for each sector is updated after each iteration so that the center of the window is the local minimum of the error. After a number of iterations or when the sliding window cannot be moved within the table so as to be centered on a local minimum, the process stops. -
FIGURE 7 is a flow chart illustrating a routine 700 for scaling predictions for signal propagation, in accordance with exemplary features of the invention. As implemented atoperation 701, theprediction scaling module 101 computes scaled predictions for signal propagation based on correction factors received from the prediction correction factor module 104 and on original propagation predictions. According to exemplary features of the invention, theprediction scaling module 101 may use the following formula: scaled predictions (azimuth, distance) = original predictions (azimuth, distance) + K1 + K2 * log10 (distance), where K1 and K2 are correction factors that can have positive or negative values. - Note that alternative propagation scaling formulas may be used. Since network management system statistics are associated with sectors, it is also possible to correct predictions depending on which sector dominance area the pixels to be scaled are located in. In this case, the prediction correction can be, for example, K1 (area) +K2 (area)*log (distance).
- As implemented at
operation 702, theprediction scaling module 101 provides the scaled predictions for signal propagation to the prediction statistics module 102. Then, as implemented atoperation 703, the prediction statistics module 102 computes estimates for received signal strength indicator (RSSI), interference matrix (IM), and/or timing advance (TA) values based on the scaled predictions from theprediction scaling module 101 and on a traffic map. The traffic map received by the prediction statistics module 102 may be an actual traffic map or an estimated traffic map. An optional trafficmap derivation module 105 may be used to provide an estimated traffic map to the prediction statistics module 102. - As implemented at
operation 704, the prediction statistics module provides the estimates for RSSI, IM, and TA values to theerror measurement module 103. Theerror measurement module 103 then computes an error metric based on a comparison of estimates for RSSI, IM and/or TA values with corresponding values received from the NMS, as implemented atoperation 705. The error metric may be based on a weighted combination of RSSI, IM, and/or TA errors. - The error measurement module then provides the error metric to the prediction correction factor module 104, as implemented at
operation 706. The prediction correction factor module 104 uses error metric to select new correction factor values K1 and K2, as implemented atoperation 707. A determination is then made as to whether optimal K1 and K2 scaling factors have been identified, as implemented atoperation 708. If optimal K1 and K2 scaling factors have been identified, then the routine 700 ends. If optimal K1 and K2 scaling factors have not been identified, then themethod 700 returns tooperation 701, where theprediction scaling module 101 computes revised scaled predictions based on the new K1 and K2 values. -
FIGURE 8 is a flow chart illustrating anoperation 800 for determining optimum correction factors. As implemented at operation 801, a sector iteration order is defined. A new sector is then selected, as implemented atoperation 802. New K1 and K2 values are selected from a sliding window, as implemented atoperation 803. An example of a sliding window is shown inFIGURE 6 . An error corresponding to the selected K1 and K2 values is then computed, as implemented atoperation 804. A determination is then made atoperation 805 as to whether all K1 and K2 values in the sliding window have been evaluated, as implemented atoperation 805. - If it is determined that not all K1 and K2 values in the sliding window have been evaluated, then the method returns to
operation 803 where new K1 and K2 values are selected from the sliding window. However, if it is determined that all K1 and K2 values in the sliding window have been evaluated, then the method proceeds tooperation 806 where the best K1 and K2 values are restored, and the sliding window is updated. A determination is then made as to whether there are more sectors to be evaluated, as implemented atoperation 807. - If a determination is made that there are more sectors to be evaluated, then the routine 800 returns to
operation 802 where a new sector is selected. If, however, a determination is made atoperation 808 that there are no more sectors to be evaluated, then a determination is made as whether a total number of iterations has been exceeded. If it is determined that a total number of iterations has not been exceeded, then the routine 800 returns to operation 801, where a sector iteration order is defined. If, however, it is determined that a total number of iterations has been exceeded, then the routine 800 is terminated. - In cases where the predictions are inaccurate and because prediction correction is based on a statistical matching, some sectors may end up with unrealistic predictions and/or dominance area size. In order to avoid this problem, the same correction factor may initially be applied to all sectors in a network. After a certain time period, the same correction factor may then be applied to sectors belonging to a common site. Eventually, correction factors may be applied individually to each sector such that each sector may have a different correction factor.
-
FIGURE 9 is a block diagram illustrating acomputer 900 capable of executing the software components presented herein. Thecomputer 900 includes a central processing unit (CPU) 902, a system memory 908, including a random access memory (RAM) 914 and a read-only memory (ROM) 916, and asystem bus 904 that couples the memory 908 to theCPU 902. A basic input/output system containing the basic routines that help to transfer information between elements within thecomputer 900, such as during startup, is stored in the ROM 916. Thecomputer 900 further includes a mass storage device 910 for storing anoperating system 920 and other program modules, which will be described in greater detail below. - The mass storage device 910 is connected to the
CPU 902 through a mass storage controller (not shown) connected to thebus 904. The mass storage device 910 and its associated computer-readable media provide non-volatile storage for thecomputer 900. Although the description of computer-readable media contained herein refers to a mass storage device, such as a hard disk or CD-ROM drive, it should be appreciated by those skilled in the art that computer-readable media can be any available media that can be accessed by thecomputer 900. - By way of example, and not limitation, computer-readable media may include volatile and non-volatile, removable and non-removable media implemented in any method or technology for storage of information such as computer-readable instructions, data structures, program modules or other data. For example, computer-readable media includes, but is not limited to, RAM, ROM, EPROM, EEPROM, flash memory or other solid state memory technology, CD-ROM, digital versatile disks (DVD), HD-DVD, BLU-RAY, or other optical storage, magnetic cassettes, magnetic tape, magnetic disk storage or other magnetic storage devices, or any other medium which can be used to store the desired information and which can be accessed by the
computer 900. - The
computer 900 may connect to a network through anetwork interface unit 906 connected to thebus 904. It should be appreciated that thenetwork interface unit 906 may also be utilized to connect to other types of networks and remote computer systems. Thecomputer 900 may also include an input/output controller 912 for receiving and processing input from a number of other devices, including a keyboard, mouse, or electronic stylus (not shown inFIGURE 9 ). Similarly, an input/output controller may provide output to a display screen, a printer, or other type of output device (also not shown inFIGURE 9 ). - As mentioned briefly above, a number of program modules and data files may be stored in the mass storage device 910 and
RAM 914 of thecomputer 900, including theoperating system 920 suitable for controlling the operation of thecomputer 900. The mass storage device 910 andRAM 914 may also store one or more program modules. In particular, the mass storage device 910 and theRAM 914 may store ascaling system 100. Thescaling system 100 may include aprediction scaling module 101, a prediction statistics module 102, anerror measurement module 103, and a prediction correction factor module 104, as shown inFIGURE 1 . These modules 101-104 may be configured to operate as illustrated, for example, inFIGURE 7 . Other program modules may also be stored in the mass storage device 910 and utilized by thecomputer 900. - It should be appreciated that, in the extreme case where the propagation correction factor is different for each pixel, it is possible to scale individual RSSI pixel values without affecting to other pixels. This case is, therefore, referred to as "pixel scaling" instead of "propagation model scaling" as described above. Virtually any OSS counter, like RSSI and IM probability distribution, may be matched by performing pixel scaling. In particular, matching may be performed by defining the RSSI values per pixel that result in a match with OSS statistics.
- The OSS statistics are known inside the dominance area of the strongest server. Consider, for example, a dominance area of N pixels. There are many different ways to assign N RSSI values to N pixels. According to features of the invention, this may be done following different algorithms and, depending on the information available, based on a most probably location principle. For example, lowest scaled RSSI values may be assigned to pixels with lowest predicted RSSI values.
- Some OSS statistics are not a direct measure of RSSI values, but are influenced by them. For example, C/I distributions in GSM systems or Ec/Io distributions in UMTS systems. In those cases, the N values that match the C/I or Ec/Io distribution are identified and, in a second phase, the RSSI pixel values that result in the N scaled C/I or Ec/Io pixel values are located.
- One example of pixel scaling for GSM system is described below. In this embodiment, the objective is to identify RSSI pixel values for serving cells and the interferers that match RxLEV and C/I distributions reported by the OSS. OSS statistics are computed in a dominance area. Therefore, the number of RSSI and C/I samples coincides with the number of pixels of the dominance area. For a dominance area with N pixels the following samples are found: N RSSI values of serving cell that matches with serving cell level distribution; N C/I values that matches with C/I distribution of
interferer 1; N C/I values that matches with C/I distribution ofinterferer 2; N C/I values that matches with C/I distribution ofinterferer 3; and so on. Algorithms for finding a number of samples that match optimally with a specific probability distribution are known to those in the art. - According to features of the invention, the N RSSI values may then be assigned to pixels in the dominance area. The lowest RSSI value is assigned to the pixel with the lowest predicted RSSI values, which is considered to be scaled. This process is repeated until all N values have been assigned to all available pixels (all pixels are scaled). While scaling RSSI values of the serving cell, all interferers are scaled up or down in order to keep C/I per pixel unchanged. A similar process may be applied to the N C/I values for each interferer. In this case, the assigning criteria is predicted C/I values. After C/I is scaled, the RSSI value for an interferer can be found as RSSIinterferer [dBm] = RSSIserving [dBm]- C/I at each pixel.
- The pixel scaling process for best server RSSI and one of the interferers is depicted in
FIGURE 10 . A comparison of OSS C/I statistics vs. predicted C/I before and after pixel scaling is depicted inFIGURE 11 . Note that because of the limited number of pixels in the dominance area, the matching is not perfect for some interferer-victims relationships. - It should also be appreciated that, after implementing antenna changes in a real network, the OSS statistics will change. The estimation of this change is important for wireless network optimization. One way to accomplish this is to re-compute new predictions after antenna changes with the pixel scaled path-loss.
- Although the subject matter presented herein has been described in conjunction with one or more particular features of the invention and implementations, it is to be understood that the features of the invention defined in the appended claims are not necessarily limited to the specific structure, configuration, or functionality described herein. Rather, the specific structure, configuration, and functionality are disclosed as example forms of implementing the claims. Various modifications and changes may be made to the subject matter described herein without following the example features of the invention and applications illustrated and described, and without departing from the scope of the invention, which is set forth in the following claims.
Claims (13)
- A computer-implemented method for modifying mobile network signal propagation predictions, comprising:i) receiving from a network management system (106) first signal characteristics (108) corresponding to signals propagating in a predetermined portion of a mobile telephone network (107);ii) receiving a first signal propagation prediction corresponding to the predetermined portion of the mobile telephone network; andiii) modifying the first signal propagation prediction to produce a second signal propagation prediction based on the first signal characteristics.
- The method of claim 1, wherein the first signal characteristics (108) include at least two of:received signal strength indicator values,an interference matrix, andtiming advance values.
- The method of claim 1 or claim 2, further comprising using the second signal propagation prediction and a traffic map (200) corresponding to the portion of the mobile telephone network (107) to produce estimated signal characteristics corresponding to the predetermined portion of the mobile telephone network (107).
- The method of claim 3, wherein the traffic map (200) is based on timing advance values received from the network management system (106).
- The method of claim 3 or claim 4, further comprising comparing the estimated signal characteristics to the first signal characteristics (108) received from the network management system.
- The method of claim 5, wherein comparing the estimated signal characteristics to the first signal characteristics (108) comprises comparing at least two of:received signal strength indicator values,interference matrices, andtime advance values.
- The method of any of claims 3 to 5, further comprising generating an error metric responsive to comparing the estimated signal characteristics to the first signal characteristics (108).
- The method of claim 7, further comprising computing a correction factor based on the error metric, wherein the correction factor is used to modify the first signal propagation prediction to produce the second signal propagation prediction
- The method of claim 8 or claim 9, wherein the correction factor includes a constant portion and a variable portion, the variable portion being responsive to a distance between a transmitter and a receiver of a corresponding mobile telephone signal.
- The method of claim 8, wherein a plurality of correction factors are computed for a plurality of respective sectors of the mobile telephone network (107), the plurality of correction factors being used to modify signal propagation predictions for the plurality of respective sectors.
- A system for modifying mobile network signal propagation predictions, comprising:i) a processor (902); andii) memory (908) comprising instructions configured to enable the processor to execute the method of any of claims 1 to 10.
- A system as claimed in claim 11, comprising a network management system (106) and a scaling system (100) including:i) a prediction scaling module (101) arranged to compute new scaled predictions based on correction factors (K1, K2) received from an prediction correction factor module (104) and on original propagation predictions,ii) a prediction statistics module (102) arranged;a) to compute estimates for received signal strength indicator levels, an interference matrix, and time advance values based on the scaled predictions from the prediction scaling module (101) and on a traffic map, and,b) provide the estimates to an error measurement module (103), whereiniii) the error measurement module (103) is arranged to:a) compute an error metric based on a comparison of estimates for received signal strength indicator level, interference matrix and time advance values with corresponding values received from the network management system (106), andb) provide the error metric to the prediction correction factor module (104); and,iv) the prediction correction factor module (104) is arranged to:a) use the error metric to select new correction factors (K1, K2), andb) provide the new correction factors (K1, K2) to the prediction scaling module (101).
- A computer readable storage medium for modifying mobile network signal propagation predictions, comprising instructions, which when executed by a computer (900), cause the computer to execute the method of any of claims 1 to 10.
Applications Claiming Priority (1)
| Application Number | Priority Date | Filing Date | Title |
|---|---|---|---|
| US12/027,524 US8385908B2 (en) | 2008-02-07 | 2008-02-07 | Modifying mobile network signal propagation predictions |
Publications (3)
| Publication Number | Publication Date |
|---|---|
| EP2088813A2 true EP2088813A2 (en) | 2009-08-12 |
| EP2088813A3 EP2088813A3 (en) | 2010-08-11 |
| EP2088813B1 EP2088813B1 (en) | 2019-08-21 |
Family
ID=40677612
Family Applications (1)
| Application Number | Title | Priority Date | Filing Date |
|---|---|---|---|
| EP08253199.7A Active EP2088813B1 (en) | 2008-02-07 | 2008-10-01 | Method, systems and apparatus for modifying a mobile network signal propagation prediction |
Country Status (2)
| Country | Link |
|---|---|
| US (1) | US8385908B2 (en) |
| EP (1) | EP2088813B1 (en) |
Cited By (3)
| Publication number | Priority date | Publication date | Assignee | Title |
|---|---|---|---|---|
| US9271157B2 (en) | 2013-11-25 | 2016-02-23 | Motorola Solutions, Inc. | Method of and system for optimizing an empirical propagation prediction model in a mobile communications network |
| EP3389221A1 (en) * | 2017-04-12 | 2018-10-17 | Netscout Systems, Inc. | Network table error detection using call trace records |
| EP4167618A4 (en) * | 2020-06-24 | 2023-12-20 | Huawei Technologies Co., Ltd. | Wireless signal propagation prediction method and apparatus |
Families Citing this family (6)
| Publication number | Priority date | Publication date | Assignee | Title |
|---|---|---|---|---|
| WO2010067560A1 (en) * | 2008-12-09 | 2010-06-17 | 日本電気株式会社 | Radio environment data correcting system, method and program |
| US8594674B2 (en) * | 2010-02-01 | 2013-11-26 | Lg Electronics Inc. | Measurement method for generating cell coverage map and device for the same |
| US8886991B2 (en) * | 2012-10-26 | 2014-11-11 | Lsi Corporation | Sector failure prediction method and related system |
| US9913146B2 (en) * | 2016-01-06 | 2018-03-06 | Southern Methodist University | Using geographical features to reduce in-field propagation experimentation |
| WO2021013367A1 (en) | 2019-07-25 | 2021-01-28 | Telefonaktiebolaget Lm Ericsson (Publ) | Kpi-based tilt range selection |
| US11683090B1 (en) | 2022-01-18 | 2023-06-20 | T-Mobile Usa, Inc. | Laser-based enhancement of signal propagation path for mobile communications |
Citations (3)
| Publication number | Priority date | Publication date | Assignee | Title |
|---|---|---|---|---|
| EP1098546A2 (en) * | 1999-11-04 | 2001-05-09 | Lucent Technologies Inc. | Methods and apparatus for derivative based optimization of wireless network performance |
| WO2002073997A1 (en) * | 2001-03-09 | 2002-09-19 | Cellular Design Services Limited | Measurement-based prediction method for radiation path loss |
| WO2005069666A1 (en) * | 2004-01-15 | 2005-07-28 | Radioplan Gmbh | Method and device for adapting a radio network model to the conditions of a real radio network |
Family Cites Families (4)
| Publication number | Priority date | Publication date | Assignee | Title |
|---|---|---|---|---|
| US6161018A (en) * | 1998-02-27 | 2000-12-12 | Motorola, Inc. | Method and system for estimating a subscriber's location in a wireless communication system service area |
| US6834180B1 (en) * | 2000-06-30 | 2004-12-21 | Cellco Partnership | Radio propagation model calibration software |
| US6640089B1 (en) * | 2000-11-13 | 2003-10-28 | Verizon Laboratories Inc. | System and method for adaptively predicting radio wave propagation |
| US20040185786A1 (en) * | 2001-04-25 | 2004-09-23 | Ramin Mirbaha | Quality of service state predictor for and advanced mobile devices |
-
2008
- 2008-02-07 US US12/027,524 patent/US8385908B2/en active Active
- 2008-10-01 EP EP08253199.7A patent/EP2088813B1/en active Active
Patent Citations (3)
| Publication number | Priority date | Publication date | Assignee | Title |
|---|---|---|---|---|
| EP1098546A2 (en) * | 1999-11-04 | 2001-05-09 | Lucent Technologies Inc. | Methods and apparatus for derivative based optimization of wireless network performance |
| WO2002073997A1 (en) * | 2001-03-09 | 2002-09-19 | Cellular Design Services Limited | Measurement-based prediction method for radiation path loss |
| WO2005069666A1 (en) * | 2004-01-15 | 2005-07-28 | Radioplan Gmbh | Method and device for adapting a radio network model to the conditions of a real radio network |
Cited By (3)
| Publication number | Priority date | Publication date | Assignee | Title |
|---|---|---|---|---|
| US9271157B2 (en) | 2013-11-25 | 2016-02-23 | Motorola Solutions, Inc. | Method of and system for optimizing an empirical propagation prediction model in a mobile communications network |
| EP3389221A1 (en) * | 2017-04-12 | 2018-10-17 | Netscout Systems, Inc. | Network table error detection using call trace records |
| EP4167618A4 (en) * | 2020-06-24 | 2023-12-20 | Huawei Technologies Co., Ltd. | Wireless signal propagation prediction method and apparatus |
Also Published As
| Publication number | Publication date |
|---|---|
| US20090203373A1 (en) | 2009-08-13 |
| EP2088813A3 (en) | 2010-08-11 |
| EP2088813B1 (en) | 2019-08-21 |
| US8385908B2 (en) | 2013-02-26 |
Similar Documents
| Publication | Publication Date | Title |
|---|---|---|
| EP2088813B1 (en) | Method, systems and apparatus for modifying a mobile network signal propagation prediction | |
| US6810246B1 (en) | Method and system for analyzing digital wireless network performance | |
| US20040203727A1 (en) | Quality-based optimization of cellular network parameters | |
| US6041236A (en) | Method and apparatus for minimizing the number of samples needed to determine cell area coverage reliability in a radiotelephone system | |
| US8838092B2 (en) | Method and apparatus for deriving pathloss estimation values | |
| EP1718090A1 (en) | A method of optimising a cellular communication network, related system and computer program product | |
| CN111327377B (en) | Method, device, equipment and storage medium for field intensity prediction | |
| US7236779B2 (en) | Classification of cellular network drive test results | |
| JP5699545B2 (en) | Radio wave propagation characteristic estimation system, radio wave propagation characteristic estimation method, and computer program | |
| US6006095A (en) | Method and apparatus for estimating cell radius and area coverage reliability in a radiotelephone system | |
| US6640089B1 (en) | System and method for adaptively predicting radio wave propagation | |
| US20030186693A1 (en) | Estimating traffic distribution in a mobile communication network | |
| US7844698B2 (en) | Wireless network modification support system and radio network modification support method | |
| Bernardin et al. | Cell radius inaccuracy: a new measure of coverage reliability | |
| JP5699544B2 (en) | Radio wave propagation characteristic estimation system, radio wave propagation characteristic estimation method, and computer program | |
| EP2547013B1 (en) | Radio wave propagation simulator | |
| US6173185B1 (en) | Method and apparatus for minimizing the area sampled to determine cell area coverage reliability in a radiotelephone system | |
| CN113015184A (en) | Wireless network power adjustment method, device and storage medium | |
| US5966661A (en) | Method and apparatus for a radiotelephone system optimized for cell boundary coverage reliability | |
| US5983106A (en) | Method and apparatus for minimizing the number of samples needed to determine cell radius coverage contour reliability in a radiotelephone system | |
| US8188995B2 (en) | Methods and appratus for estimating cell radius in a mobile telecommunications network | |
| US20070093213A1 (en) | Method and system for electromagnetic field evaluation | |
| KR100594881B1 (en) | System for optimizing wireless network applying fast automatic searching optimum solution and method thereof | |
| KR100326147B1 (en) | A real-time estimation method of RF environment in CDMA system | |
| JP3479484B2 (en) | Communication quality calculation method and communication quality calculation device for mobile communication system |
Legal Events
| Date | Code | Title | Description |
|---|---|---|---|
| PUAI | Public reference made under article 153(3) epc to a published international application that has entered the european phase |
Free format text: ORIGINAL CODE: 0009012 |
|
| AK | Designated contracting states |
Kind code of ref document: A2 Designated state(s): AT BE BG CH CY CZ DE DK EE ES FI FR GB GR HR HU IE IS IT LI LT LU LV MC MT NL NO PL PT RO SE SI SK TR |
|
| AX | Request for extension of the european patent |
Extension state: AL BA MK RS |
|
| PUAL | Search report despatched |
Free format text: ORIGINAL CODE: 0009013 |
|
| AK | Designated contracting states |
Kind code of ref document: A3 Designated state(s): AT BE BG CH CY CZ DE DK EE ES FI FR GB GR HR HU IE IS IT LI LT LU LV MC MT NL NO PL PT RO SE SI SK TR |
|
| AX | Request for extension of the european patent |
Extension state: AL BA MK RS |
|
| 17P | Request for examination filed |
Effective date: 20110211 |
|
| AKX | Designation fees paid |
Designated state(s): AT BE BG CH CY CZ DE DK EE ES FI FR GB GR HR HU IE IS IT LI LT LU LV MC MT NL NO PL PT RO SE SI SK TR |
|
| STAA | Information on the status of an ep patent application or granted ep patent |
Free format text: STATUS: EXAMINATION IS IN PROGRESS |
|
| 17Q | First examination report despatched |
Effective date: 20170629 |
|
| REG | Reference to a national code |
Ref country code: DE Ref legal event code: R079 Ref document number: 602008060963 Country of ref document: DE Free format text: PREVIOUS MAIN CLASS: H04W0016180000 Ipc: H04L0012240000 |
|
| GRAP | Despatch of communication of intention to grant a patent |
Free format text: ORIGINAL CODE: EPIDOSNIGR1 |
|
| STAA | Information on the status of an ep patent application or granted ep patent |
Free format text: STATUS: GRANT OF PATENT IS INTENDED |
|
| RAP1 | Party data changed (applicant data changed or rights of an application transferred) |
Owner name: ERICSSON INC. |
|
| RIC1 | Information provided on ipc code assigned before grant |
Ipc: H04L 12/26 20060101ALI20190218BHEP Ipc: H04L 12/24 20060101AFI20190218BHEP Ipc: H04W 48/16 20090101ALI20190218BHEP |
|
| INTG | Intention to grant announced |
Effective date: 20190320 |
|
| GRAS | Grant fee paid |
Free format text: ORIGINAL CODE: EPIDOSNIGR3 |
|
| GRAA | (expected) grant |
Free format text: ORIGINAL CODE: 0009210 |
|
| STAA | Information on the status of an ep patent application or granted ep patent |
Free format text: STATUS: THE PATENT HAS BEEN GRANTED |
|
| AK | Designated contracting states |
Kind code of ref document: B1 Designated state(s): AT BE BG CH CY CZ DE DK EE ES FI FR GB GR HR HU IE IS IT LI LT LU LV MC MT NL NO PL PT RO SE SI SK TR |
|
| REG | Reference to a national code |
Ref country code: GB Ref legal event code: FG4D |
|
| REG | Reference to a national code |
Ref country code: CH Ref legal event code: EP |
|
| REG | Reference to a national code |
Ref country code: DE Ref legal event code: R096 Ref document number: 602008060963 Country of ref document: DE |
|
| REG | Reference to a national code |
Ref country code: AT Ref legal event code: REF Ref document number: 1170981 Country of ref document: AT Kind code of ref document: T Effective date: 20190915 |
|
| REG | Reference to a national code |
Ref country code: IE Ref legal event code: FG4D |
|
| REG | Reference to a national code |
Ref country code: LT Ref legal event code: MG4D |
|
| REG | Reference to a national code |
Ref country code: NL Ref legal event code: MP Effective date: 20190821 |
|
| PG25 | Lapsed in a contracting state [announced via postgrant information from national office to epo] |
Ref country code: SE Free format text: LAPSE BECAUSE OF FAILURE TO SUBMIT A TRANSLATION OF THE DESCRIPTION OR TO PAY THE FEE WITHIN THE PRESCRIBED TIME-LIMIT Effective date: 20190821 Ref country code: NL Free format text: LAPSE BECAUSE OF FAILURE TO SUBMIT A TRANSLATION OF THE DESCRIPTION OR TO PAY THE FEE WITHIN THE PRESCRIBED TIME-LIMIT Effective date: 20190821 Ref country code: BG Free format text: LAPSE BECAUSE OF FAILURE TO SUBMIT A TRANSLATION OF THE DESCRIPTION OR TO PAY THE FEE WITHIN THE PRESCRIBED TIME-LIMIT Effective date: 20191121 Ref country code: NO Free format text: LAPSE BECAUSE OF FAILURE TO SUBMIT A TRANSLATION OF THE DESCRIPTION OR TO PAY THE FEE WITHIN THE PRESCRIBED TIME-LIMIT Effective date: 20191121 Ref country code: PT Free format text: LAPSE BECAUSE OF FAILURE TO SUBMIT A TRANSLATION OF THE DESCRIPTION OR TO PAY THE FEE WITHIN THE PRESCRIBED TIME-LIMIT Effective date: 20191223 Ref country code: HR Free format text: LAPSE BECAUSE OF FAILURE TO SUBMIT A TRANSLATION OF THE DESCRIPTION OR TO PAY THE FEE WITHIN THE PRESCRIBED TIME-LIMIT Effective date: 20190821 Ref country code: LT Free format text: LAPSE BECAUSE OF FAILURE TO SUBMIT A TRANSLATION OF THE DESCRIPTION OR TO PAY THE FEE WITHIN THE PRESCRIBED TIME-LIMIT Effective date: 20190821 Ref country code: FI Free format text: LAPSE BECAUSE OF FAILURE TO SUBMIT A TRANSLATION OF THE DESCRIPTION OR TO PAY THE FEE WITHIN THE PRESCRIBED TIME-LIMIT Effective date: 20190821 |
|
| PG25 | Lapsed in a contracting state [announced via postgrant information from national office to epo] |
Ref country code: GR Free format text: LAPSE BECAUSE OF FAILURE TO SUBMIT A TRANSLATION OF THE DESCRIPTION OR TO PAY THE FEE WITHIN THE PRESCRIBED TIME-LIMIT Effective date: 20191122 Ref country code: ES Free format text: LAPSE BECAUSE OF FAILURE TO SUBMIT A TRANSLATION OF THE DESCRIPTION OR TO PAY THE FEE WITHIN THE PRESCRIBED TIME-LIMIT Effective date: 20190821 Ref country code: IS Free format text: LAPSE BECAUSE OF FAILURE TO SUBMIT A TRANSLATION OF THE DESCRIPTION OR TO PAY THE FEE WITHIN THE PRESCRIBED TIME-LIMIT Effective date: 20191221 Ref country code: LV Free format text: LAPSE BECAUSE OF FAILURE TO SUBMIT A TRANSLATION OF THE DESCRIPTION OR TO PAY THE FEE WITHIN THE PRESCRIBED TIME-LIMIT Effective date: 20190821 |
|
| REG | Reference to a national code |
Ref country code: AT Ref legal event code: MK05 Ref document number: 1170981 Country of ref document: AT Kind code of ref document: T Effective date: 20190821 |
|
| PG25 | Lapsed in a contracting state [announced via postgrant information from national office to epo] |
Ref country code: TR Free format text: LAPSE BECAUSE OF FAILURE TO SUBMIT A TRANSLATION OF THE DESCRIPTION OR TO PAY THE FEE WITHIN THE PRESCRIBED TIME-LIMIT Effective date: 20190821 |
|
| PG25 | Lapsed in a contracting state [announced via postgrant information from national office to epo] |
Ref country code: RO Free format text: LAPSE BECAUSE OF FAILURE TO SUBMIT A TRANSLATION OF THE DESCRIPTION OR TO PAY THE FEE WITHIN THE PRESCRIBED TIME-LIMIT Effective date: 20190821 Ref country code: DK Free format text: LAPSE BECAUSE OF FAILURE TO SUBMIT A TRANSLATION OF THE DESCRIPTION OR TO PAY THE FEE WITHIN THE PRESCRIBED TIME-LIMIT Effective date: 20190821 Ref country code: IT Free format text: LAPSE BECAUSE OF FAILURE TO SUBMIT A TRANSLATION OF THE DESCRIPTION OR TO PAY THE FEE WITHIN THE PRESCRIBED TIME-LIMIT Effective date: 20190821 Ref country code: AT Free format text: LAPSE BECAUSE OF FAILURE TO SUBMIT A TRANSLATION OF THE DESCRIPTION OR TO PAY THE FEE WITHIN THE PRESCRIBED TIME-LIMIT Effective date: 20190821 Ref country code: EE Free format text: LAPSE BECAUSE OF FAILURE TO SUBMIT A TRANSLATION OF THE DESCRIPTION OR TO PAY THE FEE WITHIN THE PRESCRIBED TIME-LIMIT Effective date: 20190821 Ref country code: PL Free format text: LAPSE BECAUSE OF FAILURE TO SUBMIT A TRANSLATION OF THE DESCRIPTION OR TO PAY THE FEE WITHIN THE PRESCRIBED TIME-LIMIT Effective date: 20190821 |
|
| PG25 | Lapsed in a contracting state [announced via postgrant information from national office to epo] |
Ref country code: MC Free format text: LAPSE BECAUSE OF FAILURE TO SUBMIT A TRANSLATION OF THE DESCRIPTION OR TO PAY THE FEE WITHIN THE PRESCRIBED TIME-LIMIT Effective date: 20190821 Ref country code: IS Free format text: LAPSE BECAUSE OF FAILURE TO SUBMIT A TRANSLATION OF THE DESCRIPTION OR TO PAY THE FEE WITHIN THE PRESCRIBED TIME-LIMIT Effective date: 20200224 Ref country code: SK Free format text: LAPSE BECAUSE OF FAILURE TO SUBMIT A TRANSLATION OF THE DESCRIPTION OR TO PAY THE FEE WITHIN THE PRESCRIBED TIME-LIMIT Effective date: 20190821 Ref country code: CZ Free format text: LAPSE BECAUSE OF FAILURE TO SUBMIT A TRANSLATION OF THE DESCRIPTION OR TO PAY THE FEE WITHIN THE PRESCRIBED TIME-LIMIT Effective date: 20190821 |
|
| REG | Reference to a national code |
Ref country code: CH Ref legal event code: PL |
|
| REG | Reference to a national code |
Ref country code: DE Ref legal event code: R097 Ref document number: 602008060963 Country of ref document: DE |
|
| PLBE | No opposition filed within time limit |
Free format text: ORIGINAL CODE: 0009261 |
|
| STAA | Information on the status of an ep patent application or granted ep patent |
Free format text: STATUS: NO OPPOSITION FILED WITHIN TIME LIMIT |
|
| PG2D | Information on lapse in contracting state deleted |
Ref country code: IS |
|
| PG25 | Lapsed in a contracting state [announced via postgrant information from national office to epo] |
Ref country code: LU Free format text: LAPSE BECAUSE OF NON-PAYMENT OF DUE FEES Effective date: 20191001 Ref country code: LI Free format text: LAPSE BECAUSE OF NON-PAYMENT OF DUE FEES Effective date: 20191031 Ref country code: CH Free format text: LAPSE BECAUSE OF NON-PAYMENT OF DUE FEES Effective date: 20191031 |
|
| 26N | No opposition filed |
Effective date: 20200603 |
|
| REG | Reference to a national code |
Ref country code: BE Ref legal event code: MM Effective date: 20191031 |
|
| PG25 | Lapsed in a contracting state [announced via postgrant information from national office to epo] |
Ref country code: SI Free format text: LAPSE BECAUSE OF FAILURE TO SUBMIT A TRANSLATION OF THE DESCRIPTION OR TO PAY THE FEE WITHIN THE PRESCRIBED TIME-LIMIT Effective date: 20190821 Ref country code: BE Free format text: LAPSE BECAUSE OF NON-PAYMENT OF DUE FEES Effective date: 20191031 |
|
| PG25 | Lapsed in a contracting state [announced via postgrant information from national office to epo] |
Ref country code: FR Free format text: LAPSE BECAUSE OF NON-PAYMENT OF DUE FEES Effective date: 20191021 Ref country code: IE Free format text: LAPSE BECAUSE OF NON-PAYMENT OF DUE FEES Effective date: 20191001 |
|
| PG25 | Lapsed in a contracting state [announced via postgrant information from national office to epo] |
Ref country code: CY Free format text: LAPSE BECAUSE OF FAILURE TO SUBMIT A TRANSLATION OF THE DESCRIPTION OR TO PAY THE FEE WITHIN THE PRESCRIBED TIME-LIMIT Effective date: 20190821 |
|
| PG25 | Lapsed in a contracting state [announced via postgrant information from national office to epo] |
Ref country code: MT Free format text: LAPSE BECAUSE OF FAILURE TO SUBMIT A TRANSLATION OF THE DESCRIPTION OR TO PAY THE FEE WITHIN THE PRESCRIBED TIME-LIMIT Effective date: 20190821 Ref country code: HU Free format text: LAPSE BECAUSE OF FAILURE TO SUBMIT A TRANSLATION OF THE DESCRIPTION OR TO PAY THE FEE WITHIN THE PRESCRIBED TIME-LIMIT; INVALID AB INITIO Effective date: 20081001 |
|
| REG | Reference to a national code |
Ref country code: DE Ref legal event code: R079 Ref document number: 602008060963 Country of ref document: DE Free format text: PREVIOUS MAIN CLASS: H04L0012240000 Ipc: H04L0041000000 |
|
| PGFP | Annual fee paid to national office [announced via postgrant information from national office to epo] |
Ref country code: GB Payment date: 20231027 Year of fee payment: 16 |
|
| PGFP | Annual fee paid to national office [announced via postgrant information from national office to epo] |
Ref country code: DE Payment date: 20231027 Year of fee payment: 16 |