EP2072979A1 - Method for measuring the concentration of a gas component in a measuring gas - Google Patents
Method for measuring the concentration of a gas component in a measuring gas Download PDFInfo
- Publication number
- EP2072979A1 EP2072979A1 EP07024934A EP07024934A EP2072979A1 EP 2072979 A1 EP2072979 A1 EP 2072979A1 EP 07024934 A EP07024934 A EP 07024934A EP 07024934 A EP07024934 A EP 07024934A EP 2072979 A1 EP2072979 A1 EP 2072979A1
- Authority
- EP
- European Patent Office
- Prior art keywords
- modulation
- wavelength
- frequency
- burst
- detector output
- Prior art date
- Legal status (The legal status is an assumption and is not a legal conclusion. Google has not performed a legal analysis and makes no representation as to the accuracy of the status listed.)
- Granted
Links
- 238000000034 method Methods 0.000 title claims description 14
- 238000004611 spectroscopical analysis Methods 0.000 claims abstract description 11
- 230000003993 interaction Effects 0.000 claims abstract 9
- 238000005070 sampling Methods 0.000 claims description 10
- 238000011156 evaluation Methods 0.000 claims description 3
- 238000012545 processing Methods 0.000 claims description 3
- 238000010408 sweeping Methods 0.000 claims 2
- 239000007789 gas Substances 0.000 description 24
- 238000010521 absorption reaction Methods 0.000 description 13
- 230000005540 biological transmission Effects 0.000 description 11
- 238000005259 measurement Methods 0.000 description 11
- 230000003287 optical effect Effects 0.000 description 10
- 238000001514 detection method Methods 0.000 description 5
- 238000010606 normalization Methods 0.000 description 5
- 238000001228 spectrum Methods 0.000 description 5
- 230000001419 dependent effect Effects 0.000 description 4
- 230000000694 effects Effects 0.000 description 3
- 230000002238 attenuated effect Effects 0.000 description 1
- 238000002485 combustion reaction Methods 0.000 description 1
- 238000010586 diagram Methods 0.000 description 1
- 239000000428 dust Substances 0.000 description 1
- RVRCFVVLDHTFFA-UHFFFAOYSA-N heptasodium;tungsten;nonatriacontahydrate Chemical compound O.O.O.O.O.O.O.O.O.O.O.O.O.O.O.O.O.O.O.O.O.O.O.O.O.O.O.O.O.O.O.O.O.O.O.O.O.O.O.[Na+].[Na+].[Na+].[Na+].[Na+].[Na+].[Na+].[W].[W].[W].[W].[W].[W].[W].[W].[W].[W].[W] RVRCFVVLDHTFFA-UHFFFAOYSA-N 0.000 description 1
- 238000012625 in-situ measurement Methods 0.000 description 1
- 238000011065 in-situ storage Methods 0.000 description 1
- 238000002347 injection Methods 0.000 description 1
- 239000007924 injection Substances 0.000 description 1
- 238000012544 monitoring process Methods 0.000 description 1
- 230000000737 periodic effect Effects 0.000 description 1
- 230000035945 sensitivity Effects 0.000 description 1
Images


Classifications
-
- G—PHYSICS
- G01—MEASURING; TESTING
- G01J—MEASUREMENT OF INTENSITY, VELOCITY, SPECTRAL CONTENT, POLARISATION, PHASE OR PULSE CHARACTERISTICS OF INFRARED, VISIBLE OR ULTRAVIOLET LIGHT; COLORIMETRY; RADIATION PYROMETRY
- G01J3/00—Spectrometry; Spectrophotometry; Monochromators; Measuring colours
- G01J3/28—Investigating the spectrum
- G01J3/42—Absorption spectrometry; Double beam spectrometry; Flicker spectrometry; Reflection spectrometry
- G01J3/433—Modulation spectrometry; Derivative spectrometry
- G01J3/4338—Frequency modulated spectrometry
-
- G—PHYSICS
- G01—MEASURING; TESTING
- G01N—INVESTIGATING OR ANALYSING MATERIALS BY DETERMINING THEIR CHEMICAL OR PHYSICAL PROPERTIES
- G01N21/00—Investigating or analysing materials by the use of optical means, i.e. using sub-millimetre waves, infrared, visible or ultraviolet light
- G01N21/17—Systems in which incident light is modified in accordance with the properties of the material investigated
- G01N21/25—Colour; Spectral properties, i.e. comparison of effect of material on the light at two or more different wavelengths or wavelength bands
- G01N21/31—Investigating relative effect of material at wavelengths characteristic of specific elements or molecules, e.g. atomic absorption spectrometry
- G01N21/39—Investigating relative effect of material at wavelengths characteristic of specific elements or molecules, e.g. atomic absorption spectrometry using tunable lasers
- G01N2021/396—Type of laser source
- G01N2021/399—Diode laser
-
- G—PHYSICS
- G01—MEASURING; TESTING
- G01N—INVESTIGATING OR ANALYSING MATERIALS BY DETERMINING THEIR CHEMICAL OR PHYSICAL PROPERTIES
- G01N2201/00—Features of devices classified in G01N21/00
- G01N2201/06—Illumination; Optics
- G01N2201/069—Supply of sources
- G01N2201/0691—Modulated (not pulsed supply)
Definitions
- the invention relates to a wavelength modulation spectroscopy method. It further relates to a wavelength modulation spectroscopy system.
- wavelength modulation spectroscopy In wavelength modulation spectroscopy (WMS) the wavelength of the light of a tunable light source, such as a diode laser, is modulated with a frequency f 0 , while the wavelength is swept over a molecular absorption line of a gas component of interest in a gas sample.
- wavelength dependent absorption converts some of the wavelength modulation into an amplitude modulation of the light.
- the light will have an overtone spectrum generated by the absorption, the harmonic content of the spectrum being dependent on the width and shape of the molecular absorption line in the gas and the etalons in the optical path of the measuring system.
- Mf 0 the modulation frequency
- Demodulating the detector output at one of said higher harmonics, preferably at 2f 0 shifts the measurement from frequencies near DC, where the light source is noisy, into a higher frequency range, where the noise is lower, thus improving the measurement sensitivity.
- a suitable normalization method for compensating for general fluctuations in the emitted light intensity and non-gas related transmission in the optical path of the measuring system. For example, in in-situ measurements of trace gases in combustion environments where varying dust loads, high temperature, gas turbulences etc. modulate the light in the kHz range, it is important that the normalization is not distorted by the rapidly changing transmission and turbulences in the measurement path.
- I ⁇ I L ⁇ ⁇ T ⁇ exp - ⁇ i c i ⁇ ⁇ i ⁇ ⁇ L
- I the intensity of the light after passing through the measurement path
- I L the intensity of the light emitted from the light source
- T a transmission factor over the measurement path, which transmission factor stands for the wavelength independent transmission including optical losses
- ⁇ i the absorption coefficient of a gaseous species i with the concentration c i
- L is the length of the measurement path.
- wavelength modulation spectroscopy utilizes a rapid modulation of the emitted light with a frequency f 0 , while the wavelength is swept over a molecular absorption line of a gas component of interest in the gas sample.
- the most straight forward method to measure the non-gas related transmission I L T is to use a direct detection.
- the wavelength of the light is swept by a triangular or sawtooth waveform over the absorption line of the gas component to be measured wherein the beginning and the end of the scan are well separated from the absorption peak.
- the measuring detector output is compared with the signal from a monitor detector which directly monitors the output intensity of the light source.
- the direct detection channel detects the large triangular scan as a measure of the transmitted optical power.
- the scan also includes a period where the light source is turned off in order to provide an accurate zero irradiance reference.
- wavelength modulation spectroscopy a combination of wavelength modulation and direct detection can be used [ Applied Optics, Vol. 38, No. 21, pp. 4609-4622 (July 1999 )]. This technique is mostly developed for atmospheric monitoring; to be used in harsh industrial environment, the modulation rate has to be increased in order to place the signal energy above that of the turbulent measuring medium.
- wavelength modulation spectroscopy an indirect measure of the non-gas related optical transmission can be obtained by the use of the wavelength modulation signal f 0 , which makes it necessary to introduce a separate detection channel for the fundamental frequency [ US 5,173,749 ].
- An intentionally injected pilot tone at a higher harmonic Mf 0 of said wavelength modulation signal [ US 7,116,422 ] avoids the use of such a separate electronic channel.
- a drawback of this method is that the received pilot tone amplitude gives only information about the transmission factor T rather than the detected non-gas related light intensity I L T, thus I L has to be measured separately, e. g. by division with a reference cell signal [ US 5,173,749 ], which introduces the necessity of an additional optical channel. Therefore, in order to obtain I L T directly, the modulation of the light source should also include turning off the emitted light entirely.
- the invention seeks to provide a wavelength modulation spectroscopy method and system, which effectively compensate variations in the emitted light intensity and in the non-gas related transmission of the measurement path.
- normalization is based on a burst signal, the frequency of which lies above that of the turbulences and flame spectra in the measurement path.
- the burst signal waveform is optimized to maximize the intensity modulation effect while its amplitude is chosen to allow periodic interruption of the laser emission.
- the burst frequency is chosen so that a suitable overtone can be detected by the same signal chain or channel as that of the analytical signal portion thereby using preferably a down sampling scheme.
- Figure 1 shows an example of the modulation of the intensity I L of the light emitted from a light source, preferably a diode laser.
- the modulation periodically alternates between a burst 1, 1' with a burst frequency f n and a triangular or sawtooth sweep function 2 with a superimposed sinusoidal modulation 3 at a modulation frequency f 0 .
- the purpose of the sweep function 2 is to allow light wavelength scan across an absorption line of a gas component of interest. It is advantageous, although not necessary, to apply the burst 1, 1' with different amplitudes before and after the sweep function 2 to allow measure of the eventual changes in the optical power vs. injection current characteristics of the diode laser.
- the waveform and the frequency f n of the burst 1, 1' are preferably chosen to allow a settling time of the diode laser.
- the optimum choice is a square wave.
- the burst frequency f n is arranged so that an N-th harmonic Nf n of the waveform coincides with an M-th harmonic Mf 0 of the modulation frequency f 0 , at which M-th harmonic Mf 0 the analytical light portion I AS (cf. Equation 5) is detected.
- a suitable overtone can be detected by the same signal chain or channel as that for evaluation the analytical signal portion.
- the choice of harmonics M and N is also made to allow for an optimum relation in amplitude between the normalization signal and the analytical signal, thus allowing an optimum dynamic range of the single signal chain.
- the Nf 0 frequency components can be filtered and amplified before downsampling.
- the 7f n burst and 2f 0 analytical signal fall both in a 168 kHz frequency band. Sampling at 192 kHz aliases the 168 kHz band back to 24 kHz where they can be easily processed further.
- Figure 4 shows a wavelength modulation spectroscopy system including a frequency tunable light source 11 in form of a diode laser for generating light 12 in form of a laser beam and of intensity I L which is passed along a single optical path through a measuring volume 13 to a detector 14 for generating an output 15 indicative of the received light intensity I.
- the measuring volume 13 which can be a sample cell or, in case of in-situ process measurements, a gas-leading pipe, furnace, funnel or the like, contains a measuring gas (sample) 16, in which the concentration c i of a specific gas component i is to be measured.
- the modulation of the diode laser 11 is switched by means of a switch 17 between the sweep signal 2 with the added modulation signal 3 of the frequency f 0 , provided by a waveform generator 18, and the burst signal 1, 1' turning on and off the diode laser 11 at frequency f n , provided by a burst generator 19.
- the generated laser light 12 is passed through the measuring volume 13 and picked up by the detector diode 14.
- the down-converted detector output is then processed by the digital signal processing unit 22 for calculating the concentration c i of the specific gas component i to be measured.
- the signal processing unit 22 can separate the parts of the detector output related to modulation generated by the burst generator 19 at the burst frequency f n from those parts related to modulation by the waveform generator 18 at the modulation frequency f 0 .
Abstract
- modulating the wavelength of a light source with a modulation signal (3) at a modulation frequency (f0), while the wavelength is swept over an interaction feature of a sample,
- further modulating the intensity of said light source at a wavelength outside the interaction feature with a burst signal (1, 1'), where an N-th harmonic (Nfn) of the burst frequency (fn) coincides with an M-th harmonic (Mf0) of said modulation frequency (fo),
- passing the light to the sample and thereafter to a detector,
- demodulating the detector output at said M-th harmonic (Mf0), and
- normalizing the demodulated detector output by calculating the ratio between a demodulated detector output portion derived from the light modulated with the modulation signal (3) and another demodulated detector output portion derived from the light modulated with the burst signal (1, 1').
Description
- The invention relates to a wavelength modulation spectroscopy method. It further relates to a wavelength modulation spectroscopy system.
- In wavelength modulation spectroscopy (WMS) the wavelength of the light of a tunable light source, such as a diode laser, is modulated with a frequency f0, while the wavelength is swept over a molecular absorption line of a gas component of interest in a gas sample. As the light propagates along a measurement path through the gas sample, wavelength dependent absorption converts some of the wavelength modulation into an amplitude modulation of the light. Thus, the light will have an overtone spectrum generated by the absorption, the harmonic content of the spectrum being dependent on the width and shape of the molecular absorption line in the gas and the etalons in the optical path of the measuring system. When the light then impinges onto a measuring detector, for example a photodiode, the detector output contains AC components at the modulation frequency f0 and its higher harmonics Mf0 (M = 2, 3, 4, etc.). Demodulating the detector output at one of said higher harmonics, preferably at 2f0, shifts the measurement from frequencies near DC, where the light source is noisy, into a higher frequency range, where the noise is lower, thus improving the measurement sensitivity.
- In order to measure absolute gas concentrations, a suitable normalization method is needed for compensating for general fluctuations in the emitted light intensity and non-gas related transmission in the optical path of the measuring system. For example, in in-situ measurements of trace gases in combustion environments where varying dust loads, high temperature, gas turbulences etc. modulate the light in the kHz range, it is important that the normalization is not distorted by the rapidly changing transmission and turbulences in the measurement path.
- Light which propagates through weakly absorbing gases is attenuated exponentially according to the Beer-Lambert law:

where I is the intensity of the light after passing through the measurement path, IL is the intensity of the light emitted from the light source, T is a transmission factor over the measurement path, which transmission factor stands for the wavelength independent transmission including optical losses, αi is the absorption coefficient of a gaseous species i with the concentration ci, and L is the length of the measurement path. The absorption coefficient αi is dependent on the light frequency ν (or the wavelength). For small optical absorption,Equation 1 reduces to: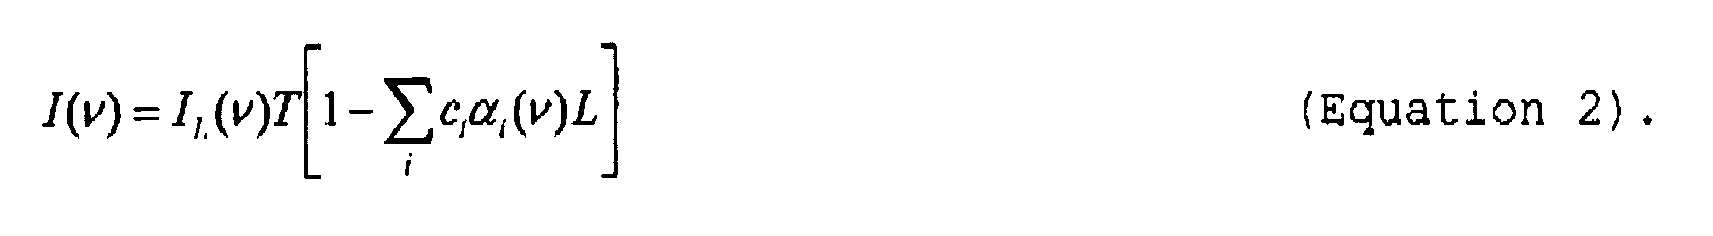
- As mentioned above, wavelength modulation spectroscopy utilizes a rapid modulation of the emitted light with a frequency f0, while the wavelength is swept over a molecular absorption line of a gas component of interest in the gas sample. The light impinging on the detector can then be written as:

- [Applied Optics, Vol. 38, No. 27, pp. 5803-5815 (September 1999)], where α0 and X represent the intensity and the peak-normalized shape of the molecular absorption line of interest. IBG and IAS are the background and analytical light portions, respectively, and are defined as:


- As can be seen from
Equations - The most straight forward method to measure the non-gas related transmission ILT is to use a direct detection. The wavelength of the light is swept by a triangular or sawtooth waveform over the absorption line of the gas component to be measured wherein the beginning and the end of the scan are well separated from the absorption peak. The measuring detector output is compared with the signal from a monitor detector which directly monitors the output intensity of the light source. The direct detection channel then detects the large triangular scan as a measure of the transmitted optical power. The scan also includes a period where the light source is turned off in order to provide an accurate zero irradiance reference. [Applied Optics, Vol. 38, No. 36, pp. 7342-7354 (December 1999) and Applied Optics, Vol. 44, No. 1, pp. 91-102 (January 2005)].
- In wavelength modulation spectroscopy a combination of wavelength modulation and direct detection can be used [Applied Optics, Vol. 38, No. 21, pp. 4609-4622 (July 1999)]. This technique is mostly developed for atmospheric monitoring; to be used in harsh industrial environment, the modulation rate has to be increased in order to place the signal energy above that of the turbulent measuring medium.
- In wavelength modulation spectroscopy an indirect measure of the non-gas related optical transmission can be obtained by the use of the wavelength modulation signal f0, which makes it necessary to introduce a separate detection channel for the fundamental frequency [
US 5,173,749 ]. An intentionally injected pilot tone at a higher harmonic Mf0 of said wavelength modulation signal [US 7,116,422 ] avoids the use of such a separate electronic channel. A drawback of this method, however, is that the received pilot tone amplitude gives only information about the transmission factor T rather than the detected non-gas related light intensity ILT, thus IL has to be measured separately, e. g. by division with a reference cell signal [US 5,173,749 ], which introduces the necessity of an additional optical channel. Therefore, in order to obtain ILT directly, the modulation of the light source should also include turning off the emitted light entirely. - Therefore, the invention seeks to provide a wavelength modulation spectroscopy method and system, which effectively compensate variations in the emitted light intensity and in the non-gas related transmission of the measurement path.
- According to the invention this is achieved by the method defined in
claim 1 and the system defined inclaim 7. - Preferred embodiments of the method and the system according to the invention are specified in the remaining claims.
- According to the present invention normalization is based on a burst signal, the frequency of which lies above that of the turbulences and flame spectra in the measurement path. The burst signal waveform is optimized to maximize the intensity modulation effect while its amplitude is chosen to allow periodic interruption of the laser emission. Moreover, the burst frequency is chosen so that a suitable overtone can be detected by the same signal chain or channel as that of the analytical signal portion thereby using preferably a down sampling scheme.
- The present invention will be now described by way of example and with reference to the accompanying drawings, in which:
- Figure 1
- shows an example for the light modulation with a burst and a sinusoidal signal;
- Figure 2
- shows the Fourier spectra of the detected burst and analytical signal portions;
- Figure 3
- illustrates the down sampling procedure; and
- Figure 4
- is a schematic block diagram of the system in accordance with the invention.
-
Figure 1 shows an example of the modulation of the intensity IL of the light emitted from a light source, preferably a diode laser. The modulation periodically alternates between aburst 1, 1' with a burst frequency fn and a triangular orsawtooth sweep function 2 with a superimposedsinusoidal modulation 3 at a modulation frequency f0. The purpose of thesweep function 2 is to allow light wavelength scan across an absorption line of a gas component of interest. It is advantageous, although not necessary, to apply theburst 1, 1' with different amplitudes before and after thesweep function 2 to allow measure of the eventual changes in the optical power vs. injection current characteristics of the diode laser. - The waveform and the frequency fn of the
burst 1, 1' are preferably chosen to allow a settling time of the diode laser. The optimum choice is a square wave. Furthermore, the burst frequency fn is arranged so that an N-th harmonic Nfn of the waveform coincides with an M-th harmonic Mf0 of the modulation frequency f0, at which M-th harmonic Mf0 the analytical light portion IAS (cf. Equation 5) is detected. Thus, for the purpose of normalization, a suitable overtone can be detected by the same signal chain or channel as that for evaluation the analytical signal portion. The choice of harmonics M and N is also made to allow for an optimum relation in amplitude between the normalization signal and the analytical signal, thus allowing an optimum dynamic range of the single signal chain. - The M-th harmonic of the detected analytical light portion (cf. Equation 5) can be written as:

- The detected light intensity as a result of the square wave burst modulation shown in
Figure 1 can be then written as:
where K depends on the bandwidths of the laser driver and the detector. - As the burst frequency fn is arranged so that an N-th harmonic Nfn, of the burst frequency fn coincides with an M-th harmonic Mf0 of the modulation frequency f0, the following relation is given:

where N = 1, 3, 5,... - If another waveform configuration is used when the modulation and burst signals simultaneously, a further aspect when determining the relation between these two frequencies f0 and fn is to avoid distortion due to overlap between frequency components of the measurement and burst signal. In this case the bandwidth B of the measured signal at Mf0 has to fulfill the following relation:

By insertingEquation 8 inEquations 
and
-
Figure 2 shows the Fourier spectra of the detected burst and analytical signal portions Iburst(f) and IAS(f) for N = 7 and M = 2. The Nf0 frequency components can be filtered and amplified before downsampling. - By performing downsampling at a sampling frequency Fs = (N+1)fn, Equation 10 can be written as:

where n is a sample number. Similarly,Equation 11 becomes:
Since N/(N+1) > 1/2, aliasing takes place. Reconstruction of the discrete signals given byEquations 
- Thus, by performing down sampling at a sampling frequency Fs = (N+1)fn, the M-th harmonic of the detected analytical light portion IAS,Nfn and the N-th harmonic Iburst,Nfn of the burst are both converted down to fn due to the aliasing effect. This effect is shown in
Figure 3 . - Combination of
Equations 
As can be seen, the concentration ci is no longer dependent on the non-gas related optical transmission ILT. - The above method is especially advantageous to utilize an audio analog-to-digital converter with a sampling frequency Fs = 192 kHz. This avoids the necessity of an extra downsampling stage. The burst frequency is then fn = 24 kHz, while the modulation frequency is f0 = 84 kHz. The 7fn burst and 2f0 analytical signal fall both in a 168 kHz frequency band. Sampling at 192 kHz aliases the 168 kHz band back to 24 kHz where they can be easily processed further.
-
Figure 4 shows a wavelength modulation spectroscopy system including a frequency tunablelight source 11 in form of a diode laser for generating light 12 in form of a laser beam and of intensity IL which is passed along a single optical path through a measuringvolume 13 to adetector 14 for generating anoutput 15 indicative of the received light intensity I. The measuringvolume 13, which can be a sample cell or, in case of in-situ process measurements, a gas-leading pipe, furnace, funnel or the like, contains a measuring gas (sample) 16, in which the concentration ci of a specific gas component i is to be measured. The modulation of thediode laser 11 is switched by means of aswitch 17 between thesweep signal 2 with the addedmodulation signal 3 of the frequency f0, provided by awaveform generator 18, and theburst signal 1, 1' turning on and off thediode laser 11 at frequency fn, provided by aburst generator 19. The frequencies f0 and fn are related such that Mf0 = Nfn, where N is an integer corresponding to a suitable harmonic of theburst signal 1, 1' and M is the harmonic of the modulation frequency f0 where detection of the absorption in the measuringvolume 13 will be made. The generatedlaser light 12 is passed through the measuringvolume 13 and picked up by thedetector diode 14. Theoutput 15 of thedetector 14 is filtered through a band-pass filter 20 with a centre frequency Mf0 and then converted to digital format in an analog-to-digital converter 21 running at a sampling frequency Fs = (N+1)fn hence causing both the M-th harmonic of f0 and the N-th harmonic of fn to be folded or aliased back to frequency fn. The down-converted detector output is then processed by the digitalsignal processing unit 22 for calculating the concentration ci of the specific gas component i to be measured. Due to asynchronisation unit 21 thesignal processing unit 22 can separate the parts of the detector output related to modulation generated by theburst generator 19 at the burst frequency fn from those parts related to modulation by thewaveform generator 18 at the modulation frequency f0.
Claims (12)
- A wavelength modulation spectroscopy method comprising the steps of:- periodically sweeping the wavelength of a light source (11) over an interaction feature of a sample (16) according to a sweep function (2),- modulating the wavelength of said light source (11) with a modulation signal (3) at a modulation frequency (f0), while the wavelength is swept over the interaction feature,- further periodically modulating the intensity of said light source (11) at a wavelength outside the interaction feature with a burst signal (1, 1'), where an N-th harmonic (Nfn) of the burst frequency (fn) coincides with an M-th harmonic (Mf0) of said modulation frequency (f0),- passing the light (12) of the light source (11) to the sample (16) for interacting and thereafter to a detector (14),- demodulating the detector output (15) at said M-th harmonic (Mf0) of said modulation frequency (f0), and- normalizing the demodulated detector output (15) by calculating the ratio between a demodulated detector output portion derived from the light (12) modulated with the modulation signal (3) and another demodulated detector output portion derived from the light (12) modulated with the burst signal (1, 1').
- The method of claim 1 wherein before the step of normalizing, the demodulated detector output (15) is down sampled at a sampling frequency (Fs) equal to the (N+1)-fold of the burst frequency (fn).
- The method of claims 1 or 2 wherein N = 7 and M = 2.
- The method of one of the preceding claims wherein the modulation signal (3) comprises a sinusoidal.
- The method of one of the preceding claims wherein the burst signal (1, 1') comprises a square wave.
- The method of one of the preceding claims wherein the sweep function (2) comprises a sawtooth and wherein the amplitude of the burst signal (1, 1') is different before and after the sweep (2).
- A wavelength modulation spectroscopy system comprising:- a wavelength tunable light source (11),- first modulation means (18) for periodically sweeping the wavelength of the light source (11) over an interaction feature of a sample according to a sweep function (2) and modulating the wavelength of said light source (11) with a modulation signal (3) at a modulation frequency (f0), while the wavelength is swept over the interaction feature,- second modulation means (19) for periodically modulating the intensity of said light source (11) at a wavelength outside the interaction feature with a burst signal (1, 1'), where an N-th harmonic (Nfn) of the burst frequency (fn) coincides with an M-th harmonic (Mf0) of said modulation frequency (f0),- a detector (14) for detecting the light (12) of the light source (11) after interaction with a sample (16) and producing a detector output (15),- demodulation means (20) for processing the detector output (15) at said M-th harmonic (Mf0) of said modulation frequency (f0), and- evaluation means (22) for normalizing the demodulated detector output (15) configured to calculate the ratio between a demodulated detector output portion derived from the light (12) modulated with the modulation signal (3) and another demodulated detector output portion derived from the light (12) modulated with the burst signal (1, 1').
- The system of claim 7, further comprising between the detector (14) and the evaluation means (22) an analog-to-digital converter (21) configured to downsample the demodulated detector output (15) at a sampling frequency (Fs) equal to the (N+1)-fold of the burst frequency (fn).
- The system of claims 7 or 8 wherein N = 7 and M = 2.
- The system of one of claims 7 to 9 wherein the modulation signal (3) comprises a sinusoidal.
- The system of one of claims 7 to 9 wherein the burst signal (1, 1') comprises a square wave.
- The system of one of claims 7 to 9 wherein the sweep function (2) comprises a sawtooth and wherein the amplitude of the burst signal (1, 1') is different before and after the sweep (2).
Priority Applications (2)
| Application Number | Priority Date | Filing Date | Title |
|---|---|---|---|
| EP07024934A EP2072979B1 (en) | 2007-12-21 | 2007-12-21 | Method for measuring the concentration of a gas component in a measuring gas |
| US12/317,059 US8094313B2 (en) | 2007-12-21 | 2008-12-18 | Wavelength modulation spectroscopy method and system |
Applications Claiming Priority (1)
| Application Number | Priority Date | Filing Date | Title |
|---|---|---|---|
| EP07024934A EP2072979B1 (en) | 2007-12-21 | 2007-12-21 | Method for measuring the concentration of a gas component in a measuring gas |
Publications (2)
| Publication Number | Publication Date |
|---|---|
| EP2072979A1 true EP2072979A1 (en) | 2009-06-24 |
| EP2072979B1 EP2072979B1 (en) | 2012-02-29 |
Family
ID=39386368
Family Applications (1)
| Application Number | Title | Priority Date | Filing Date |
|---|---|---|---|
| EP07024934A Expired - Fee Related EP2072979B1 (en) | 2007-12-21 | 2007-12-21 | Method for measuring the concentration of a gas component in a measuring gas |
Country Status (2)
| Country | Link |
|---|---|
| US (1) | US8094313B2 (en) |
| EP (1) | EP2072979B1 (en) |
Cited By (7)
| Publication number | Priority date | Publication date | Assignee | Title |
|---|---|---|---|---|
| DE102012202893B3 (en) * | 2012-02-27 | 2013-01-17 | Siemens Aktiengesellschaft | Method for measuring concentration of gas component in measuring gas for visual gas analysis, involves triggering and producing current signals and burst-current signals such that signals are modified with directly generated current signals |
| WO2013010938A1 (en) | 2011-07-18 | 2013-01-24 | Siemens Aktiengesellschaft | Method for driving a laser diode in a spectrometer |
| DE102011080086A1 (en) | 2011-07-29 | 2013-01-31 | Siemens Aktiengesellschaft | Method for measuring concentration of infrared-active gas component in measurement gas that is stored in measurement volume, involves normalizing light intensity that is detected at location of line, with calculated light intensity value |
| DE102013201459A1 (en) | 2013-01-30 | 2014-07-31 | Siemens Aktiengesellschaft | Method for measuring concentration of gas component in measurement gas, involves detecting intensity light of laser diode after irradiating gas, where current intensity of burst signal corresponds to current value of current-time function |
| DE102013213458A1 (en) | 2013-07-09 | 2015-01-15 | Siemens Aktiengesellschaft | Method for measuring the concentration of a gas component in a sample gas |
| GB2524725A (en) * | 2014-03-24 | 2015-10-07 | Servomex Group Ltd | Method and system for correcting incident light fluctuations in absorption spectroscopy |
| WO2016096416A1 (en) * | 2014-12-17 | 2016-06-23 | Siemens Aktiengesellschaft | Absorption spectrometer |
Families Citing this family (9)
| Publication number | Priority date | Publication date | Assignee | Title |
|---|---|---|---|---|
| US8274043B2 (en) * | 2006-05-26 | 2012-09-25 | Cedars-Sinai Medical Center | Estimation of ion cyclotron resonance parameters in fourier transform mass spectrometry |
| US9459209B2 (en) * | 2012-06-04 | 2016-10-04 | Shimadzu Corporation | Gas analysis device |
| EP2853869B1 (en) * | 2013-09-25 | 2018-10-31 | Siemens Aktiengesellschaft | Method and gas analyser for measuring the concentration of a gas component in a gas to be measured |
| WO2018135590A1 (en) * | 2017-01-19 | 2018-07-26 | コニカミノルタ株式会社 | Substance detecting device |
| US10466106B2 (en) * | 2017-12-22 | 2019-11-05 | Nec Corporation | Gas concentration measurement by 2F signal trough distance |
| CN110057778A (en) * | 2019-03-13 | 2019-07-26 | 武汉信达易通科技有限公司 | A kind of gas concentration detection apparatus and method |
| EP3949039A4 (en) * | 2019-04-05 | 2022-11-30 | SeekOps Inc. | Analog signal processing for a lightweight and compact laser-based trace gas sensor |
| US11614430B2 (en) | 2019-12-19 | 2023-03-28 | Seekops Inc. | Concurrent in-situ measurement of wind speed and trace gases on mobile platforms for localization and qualification of emissions |
| US11748866B2 (en) | 2020-07-17 | 2023-09-05 | Seekops Inc. | Systems and methods of automated detection of gas plumes using optical imaging |
Citations (4)
| Publication number | Priority date | Publication date | Assignee | Title |
|---|---|---|---|---|
| US5173749A (en) | 1988-07-07 | 1992-12-22 | Altoptronic Ab | Method and apparatus for spectroscopic measurement of the concentration of a gas |
| US6356350B1 (en) * | 1998-07-30 | 2002-03-12 | Southwest Sciences Incorporated | Wavelength modulation spectroscopy with multiple harmonic detection |
| US6611335B1 (en) * | 1999-08-17 | 2003-08-26 | Southwest Sciences Incorporated | Tone burst diode laser spectroscopy |
| EP1510798A1 (en) * | 2003-08-28 | 2005-03-02 | Siemens Aktiengesellschaft | Wavelength modulation spectroscopy method and system |
Family Cites Families (4)
| Publication number | Priority date | Publication date | Assignee | Title |
|---|---|---|---|---|
| US4945234A (en) * | 1989-05-19 | 1990-07-31 | Extrel Ftms, Inc. | Method and apparatus for producing an arbitrary excitation spectrum for Fourier transform mass spectrometry |
| US6940599B1 (en) * | 2002-02-08 | 2005-09-06 | Southwest Sciences Incorporated | Envelope functions for modulation spectroscopy |
| EP1544604B1 (en) | 2003-12-17 | 2017-09-27 | Siemens Aktiengesellschaft | Wavelength modulation spectroscopy method |
| US20080221814A1 (en) * | 2004-04-10 | 2008-09-11 | Michael Trainer | Methods and apparatus for determining particle characteristics by measuring scattered light |
-
2007
- 2007-12-21 EP EP07024934A patent/EP2072979B1/en not_active Expired - Fee Related
-
2008
- 2008-12-18 US US12/317,059 patent/US8094313B2/en not_active Expired - Fee Related
Patent Citations (5)
| Publication number | Priority date | Publication date | Assignee | Title |
|---|---|---|---|---|
| US5173749A (en) | 1988-07-07 | 1992-12-22 | Altoptronic Ab | Method and apparatus for spectroscopic measurement of the concentration of a gas |
| US6356350B1 (en) * | 1998-07-30 | 2002-03-12 | Southwest Sciences Incorporated | Wavelength modulation spectroscopy with multiple harmonic detection |
| US6611335B1 (en) * | 1999-08-17 | 2003-08-26 | Southwest Sciences Incorporated | Tone burst diode laser spectroscopy |
| EP1510798A1 (en) * | 2003-08-28 | 2005-03-02 | Siemens Aktiengesellschaft | Wavelength modulation spectroscopy method and system |
| US7116422B2 (en) | 2003-08-28 | 2006-10-03 | Siemens Aktiengesellschaft | Wavelength modulation spectroscopy method and system |
Non-Patent Citations (4)
| Title |
|---|
| APPLIED OPTICS, vol. 38, no. 21, July 1999 (1999-07-01), pages 4609 - 4622 |
| APPLIED OPTICS, vol. 38, no. 27, September 1999 (1999-09-01), pages 5803 - 5815 |
| APPLIED OPTICS, vol. 38, no. 36, December 1999 (1999-12-01), pages 7342 - 7354 |
| APPLIED OPTICS, vol. 44, no. 1, January 2005 (2005-01-01), pages 91 - 102 |
Cited By (22)
| Publication number | Priority date | Publication date | Assignee | Title |
|---|---|---|---|---|
| WO2013010938A1 (en) | 2011-07-18 | 2013-01-24 | Siemens Aktiengesellschaft | Method for driving a laser diode in a spectrometer |
| DE102011080086A1 (en) | 2011-07-29 | 2013-01-31 | Siemens Aktiengesellschaft | Method for measuring concentration of infrared-active gas component in measurement gas that is stored in measurement volume, involves normalizing light intensity that is detected at location of line, with calculated light intensity value |
| DE102011080086B4 (en) * | 2011-07-29 | 2016-04-28 | Siemens Aktiengesellschaft | Method for measuring the concentration of a gas component in a sample gas |
| CN104136897B (en) * | 2012-02-27 | 2015-12-02 | 西门子公司 | For measuring method and the laser spectrum analyser of the gas composition concentration in measurement gas |
| WO2013127657A1 (en) | 2012-02-27 | 2013-09-06 | Siemens Aktiengesellschaft | Method for measuring the concentration of a gas component in a measurement gas, and laser spectrometer |
| DE102012202893B3 (en) * | 2012-02-27 | 2013-01-17 | Siemens Aktiengesellschaft | Method for measuring concentration of gas component in measuring gas for visual gas analysis, involves triggering and producing current signals and burst-current signals such that signals are modified with directly generated current signals |
| CN104136897A (en) * | 2012-02-27 | 2014-11-05 | 西门子公司 | Method for measuring the concentration of a gas component in a measurement gas, and laser spectrometer |
| US9207169B2 (en) | 2012-02-27 | 2015-12-08 | Siemens Aktiengesellschaft | Laser spectrometer and method for measuring concentration of a gas component in a measurement gas |
| CN103969200A (en) * | 2013-01-30 | 2014-08-06 | 西门子公司 | Method for measuring concentration of gas component in measurement gas |
| CN103969200B (en) * | 2013-01-30 | 2016-08-17 | 西门子公司 | For the method measuring gas composition concentration in measuring gas |
| DE102013201459B4 (en) * | 2013-01-30 | 2017-01-05 | Siemens Aktiengesellschaft | Method for measuring the concentration of a gas component in a sample gas |
| DE102013201459A1 (en) | 2013-01-30 | 2014-07-31 | Siemens Aktiengesellschaft | Method for measuring concentration of gas component in measurement gas, involves detecting intensity light of laser diode after irradiating gas, where current intensity of burst signal corresponds to current value of current-time function |
| DE102013213458B4 (en) * | 2013-07-09 | 2015-07-09 | Siemens Aktiengesellschaft | Method for measuring the concentration of a gas component in a sample gas |
| DE102013213458A1 (en) | 2013-07-09 | 2015-01-15 | Siemens Aktiengesellschaft | Method for measuring the concentration of a gas component in a sample gas |
| US9546902B2 (en) | 2014-03-24 | 2017-01-17 | Servomex Group Limited | Method and system for correcting incident light fluctuations in absorption spectroscopy |
| EP2955495A3 (en) * | 2014-03-24 | 2016-05-11 | Servomex Group Ltd | Method and system for correcting incident light fluctuations in absorption spectroscopy |
| GB2524725B (en) * | 2014-03-24 | 2016-03-30 | Servomex Group Ltd | Method and system for correcting incident light fluctuations in absorption spectroscopy |
| GB2524725A (en) * | 2014-03-24 | 2015-10-07 | Servomex Group Ltd | Method and system for correcting incident light fluctuations in absorption spectroscopy |
| WO2016096416A1 (en) * | 2014-12-17 | 2016-06-23 | Siemens Aktiengesellschaft | Absorption spectrometer |
| CN107110773A (en) * | 2014-12-17 | 2017-08-29 | 西门子公司 | Absorption spectrometer |
| US10132747B2 (en) | 2014-12-17 | 2018-11-20 | Siemens Aktiengesellschaft | Absorption spectrometer |
| CN107110773B (en) * | 2014-12-17 | 2019-10-15 | 西门子公司 | Absorption spectrometer |
Also Published As
| Publication number | Publication date |
|---|---|
| US8094313B2 (en) | 2012-01-10 |
| US20090201507A1 (en) | 2009-08-13 |
| EP2072979B1 (en) | 2012-02-29 |
Similar Documents
| Publication | Publication Date | Title |
|---|---|---|
| EP2072979B1 (en) | Method for measuring the concentration of a gas component in a measuring gas | |
| EP1510798B1 (en) | Wavelength modulation spectroscopy method and system | |
| JP6022456B2 (en) | Method and system for determining the decay constant of a time domain signal | |
| EP1544604B1 (en) | Wavelength modulation spectroscopy method | |
| KR100747768B1 (en) | Apparatus for measuring exhaust gas using wavelength modulation spectroscopy | |
| JP3342446B2 (en) | Gas concentration measurement device | |
| CN105683727B (en) | Measure the measuring method and gas analyzer of the concentration of the gas component of gas | |
| US9261453B2 (en) | Method and gas analyzer for measuring the concentration of a gas component in a sample gas | |
| US11162896B2 (en) | Method and gas analyzer for measuring the concentration of a gas component in a measurement gas | |
| CN111521581B (en) | Method and device for judging components of carbon monoxide and methane and detecting concentration of components of carbon monoxide and methane and application of method and device | |
| US10168212B2 (en) | Optical spectroscopic measurement system | |
| CN114965357A (en) | Methyl ethyl alkane double-gas detection method and device based on TDLAS | |
| CN112729544B (en) | Laser wavelength locking system and method for scanning absorption spectrum | |
| KR100316487B1 (en) | Method of spectrochemical analysis of impurity in gas | |
| Modugno et al. | Fundamental noise sources in a high-sensitivity two-tone frequency modulation spectrometer and detection of CO2 at 1.6 µm and 2 µm | |
| US11467037B2 (en) | Rapid temperature measurement by wavelength modulation spectroscopy | |
| WO2012115150A1 (en) | Signal processing device and laser measurement device | |
| Cvijin et al. | Determination of gaseous formic acid and acetic acid by pulsed ultraviolet photoacoustic spectroscopy | |
| Lins et al. | Software-switching between direct absorption and wavelength modulation spectroscopy for the investigation of ADC resolution requirements | |
| Sharpe et al. | Rapid-scan Doppler-limited absorption spectroscopy using mid-infrared quantum cascade lasers | |
| Daghestani et al. | Open path chirped laser dispersion spectroscopy of methane plume | |
| Corsi et al. | High-sensitivity trace-gas monitoring for medical and environmental applications using a semiconductor diode laser | |
| Zhang et al. | Development of eight-channel methane gas optical fiber sensing system | |
| Wainner et al. | Tunable diode laser wavelength modulation spectroscopy (TDL-WMS) using a fiber-amplified source | |
| Werle | Fast sub-ppb Trace Gas Detection by Infrared Diode-Laser FM-Spectroscopy |
Legal Events
| Date | Code | Title | Description |
|---|---|---|---|
| PUAI | Public reference made under article 153(3) epc to a published international application that has entered the european phase |
Free format text: ORIGINAL CODE: 0009012 |
|
| AK | Designated contracting states |
Kind code of ref document: A1 Designated state(s): AT BE BG CH CY CZ DE DK EE ES FI FR GB GR HU IE IS IT LI LT LU LV MC MT NL PL PT RO SE SI SK TR |
|
| AX | Request for extension of the european patent |
Extension state: AL BA HR MK RS |
|
| 17P | Request for examination filed |
Effective date: 20091221 |
|
| 17Q | First examination report despatched |
Effective date: 20100128 |
|
| AKX | Designation fees paid |
Designated state(s): DE FR GB |
|
| GRAP | Despatch of communication of intention to grant a patent |
Free format text: ORIGINAL CODE: EPIDOSNIGR1 |
|
| GRAS | Grant fee paid |
Free format text: ORIGINAL CODE: EPIDOSNIGR3 |
|
| GRAA | (expected) grant |
Free format text: ORIGINAL CODE: 0009210 |
|
| AK | Designated contracting states |
Kind code of ref document: B1 Designated state(s): DE FR GB |
|
| REG | Reference to a national code |
Ref country code: GB Ref legal event code: FG4D |
|
| REG | Reference to a national code |
Ref country code: DE Ref legal event code: R096 Ref document number: 602007020950 Country of ref document: DE Effective date: 20120426 |
|
| PLBE | No opposition filed within time limit |
Free format text: ORIGINAL CODE: 0009261 |
|
| STAA | Information on the status of an ep patent application or granted ep patent |
Free format text: STATUS: NO OPPOSITION FILED WITHIN TIME LIMIT |
|
| 26N | No opposition filed |
Effective date: 20121130 |
|
| PGFP | Annual fee paid to national office [announced via postgrant information from national office to epo] |
Ref country code: GB Payment date: 20121212 Year of fee payment: 6 |
|
| REG | Reference to a national code |
Ref country code: DE Ref legal event code: R097 Ref document number: 602007020950 Country of ref document: DE Effective date: 20121130 |
|
| PGFP | Annual fee paid to national office [announced via postgrant information from national office to epo] |
Ref country code: FR Payment date: 20130131 Year of fee payment: 6 |
|
| GBPC | Gb: european patent ceased through non-payment of renewal fee |
Effective date: 20131221 |
|
| REG | Reference to a national code |
Ref country code: FR Ref legal event code: ST Effective date: 20140829 |
|
| PG25 | Lapsed in a contracting state [announced via postgrant information from national office to epo] |
Ref country code: GB Free format text: LAPSE BECAUSE OF NON-PAYMENT OF DUE FEES Effective date: 20131221 Ref country code: FR Free format text: LAPSE BECAUSE OF NON-PAYMENT OF DUE FEES Effective date: 20131231 |
|
| PGFP | Annual fee paid to national office [announced via postgrant information from national office to epo] |
Ref country code: DE Payment date: 20200219 Year of fee payment: 13 |
|
| REG | Reference to a national code |
Ref country code: DE Ref legal event code: R119 Ref document number: 602007020950 Country of ref document: DE |
|
| PG25 | Lapsed in a contracting state [announced via postgrant information from national office to epo] |
Ref country code: DE Free format text: LAPSE BECAUSE OF NON-PAYMENT OF DUE FEES Effective date: 20210701 |