EP1995592B1 - Automatische Fehlererkennung von Korrosion oder Rissen mit SAFT-verarbeiteten Lamb-Wellen-Bildern - Google Patents
Automatische Fehlererkennung von Korrosion oder Rissen mit SAFT-verarbeiteten Lamb-Wellen-Bildern Download PDFInfo
- Publication number
- EP1995592B1 EP1995592B1 EP08156604.4A EP08156604A EP1995592B1 EP 1995592 B1 EP1995592 B1 EP 1995592B1 EP 08156604 A EP08156604 A EP 08156604A EP 1995592 B1 EP1995592 B1 EP 1995592B1
- Authority
- EP
- European Patent Office
- Prior art keywords
- image
- saft
- render
- deconvolution
- applying
- Prior art date
- Legal status (The legal status is an assumption and is not a legal conclusion. Google has not performed a legal analysis and makes no representation as to the accuracy of the status listed.)
- Ceased
Links
Images





Classifications
-
- G—PHYSICS
- G01—MEASURING; TESTING
- G01N—INVESTIGATING OR ANALYSING MATERIALS BY DETERMINING THEIR CHEMICAL OR PHYSICAL PROPERTIES
- G01N29/00—Investigating or analysing materials by the use of ultrasonic, sonic or infrasonic waves; Visualisation of the interior of objects by transmitting ultrasonic or sonic waves through the object
- G01N29/04—Analysing solids
- G01N29/06—Visualisation of the interior, e.g. acoustic microscopy
- G01N29/0654—Imaging
- G01N29/069—Defect imaging, localisation and sizing using, e.g. time of flight diffraction [TOFD], synthetic aperture focusing technique [SAFT], Amplituden-Laufzeit-Ortskurven [ALOK] technique
-
- G—PHYSICS
- G01—MEASURING; TESTING
- G01N—INVESTIGATING OR ANALYSING MATERIALS BY DETERMINING THEIR CHEMICAL OR PHYSICAL PROPERTIES
- G01N29/00—Investigating or analysing materials by the use of ultrasonic, sonic or infrasonic waves; Visualisation of the interior of objects by transmitting ultrasonic or sonic waves through the object
- G01N29/36—Detecting the response signal, e.g. electronic circuits specially adapted therefor
- G01N29/42—Detecting the response signal, e.g. electronic circuits specially adapted therefor by frequency filtering or by tuning to resonant frequency
-
- G—PHYSICS
- G01—MEASURING; TESTING
- G01N—INVESTIGATING OR ANALYSING MATERIALS BY DETERMINING THEIR CHEMICAL OR PHYSICAL PROPERTIES
- G01N29/00—Investigating or analysing materials by the use of ultrasonic, sonic or infrasonic waves; Visualisation of the interior of objects by transmitting ultrasonic or sonic waves through the object
- G01N29/44—Processing the detected response signal, e.g. electronic circuits specially adapted therefor
- G01N29/4463—Signal correction, e.g. distance amplitude correction [DAC], distance gain size [DGS], noise filtering
-
- G—PHYSICS
- G01—MEASURING; TESTING
- G01N—INVESTIGATING OR ANALYSING MATERIALS BY DETERMINING THEIR CHEMICAL OR PHYSICAL PROPERTIES
- G01N29/00—Investigating or analysing materials by the use of ultrasonic, sonic or infrasonic waves; Visualisation of the interior of objects by transmitting ultrasonic or sonic waves through the object
- G01N29/44—Processing the detected response signal, e.g. electronic circuits specially adapted therefor
- G01N29/52—Processing the detected response signal, e.g. electronic circuits specially adapted therefor using inversion methods other that spectral analysis, e.g. conjugated gradient inversion
-
- G—PHYSICS
- G01—MEASURING; TESTING
- G01S—RADIO DIRECTION-FINDING; RADIO NAVIGATION; DETERMINING DISTANCE OR VELOCITY BY USE OF RADIO WAVES; LOCATING OR PRESENCE-DETECTING BY USE OF THE REFLECTION OR RERADIATION OF RADIO WAVES; ANALOGOUS ARRANGEMENTS USING OTHER WAVES
- G01S15/00—Systems using the reflection or reradiation of acoustic waves, e.g. sonar systems
- G01S15/88—Sonar systems specially adapted for specific applications
- G01S15/89—Sonar systems specially adapted for specific applications for mapping or imaging
- G01S15/8906—Short-range imaging systems; Acoustic microscope systems using pulse-echo techniques
- G01S15/8977—Short-range imaging systems; Acoustic microscope systems using pulse-echo techniques using special techniques for image reconstruction, e.g. FFT, geometrical transformations, spatial deconvolution, time deconvolution
-
- G—PHYSICS
- G06—COMPUTING OR CALCULATING; COUNTING
- G06T—IMAGE DATA PROCESSING OR GENERATION, IN GENERAL
- G06T5/00—Image enhancement or restoration
- G06T5/70—Denoising; Smoothing
-
- G—PHYSICS
- G06—COMPUTING OR CALCULATING; COUNTING
- G06T—IMAGE DATA PROCESSING OR GENERATION, IN GENERAL
- G06T5/00—Image enhancement or restoration
- G06T5/73—Deblurring; Sharpening
-
- G—PHYSICS
- G06—COMPUTING OR CALCULATING; COUNTING
- G06T—IMAGE DATA PROCESSING OR GENERATION, IN GENERAL
- G06T7/00—Image analysis
- G06T7/10—Segmentation; Edge detection
-
- G—PHYSICS
- G01—MEASURING; TESTING
- G01N—INVESTIGATING OR ANALYSING MATERIALS BY DETERMINING THEIR CHEMICAL OR PHYSICAL PROPERTIES
- G01N2291/00—Indexing codes associated with group G01N29/00
- G01N2291/04—Wave modes and trajectories
- G01N2291/042—Wave modes
- G01N2291/0427—Flexural waves, plate waves, e.g. Lamb waves, tuning fork, cantilever
-
- G—PHYSICS
- G01—MEASURING; TESTING
- G01S—RADIO DIRECTION-FINDING; RADIO NAVIGATION; DETERMINING DISTANCE OR VELOCITY BY USE OF RADIO WAVES; LOCATING OR PRESENCE-DETECTING BY USE OF THE REFLECTION OR RERADIATION OF RADIO WAVES; ANALOGOUS ARRANGEMENTS USING OTHER WAVES
- G01S15/00—Systems using the reflection or reradiation of acoustic waves, e.g. sonar systems
- G01S15/88—Sonar systems specially adapted for specific applications
- G01S15/89—Sonar systems specially adapted for specific applications for mapping or imaging
- G01S15/8906—Short-range imaging systems; Acoustic microscope systems using pulse-echo techniques
- G01S15/8997—Short-range imaging systems; Acoustic microscope systems using pulse-echo techniques using synthetic aperture techniques
-
- G—PHYSICS
- G06—COMPUTING OR CALCULATING; COUNTING
- G06T—IMAGE DATA PROCESSING OR GENERATION, IN GENERAL
- G06T2207/00—Indexing scheme for image analysis or image enhancement
- G06T2207/10—Image acquisition modality
- G06T2207/10132—Ultrasound image
-
- G—PHYSICS
- G06—COMPUTING OR CALCULATING; COUNTING
- G06T—IMAGE DATA PROCESSING OR GENERATION, IN GENERAL
- G06T2207/00—Indexing scheme for image analysis or image enhancement
- G06T2207/20—Special algorithmic details
- G06T2207/20036—Morphological image processing
-
- G—PHYSICS
- G06—COMPUTING OR CALCULATING; COUNTING
- G06T—IMAGE DATA PROCESSING OR GENERATION, IN GENERAL
- G06T2207/00—Indexing scheme for image analysis or image enhancement
- G06T2207/30—Subject of image; Context of image processing
- G06T2207/30108—Industrial image inspection
- G06T2207/30164—Workpiece; Machine component
Definitions
- the present invention generally relates to defect detections in materials and, more particularly, to automated corrosion or crack detection using images generated from applying a synthetic aperture focusing technique to ultrasonic Lamb waves.
- Corrosion and cracking can present concerns for structures used in aircraft and other aerospace vehicles.
- corrosion and cracking can have a significant impact on vehicle maintenance costs and ultimately on continued vehicle operation. Therefore, aerospace vehicle owners and operators spend considerable effort identifying and controlling the growth of structural defects. In some cases, the defects may not be visible by direct inspection, and may only be discovered after a relatively time-consuming structural disassembly has taken place.
- US-A-5 760 904 discloses a method and system for inspecting a surface of an object with laser ultrasound for defects that include cracks and corrosion, wherein Lamb waves are used to obtain image data by a SAFT technique.
- the state of the art is also disclosed in MARTINEZ O. et al.: "Application of digital signal processing techniques to synthetic aperture focusing technique images" SENSORS AND ACTUATORS A, ELSEVIER SEQUOIA S.A., LAUSANNE, CH, vol.76, no. 1-3,30 August 1999, pages 448-456, ISSN: 0924-4247 ; LEVESQUE D.
- Lamb waves are guided elastic waves that can travel in a solid plate with free boundaries at their top and bottom surfaces. Particle displacement occurs both in the direction of wave propagation and perpendicular to the plane of the plate.
- Lamb waves form several symmetric and antisymmetric modes related to the plate thickness and acoustic frequency of the waves. The phase velocity of these modes is dependent on a number of parameters including frequency and can be described graphically by a set of dispersion curves. The dispersive nature of the Lamb waves can make their interpretation difficult. This fact has limited the applicability of Lamb waves in nondestructive testing applications.
- Lamb waves can propagate for long distances in plate structures. Moreover, in contrast to the conventional method where the inspection is made with bulk waves collecting data on a point by point basis, Lamb waves travel along the plate while sensing through the plate thickness. Therefore, Lamb waves can provide significant time savings and can form the basis of an approach to inspect a plate structures without moving the transducer. Even though the ultrasound is an excellent technique for the detection of flaws, it is much less efficient in evaluation of their size, shape and orientation. The spatial resolution and signal to noise ratio of the ultrasound image can be improved by additional numerical processing of the ultrasound data. Such an algorithm can be a Synthetic Aperture Focusing Technique applied to an array of data. The SAFT method takes advantage of the spatial and temporal correlation of data to enhance the resolution and signal to noise ratio of an extracted ultrasonic image.
- the SAFT was originally developed in the time domain, it can be implemented in the frequency domain using a backpropagation technique based on the angular spectrum approach of scalar diffraction theory.
- Implementation of the SAFT algorithm in the frequency domain allows significant reduction in processing time by limiting the processed data to a selected bandwidth of concern.
- SAFT can also be easily modified for use with Lamb waves to account for their dispersive nature.
- the modification is called an L-SAFT algorithm. Its implementation requires additional computation of the dispersive curve corresponding to actually generated Lamb wave propagation modes. It is convenient to treat one Lamb wave at a time when compensating for dispersion by means of the L-SAFT algorithm. Thus, it is advantageous to generate a dominant Lamb wave mode during the specimen inspection.
- a process is disclosed herein that achieves robust automatic detection of defects using synthetic aperture focusing technique (SAFT) ultrasound Lamb wave images.
- SAFT synthetic aperture focusing technique
- the initial raw, untreated ultrasound SAFT generated images contain several types of degradation in addition to defect evidence.
- noise degradation mechanisms are analyzed, modeled, and treated to reduce their influence on the final image that is used to characterize the defect damage.
- the noise models for random noise, systematic noise, and point spread function distortion are established prior to on-line operation, and preferably reside in memory. These noise models can be adjusted locally to account for spatial variations within the image field.
- image fusion may be implemented. Image fusion, if implemented, is followed by image segmentation to identify defect regions.
- a statistical model for the image random noise is used to adapt the image segmentation and ensuing decision analysis to the known noise distributions. This allows a probability of false indication (noise labeled a flaw) and a probability of detection to be established. Finally, image segments are described with feature vectors so that further decision analysis can be made.
- FIG. 1 illustrates an exemplary automated defect detection system 10.
- a processing device 12 includes a processor/controller 14 coupled to a memory device 16, which can include such memory as non-volatile read only memory (NVRAM) or an equivalent.
- NVRAM non-volatile read only memory
- Processor 14 is also coupled to a mass storage device 18, which can include such devices as hard disk devices (HDDs) or an equivalent.
- HDDs hard disk devices
- Processor 14 is coupled through an interface 20 using lead 22 to a transducer device 24 with an integrated emitter/sensor 26 in view of a surface 28 to be analyzed, such as a portion of the skin of an airframe.
- Surface 28 can be comprised of metal, such as aluminum (Al), or can also be comprised of a composite, such as a durable epoxy or carbon fiber material.
- system 10 can include a variety of additional components, such as additional transducers 24 which are configured in an array, or additional memory or processing components for a particular application.
- Processor/controller 14 may be configured to execute computer instructions which can be stored in memory 16, mass storage 18, or embodied in a computer program product such as a digital versatile disk (DVD) or compact disk (CD) or an equivalent.
- the computer instructions may include executable commands which incorporate methodologies and algorithms as further described below.
- the methodology to perform on-line automatic defect detection employs four image processing steps and three noise models.
- the defect detection system 10 first obtains a SAFT image 32.
- a series of image processing steps are then performed on the image 32.
- the image processing steps include systematic background suppression 34, image deconvolution 36, image segmentation 38, and a decision analysis block 40.
- the image processing steps render a series of extracted ultrasonic images, as each preceding image is subsequently processed through a subsequent step. It will be appreciated that these image processing steps can be implemented adaptively by updating the noise models and estimates after each new data collection (imaging) activity.
- Noise modeling forms part of the automatic defect detection methodology. Reliability and robustness of the methodology is improved by the quality of the characterized noise and distortion.
- FIG. 2 depicts, the methodology disclosed herein accounts for three types of noise and distortion - systematic noise 42 (systematic error), random noise 46 e.g. speckle, and image distortion or blurring e.g. convolution of the signal with the system point spread function 44 (PSF).
- systematic error random noise 46 e.g. speckle
- image distortion or blurring e.g. convolution of the signal with the system point spread function 44 (PSF).
- PSF system point spread function
- Systematic noise can be caused by spurious return signals due to interaction between wedge, transducer and sample interfaces, specimen geometry constraints and systematic errors introduced by the signal source and receiver.
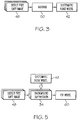
- the preferred approach to the systematic background modeling is depicted schematically in FIG 3 .
- a number of undamaged plate baseline samples 48 may be scanned, and the error may be determined by averaging 50 over the set of input images.
- the foregoing expression can be referred to as a systematic background noise suppression algorithm. It will be appreciated that the bias may depend on the experimental configuration, i.e. transducer type, transducer mounting wedge shape, size and material, ultrasound pulse shape, Lamb wave propagation mode, test specimen material and dimension, etc. Therefore, it should be determined separately, on a case-by-case basis, for each unique configuration.
- non-damaged plate samples are scanned with shear velocity, longitudinal velocity and thickness given respectively by, V s of about 3140 m/s, V l of about 5680 m/s, and d of about 1.82 mm.
- V s shear velocity, longitudinal velocity and thickness given respectively by, V s of about 3140 m/s, V l of about 5680 m/s, and d of about 1.82 mm.
- a linear piezo-ceramics transducer array with central frequency 2.5 MHz is used to scan the specimens.
- FIG. 4 shows results of the systematic background determination and its subtraction from an example of L-SAFT processed image, pursuant to a systematic background noise suppression algorithm.
- the background noise suppression algorithm may incorporate one or more mathematical models representing systematic noise.
- the data were analyzed using an Al Lamb wave propagation mode.
- Image 52 shows an exemplary special distribution of the bias.
- the Y axis represents a distance from the transducer 24 in millimeters, as the X axis represents a lateral position across a portion of sampled surface in millimeters.
- Image 54 shows an exemplary noisy L-SAFT processed image.
- image 56 shows a residual image from the distribution of image 52 subtracted from the image 54.
- a point spread function (PSF) of the system can be modeled based on the physical principals of the image system, measured, or estimated directly from known SAFT image data.
- the processing chain used to estimate the PSF model from defect free SAFT images is depicted in FIG. 5 .
- a number of defect free SAFT images 48 are introduced.
- a systematic noise model 42 is brought to bear in a systematic background noise suppression algorithm, the data of which is utilized to generate PSF model 60.
- the point spread function is used to remove distortion inherent in the SAFT image due to the physical limitations of image formation. As depicted in FIG. 2 , the distortion is removed through the application of a linear filtering process known as deconvolution.
- Ultrasound images are distorted by several phenomenon in so-called "signal transmission channels".
- a respective transmission channel comprises tissue/material layers between a transducer and a target and both the analog and the digital part of ultrasound signal processing.
- PSF distortion point spread function
- the deconvolution reduces the effect of the PSF on the measured signal.
- the deconvolution provides significant enhancement of image segment borders to make subsequent image segmentation easier and more reliable.
- This method which was developed originally for deconvolution of radiofrequency (RF), is based on the assumption that the two components of the convolution have different spatial frequency properties. This allows simple low pass filtering in the cepstrum domain to separate the signal (x(n)) from the PSF (h(n)).
- the principle of the method is depicted in FIG. 6 , where a respective signal is first converted by a Z-transform (step 62) into the Z domain. The signal is then processed through a log() function (step 64), and then converted back to the time domain by an inverse Z-transform function (step 66). The signal is then processed through a filter (step 68), converted back to the Z domain (step 70), processed through an exp() function (step 72), and again converted back to the time domain (step 74).
- FIG. 7 illustrates a SAFT deconvolution using PSF estimation by means of homomorphic filtration.
- the X and Y axes are representative of lateral position and distance from the transducer in millimeters, respectively.
- Image 76 shows a residual SAFT image.
- image 78 shows a simple one dimensional estimate for the PSF. Two dimensional PSF can also be generated.
- Image 80 shows a deconvolved image using a Lucy-Richardson deconvolution algorithm.
- a deconvolved image 82 is shown using a Wiener deconvolution.
- the ultrasound SAFT imaging involves the coherent summation of ultrasonic echo signals returned from scatterers that may be located in the sample under investigation.
- scattered returned signals may arise from the random distribution of grain boundaries in metal and/or aggregates in composites and material non-homogeneities, which gives rise to an interference pattern commonly referred to as "speckle.”
- speckle Because it is formed from signals reflected from randomly located scatterers, speckle has a random nature. Due to the statistical nature of the speckle (noise) signal, a statistical analysis approach may be used.
- FIG 8 An exemplary random noise modeling process is shown in FIG 8 .
- a set of defect free SAFT images 54 are cleared of systematic background noise (incorporating model 42 in a suppression algorithm 34 as previously described).
- deconvolution 36 is performed to remove convolution distortion from the data.
- the remaining random background noise is modeled by a probability density function 46 (PDF).
- PDF probability density function
- the random noise model 46 seeks the best fit for the histogram of the ultrasound image data. Due to beam spreading and other physical effects, the PDF characteristics of the random noise can vary with image location.
- the input images may be split into small patches and the PDF parameters are estimated for each local sub-domain of the collected set of images.
- ultrasonic synthetic aperture focused images of the inspected area could be generated using data acquired from a symmetric and an antisymmetric Lamb wave mode.
- the modes can be separated through frequency bandwidth selection and/or temporal gating prior to the SAFT image reconstruction. Since the set of ultrasonic Lamb wave modes are known to be orthogonal, exhibiting specific characteristics to each mode, e.g. particle displacements, the images from each mode can provide additional information about the nature of the inspected area.
- each imaging mode is studied to establish its own systematic noise model, PSF model, and random noise model. As previously described, this information is established a priori to actual sensor system operation. It will be appreciated that these image processing steps can be implemented adaptively by updating the noise models after each new data collection (imaging) activity. Simplifications can be made by combining noise models for more than one image when variations between commensurate noise models do not change significantly for the different images.
- the images are processed according to the background suppression and deconvolution steps outlined above to yield multiple unique images of the inspected area.
- data fusion techniques that can be used to fuse the images, such as Bayesian methods, fuzzy logic inference, weighting and voting schemes, Dempster-Shafer methods, and neural network techniques (represented as data fusion 84).
- Estimates for the statistical measures of the new random noise model associated with the fused image can also be made. This can proceed analytically working with the probability density models for the random background noise and the data fusion methodology or the new random noise model can be estimated empirically through Monte Carlo techniques.
- the random noise model for the combined fused data (represented as data fusion 86) is used in subsequent image segmentation and decision analysis steps.
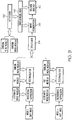
- FIG. 10 An exemplary image segmentation method is depicted in FIG. 10 .
- This depicted method includes adaptive thresholding 88 based on the spatially varying random noise statistics, morphological processing 90 for segment boundaries enhancement, and segment boundary detection 92 which is performed on a processed SAFT image 94.
- the adaptive image thresholding exploits the previously estimated random noise statistics.
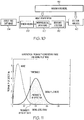
- FIG. 11 depicts an exemplary method of setting the image threshold level to achieve a given PFI.
- the probability of detection for a noise distribution and signal plus noise distribution are shown as functions of signal level.
- the probability that the amplitude of a pixel exceeds a threshold when no signal is present is the probability of false calls or probability of false indication.
- the image 'detector' threshold level is set to limit the probability of detecting the noise to an acceptable level.
- p n the probability-density function of the noise
- V t the threshold value
- the random noise can be determined and modeled throughout the image. Furthermore the signal responses for a specific defect can be modeled. After giving consideration to the randomizing effects of defect orientation, morphology, and material variability a range of signal responses can be produced. By combining these results with the background noise and threshold criterion estimates of the POD for specific defect, material, transducer configurations can be established.
- the main advantage of the above-described approach is that it assures constant false alarm probability ( P fa ) for each anomaly of the image. Moreover, because the distribution parameters can be estimated locally to reflect non-stationarity of the random background noise, the threshold value varies according to image position. This feature allows adaptability of the thresholding algorithm to local properties of the random background noise, which in turn results in higher performance for the thresholding operation.
- the distributed noise model is well characterized by locally varying Weibull distributions, representing the random noise data associated with the image.
- the value of the threshold can be determined in order to provide a constant false alarm rate.
- ⁇ is a scale parameter or characteristic life and ⁇ is the shape parameter or slope of the distribution.
- An exemplary method of determining the POD for various defects is to adapt the distance-gain-reflector size (DGS) approach introduced by Krautkramer and others in Germany between 1968 and 1973.
- DGS distance-gain-reflector size
- This approach models the response of defects to bulk ultrasonic wave inspection foregoing the need for tedious measurements although a measurement approach could used as an alternative.
- the ultrasonic signal strength returned from a defect is known to depend on material attenuation ( ⁇ ), beam spreading/focusing, ultrasonic wavelength ( ⁇ ), probe dimensions, as well as defect size and shape.
- a defect form factor (K) is introduced to account for the different types of defects.
- Calibration curves are generated to relate the acoustic field strength (I) to locations within the radiated field under various reflector beam size relationships.
- V V o K ⁇ 2 S I exp ⁇ 2 ⁇
- Vo the maximum signal amplitude
- S the probe area
- ⁇ the distance to the target.
- the amplitude, I( ⁇ , ⁇ ), and waist size, S( ⁇ , ⁇ ), of the point spread function (PSF) within the near field region of the transducer are established, where ⁇ is the angle of the steered beam and ⁇ is distance.
- V V o K ⁇ d ⁇ 2 S ⁇ , ⁇ I ⁇ , ⁇ exp ⁇ 2 ⁇ .
- POD estimates can be made for a given flaw inspection scenario by combining the estimates of the background noise and a threshold criterion with calculated signal responses from the calibration curves. For a given flaw size and location a range of responses can be parametrically established by randomizing the defect orientation, morphology, and material variability parameters.
- morphological operators can be applied to the thresholded image, if desired.
- the object of the morphological operator is to remove salt and pepper noise and to further smooth the segments boundaries for better defect edge definition.
- the size of the structuring element used in the morphological processing is set by the relationship between the size of the smallest anomaly that it is desired to detect, and resolution and rendering limitations.
- the last step of the image segmentation is boundary detection. The goal is to find a coherent one-dimensional boundary features from the individually identified defects with local edge pixels. Several common methods based on the morphological operators and gradient operators of the first or second order may be used to achieve this step.
- FIG. 12 shows exemplary smooth contour estimates for locally varying Weibull distribution parameters, with the accompanying X and Y axis designations of FIGs. 4 and 7 .
- Image 96 shows a representation of a scale parameter.
- Image 98 shows a representation of a shape parameter.
- image 100 shows an exemplary threshold value distribution obtained using the Weibull parameters shown in images 96 and 98.
- FIG. 13 shows an exemplary result of an image segmentation technique, again with the accompanying X and Y axis designations of FIGs. 4 , 7 , and 12 .
- Image 102 illustrates a deconvolved SAFT image.
- Image 104 illustrates a thresholded image.
- image 106 illustrates a resultant image following morphological processing 90 and edge boundary detection 92.
- a Canny edge detection operator is utilized to segment respective areas.
- the contours shown in FIG. 13 are filled for better visualization and distinction.
- An optional feature description step follows the image segmentation process. Every identified image segment can be described by a set of parameters that quantitatively express its properties. Selection of appropriate statistics/parameters can be helpful in discrimination between regions that represent false signals and true defect damage. Furthermore, it can provide information about severity and advancement of the damage.
- Clustering algorithms are classic techniques to transform feature vectors from the measured parameters into a feature space where class identification can take place.
- the goal of pattern classification is to assign a physical object or process to a pre-defined class based on the statistics of its features.
- Various transformations such as principal component analysis, Sammon mapping, and other non-linear transformations can be used, while designing a classifier through techniques such as Fisher discriminant analysis.
- features such as length of segment boundaries and average segment areas are simple geometric features. More sophisticated feature extraction could involve curve analysis.
- the segment boundaries can be modeled as a parametrical curve (circle, ellipse, etc.) or as a nonparametrical curve (principal curve). Segment properties can be described by statistical means using statistical moments of the first and higher order. Next, different means of gradient computation can be used if needed.
Landscapes
- Physics & Mathematics (AREA)
- Engineering & Computer Science (AREA)
- General Physics & Mathematics (AREA)
- Life Sciences & Earth Sciences (AREA)
- Pathology (AREA)
- Health & Medical Sciences (AREA)
- Chemical & Material Sciences (AREA)
- Analytical Chemistry (AREA)
- Biochemistry (AREA)
- General Health & Medical Sciences (AREA)
- Immunology (AREA)
- Acoustics & Sound (AREA)
- Radar, Positioning & Navigation (AREA)
- Remote Sensing (AREA)
- Theoretical Computer Science (AREA)
- Signal Processing (AREA)
- Spectroscopy & Molecular Physics (AREA)
- Computer Networks & Wireless Communication (AREA)
- Computer Vision & Pattern Recognition (AREA)
- Investigating Or Analyzing Materials By The Use Of Ultrasonic Waves (AREA)
Claims (9)
- Automatisches Verfahren zum Erkennen von Korrosion oder Rissdefekten, das umfasst:Erhalten von Ultraschallbildern, die mit geführten Lamb-Wellen erfasst werden;Anwenden einer Synthetic Aperture Focusing Technique (SAFT) bei einem dadurch erhaltenen Ultraschallbild zum Wiedergeben eines SAFT-Bilds (32); undAnwenden eines Systemisches-Hintergrundrauschen-Unterdrückung-Algorithmus (34) bei dem SAFT-Bild (32) zum Wiedergeben eines hintergrundunterdrückten SAFT-Bilds;gekennzeichnet durchAnwenden eines Entfaltungs-Linearfilterungs-Prozesses (36) bei dem hintergrundunterdrückten SAFT-Bild zum Wiedergeben eines entfalteten linear gefilterten Bilds; undAnwenden eines Bildsegmentierungsalgorithmus (38) bei dem entfalteten linear gefilterten Bild.
- Verfahren nach Anspruch 1, wobei die Ultraschallbilder unter Verwendung einer eindeutigen Ultraschallanregung oder Filterung eines Frequenzgehalts eines Rücklauf-Ultraschallsignals zum Verwenden einer Vielzahl von Lamb-Wellen-Moden erfasst werden.
- Verfahren nach Anspruch 1, wobei das Anwenden eines Bildsegmentierungsalgorithmus (38) das Anwenden eines Spannungsschwellwertalgorithmus aus einem Statistisches-Rauschen-Modell für Bilddaten umfasst.
- Verfahren nach Anspruch 3, wobei der Spannungsschwellwertalgorithmus angewendet wird entsprechend

- Automatisches Fehlererkennungssystem, das umfasst:einen Transducer (24), der so ausgeführt ist, dass er Ultraschallbilder erhält, die mit geführten Lamb-Wellen (30) erfasst werden; undeinen Controller (14), der mit dem Transducer gekoppelt ist und so ausgeführt ist, dass ereine Synthetic Aperture Focusing Technique (SAFT) bei einem Ultraschallbild, das aus dem Transducer (24) erhalten wird, zum Wiedergeben eines SAFT-Bilds (32) anwendet; undeinen Systemisches-Hintergrundrauschen-Unterdrückung-Algorithmus (34) bei dem SAFT-Bild (32) zum Wiedergeben eines hintergrundunterdrückten SAFT-Bilds anwendet;dadurch gekennzeichnet, dass der Controller (14) ferner so ausgeführt ist, dass er:einen Entfaltungs-Linearfilterungs-Prozess (36) bei dem hintergrundunterdrückten SAFT-Bild zum Wiedergeben eines entfalteten linear gefilterten Bilds anwendet; undeinen Bildsegmentierungsalgorithmus (38) bei dem entfalteten linear gefilterten Bild anwendet.
- System nach Anspruch 5, wobei die Ultraschallbilder unter Verwendung einer eindeutigen Ultraschallanregung oder Filterung eines Frequenzgehalts eines Rücklauf-Ultraschallsignals zum Verwenden einer Vielzahl von Lamb-Wellen-Moden erfasst werden.
- System nach Anspruch 6, wobei der Controller ferner so ausgeführt ist, dass er eine Vielzahl von Ultraschallbildern zum Wiedergeben eines zusammengesetzten Bilds (84) kombiniert.
- System nach Anspruch 7, wobei der Controller ein Bayessches-Verfahren, eine Fuzzy-Logic-Inferenz, ein Gewichtungs- und Wahlschema, ein Demptster-Shafer-Verfahren oder eine Neuronales-Netz-Technik zum Wiedergeben des zusammengesetzten Bilds (84) anwendet.
- System nach Anspruch 7, wobei der Controller den Bildsegmentierungsalgorithmus (38) durch Anwenden eines Spannungsschwellwerts, der aus dem Statistisches-Rauschen-Modell für Bilddaten bestimmt wird, anwendet.
Applications Claiming Priority (2)
| Application Number | Priority Date | Filing Date | Title |
|---|---|---|---|
| US93949507P | 2007-05-22 | 2007-05-22 | |
| US11/880,450 US7783433B2 (en) | 2007-05-22 | 2007-07-21 | Automated defect detection of corrosion or cracks using SAFT processed Lamb wave images |
Publications (2)
| Publication Number | Publication Date |
|---|---|
| EP1995592A1 EP1995592A1 (de) | 2008-11-26 |
| EP1995592B1 true EP1995592B1 (de) | 2018-01-17 |
Family
ID=39627695
Family Applications (1)
| Application Number | Title | Priority Date | Filing Date |
|---|---|---|---|
| EP08156604.4A Ceased EP1995592B1 (de) | 2007-05-22 | 2008-05-20 | Automatische Fehlererkennung von Korrosion oder Rissen mit SAFT-verarbeiteten Lamb-Wellen-Bildern |
Country Status (3)
| Country | Link |
|---|---|
| US (1) | US7783433B2 (de) |
| EP (1) | EP1995592B1 (de) |
| AU (1) | AU2008202249A1 (de) |
Families Citing this family (49)
| Publication number | Priority date | Publication date | Assignee | Title |
|---|---|---|---|---|
| US8768657B2 (en) * | 2006-01-12 | 2014-07-01 | Jentek Sensors, Inc. | Remaining life prediction for individual components from sparse data |
| US7930128B2 (en) * | 2007-04-16 | 2011-04-19 | Acellent Technologies, Inc. | Robust damage detection |
| US20110054806A1 (en) * | 2009-06-05 | 2011-03-03 | Jentek Sensors, Inc. | Component Adaptive Life Management |
| US8429974B2 (en) * | 2009-09-08 | 2013-04-30 | Honeywell International Inc. | Lamb wave dispersion compensation for EUSR approach to ultrasonic beam steering |
| US8831895B2 (en) * | 2011-06-27 | 2014-09-09 | Honeywell International Inc. | Structural damage index mapping system and method |
| US8677825B1 (en) * | 2011-06-29 | 2014-03-25 | The Boeing Company | Identification of lamb wave modes |
| WO2013020142A2 (en) * | 2011-08-04 | 2013-02-07 | University Of Southern California | Image-based crack detection |
| US8712184B1 (en) * | 2011-12-05 | 2014-04-29 | Hermes Microvision, Inc. | Method and system for filtering noises in an image scanned by charged particles |
| WO2013090830A1 (en) | 2011-12-16 | 2013-06-20 | University Of Southern California | Autonomous pavement condition assessment |
| US9058656B2 (en) * | 2012-01-23 | 2015-06-16 | Eiffel Medtech Inc. | Image restoration system and method |
| US10126274B2 (en) * | 2012-05-16 | 2018-11-13 | Hidden Solutions Llc | Method and system for multi-path active defect detection, localization and characterization with ultrasonic guided waves |
| US9235931B2 (en) * | 2012-05-18 | 2016-01-12 | Eiffel Medtech Inc. | Method and system for the three-dimensional reconstruction of structures |
| US9638671B2 (en) * | 2012-05-25 | 2017-05-02 | Fbs, Inc. | Systems and methods for damage detection in structures using guided wave phased arrays |
| CN103565473A (zh) * | 2012-07-27 | 2014-02-12 | 三星电子株式会社 | 图像处理模块和图像处理方法 |
| DE102013200058B3 (de) * | 2013-01-04 | 2014-06-26 | Siemens Aktiengesellschaft | Automatisierte Auswertung der Rohdaten eines MR-Spektrums |
| DE102013211616A1 (de) | 2013-06-20 | 2014-12-24 | Bundesanstalt für Materialforschung- und prüfung (BAM) | Verfahren und Vorrichtung zur Defektgrößenbewertung |
| US9933353B2 (en) * | 2014-02-13 | 2018-04-03 | Infosys Limited | Method for assessing corroded pipeline defect growth from partial inspection data and devices thereof |
| CN104034801B (zh) * | 2014-05-13 | 2016-06-15 | 华南理工大学 | 基于合成时反的结构损伤迭代聚焦成像监测方法 |
| US10438341B2 (en) * | 2014-09-29 | 2019-10-08 | Sikorsky Aircraft Corporation | Apparatus for detecting corrosion in an article |
| CN104535655B (zh) * | 2014-11-24 | 2017-06-30 | 清华大学 | 一种射线追踪式超声Lamb波缺陷层析成像方法 |
| CN106934795B (zh) * | 2017-01-23 | 2018-11-02 | 陕西师范大学 | 一种混凝土桥梁裂缝的自动检测方法和预测方法 |
| US11147538B2 (en) * | 2018-01-15 | 2021-10-19 | International Business Machines Corporation | Efficient computation of spatially varying ultrasound analytical point spread functions |
| CN109632963B (zh) * | 2019-01-11 | 2020-10-20 | 南京航空航天大学 | 一种基于时不变特征信号构建的结构损伤四维成像方法 |
| TWI723588B (zh) * | 2019-10-17 | 2021-04-01 | 國立中央大學 | 基於合成聚焦技術之厚度測量系統與方法 |
| CN112819746B (zh) * | 2019-10-31 | 2024-04-23 | 合肥美亚光电技术股份有限公司 | 坚果籽仁虫蚀缺陷检测方法及装置 |
| CN111179225B (zh) * | 2019-12-14 | 2022-02-01 | 西安交通大学 | 一种基于灰度梯度聚类的试纸表面纹理缺陷检测方法 |
| CN111553877B (zh) * | 2020-03-20 | 2022-04-01 | 西安交通大学 | 基于太赫兹陶瓷基复合材料叶片损伤识别和寿命评估方法 |
| CN111862012A (zh) * | 2020-07-02 | 2020-10-30 | 西南科技大学 | 基于深度卷积神经网络的机场滑行道的缺陷检测方法 |
| CN112132966A (zh) * | 2020-09-29 | 2020-12-25 | 成都理工大学 | 一种基于拓扑结构的页岩裂缝网络连通性表征方法 |
| CN112485336B (zh) * | 2020-11-23 | 2022-04-15 | 西南交通大学 | 一种基于差分技术的激光超声合成孔径成像方法 |
| EP4285195A4 (de) | 2021-01-28 | 2025-04-16 | Odysight.AI Ltd | Systeme und verfahren zur überwachung eines möglichen defekts in einer maschine oder einer komponente davon |
| CN112964789B (zh) * | 2021-01-30 | 2023-06-06 | 江苏省特种设备安全监督检验研究院 | 一种声学与图像信息相融合的动态点蚀智能评价方法 |
| CN114943668B (zh) * | 2021-02-08 | 2025-10-28 | 中国石油化工股份有限公司 | 存储器、金属点蚀过程识别方法、装置及设备 |
| CN113628179B (zh) * | 2021-07-30 | 2023-11-24 | 厦门大学 | 一种pcb表面缺陷实时检测方法、装置及可读介质 |
| CN114037691B (zh) * | 2021-11-15 | 2024-12-10 | 浙江理工大学 | 一种基于图像处理的碳纤维板裂纹检测方法 |
| CN114544774B (zh) * | 2022-01-06 | 2025-08-19 | 东南大学 | 一种基于非线性兰姆波的闭合裂纹成像装置及方法 |
| CN114663672B (zh) * | 2022-03-11 | 2023-04-07 | 四川大学 | 一种输电线路塔钢构件腐蚀检测方法及系统 |
| CN114813423A (zh) * | 2022-03-27 | 2022-07-29 | 江苏新时高温材料股份有限公司 | 基于光学测试的板状刚玉的抗腐蚀性检测方法 |
| EP4514690A4 (de) | 2022-04-27 | 2025-08-27 | Odysight Ai Ltd | Überwachung eines mechanismus oder einer komponente davon |
| CN114994177B (zh) * | 2022-05-26 | 2023-06-09 | 哈尔滨工业大学 | 复合板材超声缺陷检测方法及装置和复合板材 |
| CN114782439B (zh) * | 2022-06-21 | 2022-10-21 | 成都沃特塞恩电子技术有限公司 | 培育钻石的生长状态检测方法、装置、系统、电子设备 |
| CN114878696B (zh) * | 2022-07-06 | 2022-10-04 | 太原理工大学 | 一种弧形复合材料层合板分层损伤的识别方法 |
| CN115561310B (zh) * | 2022-09-15 | 2025-05-16 | 国网湖北省电力有限公司超高压公司 | 能够处理接地极缺陷回波信号中非随机相干噪声的方法 |
| CN115508652B (zh) * | 2022-10-18 | 2025-11-14 | 国网浙江省电力有限公司宁波供电公司 | 电力系统缺陷定位检测方法和系统 |
| CN116026923B (zh) * | 2023-02-01 | 2023-06-09 | 天津风霖物联网科技有限公司 | 一种建筑外墙缺陷检测方法及系统 |
| DE102023111681A1 (de) * | 2023-05-04 | 2024-11-07 | Wipotec Gmbh | Verfahren und Vorrichtung zur Detektion von Anomalien in zweidimensionalen digitalen Bildern von Produkten |
| CN116642953B (zh) * | 2023-06-27 | 2026-03-27 | 山东省科学院激光研究所 | 一种强噪背景下的缺陷超声成像方法及系统 |
| CN119021840B (zh) * | 2024-10-16 | 2026-01-30 | 中国长江三峡集团有限公司 | 一种风机塔筒焊缝及螺栓检测方法及系统 |
| CN119648835A (zh) * | 2024-12-10 | 2025-03-18 | 华中科技大学 | 分层缺陷的线性调频兰姆波和全卷积网络成像方法及系统 |
Citations (1)
| Publication number | Priority date | Publication date | Assignee | Title |
|---|---|---|---|---|
| US20050163375A1 (en) * | 2004-01-23 | 2005-07-28 | Leo Grady | System and method for multi-label image segmentation |
Family Cites Families (32)
| Publication number | Priority date | Publication date | Assignee | Title |
|---|---|---|---|---|
| DE3331468A1 (de) * | 1983-08-29 | 1985-03-07 | Mannesmann AG, 4000 Düsseldorf | Verfahren zur zerstoerungsfreien pruefung mit gefuehrten wellen |
| US4653000A (en) * | 1983-09-06 | 1987-03-24 | Kabushiki Kaisha Toshiba | Image signal-processing system based on synthetic aperture technique |
| GB8611518D0 (en) | 1986-05-12 | 1986-06-18 | Manchester Inst Science Tech | Corrosion monitoring |
| US4911014A (en) * | 1988-07-22 | 1990-03-27 | Akademiet For De Tekniske Videnskaber, Svejsecentralen | Method of analyzing and evaluating the results of an ultrasonic examination |
| JPH0640096B2 (ja) * | 1989-05-22 | 1994-05-25 | 工業技術院長 | 微小散乱体間隔空間分布測定方法および装置 |
| GB9106218D0 (en) * | 1991-03-23 | 1991-05-08 | Capcis March Ltd | Electrochemical impedance monitoring |
| US5493511A (en) * | 1992-12-08 | 1996-02-20 | Administrator, National Aeronautics And Space Administration | High speed thin plate fatigue crack monitor |
| US5608814A (en) * | 1993-08-26 | 1997-03-04 | General Electric Company | Method of dynamic thresholding for flaw detection in ultrasonic C-scan images |
| US5528557A (en) * | 1995-08-07 | 1996-06-18 | Northrop Grumman Corporation | Acoustic emission source location by reverse ray tracing |
| EP0829714A4 (de) * | 1996-03-28 | 2007-06-27 | Mitsubishi Electric Corp | Ultraschallfehlerdetektor und ultraschallverfahren zum erkennen von fehlern |
| US5760904A (en) * | 1996-07-26 | 1998-06-02 | General Electric Company | Method and system for inspecting a surface of an object with laser ultrasound |
| US6182512B1 (en) * | 1997-06-13 | 2001-02-06 | General Electric Company | Method and apparatus for imaging thin structures |
| WO1999027360A1 (fr) * | 1997-11-21 | 1999-06-03 | Mitsubishi Cable Industries, Ltd. | Procede et dispositif de diagnostic de la deterioration d'un article presentant au moins une couche de couverture en materiau polymere organique |
| US6264824B1 (en) * | 1998-02-20 | 2001-07-24 | Integriti Investments Ltd. | Assessment of corrosion |
| US5951479A (en) * | 1998-09-29 | 1999-09-14 | General Electric Company | Method and apparatus for synthetic transmit aperture imaging |
| US6386038B1 (en) * | 1999-11-24 | 2002-05-14 | Lewis, Iii Carl Edwin | Acoustic apparatus and inspection methods |
| US6581014B2 (en) * | 2000-07-20 | 2003-06-17 | Southwest Research Institute | Apparatus and method for analysis of guided ultrasonic waves |
| GB0105688D0 (en) | 2001-03-08 | 2001-04-25 | Integriti Invest Ltd | Apparatus and method |
| DE10115329C2 (de) * | 2001-03-28 | 2003-07-03 | Framatome Anp Gmbh | Ultraschallverfahren zur Dickenmessung von schwach reflektierenden Teilschichten eines Mehrschichtbauteils |
| AUPR450801A0 (en) * | 2001-04-20 | 2001-05-24 | Commonwealth Scientific And Industrial Research Organisation | Method and apparatus for carrying out non-destructive testing of materials |
| US20030030638A1 (en) * | 2001-06-07 | 2003-02-13 | Karl Astrom | Method and apparatus for extracting information from a target area within a two-dimensional graphical object in an image |
| US7117134B2 (en) * | 2001-10-18 | 2006-10-03 | Lockheed Martin Corporation | Method to optimize generation of ultrasound using mathematical modeling for laser ultrasound inspection |
| US6856918B2 (en) * | 2001-11-26 | 2005-02-15 | Lockheed Martin Corporation | Method to characterize material using mathematical propagation models and ultrasonic signal |
| GB2383412B (en) * | 2001-12-18 | 2004-06-30 | Univ Sheffield | Structural health monitoring |
| US6877376B1 (en) * | 2002-01-08 | 2005-04-12 | Battelle Memorial Institute | Apparatus, systems, and methods for ultrasound synthetic aperature focusing |
| US6677765B2 (en) * | 2002-04-02 | 2004-01-13 | Esa Corrosion Solutions, Llc | Detection, measurement and control of ammonia in flue gas |
| US6797149B2 (en) * | 2002-04-02 | 2004-09-28 | Intercorr Holdings, Ltd. | Apparatus and method for electrochemical detection and control of inorganic scale |
| EP1514217A4 (de) * | 2002-06-14 | 2010-10-13 | Univ South Carolina | Strukturintegritätsüberwachungssystem mit ultraschall-strukturradar mit eingebetteten geführten lamb-wellen |
| US7054762B2 (en) * | 2002-08-29 | 2006-05-30 | Dapco Industries Inc. | Method and system for analysis of ultrasonic reflections in real time |
| US7150193B2 (en) * | 2003-12-29 | 2006-12-19 | General Electric Company | Method for detection of defects in anisotropic materials |
| US20050256689A1 (en) * | 2004-05-13 | 2005-11-17 | Conceptual Assets, Inc. | Method and system for measuring attributes on a three-dimenslonal object |
| US7653235B2 (en) * | 2005-10-27 | 2010-01-26 | Honeywell International Inc. | Surface anomaly detection system and method |
-
2007
- 2007-07-21 US US11/880,450 patent/US7783433B2/en active Active
-
2008
- 2008-05-20 EP EP08156604.4A patent/EP1995592B1/de not_active Ceased
- 2008-05-21 AU AU2008202249A patent/AU2008202249A1/en not_active Abandoned
Patent Citations (1)
| Publication number | Priority date | Publication date | Assignee | Title |
|---|---|---|---|---|
| US20050163375A1 (en) * | 2004-01-23 | 2005-07-28 | Leo Grady | System and method for multi-label image segmentation |
Non-Patent Citations (3)
| Title |
|---|
| CORNWELL I ET AL: "Towards automated interpretation of ultrasonic NDT data", NDT & E INTERNATIONAL, BUTTERWORTH-HEINEMANN, OXFORD, GB, vol. 32, no. 2, 1 March 1999 (1999-03-01), pages 101 - 107, XP004292611, ISSN: 0963-8695, DOI: 10.1016/S0963-8695(98)00016-4 * |
| HEDL R ET AL: "Automated corrosion detection using ultrasound lamb waves", STRUCTURAL HEALTH MONITORING 2007: QUANTIFICATION, VALIDATION, AND IMPLEMENTATION; PROCEEDINGS OF THE 6TH INTERNATIONAL WORKSHOP ON STRUCTURAL HEALTH MONITORING, DESTECH PUBL, US, vol. 2, 1 January 2007 (2007-01-01), pages 1315 - 1323, XP009195267, ISBN: 978-1-932078-71-8 * |
| MOYSAN J ET AL: "Crack-like defect detection and sizing from image segmentation through co-occurrence matrix analysis", ULTRASONICS, IPC SCIENCE AND TECHNOLOGY PRESS LTD. GUILDFORD, GB, vol. 30, no. 6, 1 January 1992 (1992-01-01), pages 359 - 363, XP024684954, ISSN: 0041-624X, [retrieved on 19920101], DOI: 10.1016/0041-624X(92)90091-Y * |
Also Published As
| Publication number | Publication date |
|---|---|
| US7783433B2 (en) | 2010-08-24 |
| EP1995592A1 (de) | 2008-11-26 |
| US20080289423A1 (en) | 2008-11-27 |
| AU2008202249A1 (en) | 2008-12-11 |
Similar Documents
| Publication | Publication Date | Title |
|---|---|---|
| US7783433B2 (en) | Automated defect detection of corrosion or cracks using SAFT processed Lamb wave images | |
| Iakovleva et al. | Multi-mode TFM imaging with artifacts filtering using CIVA UT forwards models | |
| US7503218B2 (en) | Methods and system for ultrasound inspection | |
| Bevan et al. | Experimental quantification of noise in linear ultrasonic imaging | |
| Saini et al. | Optimisation of the half-skip total focusing method (HSTFM) parameters for sizing surface-breaking cracks | |
| Xu et al. | Ultrasonic signal enhancement for coarse grain materials by machine learning analysis | |
| Lubeigt et al. | Topological imaging in bounded elastic media | |
| CN114487115B (zh) | 一种基于Canny算子与超声平面波成像相结合的高分辨缺陷无损检测方法 | |
| Safari et al. | Assessment methodology for defect characterisation using ultrasonic arrays | |
| Yumnam et al. | Empirical mode decomposition based techniques for imaging of shallow delamination in concrete using impact echo | |
| Chandler et al. | Defect detection in the presence of geometrical artefacts | |
| Yang et al. | Ultrasonic imaging of damage in plates in spectral ripple frequency domain | |
| Osman | Automated evaluation of three dimensional ultrasonic datasets | |
| Zhang et al. | Research on delamination damage imaging of CFRP laminate based on laser ultrasonic guided waves | |
| de Oliveira et al. | Enhanced damage measurement in a metal specimen through the image fusion of tone-burst vibro-acoustography and pulse-echo ultrasound data | |
| Bazulin | TOFD echo signal processing to achieve superresolution | |
| Malkin et al. | A numerical database for ultrasonic defect characterisation using array data: robustness and accuracy | |
| Alanazi | Development of ultrasonic model-based iterative reconstruction technique for concrete structures with corroded rebars | |
| Ramuhalli et al. | Multichannel signal processing methods for ultrasonic nondestructive evaluation | |
| Gao et al. | Noise reduction method for ultrasonic TOFD image based on image registration | |
| Lopato et al. | Image and signal processing algorithms for THz imaging of composite materials | |
| Merazi Meksen et al. | A method to improve and automate flat defect detection during ultrasonic inspection | |
| JP2005331439A (ja) | 探傷信号の分析方法及び分析装置 | |
| Gorinevsky et al. | Spatio-temporal filter for structural health monitoring | |
| EP4667928A1 (de) | Systeme und verfahren zur erkennung von mikrotexturbereichen in einer probe |
Legal Events
| Date | Code | Title | Description |
|---|---|---|---|
| PUAI | Public reference made under article 153(3) epc to a published international application that has entered the european phase |
Free format text: ORIGINAL CODE: 0009012 |
|
| 17P | Request for examination filed |
Effective date: 20080520 |
|
| AK | Designated contracting states |
Kind code of ref document: A1 Designated state(s): AT BE BG CH CY CZ DE DK EE ES FI FR GB GR HR HU IE IS IT LI LT LU LV MC MT NL NO PL PT RO SE SI SK TR |
|
| AX | Request for extension of the european patent |
Extension state: AL BA MK RS |
|
| 17Q | First examination report despatched |
Effective date: 20090114 |
|
| AKX | Designation fees paid |
Designated state(s): DE FR GB |
|
| RAP1 | Party data changed (applicant data changed or rights of an application transferred) |
Owner name: HONEYWELL INTERNATIONAL INC. |
|
| GRAP | Despatch of communication of intention to grant a patent |
Free format text: ORIGINAL CODE: EPIDOSNIGR1 |
|
| INTG | Intention to grant announced |
Effective date: 20170906 |
|
| GRAS | Grant fee paid |
Free format text: ORIGINAL CODE: EPIDOSNIGR3 |
|
| GRAA | (expected) grant |
Free format text: ORIGINAL CODE: 0009210 |
|
| AK | Designated contracting states |
Kind code of ref document: B1 Designated state(s): DE FR GB |
|
| REG | Reference to a national code |
Ref country code: GB Ref legal event code: FG4D |
|
| REG | Reference to a national code |
Ref country code: DE Ref legal event code: R096 Ref document number: 602008053767 Country of ref document: DE |
|
| REG | Reference to a national code |
Ref country code: FR Ref legal event code: PLFP Year of fee payment: 11 |
|
| REG | Reference to a national code |
Ref country code: DE Ref legal event code: R097 Ref document number: 602008053767 Country of ref document: DE |
|
| PLBE | No opposition filed within time limit |
Free format text: ORIGINAL CODE: 0009261 |
|
| STAA | Information on the status of an ep patent application or granted ep patent |
Free format text: STATUS: NO OPPOSITION FILED WITHIN TIME LIMIT |
|
| 26N | No opposition filed |
Effective date: 20181018 |
|
| PGFP | Annual fee paid to national office [announced via postgrant information from national office to epo] |
Ref country code: DE Payment date: 20200529 Year of fee payment: 13 Ref country code: FR Payment date: 20200528 Year of fee payment: 13 |
|
| PGFP | Annual fee paid to national office [announced via postgrant information from national office to epo] |
Ref country code: GB Payment date: 20200528 Year of fee payment: 13 |
|
| REG | Reference to a national code |
Ref country code: DE Ref legal event code: R119 Ref document number: 602008053767 Country of ref document: DE |
|
| GBPC | Gb: european patent ceased through non-payment of renewal fee |
Effective date: 20210520 |
|
| PG25 | Lapsed in a contracting state [announced via postgrant information from national office to epo] |
Ref country code: GB Free format text: LAPSE BECAUSE OF NON-PAYMENT OF DUE FEES Effective date: 20210520 Ref country code: DE Free format text: LAPSE BECAUSE OF NON-PAYMENT OF DUE FEES Effective date: 20211201 |
|
| PG25 | Lapsed in a contracting state [announced via postgrant information from national office to epo] |
Ref country code: FR Free format text: LAPSE BECAUSE OF NON-PAYMENT OF DUE FEES Effective date: 20210531 |