EP1973022A2 - A method for accessing statistical analysis data on industrial devices - Google Patents
A method for accessing statistical analysis data on industrial devices Download PDFInfo
- Publication number
- EP1973022A2 EP1973022A2 EP08103730A EP08103730A EP1973022A2 EP 1973022 A2 EP1973022 A2 EP 1973022A2 EP 08103730 A EP08103730 A EP 08103730A EP 08103730 A EP08103730 A EP 08103730A EP 1973022 A2 EP1973022 A2 EP 1973022A2
- Authority
- EP
- European Patent Office
- Prior art keywords
- devices
- data
- statistical analysis
- statistical
- industrial
- Prior art date
- Legal status (The legal status is an assumption and is not a legal conclusion. Google has not performed a legal analysis and makes no representation as to the accuracy of the status listed.)
- Withdrawn
Links
Images


Classifications
-
- G—PHYSICS
- G05—CONTROLLING; REGULATING
- G05B—CONTROL OR REGULATING SYSTEMS IN GENERAL; FUNCTIONAL ELEMENTS OF SUCH SYSTEMS; MONITORING OR TESTING ARRANGEMENTS FOR SUCH SYSTEMS OR ELEMENTS
- G05B23/00—Testing or monitoring of control systems or parts thereof
- G05B23/02—Electric testing or monitoring
- G05B23/0205—Electric testing or monitoring by means of a monitoring system capable of detecting and responding to faults
- G05B23/0208—Electric testing or monitoring by means of a monitoring system capable of detecting and responding to faults characterized by the configuration of the monitoring system
- G05B23/0213—Modular or universal configuration of the monitoring system, e.g. monitoring system having modules that may be combined to build monitoring program; monitoring system that can be applied to legacy systems; adaptable monitoring system; using different communication protocols
-
- G—PHYSICS
- G05—CONTROLLING; REGULATING
- G05B—CONTROL OR REGULATING SYSTEMS IN GENERAL; FUNCTIONAL ELEMENTS OF SUCH SYSTEMS; MONITORING OR TESTING ARRANGEMENTS FOR SUCH SYSTEMS OR ELEMENTS
- G05B23/00—Testing or monitoring of control systems or parts thereof
- G05B23/02—Electric testing or monitoring
- G05B23/0205—Electric testing or monitoring by means of a monitoring system capable of detecting and responding to faults
- G05B23/0218—Electric testing or monitoring by means of a monitoring system capable of detecting and responding to faults characterised by the fault detection method dealing with either existing or incipient faults
- G05B23/0224—Process history based detection method, e.g. whereby history implies the availability of large amounts of data
- G05B23/0227—Qualitative history assessment, whereby the type of data acted upon, e.g. waveforms, images or patterns, is not relevant, e.g. rule based assessment; if-then decisions
- G05B23/0235—Qualitative history assessment, whereby the type of data acted upon, e.g. waveforms, images or patterns, is not relevant, e.g. rule based assessment; if-then decisions based on a comparison with predetermined threshold or range, e.g. "classical methods", carried out during normal operation; threshold adaptation or choice; when or how to compare with the threshold
-
- G—PHYSICS
- G05—CONTROLLING; REGULATING
- G05B—CONTROL OR REGULATING SYSTEMS IN GENERAL; FUNCTIONAL ELEMENTS OF SUCH SYSTEMS; MONITORING OR TESTING ARRANGEMENTS FOR SUCH SYSTEMS OR ELEMENTS
- G05B23/00—Testing or monitoring of control systems or parts thereof
- G05B23/02—Electric testing or monitoring
- G05B23/0205—Electric testing or monitoring by means of a monitoring system capable of detecting and responding to faults
- G05B23/0259—Electric testing or monitoring by means of a monitoring system capable of detecting and responding to faults characterized by the response to fault detection
- G05B23/0267—Fault communication, e.g. human machine interface [HMI]
- G05B23/0272—Presentation of monitored results, e.g. selection of status reports to be displayed; Filtering information to the user
-
- G—PHYSICS
- G05—CONTROLLING; REGULATING
- G05B—CONTROL OR REGULATING SYSTEMS IN GENERAL; FUNCTIONAL ELEMENTS OF SUCH SYSTEMS; MONITORING OR TESTING ARRANGEMENTS FOR SUCH SYSTEMS OR ELEMENTS
- G05B2219/00—Program-control systems
- G05B2219/30—Nc systems
- G05B2219/32—Operator till task planning
- G05B2219/32191—Real time statistical process monitoring
-
- Y—GENERAL TAGGING OF NEW TECHNOLOGICAL DEVELOPMENTS; GENERAL TAGGING OF CROSS-SECTIONAL TECHNOLOGIES SPANNING OVER SEVERAL SECTIONS OF THE IPC; TECHNICAL SUBJECTS COVERED BY FORMER USPC CROSS-REFERENCE ART COLLECTIONS [XRACs] AND DIGESTS
- Y02—TECHNOLOGIES OR APPLICATIONS FOR MITIGATION OR ADAPTATION AGAINST CLIMATE CHANGE
- Y02P—CLIMATE CHANGE MITIGATION TECHNOLOGIES IN THE PRODUCTION OR PROCESSING OF GOODS
- Y02P90/00—Enabling technologies with a potential contribution to greenhouse gas [GHG] emissions mitigation
- Y02P90/02—Total factory control, e.g. smart factories, flexible manufacturing systems [FMS] or integrated manufacturing systems [IMS]
Definitions
- the present invention relates to a method for accessing statistical analysis data on industrial devices, wherein the method comprises integrating statistical analysis tools into the industrial devices, generating statistical data using the integrated statistical analysis tools on the devices, presenting the statistical analysis data on devices, resulting in access to the analyzed statistical data on the devices.
- the industrial devices are robot controllers, motors, pumps and valves.
- An industrial production line system normally comprises a number of industrial devices and a number of running processes. Each such device may cause a production stop at any time. Therefore, it is of great help for engineers to get indication of the potential problem by analyzing data coming from the devices, for example by using Pareto charts.
- analyzed statistical data is either generated manually on an off-line PC, or processed in a large, central system that is not generally available to a user. Manual generation on an off-line PC is very time-consuming, and therefore it is not often done, even if it could help prevent problems and production stops in the future.
- a primary object of the present invention is to provide a method for accessing statistical data on industrial devices of an industrial production line.
- the method according to the invention results in easy access to the analyzed statistical data. Due to the fact that analyzed statistical data is generated and presented on the devices, the engineers can access the data whenever they want. Thus, the method according to the invention is of great help for the engineers to detect the potential problems and to increase up-time of the system and optimize performance.
- the industrial production line comprises a PC and one or more devices, all of them being connected to a local network
- the method comprises storing data logs on the devices, transferring the data log from the devices to the PC, generating statistical data using the integrated statistical analysis tools on the PC, presenting statistical differences between the devices on the PC according to a selected filter criterion.
- the industrial devices are robots; each robot has a control unit (robot controller) with a display unit that can be used to present information to users who can be service and maintenance engineers of the system.
- Each robot controller has its own data log storage to which the other components of a robot controller can send messages, or event data such as errors or warnings, for example.
- the robot controllers may be connected to a PC via a local network, which enables the PC to retrieve a copy of the events from the robot controllers.
- Statistical analysis tools are integrated into the controllers, or/and the PC, which generate statistical analysis data on the controllers or/and the PC, and therefore provide easy access to the generated statistical analysis data according to a selected filter criterion. Using a PC with the access to robot controllers has the additional advantage of being able to present statistical differences between the robot controllers.
- Fig. 1 shows an example of a robotized factory floor 1 comprising two industrial robots 4, 5 and a PC 2.
- Each of robots 4, 5 is connected to a control unit, or robot controller 6, 7.
- Each of robot controllers 6, 7 has a teach pendant unit 8, 9.
- the robots 4, 5 and the PC 2 are connected to a local network 3.
- each of the robot controllers 6, 7 has its own data log storage, or event log 10, 11.
- Data log 12 or 13 is stored on the data log storage 10 or 11, respectively.
- a data log 12 or 13 can be retrieved by the PC 2 via the local network 3.
- FIG. 2 shows an example of a data flow diagram for generating statistic analysis.
- a control unit in an example of the invention, comprises various system components: a robot control 16, a process control 17, and other components 18. Each such a component can be the source of events. Each event 15 is sent to the event log 19.
- a user or an operator selects filter criteria 21 and enters them to the filter 20.
- the filtered events are processed and analyzed by the integrated analysis tools, either a Pareto analysis tool 22 or a Histogram analysis tool 23, or some other tools 26.
- corresponding diagrams 24, 25 and 27 are generated for the filtered events according to the selected criteria and are presented to the user.
- desired results can be also generated and presented to the user/operator.
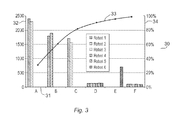
- Fig. 3 shows an example of a Pareto chart 30.
- the x-axis is used to present event type 31.
- Type A, Type B, Type C, Type D, Type E and Type F are examples of possible event types.
- Y-axis is used to present the number of occurrences 32. In this example the occurrences can be in a range of zero to 2500 times.
- the curve 33 presents an accumulated number of events as a percentage of all the events.
- the percentage scale 34 is shown on the right side of the Pareto chart.
- To make a Pareto analysis of the event log the number of times each event appears in the log is counted, the event is then sorted in descending order of occurrence, and is displayed the top N items. In this example, the top 6 robots are presented. In order to be useful, it must be possible to make the analysis on a selected subset of events. Typical selection criteria are:
- Fig. 3 also shows an example of the detailed view of a Pareto analysis if several data sources are selected.
- the detailed view shows the contribution by each source to the total, while the summary view shows only the totals.
- a detailed view as shown in Fig. 3 has the additional advantage of revealing differences between event sources. For example, it is easy to see that the three most frequently occurring events originate from only two specific paint robots, Robot 1 and Robot 2. This may draw an operator's attention. He can make a specific check on the robots 1 and 2.
Landscapes
- Engineering & Computer Science (AREA)
- Physics & Mathematics (AREA)
- General Physics & Mathematics (AREA)
- Automation & Control Theory (AREA)
- Human Computer Interaction (AREA)
- General Factory Administration (AREA)
- Management, Administration, Business Operations System, And Electronic Commerce (AREA)
Abstract
- integrating statistical analysis tools into the industrial devices,
- generating statistical data using the integrated statistical analysis tools on the devices,
- presenting the statistical analysis data on devices, resulting in access to the analyzed statistical data on the devices.
Description
- The present invention relates to a method for accessing statistical analysis data on industrial devices, wherein the method comprises integrating statistical analysis tools into the industrial devices, generating statistical data using the integrated statistical analysis tools on the devices, presenting the statistical analysis data on devices, resulting in access to the analyzed statistical data on the devices. Examples of the industrial devices are robot controllers, motors, pumps and valves.
- An industrial production line system normally comprises a number of industrial devices and a number of running processes. Each such device may cause a production stop at any time. Therefore, it is of great help for engineers to get indication of the potential problem by analyzing data coming from the devices, for example by using Pareto charts. However, today such analyzed statistical data is either generated manually on an off-line PC, or processed in a large, central system that is not generally available to a user. Manual generation on an off-line PC is very time-consuming, and therefore it is not often done, even if it could help prevent problems and production stops in the future.
- A primary object of the present invention is to provide a method for accessing statistical data on industrial devices of an industrial production line.
- This object is achieved by a method as defined in
claim 1. - integrating statistical analysis tools into the industrial devices,
- generating statistical data using the integrated statistical analysis tools on the devices,
- presenting the statistical analysis data on devices, resulting in access to the analyzed statistical data on the devices.
- The method according to the invention results in easy access to the analyzed statistical data. Due to the fact that analyzed statistical data is generated and presented on the devices, the engineers can access the data whenever they want. Thus, the method according to the invention is of great help for the engineers to detect the potential problems and to increase up-time of the system and optimize performance.
- According to an embodiment of the invention, the industrial production line comprises a PC and one or more devices, all of them being connected to a local network, wherein the method comprises storing data logs on the devices, transferring the data log from the devices to the PC, generating statistical data using the integrated statistical analysis tools on the PC, presenting statistical differences between the devices on the PC according to a selected filter criterion.
- In an embodiment of the invention, the industrial devices are robots; each robot has a control unit (robot controller) with a display unit that can be used to present information to users who can be service and maintenance engineers of the system. Each robot controller has its own data log storage to which the other components of a robot controller can send messages, or event data such as errors or warnings, for example. The robot controllers may be connected to a PC via a local network, which enables the PC to retrieve a copy of the events from the robot controllers. Statistical analysis tools are integrated into the controllers, or/and the PC, which generate statistical analysis data on the controllers or/and the PC, and therefore provide easy access to the generated statistical analysis data according to a selected filter criterion. Using a PC with the access to robot controllers has the additional advantage of being able to present statistical differences between the robot controllers.
- The invention will now be explained more closely by the description of different embodiments of the invention and with reference to the appended figures.
- Fig. 1
- shows an industrial system according to an embodiment of the invention.
- Fig. 2
- shows an example of how different statistical diagrams are generated according to selected criteria.
- Fig. 3
- shows an example of a generated statistical diagram, namely a Pareto chart.
-
Fig. 1 shows an example of a robotizedfactory floor 1 comprising twoindustrial robots PC 2. Each ofrobots robot controller 6, 7. Each ofrobot controllers 6, 7 has ateach pendant unit 8, 9. Therobots local network 3. Further, each of therobot controllers 6, 7 has its own data log storage, orevent log Data log data log storage data log local network 3. - The fundamental idea is to integrate statistical analysis tools into the industrial devices, in this example,
robot controllers 6, 7 to be able to generate thestatistical data controllers 6, 7. Thus, a statistic result can be presented on one of teachpendant units 8, 9 or aPC 2 whenever it is desired. -
Fig. 2 shows an example of a data flow diagram for generating statistic analysis. A control unit, in an example of the invention, comprises various system components: arobot control 16, aprocess control 17, andother components 18. Each such a component can be the source of events. Eachevent 15 is sent to theevent log 19. - To generate desired data, a user or an operator selects
filter criteria 21 and enters them to thefilter 20. According to the selected criteria, the filtered events are processed and analyzed by the integrated analysis tools, either a Paretoanalysis tool 22 or aHistogram analysis tool 23, or someother tools 26. As a result, corresponding diagrams 24, 25 and 27 are generated for the filtered events according to the selected criteria and are presented to the user. Of course, by integrating other statistics analysis tools, desired results can be also generated and presented to the user/operator. -
Fig. 3 shows an example of a Paretochart 30. The x-axis is used to presentevent type 31. Type A, Type B, Type C, Type D, Type E and Type F are examples of possible event types. Y-axis is used to present the number ofoccurrences 32. In this example the occurrences can be in a range of zero to 2500 times. Thecurve 33 presents an accumulated number of events as a percentage of all the events. Thepercentage scale 34 is shown on the right side of the Pareto chart. To make a Pareto analysis of the event log, the number of times each event appears in the log is counted, the event is then sorted in descending order of occurrence, and is displayed the top N items. In this example, the top 6 robots are presented. In order to be useful, it must be possible to make the analysis on a selected subset of events. Typical selection criteria are: - • Time interval
It must be possible to limit the analysis to a specific time interval. A resolution of a time frame is selected according to the type of the applications. Thus, the user needs to specify a start date and an end date. - • Severity
It must be possible to limit the analysis to include one or more severity levels only. For example, the user selects error and warning messages, but not informational messages. - • Source
It must be possible to limit the analysis to a selected subset of message sources, for example, one specific robot, two of the robots in a cell, all the robots and the programmable logic controller (PLC) in a cell. - • Message Groups or Ranges
The messages are organized and codified. For example, system messages are in the 2nnnn range, while paint messages are in the 13nnnn range, where nnnn is four digits. Preferably, message groups and ranges limit the analysis to a selection of message groups or ranges. - · Exclude Selected Messages
In some cases, specific messages occur many times in the log, but are always a consequence of one or more other messages. Such messages are not meaningful in a Pareto analysis; hence it should be possible to exclude such messages from the report. - Thanks to the fact that a
PC 2 is connected to thelocal network 3, as shown inFig. 1 , statistical differences between tworobot controllers 6 and 7 can be presented onPC 2 since it can access data on therobot controller 6 and 7. -
Fig. 3 also shows an example of the detailed view of a Pareto analysis if several data sources are selected. The detailed view shows the contribution by each source to the total, while the summary view shows only the totals. - A detailed view as shown in
Fig. 3 has the additional advantage of revealing differences between event sources. For example, it is easy to see that the three most frequently occurring events originate from only two specific paint robots,Robot 1 andRobot 2. This may draw an operator's attention. He can make a specific check on therobots
Claims (3)
- A method for accessing statistical analysis data on industrial devices of an industrial production line, wherein the method comprises:- integrating statistical analysis tools into the industrial devices,- generating statistical data using the integrated statistical analysis tools on the devices,- presenting the statistical analysis data on devices, resulting in access to the analyzed statistical data on the devices.
- A method according to claim 1, said industrial production line comprising a PC and one or more devices, all of them being connected to a local network, wherein the method comprises,- storing data logs on the devices,- transferring the data logs from the devices to the PC,- generating statistical data using the integrated statistical analysis tools on the PC,- presenting statistical differences between the devices on the PC according to a selected filter criterion.
- A method according to claim 2, wherein said industrial devices are robots, each robot having a control unit with a display unit.
Priority Applications (1)
| Application Number | Priority Date | Filing Date | Title |
|---|---|---|---|
| EP08103730A EP1973022A3 (en) | 2008-04-25 | 2008-04-25 | A method for accessing statistical analysis data on industrial devices |
Applications Claiming Priority (1)
| Application Number | Priority Date | Filing Date | Title |
|---|---|---|---|
| EP08103730A EP1973022A3 (en) | 2008-04-25 | 2008-04-25 | A method for accessing statistical analysis data on industrial devices |
Publications (2)
| Publication Number | Publication Date |
|---|---|
| EP1973022A2 true EP1973022A2 (en) | 2008-09-24 |
| EP1973022A3 EP1973022A3 (en) | 2008-10-15 |
Family
ID=39684356
Family Applications (1)
| Application Number | Title | Priority Date | Filing Date |
|---|---|---|---|
| EP08103730A Withdrawn EP1973022A3 (en) | 2008-04-25 | 2008-04-25 | A method for accessing statistical analysis data on industrial devices |
Country Status (1)
| Country | Link |
|---|---|
| EP (1) | EP1973022A3 (en) |
Family Cites Families (5)
| Publication number | Priority date | Publication date | Assignee | Title |
|---|---|---|---|---|
| US3789595A (en) * | 1971-12-20 | 1974-02-05 | Leesona Corp | Automatic control system for correcting textile machinery malfunctions from sensed and stored malfunction data |
| CN1433534A (en) * | 2000-01-29 | 2003-07-30 | Abb研究有限公司 | System and method for determining overall equipment feeectiveness of production plants, failure events and failure causes |
| US20040117050A1 (en) * | 2002-10-15 | 2004-06-17 | John Oskin | Graphical overall equipment effectiveness system & method |
| US7398423B2 (en) * | 2004-12-09 | 2008-07-08 | General Motors Corporation | System and method for providing automatic resets |
| JP2007196390A (en) * | 2006-01-23 | 2007-08-09 | Sumitomo Heavy Ind Ltd | Controller for molding machine |
-
2008
- 2008-04-25 EP EP08103730A patent/EP1973022A3/en not_active Withdrawn
Also Published As
| Publication number | Publication date |
|---|---|
| EP1973022A3 (en) | 2008-10-15 |
Similar Documents
| Publication | Publication Date | Title |
|---|---|---|
| US11726447B2 (en) | Quality review management system with configurable exception rules | |
| US10824139B2 (en) | Equipment maintenance method, equipment maintenance device, and storage medium for the same | |
| US7672811B2 (en) | System and method for production system performance prediction | |
| US10860004B2 (en) | Management system and non-transitory computer-readable recording medium | |
| CN105487458B (en) | Method and apparatus to filter process control system alarms based on alarm source type and/or alarm purpose | |
| CN105447681B (en) | Physical and chemical detection control and information management system | |
| EP1895376A2 (en) | Dynamic maintenance management system | |
| US7206834B1 (en) | Industrial controller for machine tools, robots and/or production machines | |
| US20100094676A1 (en) | Closed loop self corrective maintenance within a document processing environment | |
| CN107850889A (en) | Management system and management method | |
| Al Ayyubi et al. | Implementation of poka-yoke system to prevent human error in material preparation for industry | |
| US20120154149A1 (en) | Automated fault analysis and response system | |
| CN100428142C (en) | System and method for optimizing manufacturing processes using real time partitioned process capability analysis | |
| US10317866B2 (en) | State change management system for manufacturing cell in cell control system | |
| US20110270432A1 (en) | Scalable manufacturing assembly verification system | |
| EP3152870B1 (en) | Information retrieval system and method | |
| CN104932979A (en) | Software fault locating method and device | |
| CN117742241B (en) | Data acquisition method and system based on cloud computing | |
| Andrzejczak | Stochastic modelling of the repairable system | |
| EP1973022A2 (en) | A method for accessing statistical analysis data on industrial devices | |
| KR20210029528A (en) | Method for manufacturing process and quality control based on datamining | |
| KR20120047348A (en) | Statistical quality test and management system | |
| CN113110307B (en) | System and method for automatic commissioning of industrial equipment components | |
| CN101191932A (en) | Method and device for auxiliarily proceeding statistic process control in Liquid crystal screen production | |
| JP2017076164A (en) | Apparatus monitoring device and alert information management method |
Legal Events
| Date | Code | Title | Description |
|---|---|---|---|
| PUAI | Public reference made under article 153(3) epc to a published international application that has entered the european phase |
Free format text: ORIGINAL CODE: 0009012 |
|
| PUAL | Search report despatched |
Free format text: ORIGINAL CODE: 0009013 |
|
| AK | Designated contracting states |
Kind code of ref document: A2 Designated state(s): AT BE BG CH CY CZ DE DK EE ES FI FR GB GR HR HU IE IS IT LI LT LU LV MC MT NL NO PL PT RO SE SI SK TR |
|
| AX | Request for extension of the european patent |
Extension state: AL BA MK RS |
|
| AK | Designated contracting states |
Kind code of ref document: A3 Designated state(s): AT BE BG CH CY CZ DE DK EE ES FI FR GB GR HR HU IE IS IT LI LT LU LV MC MT NL NO PL PT RO SE SI SK TR |
|
| AX | Request for extension of the european patent |
Extension state: AL BA MK RS |
|
| RIC1 | Information provided on ipc code assigned before grant |
Ipc: G05B 19/418 20060101ALI20080909BHEP Ipc: G05B 23/02 20060101AFI20080820BHEP |
|
| AKX | Designation fees paid | ||
| REG | Reference to a national code |
Ref country code: DE Ref legal event code: 8566 |
|
| STAA | Information on the status of an ep patent application or granted ep patent |
Free format text: STATUS: THE APPLICATION IS DEEMED TO BE WITHDRAWN |
|
| 18D | Application deemed to be withdrawn |
Effective date: 20090416 |