EP1936585A1 - Verfahren und Vorrichtung zur automatischen Erkennung interessanter Gebiete auf einer digitalen Landkarte - Google Patents
Verfahren und Vorrichtung zur automatischen Erkennung interessanter Gebiete auf einer digitalen Landkarte Download PDFInfo
- Publication number
- EP1936585A1 EP1936585A1 EP06127187A EP06127187A EP1936585A1 EP 1936585 A1 EP1936585 A1 EP 1936585A1 EP 06127187 A EP06127187 A EP 06127187A EP 06127187 A EP06127187 A EP 06127187A EP 1936585 A1 EP1936585 A1 EP 1936585A1
- Authority
- EP
- European Patent Office
- Prior art keywords
- tags
- interest
- regions
- locations
- location
- Prior art date
- Legal status (The legal status is an assumption and is not a legal conclusion. Google has not performed a legal analysis and makes no representation as to the accuracy of the status listed.)
- Withdrawn
Links
Images


Classifications
-
- G—PHYSICS
- G09—EDUCATION; CRYPTOGRAPHY; DISPLAY; ADVERTISING; SEALS
- G09B—EDUCATIONAL OR DEMONSTRATION APPLIANCES; APPLIANCES FOR TEACHING, OR COMMUNICATING WITH, THE BLIND, DEAF OR MUTE; MODELS; PLANETARIA; GLOBES; MAPS; DIAGRAMS
- G09B29/00—Maps; Plans; Charts; Diagrams, e.g. route diagram
- G09B29/003—Maps
- G09B29/006—Representation of non-cartographic information on maps, e.g. population distribution, wind direction, radiation levels, air and sea routes
- G09B29/007—Representation of non-cartographic information on maps, e.g. population distribution, wind direction, radiation levels, air and sea routes using computer methods
Definitions
- the present invention relates to a method and an apparatus for automatically identifying one or more regions of interest in a digital map.
- ContextWatcher gathers context information from local sensors and remote Context Providers and uses this information for various purposes (e.g., automatic generation of daily reports on activities of users in a Weblog).
- ContextWatcher can e.g. be found in S. Böhm, et al., «ContextWatcher - Connecting to Places, People and the World», The 5th International Semantic Web Conference, November 2006 , and in Koolwaaij, et al., «Context Watcher - Sharing context information in everyday life « The 2nd IASTED International Conference on Web Technologies, Applications, and Services, July 2006 .
- the users can also mark places located in their vicinity, like e.g. a restaurant, by pinpointing to the location of the restaurant on the screen of the mobile device, and then entering the restaurant's name.
- the thus generated may then be linked to place concepts, i.e. to a concept name which is part of a descriptive taxonomy and is qualitative description of the semantic meaning of the tag.
- Fig. 1 shows a fragment of an example of such a taxonomy of place concepts defined in the application ContextWatcher.
- the user may choose a concept name which matches best with the tagged location, such as in the present example the name "restaurant”.
- Collaborative tagging of places extends the previous features as follows: It is the process by which users associate descriptive words (i.e., tags) to places in a collaborative manner.
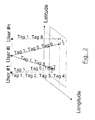
- Fig. 2 illustrates the concept of collaborative tagging of places. Basically, a tag links a place to a user whose geo-position is known or can be estimated. A place may be spread over an area of few meters (e.g., a sightseeing spot) to few kilometres (e.g., a park). This is indicated in Fig. 2 by the rectangle within which six locations are tagged by different users. In principle the same place may be tagged by several users located at different geo-positions or tagged several times by the same user at one unique location.
- Tags are metadata that have a personal and a social dimension.
- tags have a personal dimension as users can freely tag objects (e.g., places, pictures, videos) using their own vocabulary. Tags are simple tools to sort, organise, and find objects that are meaningful to the users.
- tags have a social dimension as they can serve as indicators of interest that potentially can link a community of users that share the same tag vocabulary, e.g., plane spotters.
- a tagging method is also disclosed in US-Patent Application 2005/0289469 wherein there is disclosed a method to store user-defined "context tag information" (e.g., date, proximity information, environmental information, etc.) associated with a geographic location.
- Context tag information e.g., date, proximity information, environmental information, etc.
- the context tag information or a subset of it may be accessed by other users.
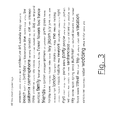
- Tag clouds provide usually a list of tags whose font size reflects its popularity among all the tags (see Fig. 3 ). Users can therefore find Web resources (e.g., photos for Flickr, Web pages for Del.icio.us, events for Upcoming.org, etc.) by selecting popular tags associated with them.
- Flickr has also introduced a tag clustering feature where popular tags have several associated clusters. For instance, for the tag Japan, 4 clusters have been identified:
- a method for automatically identifying one or more regions of interest in a digital map, whereas a plurality of individual locations in said map have been tagged with descriptive tags by different users to semantically identify the meaning of these locations comprising:
- a density estimate function allows a more complex calculation of the "tag density" as a function of the location within the search area.
- Kernel function is an efficient way of limiting the "window" which influences the intensity calculation.
- a further way of considering further influences according to their desired weight consists in the application of a weighting function.
- peaks and valleys offer a relatively simple way of determining the cluster boundaries.
- a peak may be chosen as the "center” of a cluster and the valley in the intensity distribution surrounding it forms the boundaries.
- Graphic symbols like squares, circles or triangles are suitable for more or less exactly indicating the location of a tag.
- a character string can convey some further information like information on the type of the tag.
- said graphic indication further comprises an indication of how many tags are located at the location corresponding to said graphic indication.
- search criterion was set such as to look for tags of different types, which may then be identified and distinguished by the user.
- Displaying the region of interest together with the tags provides the user with the information he desires, namely the rough (Cluster) and exact (tags) locations of the places he is interested in.
- said symbol is one of a graphic symbol or an alphanumeric character string.
- said tags belong to one or more of categories or types forming a taxonomy of possible tags; and said tags have been assigned to said locations by different users at different locations.
- the automatic notification of the user is helpful because he does not have to continuously watch the map and still will be informed if he enters a new or the desired region of interest.
- an apparatus for automatically identifying one or more regions of interest in a digital map, whereas a plurality of individual locations in said map have been tagged with descriptive tags by different users to semantically identify the meaning of these locations comprising:
- a computer program comprising program code which when being executed on a computer causes said computer to carry out a method according to one of the embodiments of the invention.
- tags of a certain kind for example tags of the type "restaurant” or nightlife” or “downtown” or the like
- tags of a certain kind for example tags of the type "restaurant” or nightlife” or “downtown” or the like
- tags of a certain kind for example tags of the type "restaurant” or nightlife” or “downtown” or the like
- tags of a certain kind for example tags of the type "restaurant” or nightlife” or “downtown” or the like
- tags of a certain kind for example tags of the type "restaurant” or nightlife” or “downtown” or the like
- the (sub-)area of the digital map within which the search should be conducted may further be a determination of the (sub-)area of the digital map within which the search should be conducted. This is useful if the map covers e.g. the whole country but the user is only interested e.g. in one city which the is selected as sub-area.
- the embodiment of the invention is then looking for an area where tags of the type "bar" are concentrating.
- tags may not only result from tagging by other users, but also predefined tags which have been assigned during set-up of the system (e.g. tags taken from existing maps identifying certain locations as "bar") may be included in the determination of the area of interest.
- the embodiment searches for an area where those tags are accumulating or grouping in the following manner.
- an area 500 (like e.g. the area of a certain city which has been selected from a map as sub-area of interest) within which one or more further sub-areas should be identified as those regions of interest within which tags of a certain type (like here the "bar" tag) are accumulating or "grouping".
- the problem to be solved may be regarded as identifying one or more "clusters" where the tags are accumulating.
- a predefined window 510 which is a sub-area of area 500 and which is used as a sliding window to move over the whole area 500 in incremental steps as shown in Fig. 5 .
- the number of tags falling within the present window is counted, and then the sliding window moves forward by a predefined incremental step to the next location. In this manner the whole area 500 will be covered, and for each location of the sliding window there is determined a number count of the occurrences of the tag "bar" within the present location of the sliding window.
- the location of the sliding window may be determined at which it contained the largest number of tags of the type "bar". This corresponds then to a searched "region of interest” where the user may assume that the "bar density" is high, and where he may expect to be successful if he looks for an area having a variety of bars to offer.
- the result may then be displayed to the user by showing on the display of the mobile device the overall area 500 and highlighted therein the sub-area 510 at the location with the highest tag number count.
- the user may determine through an interface the size and shape of the sliding window, possibly also of the incremental steps. Such a determination should then be made before the search algorithm is executed.
- a slightly more complex judgement of the region of interest may be made.
- there are chosen more than one locations of the sliding window for the region of interest e.g. those with the three or five (or any other number) highest tag number counts. If these windows overlap they may be joined together so that a shape of concatenated rectangles results as the region of interest.
- Another way would be to determine the average tag density (number of tags per area unit), and to chose those sliding window locations as regions of interest where the tag density exceeds the average number by a certain amount.
- This embodiment aims at identifying and at delimiting clusters in the 2-dimensional space which group places tagged in the same way by several users. It uses a somewhat more complex clustering algorithm to identify spatial clusters of tags.
- Spatial clusters are defined as a set of connected places tagged by a single tag (or a tag of the same type).
- a cluster has one cluster centre and a set of cluster boundaries. Some of the tagged places may not belong to any cluster (i.e. outliers).
- a weighted density estimate function is computed to determine cluster centres and cluster boundaries. Various weighting factors may be added to the density function to put more emphasis on some of the tagged places rather than others. For instance, more emphasis can be put to tags created by users having special relationships (e.g., a buddy relationship with the present user) or to tags created during a certain time interval (e.g., over the last 6 hours).
- the present embodiment makes use of a kernel density estimation method which uses a kernel function.
- the kernel density estimation method aims at detecting spatial clusters within a geographical region R. This method assumes that n events (e 1 , e 2 , ..., e n ) are observed at determined locations.
- This method applies a kernel function K ⁇ (e) used to estimate the intensity of occurrence of events I ⁇ (e) within R.
- K ⁇ (e) used to estimate the intensity of occurrence of events I ⁇ (e) within R.
- ( e - ei ) is the distance between location e for which the intensity I is to be calculated, and e i is the location e i of an event, whereas in the present example an event corresponds to a tag of the desired type occurring at location e i .
- one or more regions of interest may be determined by identifying the boundaries of one or more clusters.
- a cluster corresponds to an area where the tags of the desired type are accumulated.
- the clusters may be identified (e.g. by determining their shape and their boundaries) and may then further be visualised, e.g. by displaying their boundaries on a map.
- the cluster shape (which may be predefined or chosen by the user) is fitted to the intensity map, e.g. in such a manner that the integrated intensity within the cluster lies beyond a certain threshold.
- Another approach could be to chose those locations of the intensity map as boundaries where the intensity still lies beyond a certain percentage of the peak intensity. For the thus selected locations there may then be mad a fitting by using the selected boundary shape such as rectangle, circle or polygon.
- the resulting cluster may then be displayed on a map, whereas in this map then the tags lying within the cluster boundaries may be displayed at their specific locations.
- the proposed solution provides an infrastructure that allows them to do so in an easy manner.
- a user may make use of tags which have been defined by other users or a whole user community. Additionally, it generates overviews that provide a fresh look on existing data, causing maybe a change in behaviour, or a proud feeling because they contributed to these results.
- Tags might not only be meant to describe geographic places, but also what people do there (behaviour) and how they perceive it (experience). Hence a region derived from these types of tags might in fact be an experience or behaviour region, e.g., this is the area in the city where people mostly drink beer versus the area where they mostly drink wine or coffee. There may be identified areas tagged with behavioural labels like "culture” or “biking” or “skiing”, and all such labels may belong to the tag category or type "behaviour”.
- these regions can be visualised, both in a desktop client (like Google Earth) and/or in mobile clients (like the ContextWatcher).
- This alert mode may be combined with some filtering, like an alert being issued only if the newly entered cluster is of the type "behaviour” or of the type "culture” or of the type "sightseeing".
- there system may be used by local governments or tourism offices to get an overview of what people in their city are doing and experiencing, e.g. by checking where there are clusters of certain types of tags (e.g. "sightseeing" clusters).
- the system may also be used to issue geo-based polls, like e.g. in case of a "safety week” declared by a municipal government. In such a week users may be asked to "press 5" on your mobile device to report an unsafe spot in our city, tag it and submit it. The category of the tag in this case would be "unsafe location”. Next week the Top5 of unsafe places (the regions where unsafe spots are clustering) will be published, the week after the Top5 may be made safer by regulations and actions of the municipality.
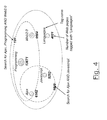
- Figure 7 shows a flow chart that describes the sequence of steps required to identify and delimit spatial clusters: a first step of Pre-processing, a second step of clustering and a third step of visualization.
- the aim of this first step is to filter out irrelevant tags (e.g., outside the area of interest, illustrated as step 700 in Fig. 7 ) and to define candidate tags that will be considered during the clustering process (illustrated as step 710 in Fig. 7 ).
- the area of interest could be a circle of adjustable radius and centred at the current geo-position of the user.
- Another possibility would be to let the users select spatial objects (e.g., District: "Munich central area", as shown in Fig. 7 ) stored in a spatial database or in a geographic information system GIS. The thus selected area will then be the area within which the search for clusters of tags will be performed to identify "sub-areas" of specific interest where the searched tag or tags are accumulating.
- the next pre-processing step 710 involves the application of one or more tag selection criteria:
- the user may define the type of tag or tags he is interested in.
- the user may impose temporal constraints (e.g., over the last week), constraints on the user space (e.g., include/exclude buddies of buddies, a buddy being a person whom the user knows and with whom he has a special relationship) or on the tag space (e.g., include popular tags whose type is 'Behaviour' and the type of associated place is 'Public_Place', as illustrated in Fig. 7 ).
- the user defines the semantic limitation of the tags within which the search to be performed by selecting a subset of tags which should be considered in the search.
- table 1 provides the list of pictures tagged by "Downtown” which have been retrieved from the Flickr public database.
- Table 1 Geotagged pictures in the photo sharing system Flickr User identifier Longitude Latitude Uploaded Date 37912374286@N01 -118.247287 34.050962 2006-06-30 37912374286@N01 -118.248848 34.055402 2006-06-30 15426458@N00 -118.245045 34.055171 2006-06-21 15426458@N00 -118.247116 34.056535 2006-06-21 15426458@N00 -118.246536 34.056179 2006-06-21 15426458@N00 -118.245858 34.056302 2006-06-21 15426458@N00 -118.247067 34.056373 2006-06-21 15426458@N00 -118.244551 34.056366 2006-06-21 15426458@N00 -118.244551 34.05
- the user has defined a geographic and semantic space within which a search for clusters is to be executed in order t identify "sub-areas" as regions of particular interest due to the clustering of tags in these regions.
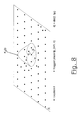
- Figure 8 shows an example of how to determine l ⁇ (l, t, user).
- l is the location where the intensity is to be determined
- t is the time
- user is the user who has generated the tag contributing to the calculation.
- tags may be weighed differently depending on the user who has generated them.
- the kernel function used may be a different kernel function, such as e.g. a Gaussian kernel.
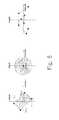
- Figure 9 shows a visualisation of the result of the intensity calculation, typically this visualisation will not be displayed to the user.
- the pins show the locations where the intensity density function is calculated.
- the circles show the locations where at least one user has put a tag.
- the numbers in one embodiment may be identifiers for tag, in another embodiment they correspond to the number of individual tags at the shown location. If these symbols correspond to the indication of locations where more than one tags are located, they are displayed at locations where within a predefined area (e.g. the grid size of the map) there are more than one tags located.
- Peak and valley thresholds can be set beforehand to restrict the number of cluster centres (i.e. peaks in the density estimate) and to detect outliers which by definition do not belong to any cluster.
- cluster boundary shapes may be chosen, rectangular, circular or polygonial.
- the accuracy of clusters is one of the critical parameters (e.g. in case of guiding users towards mobile services based on tagged areas).
- the computational time to delimit clusters may become the critical parameter.
- the process of delimiting clusters can be speeded up by identifying peaks in the density estimate and by expanding the determination of the density estimate to neighbour locations until a valley of the density estimate is detected.
- Table 3 Values of the density estimate function (Shape is rectangular) 0.796215 2.56398 2.611612 0.893556 9.80E-05 4.643384 8.323423 8.39204 4.803969 0.667596 7.446179 11.97299 12.0475 7.624443 1.812825 6.683759 10.99081 11.05612 6.834421 1.435346 2.989313 6.009737 6.050756 3.067076 0.16656
- the found clusters may be visualised to the user such that he can easily identify the searched regions of interest in the searched area. Some examples of visualisations are explained below.
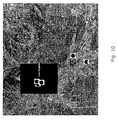
- FIG. 10 Another way of displaying the result of the clustering search is shown in Fig. 10 .
- outliers are only displayed if their number exceeds a certain threshold, e.g. single outliers are not displayed but only such outliers where there are more than one tag located.
- Fig. 11 shows still another way of displaying the result of the cluster detection.
- the shape of the cluster in Fig. 11 is polygonial, and one can see that there are three areas in the cluster where there are more than one tag at a single location (as defined e.g. by a grid with one grid cell defining a "location").
- One area is in the center of Los Angeles, and the other two are in East Los Angeles. The other two locations just have a single tag, as indicated by the number 1.
- Fig. 12 shows a further way of displaying the result of the cluster detection.
- Fig. 12 is an example where clusters for two tags have been searched, one being the tag "downtown” and the other one being the tag “chinatown”. This results in two clusters, and the two clusters actually are overlapping and a list of the tags are displayed in overlapping areas (e.g. "downtown, chinatown” in the center of San Francisco).
- the tags of the different type may be represented by different symbols, e.g. the location of the downtown tags may be represented by circles while the location of the chinatown tags may be represented by squares. However, as can be seen in Fig. 12 , the location may be identified by the same tag (circles in Fig.
- the visualisation further contains an indication of the number of tags at a certain location. This can be done by indicating the number next to the symbol, as e.g. shown by the numbers in Figures 10 and 11 , or it may be done by displaying the tag location symbols in different sizes depending on the number of tags located there. Additionally or alternatively the character strings also may be displayed in font sizes depending on the number of tags.
- a user may display in the foreground one cluster by e.g. clicking on the tag associated to that cluster.
- the user may cause the device to display the details of the tags, e.g. in form of a list with detailed information, by clicking on a symbol in the map of one of Figures 10 to 12 .
- a click may cause a zooming in to the location where multiple tags are located so that the individual tags may be more easily identified than on a large scale map as shown in Figures 10 to 12 .
Landscapes
- Engineering & Computer Science (AREA)
- Physics & Mathematics (AREA)
- Theoretical Computer Science (AREA)
- Mathematical Physics (AREA)
- Ecology (AREA)
- Life Sciences & Earth Sciences (AREA)
- General Engineering & Computer Science (AREA)
- Computer Hardware Design (AREA)
- Business, Economics & Management (AREA)
- Educational Administration (AREA)
- Educational Technology (AREA)
- General Physics & Mathematics (AREA)
- Instructional Devices (AREA)
- Information Retrieval, Db Structures And Fs Structures Therefor (AREA)
Priority Applications (2)
| Application Number | Priority Date | Filing Date | Title |
|---|---|---|---|
| EP06127187A EP1936585A1 (de) | 2006-12-23 | 2006-12-23 | Verfahren und Vorrichtung zur automatischen Erkennung interessanter Gebiete auf einer digitalen Landkarte |
| JP2007331426A JP4906705B2 (ja) | 2006-12-23 | 2007-12-25 | デジタル地図内の関心領域を自動的に特定する方法及び装置 |
Applications Claiming Priority (1)
| Application Number | Priority Date | Filing Date | Title |
|---|---|---|---|
| EP06127187A EP1936585A1 (de) | 2006-12-23 | 2006-12-23 | Verfahren und Vorrichtung zur automatischen Erkennung interessanter Gebiete auf einer digitalen Landkarte |
Publications (1)
| Publication Number | Publication Date |
|---|---|
| EP1936585A1 true EP1936585A1 (de) | 2008-06-25 |
Family
ID=38068292
Family Applications (1)
| Application Number | Title | Priority Date | Filing Date |
|---|---|---|---|
| EP06127187A Withdrawn EP1936585A1 (de) | 2006-12-23 | 2006-12-23 | Verfahren und Vorrichtung zur automatischen Erkennung interessanter Gebiete auf einer digitalen Landkarte |
Country Status (2)
| Country | Link |
|---|---|
| EP (1) | EP1936585A1 (de) |
| JP (1) | JP4906705B2 (de) |
Cited By (4)
| Publication number | Priority date | Publication date | Assignee | Title |
|---|---|---|---|---|
| WO2011163147A3 (en) * | 2010-06-23 | 2012-03-29 | Microsoft Corporation | Identifying trending content items using content item histograms |
| US8490047B2 (en) | 2009-01-15 | 2013-07-16 | Microsoft Corporation | Graphical mashup |
| EP2427727A4 (de) * | 2009-05-04 | 2015-11-04 | Tomtom North America Inc | Vorrichtung zur bestimmung von standortpunkten, kartenerstellungssystem, navigationsgerät und verfahren zur bestimmung eines standortpunktes |
| US10444954B2 (en) | 2013-11-11 | 2019-10-15 | Here Global B.V. | Distinguishable geographic area presentation |
Families Citing this family (3)
| Publication number | Priority date | Publication date | Assignee | Title |
|---|---|---|---|---|
| JP5321874B2 (ja) * | 2008-01-17 | 2013-10-23 | 富士通株式会社 | 情報処理装置、サーバ装置、およびプログラム |
| JP5437877B2 (ja) * | 2010-03-29 | 2014-03-12 | 株式会社デンソーアイティーラボラトリ | 地図表示装置、地図表示方法、およびプログラム |
| SG10201610045QA (en) * | 2012-06-01 | 2017-01-27 | Locomizer Ltd | Interest profile of a user of a mobile application |
Citations (5)
| Publication number | Priority date | Publication date | Assignee | Title |
|---|---|---|---|---|
| US20030088468A1 (en) * | 1999-05-25 | 2003-05-08 | Lapstun Paul | Mark-coded surface with function flags |
| US6580978B1 (en) * | 2002-04-15 | 2003-06-17 | United Defense, Lp | Path following using bounded beacon-aided inertial navigation |
| US20040001114A1 (en) * | 2002-06-27 | 2004-01-01 | Gil Fuchs | System and method for associating text and graphical views of map information |
| US20040261081A1 (en) * | 2003-06-20 | 2004-12-23 | Microsoft Corporation | Method and system for tracking kernel resource usage |
| US20050289469A1 (en) * | 2004-06-28 | 2005-12-29 | Chandler Roger D | Context tagging apparatus, systems, and methods |
Family Cites Families (2)
| Publication number | Priority date | Publication date | Assignee | Title |
|---|---|---|---|---|
| JP2001036840A (ja) * | 1999-07-19 | 2001-02-09 | Nippon Telegr & Teleph Corp <Ntt> | 電子地図を用いた撮影画像管理方法及び撮影画像再生方法及びそれらの装置 |
| US7353109B2 (en) * | 2004-02-05 | 2008-04-01 | Alpine Electronics, Inc. | Display method and apparatus for navigation system for performing cluster search of objects |
-
2006
- 2006-12-23 EP EP06127187A patent/EP1936585A1/de not_active Withdrawn
-
2007
- 2007-12-25 JP JP2007331426A patent/JP4906705B2/ja not_active Expired - Fee Related
Patent Citations (5)
| Publication number | Priority date | Publication date | Assignee | Title |
|---|---|---|---|---|
| US20030088468A1 (en) * | 1999-05-25 | 2003-05-08 | Lapstun Paul | Mark-coded surface with function flags |
| US6580978B1 (en) * | 2002-04-15 | 2003-06-17 | United Defense, Lp | Path following using bounded beacon-aided inertial navigation |
| US20040001114A1 (en) * | 2002-06-27 | 2004-01-01 | Gil Fuchs | System and method for associating text and graphical views of map information |
| US20040261081A1 (en) * | 2003-06-20 | 2004-12-23 | Microsoft Corporation | Method and system for tracking kernel resource usage |
| US20050289469A1 (en) * | 2004-06-28 | 2005-12-29 | Chandler Roger D | Context tagging apparatus, systems, and methods |
Cited By (4)
| Publication number | Priority date | Publication date | Assignee | Title |
|---|---|---|---|---|
| US8490047B2 (en) | 2009-01-15 | 2013-07-16 | Microsoft Corporation | Graphical mashup |
| EP2427727A4 (de) * | 2009-05-04 | 2015-11-04 | Tomtom North America Inc | Vorrichtung zur bestimmung von standortpunkten, kartenerstellungssystem, navigationsgerät und verfahren zur bestimmung eines standortpunktes |
| WO2011163147A3 (en) * | 2010-06-23 | 2012-03-29 | Microsoft Corporation | Identifying trending content items using content item histograms |
| US10444954B2 (en) | 2013-11-11 | 2019-10-15 | Here Global B.V. | Distinguishable geographic area presentation |
Also Published As
| Publication number | Publication date |
|---|---|
| JP4906705B2 (ja) | 2012-03-28 |
| JP2008158531A (ja) | 2008-07-10 |
Similar Documents
| Publication | Publication Date | Title |
|---|---|---|
| Xu et al. | Human mobility and socioeconomic status: Analysis of Singapore and Boston | |
| CN111010882B (zh) | 在基于地图的社交媒体平台上的位置隐私关联 | |
| Nakaya et al. | Visualising crime clusters in a space‐time cube: An exploratory data‐analysis approach using space‐time kernel density estimation and scan statistics | |
| Thom et al. | Spatiotemporal anomaly detection through visual analysis of geolocated twitter messages | |
| Lee et al. | Measuring geographical regularities of crowd behaviors for Twitter-based geo-social event detection | |
| Wang et al. | Understanding travellers’ preferences for different types of trip destination based on mobile internet usage data | |
| Girardin et al. | Leveraging explicitly disclosed location information to understand tourist dynamics: a case study | |
| US9369533B2 (en) | System and method for location monitoring based on organized geofeeds | |
| EP1936585A1 (de) | Verfahren und Vorrichtung zur automatischen Erkennung interessanter Gebiete auf einer digitalen Landkarte | |
| US8599203B2 (en) | Systems and methods for presenting visualizations of media access patterns | |
| US20190325000A1 (en) | Method and device for providing information based on ticket search | |
| WO2009002952A1 (en) | System and method for grouping and visualizing data | |
| CN106326371A (zh) | 服务推送方法及装置 | |
| US20160070984A1 (en) | Density sampling map labels | |
| Liu et al. | A search and summary application for traffic events detection based on twitter data | |
| US20160299639A1 (en) | User interface for providing geographically delineated content | |
| Arcaini et al. | User-driven geo-temporal density-based exploration of periodic and not periodic events reported in social networks | |
| Hiruta et al. | Detection, classification and visualization of place-triggered geotagged tweets | |
| Wu et al. | A green view index for urban transportation: How much greenery do we view while moving around in cities? | |
| WO2021164131A1 (zh) | 地图展示方法、系统、计算机设备和存储介质 | |
| Fujita | Geo-tagged Twitter collection and visualization system | |
| Girardin et al. | Uncovering the presence and movements of tourists from user-generated content | |
| Wu et al. | Mining typhoon victim information based on multi-source data fusion using social media data in China: a case study of the 2019 Super Typhoon Lekima | |
| US20090006323A1 (en) | System and Method for Analyzing Intelligence Information | |
| Onorati et al. | Tweet me and I'll help you: Mapping tweets for emergency operation centers: The case of Paris attacks |
Legal Events
| Date | Code | Title | Description |
|---|---|---|---|
| PUAI | Public reference made under article 153(3) epc to a published international application that has entered the european phase |
Free format text: ORIGINAL CODE: 0009012 |
|
| 17P | Request for examination filed |
Effective date: 20080116 |
|
| AK | Designated contracting states |
Kind code of ref document: A1 Designated state(s): AT BE BG CH CY CZ DE DK EE ES FI FR GB GR HU IE IS IT LI LT LU LV MC NL PL PT RO SE SI SK TR |
|
| AX | Request for extension of the european patent |
Extension state: AL BA HR MK RS |
|
| AKX | Designation fees paid |
Designated state(s): DE GB |
|
| 17Q | First examination report despatched |
Effective date: 20110322 |
|
| STAA | Information on the status of an ep patent application or granted ep patent |
Free format text: STATUS: THE APPLICATION IS DEEMED TO BE WITHDRAWN |
|
| 18D | Application deemed to be withdrawn |
Effective date: 20150701 |