EP1933247B1 - Biometrisches Qualitätskontrollverfahren - Google Patents
Biometrisches Qualitätskontrollverfahren Download PDFInfo
- Publication number
- EP1933247B1 EP1933247B1 EP08004915.8A EP08004915A EP1933247B1 EP 1933247 B1 EP1933247 B1 EP 1933247B1 EP 08004915 A EP08004915 A EP 08004915A EP 1933247 B1 EP1933247 B1 EP 1933247B1
- Authority
- EP
- European Patent Office
- Prior art keywords
- patient
- error
- results
- application
- data
- Prior art date
- Legal status (The legal status is an assumption and is not a legal conclusion. Google has not performed a legal analysis and makes no representation as to the accuracy of the status listed.)
- Expired - Lifetime
Links
- 238000003908 quality control method Methods 0.000 title claims description 309
- 238000000034 method Methods 0.000 title claims description 127
- 230000008569 process Effects 0.000 title claims description 66
- 238000012360 testing method Methods 0.000 claims description 361
- 238000001514 detection method Methods 0.000 claims description 25
- 230000009897 systematic effect Effects 0.000 claims description 18
- 239000003153 chemical reaction reagent Substances 0.000 description 95
- 238000012790 confirmation Methods 0.000 description 56
- 230000008859 change Effects 0.000 description 52
- 230000006870 function Effects 0.000 description 43
- 230000009471 action Effects 0.000 description 41
- 238000004088 simulation Methods 0.000 description 40
- 238000013024 troubleshooting Methods 0.000 description 38
- 239000000463 material Substances 0.000 description 35
- 239000013610 patient sample Substances 0.000 description 33
- 238000012423 maintenance Methods 0.000 description 27
- 238000009826 distribution Methods 0.000 description 26
- 238000012545 processing Methods 0.000 description 22
- 239000012491 analyte Substances 0.000 description 18
- 238000013179 statistical model Methods 0.000 description 17
- 238000004422 calculation algorithm Methods 0.000 description 16
- 230000007246 mechanism Effects 0.000 description 16
- 238000012544 monitoring process Methods 0.000 description 16
- 238000013459 approach Methods 0.000 description 14
- 238000003556 assay Methods 0.000 description 14
- 238000004886 process control Methods 0.000 description 14
- 239000011347 resin Substances 0.000 description 11
- 229920005989 resin Polymers 0.000 description 11
- 238000011067 equilibration Methods 0.000 description 10
- 239000000523 sample Substances 0.000 description 10
- 230000007423 decrease Effects 0.000 description 9
- 230000007717 exclusion Effects 0.000 description 9
- 238000005070 sampling Methods 0.000 description 9
- 238000004364 calculation method Methods 0.000 description 8
- 230000000694 effects Effects 0.000 description 8
- 238000012512 characterization method Methods 0.000 description 7
- 238000012123 point-of-care testing Methods 0.000 description 7
- 230000003442 weekly effect Effects 0.000 description 7
- 238000011088 calibration curve Methods 0.000 description 6
- 230000006854 communication Effects 0.000 description 6
- 238000004891 communication Methods 0.000 description 6
- 238000005094 computer simulation Methods 0.000 description 6
- 238000011156 evaluation Methods 0.000 description 6
- 238000012986 modification Methods 0.000 description 6
- 230000004048 modification Effects 0.000 description 6
- 238000013102 re-test Methods 0.000 description 6
- 230000002159 abnormal effect Effects 0.000 description 5
- 238000004458 analytical method Methods 0.000 description 5
- 210000004369 blood Anatomy 0.000 description 5
- 239000008280 blood Substances 0.000 description 5
- 230000002596 correlated effect Effects 0.000 description 5
- 238000013499 data model Methods 0.000 description 5
- 238000007667 floating Methods 0.000 description 5
- 101100394003 Butyrivibrio fibrisolvens end1 gene Proteins 0.000 description 4
- 238000003070 Statistical process control Methods 0.000 description 4
- 230000000052 comparative effect Effects 0.000 description 4
- 238000007726 management method Methods 0.000 description 4
- 238000004519 manufacturing process Methods 0.000 description 4
- 230000003287 optical effect Effects 0.000 description 4
- 210000002966 serum Anatomy 0.000 description 4
- 210000002700 urine Anatomy 0.000 description 4
- 238000000540 analysis of variance Methods 0.000 description 3
- 238000012863 analytical testing Methods 0.000 description 3
- 238000005311 autocorrelation function Methods 0.000 description 3
- 230000008901 benefit Effects 0.000 description 3
- 230000015271 coagulation Effects 0.000 description 3
- 238000005345 coagulation Methods 0.000 description 3
- 238000012937 correction Methods 0.000 description 3
- 230000001186 cumulative effect Effects 0.000 description 3
- 238000007418 data mining Methods 0.000 description 3
- 230000001419 dependent effect Effects 0.000 description 3
- 238000013461 design Methods 0.000 description 3
- 238000005516 engineering process Methods 0.000 description 3
- 239000012530 fluid Substances 0.000 description 3
- 230000036541 health Effects 0.000 description 3
- 230000007257 malfunction Effects 0.000 description 3
- 238000005259 measurement Methods 0.000 description 3
- 230000008520 organization Effects 0.000 description 3
- 238000013439 planning Methods 0.000 description 3
- 238000003860 storage Methods 0.000 description 3
- 230000000007 visual effect Effects 0.000 description 3
- 101100516913 Mus musculus Npat gene Proteins 0.000 description 2
- 101100516914 Xenopus laevis npat gene Proteins 0.000 description 2
- 208000020832 chronic kidney disease Diseases 0.000 description 2
- 238000013497 data interchange Methods 0.000 description 2
- 238000000502 dialysis Methods 0.000 description 2
- 201000010099 disease Diseases 0.000 description 2
- 208000037265 diseases, disorders, signs and symptoms Diseases 0.000 description 2
- 238000012553 document review Methods 0.000 description 2
- 208000028208 end stage renal disease Diseases 0.000 description 2
- 201000000523 end stage renal failure Diseases 0.000 description 2
- 238000003018 immunoassay Methods 0.000 description 2
- 230000006872 improvement Effects 0.000 description 2
- 230000002093 peripheral effect Effects 0.000 description 2
- 230000003252 repetitive effect Effects 0.000 description 2
- 230000000717 retained effect Effects 0.000 description 2
- 238000012552 review Methods 0.000 description 2
- 238000012216 screening Methods 0.000 description 2
- 239000000126 substance Substances 0.000 description 2
- 230000000153 supplemental effect Effects 0.000 description 2
- 231100000027 toxicology Toxicity 0.000 description 2
- 230000001960 triggered effect Effects 0.000 description 2
- 238000002562 urinalysis Methods 0.000 description 2
- 238000012795 verification Methods 0.000 description 2
- XLYOFNOQVPJJNP-UHFFFAOYSA-N water Substances O XLYOFNOQVPJJNP-UHFFFAOYSA-N 0.000 description 2
- 208000035473 Communicable disease Diseases 0.000 description 1
- 241000027036 Hippa Species 0.000 description 1
- 206010021703 Indifference Diseases 0.000 description 1
- 206010051602 Laziness Diseases 0.000 description 1
- 206010028980 Neoplasm Diseases 0.000 description 1
- 238000012952 Resampling Methods 0.000 description 1
- 238000002872 Statistical quality control Methods 0.000 description 1
- 238000004164 analytical calibration Methods 0.000 description 1
- 238000013474 audit trail Methods 0.000 description 1
- 230000006399 behavior Effects 0.000 description 1
- 230000007175 bidirectional communication Effects 0.000 description 1
- 230000033228 biological regulation Effects 0.000 description 1
- 201000011510 cancer Diseases 0.000 description 1
- 230000000747 cardiac effect Effects 0.000 description 1
- 239000003086 colorant Substances 0.000 description 1
- 239000000470 constituent Substances 0.000 description 1
- 238000011109 contamination Methods 0.000 description 1
- 230000001276 controlling effect Effects 0.000 description 1
- 230000000875 corresponding effect Effects 0.000 description 1
- 125000004122 cyclic group Chemical group 0.000 description 1
- 238000007405 data analysis Methods 0.000 description 1
- 238000013523 data management Methods 0.000 description 1
- 238000013503 de-identification Methods 0.000 description 1
- 238000003066 decision tree Methods 0.000 description 1
- 230000003111 delayed effect Effects 0.000 description 1
- 230000006866 deterioration Effects 0.000 description 1
- 238000011161 development Methods 0.000 description 1
- 206010012601 diabetes mellitus Diseases 0.000 description 1
- 238000003745 diagnosis Methods 0.000 description 1
- 230000004069 differentiation Effects 0.000 description 1
- 230000009977 dual effect Effects 0.000 description 1
- 238000001962 electrophoresis Methods 0.000 description 1
- 230000007613 environmental effect Effects 0.000 description 1
- 238000009472 formulation Methods 0.000 description 1
- 239000012535 impurity Substances 0.000 description 1
- 238000011534 incubation Methods 0.000 description 1
- 208000015181 infectious disease Diseases 0.000 description 1
- 230000003993 interaction Effects 0.000 description 1
- 230000002452 interceptive effect Effects 0.000 description 1
- 238000011835 investigation Methods 0.000 description 1
- 238000013178 mathematical model Methods 0.000 description 1
- 239000011159 matrix material Substances 0.000 description 1
- 230000003278 mimic effect Effects 0.000 description 1
- 239000000203 mixture Substances 0.000 description 1
- 238000010606 normalization Methods 0.000 description 1
- 230000000737 periodic effect Effects 0.000 description 1
- 238000012113 quantitative test Methods 0.000 description 1
- 230000009467 reduction Effects 0.000 description 1
- 238000007430 reference method Methods 0.000 description 1
- 230000011514 reflex Effects 0.000 description 1
- 238000009877 rendering Methods 0.000 description 1
- 230000004044 response Effects 0.000 description 1
- 238000012502 risk assessment Methods 0.000 description 1
- 238000012954 risk control Methods 0.000 description 1
- 238000005096 rolling process Methods 0.000 description 1
- 230000001932 seasonal effect Effects 0.000 description 1
- 238000010998 test method Methods 0.000 description 1
- 229940126585 therapeutic drug Drugs 0.000 description 1
- 230000001131 transforming effect Effects 0.000 description 1
- 238000010200 validation analysis Methods 0.000 description 1
Images


Classifications
-
- G—PHYSICS
- G16—INFORMATION AND COMMUNICATION TECHNOLOGY [ICT] SPECIALLY ADAPTED FOR SPECIFIC APPLICATION FIELDS
- G16H—HEALTHCARE INFORMATICS, i.e. INFORMATION AND COMMUNICATION TECHNOLOGY [ICT] SPECIALLY ADAPTED FOR THE HANDLING OR PROCESSING OF MEDICAL OR HEALTHCARE DATA
- G16H10/00—ICT specially adapted for the handling or processing of patient-related medical or healthcare data
- G16H10/40—ICT specially adapted for the handling or processing of patient-related medical or healthcare data for data related to laboratory analysis, e.g. patient specimen analysis
-
- G—PHYSICS
- G16—INFORMATION AND COMMUNICATION TECHNOLOGY [ICT] SPECIALLY ADAPTED FOR SPECIFIC APPLICATION FIELDS
- G16H—HEALTHCARE INFORMATICS, i.e. INFORMATION AND COMMUNICATION TECHNOLOGY [ICT] SPECIALLY ADAPTED FOR THE HANDLING OR PROCESSING OF MEDICAL OR HEALTHCARE DATA
- G16H40/00—ICT specially adapted for the management or administration of healthcare resources or facilities; ICT specially adapted for the management or operation of medical equipment or devices
- G16H40/20—ICT specially adapted for the management or administration of healthcare resources or facilities; ICT specially adapted for the management or operation of medical equipment or devices for the management or administration of healthcare resources or facilities, e.g. managing hospital staff or surgery rooms
Definitions
- the present invention relates generally to processes for implementing Biometric Quality Control (QC), and more particularly to systems and methods for guiding and managing laboratory analytical process control operations.
- QC Biometric Quality Control
- labs may move immediately to some form of remedy rather than troubleshooting.
- the basic premise is that the statistical control system they use creates too many unwarranted errors so they automatically assume the error flag is false.
- the quickest remedy in this environment is to get the control value within range. To do so, some labs may repeat the control in hopes that the next value will be within limits (playing the odds), repeat with fresh control product, check or repeat calibration, or make up fresh reagent.
- limited troubleshooting may be employed, including, for example, testing of assayed control materials to detect systematic error, looking at a history of control outliers, and calling the manufacturer for guidance or word of any national performance trends.
- QC error flags include random error, environmental conditions, control range too tight or incorrectly calculated, reagent (lot change, deterioration, contamination), control problems, calibration, sampling error, instrument malfunction, and poor maintenance.
- Laboratory staff typically consider troubleshooting to be complex and often unguided.
- the production atmosphere of a typical lab and limited resources may contribute to a philosophy of avoiding troubleshooting unless absolutely necessary.
- the assumption follows that if troubleshooting could be focused, guided, or deemed necessary and productive, laboratory staff would engage in the effort.
- troubleshooting far easier by, for example, providing a QC system that identifies actionable error (i.e., eliminates false error detection), providing online troubleshooting advice, providing interactive online user groups so labs can exchange information readily, basing analytical process control on medical relevance limits (where appropriate), providing an analysis of the most frequently observed errors and determining the most likely cause of the error flag, providing instrument-specific troubleshooting guides, posting control stability claims and interlabs online, providing method group statistics, providing continuing education, and providing parallel lots for troubleshooting.
- actionable error i.e., eliminates false error detection
- providing online troubleshooting advice providing interactive online user groups so labs can exchange information readily, basing analytical process control on medical relevance limits (where appropriate)
- providing an analysis of the most frequently observed errors and determining the most likely cause of the error flag providing instrument-specific troubleshooting guides, posting control stability claims and interlabs online, providing method group statistics, providing continuing education, and providing parallel lots for troubleshooting.
- Another practice characteristic that is relevant to development of a Biometric model is when and at what frequency quality control materials are tested.
- controls are predominately tested at the beginning of each batch of patient specimens, e.g., in coagulation, hematology, immunoassay, and urinalysis, with possibly a little higher frequency of random placement in toxicology and special chemistry.
- General chemistry is one department where random placement of QC materials may often occur.
- the present application describes systems and methods configured to guide and manage laboratory analytical process control operations
- the present application describes a Biometric quality control (QC) process application configured to monitor bias and imprecision for each test, characterize patient population data distributions and compare, contrast, and correlate changes in patient data distributions to any change in QC data populations.
- the Biometric QC application is also configured to provide alerts to an operator when actionable error is present and guide the operator in troubleshooting.
- Routine quality control involves the periodic testing of QC samples in order to detect an out-of-control error condition that may have occurred at any point in time.
- An accurate assessment of a routine QC strategy must account for the interplay between the size of an out-of-control error condition, the subsequent risk of producing unacceptable patient results, the frequency of QC testing, and the chance of rejecting a QC rule when it is applied.
- the Biometric QC application of the present invention considers the expected number of unacceptable patient results due to an out-of-control error condition as an important outcome measure for QC performance.
- the QC design strategy of the present invention identifies the optimal combination of frequency of QC testing, number of QCs tested, and QC rules applied in order to minimize the expected number of unacceptable patient results produced due to any out-of-control error condition that might occur.
- the Biometric QC application of the present invention monitors the analytical process using data collected from repetitive testing of quality control materials and patient data (test results). Aspects and advantageous features of the present invention will be discussed herein using various terms such as "Biometric model”, “model”, “Biometric application”, “application”, “system”, etc., and such terms are not intended to limit the invention in any manner.
- the Biometric model is the application and mathematical algorithms that underlie the processes of the present invention.
- the Biometric model of the present invention includes several new statistical models and modifications to two previously published models for monitoring both QC and patient data; EWMA (Exponentially Weighted Moving Averages) and CUSUM (Cumulative Sums). Both of these models can be applied to population means and variances. EWMA, with modifications, is the primary mechanism to monitor both routine QC data and patient population data for mean and variance. CUSUM is provided as an alternative mechanism for those users who prefer CUSUM.
- EWMA EWMA
- CUSUM patient data EWMA
- Violation of the EWMA (or CUSUM) for variance limits for routine QC constitutes a an actionable error. Operators should investigate possible sources of random error.
- Change Event is defined as any event that has potential to affect the analytical process subsequent to the event. Change events include but are not limited to activities such as calibration, change of reagent lot, and any instrument maintenance (other than daily).
- Labs should test control materials routinely, but the frequency and level (concentration) of QC to be tested for routine QC is customizable for each test. Customization is based on a novel simulation model that compares risk (e.g., defined as the number of patient test results containing unacceptable error out of the total population) to the frequency of QC testing. Both risk and QC frequency are based on the number and magnitude of actionable errors that occur for the test derived from the evaluation period, the uncertainty of measurement for each test, the estimated total error for each test, and biological variation where appropriate.
- risk e.g., defined as the number of patient test results containing unacceptable error out of the total population
- the application advantageously tracks one or more of instrument calibrations, frequency of calibration, reagent lot changes, frequency of reagent changes, maintenance of instruments. Each of these parameters can contribute to analytical error.
- the frequency of routine QC and which concentrations (levels) of control to test are derived by simulation and determined by acceptable risk.
- Control confirmation testing is required whenever a Change Event occurs. Change Events include, for example, calibration, reagent lot change, maintenance other than daily maintenance, and a notified change in a test system (e.g., new antibody or reagent reformulation)
- the application of the present invention includes several statistical process modules operating simultaneously in a dynamic analytical environment. These modules are advantageously designed to achieve optimum output afpatient test results within prescribed quality limits.
- the present application describes a system that determines an optimal patient-based quality control strategy for a laboratory based on the laboratory's patient population, analytical processes, and laboratory utilization.
- the system defines the optimal quality control strategy to be the strategy with the smallest expected number of bad results that are produced because of undesired changes in the analytical testing process.
- a patient-based quality control strategy requires specification of the patient result distribution truncation limits and the parameters for the statistical quality control rule. Therefore, the system determines values for these parameters that result in the smallest expected number of bad results. Estimation of the expected number of bad results that are produced due to an undesired change in the analytical testing process is preferably accomplished by computer simulation.
- the system typically requires 3 to 12 months of time and date-stamped patient data for each test. In one example, these data are used for three separate purposes. First, the data are used to estimate time trends in the patient results distribution. Second, the patient data are utilized in the computer simulations of the analytical testing process, rather than assuming some standard distribution for the patient data (such as the typically used normal distribution). Third, the data are used to establish truncation limits that will exclude a specified fraction (%) of each patient result distribution.
- the system recognizes that the distribution of patient data is not constant over time. Patient data vary (normal versus abnormal) during the day and between days. For example, the distribution is different on weekend days versus weekdays. The same holds true for holidays or days when certain patients, such as dialysis patients, are processed versus a normal weekday. Recognizing and allowing for hourly, daily and seasonal variations enables the system to use both normal and abnormal patient test results.
- the 3 to 12 months of time- and date-stamped patient data for each test are used to estimate time trends in the distribution of patient results throughout the 168 hours of a week by estimating a smoothed average and standard deviation of patient results for each hour of the week.
- the time-interval baseline is unique to each individual test and each individual laboratory.
- the system uses computer simulation to determine the fraction (%) of the patient-results distribution to truncate that produces the smallest expected number of bad results.
- the algorithm determines how much data should be truncated on either end of the distribution to minimize the standard deviation of the truncated population relative to the truncated sample size. Consequently, the truncation limits determined by the system are typically non-parametric.
- a mean and standard deviation are calculated for each truncated population (time-interval baseline). These statistics are used to normalize patient data.
- the system applies an exponentially weighted moving average (EWMA) quality control rule to the normalized patient data that fall within pre-determined truncation limits.
- EWMA exponentially weighted moving average
- the system uses computer simulation to determine the optimal parameters of the EWMA rule that result in the smallest expected number of bad results produced.
- the present application also describes a system that includes a testing confirmation module configured to simultaneously assess the impact of a range of potential event-related random and/or systematic out-of-control error conditions on the risk of producing bad patient results.
- the confirmation testing model typically requires that two quality specifications be specified: the maximum tolerable false rejection rate for confirmation testing and the maximum tolerable risk for producing bad results due to any possible out-of-control error condition associated with the event. These two quality specifications are used to determine the values for three parameters: the number of control samples to test at each concentration level of control material and two rejection thresholds.
- the thresholds are numerically derived to be optimal in the sense that they meet the two quality specifications using the fewest number of control samples. One threshold is used to test primarily for systematic out-of-control error conditions and the other is used to test for random out-of-control error conditions (an increase in imprecision).
- control materials are tested in multiples of the number of concentrations of materials normally tested.
- the results obtained from testing the control materials are transformed to z-scores.
- the z-scores are averaged and compared to the first threshold limit.
- the standard deviation of the z-scores is computed and compared to the second threshold limit. If neither limit is exceeded, the analytical process is assumed to be within operating specifications. If either limit is exceeded, the analytical process is assumed to be outside operating specifications, which requires identification of root cause and corrective action. Corrective action is preferably followed by another cycle of confirmation testing.
- the system may rely on input from the patient-based QC module and the confirmation testing module contained within the larger process. Based on inputs from these modules, the system recommends an appropriate, test-specific, routine QC testing strategy that produces the lowest expected number of bad patient test results due to undetected and undesired changes in the analytical process.
- the system may include an algorithm that addresses test stability/instability, imprecision, frequency of error signals over time, and risk of producing a bad result. These inputs allow the algorithm to produce a test specific routine QC strategy that specifies the appropriate frequency of testing QC materials and the number of materials to be tested at each point in the analytical process.
- the present invention provides a computer-implemented method of quality control testing for confirming that an analytical process is in control after an event has occurred.
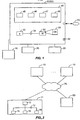
- FIG 1 illustrates a client computer system 10 configured with a Biometric QC application module 40 (also referred to herein as, for example, "Biometric QC application” or “Biometric QC module”) according to the present invention.
- Figure 2 illustrates a network arrangement for executing a shared application and/or communicating data and commands between multiple computing systems and devices according to another embodiment of the present invention.
- Client computer system 10 may operate as a stand-alone system or it may be connected to server 60 and/or other client systems 10 and devices 15 over a network 70.
- a client system 10 could include a desktop personal computer, workstation, laptop, or any other computing device capable of executing Biometric QC module 40.
- a client system 10 is configured to interface directly or indirectly with server 60, e.g., over a network 70, such as a LAN, WAN, the Internet, etc., and/or directly or indirectly with one or more other client systems 10 and devices 15, e.g., over network 70.
- Client system 10 typically runs a browsing program, such as Microsoft's Internet Explorer, Netscape Navigator, Opera or the like, allowing a user of client system 10 to access, process and view information and pages available to it from server system 60 or other server systems over Internet 70.
- Client system 10 also typically includes one or more user interface devices 30, such as a keyboard, a mouse, touchscreen, pen or the like, for interacting with a graphical user interface (GUI) provided on a display 20 (e.g., monitor screen, LCD display, etc.).
- GUI graphical user interface
- Biometric QC application module 40 executes entirely on client system 10 (e.g., stand alone), however, in some embodiments the present invention is suitable for use in networked environments, e.g., client-server, peer-peer, or multi-computer networked environments where portions of code may be executed on different portions of the network system or where data and commands (e.g., Active X control commands) are exchanged.
- networked environments e.g., client-server, peer-peer, or multi-computer networked environments where portions of code may be executed on different portions of the network system or where data and commands (e.g., Active X control commands) are exchanged.
- interconnection via a LAN is preferred, however, it should be understood that other networks can be used, such as the Internet or any intranet, extranet, virtual private network (VPN), non-TCP/IP based network, LAN or WAN or the like.
- VPN virtual private network
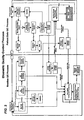
- a LAN 12 interconnects multiple devices to a client system 10.
- a network is exemplary of a laboratory or hospital environment 11 where multiple instruments are connected to a system 10 (e.g., LIS).
- LAN 12 may include wireless and wired links and nodes, and use various communication protocols as are well known.
- server 60 acts as a central computer system that executes a majority, or all, of the Biometric QC module code, and each client system 10 acts as a terminal or log-in point for a user.
- client system 10 may reside in a laboratory or a hospital environment 11 (e.g., part of a LIS) and server 60 may reside in a remote location, e.g., geographically remote.
- Biometric QC processing code is preferably executed entirely on server 60, with data and commands sent between client system 10 over network 70.
- client system 10 resides in a laboratory, client system 10 would provide the required data (e.g., patient test results/data, and other information from a local database and local instruments and devices) for processing by server 60, which would then provide processing results back to client system 10, or other computer system.
- server 60 which would then provide processing results back to client system 10, or other computer system.
- the Biometric QC application code may execute entirely on a single system or portions may execute on both systems 10 and 60 (or on multiple systems in other embodiments) as desired for computational efficiency purposes.
- a client system 10 in environment 11 may execute a portion or all of the Biometric QC processing code.
- client system 10 or server 60 and some or all of its components are operator configurable using a Biometric QC module 40, which includes computer code executable using a central processing unit 50 such as an Intel Pentium processor or the like coupled to other components over one or more busses 54 as is well known.
- a Biometric QC module 40 which includes computer code executable using a central processing unit 50 such as an Intel Pentium processor or the like coupled to other components over one or more busses 54 as is well known.
- Computer code including instructions for operating and configuring client system 10 (or server 60) to process data content, monitor and control QC processes, and render GUI images as described herein is preferably stored on a hard disk, but the entire program code, or portions thereof, may also be stored in any other volatile or non-volatile memory medium or device as is well known, such as a ROM or RAM, or provided on any media capable of storing program code, such as a compact disk (CD) medium, digital versatile disk (DVD) medium, a floppy disk, and the like.
- An appropriate media drive 42 is provided for receiving and reading documents, data and code from such a computer-readable medium.
- module 40 may be transmitted and downloaded from a software source, e.g., from server system 60 to client system 10 or from another server system or computing device to client system 10 over the Internet as is well known, or transmitted over any other conventional network connection (e.g., extranet, VPN, LAN, etc.) using any communication medium and protocols (e.g., TCP/IP, HTTP, HTTPS, Ethernet, etc.) as are well known.
- a software source e.g., from server system 60 to client system 10 or from another server system or computing device to client system 10 over the Internet as is well known
- any other conventional network connection e.g., extranet, VPN, LAN, etc.
- any communication medium and protocols e.g., TCP/IP, HTTP, HTTPS, Ethernet, etc.
- computer code for implementing aspects of the present invention can be implemented in a variety of coding languages such as C, C++, Java, Visual Basic, and others, or any scripting language, such as VBScript, JavaScript, Perl or markup languages such as XML, that can be executed on client system 10 and/or in a client server or networked arrangement.
- a variety of languages can be used in the external and internal storage of data, e.g., patient results, device and instrument information (e.g., IDs, date/time stamps, calibration information, temperature information, etc.), and other information, according to aspects of the present invention.
- Biometric QC application module 40 includes instructions for monitoring and controlling QC processes, as well as providing user interface configuration capabilities, as described herein.
- Application 40 is preferably downloaded and stored in a hard drive 52 (or other memory such as a local or attached RAM or ROM), although application module 40 can be provided on any software storage medium such as a floppy disk, CD, DVD, etc. as discussed above.
- application module 40 includes various software modules for processing data content.
- a communication interface module 47 is provided for communicating text and data to a display driver for rendering images (e.g., GUI images) on display 20, and for communicating with devices 15 and/or another computer or server system in network embodiments.
- a user interface module 48 is provided for receiving user input signals from user input device 30.
- Communication interface module 47 preferably includes a browser application, which may be the same browser as the default browser configured on client system 10, or it may be different. Alternatively, interface module 47 includes the functionality to interface with a browser application executing on client 20.
- Application module 40 also includes a truncation limits module 45 including instructions to process patient data to determine truncation limits, and a QC Confirmation testing module 46 including instructions to determine optimal QC rule(s) as will be discussed in more detail below.
- Compiled statistics e.g., device and instrument information
- patient information e.g., patient information
- QC Confirmation testing module 46 e.g., diagnostics, diagnostics, and diagnostics, diagnostics, diagnostics, and diagnostics, and diagnostics, and diagnostics, and diagnostics, and diagnostics, and the like.
- Compiled statistics e.g., device and instrument information
- patient information e.g., patient information
- database 55 which may reside in memory 52, in a memory card or other memory or storage system such as an attached storage subsystem (e.g., RAID), for retrieval by truncation limits module 45, confirmation testing module 46, and other parts of Biometric QC application module 40.
- Figure 3 illustrates a general overview of a QC process implemented by Biometric QC application 40 according to one embodiment.
- the process of Figure 3 is useful for monitoring instrument and test data and identifying the need for instrument maintenance or calibration.
- a QC model and a patient-based data model are used to quantify the reliability of the testing platform.
- the two models are based on EWMA protocols, however, CUSUM may also be used.
- routine QC testing is monitored by a single rule based on laboratory quality goals.
- a 1 ks rule e.g., 1 3s rule
- a standard Shewhart (Levey-Jennings) chart or a mean/SD rule using a normalized scale, is used.
- the patient based model allows the system to identify the source of a shift in performance of an instrument or device. Shifts in performance are a common problems in laboratories and may be based on a variety of factors including for example, an artifact of the control product, instrument malfunction and reagent impurity.
- the system generates out-of-control error flags, and if troubleshooting verifies that an error exists, corrective action takes place.
- corrective action may include calibration, maintenance, reagent change, etc.
- Corrective action constitutes an "event" that triggers a statistical model which determines what control levels need to be tested and in what quantity (i.e., how many replicates) to verify corrective action and troubleshooting was effective.
- the system also determines the frequency of quality control testing and the levels to be tested, based on, for example, unplanned maintenance, precision, bias, unplanned reagent changes, unplanned calibrations and unplanned use of fresh controls. Bias and precision for each instrument is preferably continuously monitored by the system.
- EWMA used in one embodiment to track patient data for maintenance/calibration, is also used as an error detection mechanism.
- the system is sensitized to specific patient data populations, and patient data is filtered, e.g., truncated.
- a biometric model As shown, the routine QC and patient data-based QC processes run simultaneously and in parallel.
- the biometric model requires configuration prior to use.
- parameters are set for the frequency and character (e.g., number of QC test samples) of routine QC testing for each test (e.g., analyte).
- the QC rule e.g., 1ks rule
- Another configuration step includes optimizing the QC rule (e.g., EWMA model) for monitoring data generated by routine QC testing for each test.
- the QC rule (e.g., EWMA model) is optimized for monitoring variance of data generated by routine QC testing for each test.
- Another configuration step includes establishing a patient data QC protocol for each test, e.g., by truncating time-interval patient data and determining a mean and standard deviation of the remaining data population by hour of day and day of week.
- the QC rule (e.g., EWMA) is then optimized for accepting normalized patient data to monitor the analytical process for each test.
- Another configuration step includes setting parameters for confirmation testing for each test.
- equilibration of the model is performed, e.g., by operating the model on new data for a period of time making adjustments to set parameters as appropriate.
- QC materials are routinely tested for each test as required by the model. For example, a 1ks rule is used in one aspect. If the 1ks rule test fails, patient testing is halted, a root cause is established and/or corrective action is taken. Confirmation testing is performed, and patient testing resumes if confirmation testing passes.
- an EWMA rule is also applied to the routine QC data. If the EWMA rule fails, patient testing is halted, a root cause is established and/or corrective action is taken.
- an EWMA test for variance is applied to the data. If the EWMA variance test fails, patient testing is halted, a root cause is established and/or corrective action is taken.
- patient data is normalized for each test according to the hour of day and day of week.
- An optimized EWMA model is then applied to the normalized data. If the EWMA model triggers an error signal, patient sample testing is halted and routine QC is performed as above. Whenever a defined event (e.g., change event) occurs during the course of a day, confirmation testing is performed.
- a defined event e.g., change event
- Appendix A provides and discusses additional aspects and embodiments of the present invention. It should be appreciated that the various "features” presented in Appendix A should not be taken as limiting, but rather, the various "features” as set forth in Appendix A are intended to teach and illustrate similar, additional and/or alternative aspects and embodiments to the embodiments and aspects discussed herein.
- the Biometric QC application module 40 includes a module 45 configured to determine truncation limits for a patient population.
- truncation module 45 determines truncation limits using the following general steps (which are each described in more detail below):
- Step number 4 is preferably performed before Step number 2.
- the patient results preferably contain complete days and complete weeks of data so that when the simulation "wraps," it wraps to the correct hour and the correct day of the week.
- the minimum information required includes:
- the date/time stamp associated with the time the instrument actually performed the test is provided to the system.
- the date/time stamp associated with when the test was ordered, when the sample was collected, when the sample was received in the lab, or when the result was verified may be used. If the date/time the instrument performed the test is not available, the next best date/time is the one that comes closest to approximating the correct time order the results were tested on the instrument.
- results that fail autoverification may include delayed verification times relative to results that pass autoverification, messing up the time order of the results in a way that is correlated with the magnitude of the results, thereby creating apparent time series trends that don't really exist.
- results at each end are included; that is, results would start a few hours before 12:00 AM Tuesday and end a few hours after 12:00 AM of the Tuesday that is 182 days later. This allows complete data for the first and last hour of the week when calculating patient result means and SDs by hour of the week using a moving window.
- the day of the week information is not necessary so long as the actual (calendar) date is provided.
- the minimum, maximum, and rounding factor are preferably provided to the system, however such information can typically be inferred from the patient results themselves. It is generally safer to have the laboratory provide this information for each analyte.
- patient results with a " ⁇ " are replaced with the minimum result -1*nsd, and results with a ">” are replaced with the maximum result + 1*nsd.
- the nsd can usually be inferred from patient results; however, it is safer to have the laboratory provide this information for each analyte.
- two processes are used to determine truncation limits to achieve the desired percentage of patient results that are outside truncation limits (pctout).
- methodology 2 is preferably used as the primary method, and methodology 1 is used as a "sanity check.” If the truncation limits from the two methods differ greatly, the cause should be investigated. It should be understood that each methodology may be used solely and separately. The two methodologies will now be discussed with reference to MATLAB functions and protocols, however it should be understood that other programming languages and applications may be used, for example, C, C++, Mathematica, Visual Basic, COBOL, PASCAL, FORTRAN, etc.
- truncation limits equidistant from the median of the un-truncated population are determined as follows:
- truncation limits that maximize a decrease in the standard deviation of the truncated population relative to the number of samples that are truncated are determined as follows:
- pctresout Nresout/Nres provides the percent of results outside truncation limits.
- the corresponding (tlo,thi) pair gives pctresout ⁇ pctout and the (tlo,thi) pair at the step just prior gives pctresout ⁇ pctout.
- a calculation of the patient means and standard deviations (SDs) for each hour of the week is performed as follows:
- the calculations generally provide the following output results: Nresin(hrwk) - the number of results used in the calculations for hour of the week, hrwk; avgresin(hrwk) - the average of the results within the window for the hour; SDTresin(hrwk) - the total standard deviation for the hour; SDBresin(hrwk) - the week-to-week (between-week) standard deviation for the hour; and SDWresin(hrwk) - the within-week standard deviation for the hour.
- a calculation is performed as follows for each hour of the week:
- truncation limits that minimize the worst case expected number of "bad” results produced or reported during an out-of-control error condition (ANPTE) over a wide range of error conditions.
- ANPTE out-of-control error condition
- a "bad” result is a result where the difference between the true concentration and the measured concentration exceeds the total allowable error specification (TEa).
- TEa total allowable error specification
- ANPTE should be measured by simulation. Therefore, determining analyte specific truncation limits based on worst-case ANPTE performance requires accurate simulation of the time-series characteristics of the patient results in order to calculate ANPTE for different sets of truncation limits and different magnitudes of out-of-control error conditions.
- implementing a patient-based quality control (QC) rule requires the following parameters:
- determining truncation limits when using the EWMA rule is performed as follows:
- TEa can be given as either an absolute value or a percent.
- the published Ricos limits may be used.
- a time-series bootstrap approach based on block resampling of consecutive sets of patient results over time is implemented by Biometric QC module 40 to simulate in-control, time-series patient results.
- the patient results (data) and their date/time stamps are utilized in the simulation.
- data preferably covers complete days and complete weeks and is sorted by date and time (a few extra hours of patient results at the beginning and end is generally not desired in this case).
- one "tricky” part occurs when the simulation is near the beginning or ending date of the patient data, because the simulation needs to "wrap around” from the last date/time point to the first date/time point in the database. This is why it is preferred that the database contain complete days and complete weeks of data so that when the simulation wraps around it wraps to the correct hour of the day and day of the week.
- simwin determines the points that are within the window for each of the observed values. This algorithm requires the 91-day vector of patient results with the day, hour, and minute of each result.
- the simwin function figures out 1/2 of the window width (w) for a moving window. Within the function, minnum assures that a minimum number of results in the window exist.
- the window is widened until the minimum number of results is obtained. This results in a 1 in 10 chance of sampling a particular result.
- the chances of sampling the exact same results is very small. For example, after 5 windows have been sampled, the chances of sampling the same results is approximately 10 -5 .
- the input into the function simwin are a particular value for the window width (w) and the minimum number of samples in the window (minnum).
- the output of simwin produces two variables - rb and rn, where rb is the beginning row of the window (rows are associated with a particular date and time), and rn is the number of rows in the window. Together, rb and rn determine the window that defines the rows.
- the algorithm uses a moving window of the results.
- the simulation takes actual laboratory results with date and time stamp, in order, by date and time, and figures out a window that is well defined and simulates the results but makes use of the time-distribution of the data.
- a very large number of data points can be simulated, for example, if 5,000 patient data points are used, an effective simulation of a database of 500 million data points can be performed.
- the inputs for the function nttsim are the set of patient raw data (result vector), rb, rn (where rb and m are the output from the function simwin.m), and a time pointer (timptr), which keeps track of where we are in time in the series of results.
- timptr is defined as a vector of length Nsim that contains pointers to the date and time of the simulated result (nextres), where nextres is a vector of length Nsim of the next set of simulated results.
- timptr is a vector and the number of rows it contains is the number of simulations that are being performed simultaneously. When a simulation is performed, each row is a separate trial. For example, if 10,000 simulations are desired, create a vector that contains 10,000 rows. Each row will be a separate simulation trial, so that 10,000 simulations will be performed.
- One way to populate the timptr vector is to randomly generate numbers between 1 and the number of results in the patient-result vector, populate all rows (for example 1000 rows) of the timptr vector with these random numbers, use these points as random starting points for this simulation trial, at each step, move to the next point in time (i.e., the next row in the timptr vector), and at this row, the nextres line of the nttssim.m function determines which result will be used as the next random result.
- the algorithm When the last result in the timptr vector is reached, the algorithm must loop around to the first result in the timptr vector.
- the mod of MATLAB is useful for doing this.
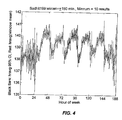
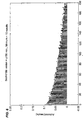
- Figure 4 shows an example of expected values for each hour of the week when a simulation has been run.
- the hourly mean of the window (shown by the red line) was kept, and the hour-to-hour curve was replaced with vertical bars that represent a 95% confidence of the hourly mean of the window.
- the red curve represents the mean of the simulation window and the vertical bars represent the actual mean of the values within the hour ⁇ 2 SD of the mean of the actual data. This provides a better sense of the number of points that went into the hourly mean of the window and provides an overview of the precision with which the hourly average was determined. This decreases apparent discrepancies between the red and blue lines when some hours have no or very few data points. If this curve is doing its job the red line should be approximately at the center of the vertical bars. It should be noted that each hour includes all the data points run within that hour over a year, so 2000 specimens/hour represents 2000 specimens/hour per year.
- the close fit of the moving window mean to the raw patient mean demonstrates that the simulation models the time-series nature of the data accurately with a winlen of 150 minutes and a minimum number of results per window of 10.
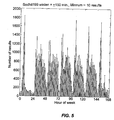
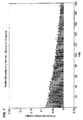
- Figure 5 shows an example of the number of results per hour.
- the population modeled should be homogeneous, instruments serving different populations (e.g., routine, stat, or ICU) should be modeled separately. Also, the purpose of performing simulations with different window lengths and minimum number of samples is to determine how to set the window lengths and minimum number of samples to obtain an optimal autocorrelation between real and simulated data. Using a minimum of 10 samples (and a ⁇ 120 min to a ⁇ 150 min window), however, should be sufficient for most labs.
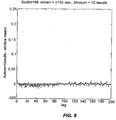
- Figure 6 and Figure 7 show example autocorrelation functions which demonstrate that the algorithm adequately represents the serial correlation in the data.
- the points at 0.09 on the y-axis represent the correlation of pairs of data formed by each result and the result immediately prior to it. (The correlation for each of these pairs is 0.09.)
- the autocorrelation function determines how much independence the results have from one another.
- results on Monday morning are more similar to one another (e.g., less independent and more correlated) than they are to results on Friday afternoon.
- Figure 7 the same number of data points contained in the original raw patient data was used for the simulated. For example, for 60K data points in the patient data, the timptr vector should be populated with 60K simulated data points.
- Figure 6 shows the autocorrelation for simulated data and demonstrates that the algorithm preserves autocorrelation observed with the raw patient data.
- Figure 8 represents an autocorrelation between the actual and simulated results. This justifies using an hour-by-hour average, because if not, only white noise is left (i.e., there is no correlation).
- Operating characteristics can be modified as more data are acquired/provided. For example, the initial operating characteristics can be set using the available lab data and when a year's data has been obtained, the operating characteristics can be re-evaluated. These operating characteristics should be stable until there is a change in the patient population. When a change in the patient population occurs, the operating characteristics should be recalculated.
- simulation of an out-of-control error condition is performed by Biometric QC application 40.
- Simulating an out-of-control error condition generally involves determining how to transform the distribution of patient results so that the mean and SD of the transformed distribution accurately manifests the out-of-control error condition.
- the fact that the patient result data used in the simulations are typically rounded may cause some problems when trying to accurately simulate an out-of-control error condition.
- a strategy is provided for creating an out-of-control result distribution to overcome the problems associated with rounding as follows:
- both negative and positive SE error conditions are preferably simulated because the non-normal distributional characteristics of the patient distributions mean that symmetrical behavior between positive and negative error conditions can't be expected.
- SE range between ⁇ 2TE a .
- RE error is preferably handled in the following way:
- the above MATLAB function sereerr (systematic error-random-error error) functions to transform the distribution of the raw patient data to simulate a particular systematic or random out-of-control situation.
- the inputs for the function sereerr include raw patient values (results vector), analytic imprecision of the method, and Sa vector.
- the Sa vector represents the analytic SD, which is the inherent analytic imprecision of the stable process for each result concentration.
- the Sa vector has the same length as the results vector and contains the analytic imprecision for every result in the results vector at the concentration of the result.
- the value in the Sa vector can be absolute or a percentage. In the case of an absolute imprecision, every value in the Sa vector would be the same. In the case of a percentage imprecision, the values in the Sa vector vary depending on the value in the results vector.
- results in the raw patient data are rounded, the function "unrounds" each value to make the simulation work well. To do this, a uniform random number, e.g., ⁇ 0.5 (the rounding width), is added to the patient results.
- the Biometric QC application module 40 includes a QC Confirmation Testing module 46 configured to determine an optimal QC rule (and associated number of QC samples) needed to confirm that the analytical process is still in control after an event has occurred.
- the optimal rule minimizes the worst case probability of producing "bad" results (pQE) because of an error condition associated with the event.
- the QC Confirmation Testing module 46 determines an optimal QC rule using the following general steps.
- Step 1- Identify a relevant performance measure
- the algorithm includes a module configured to determine an optimal QC rule (and associated number of QC samples) needed to confirm that the analytical process is still in control after an event has occurred.
- the optimal rule to be determined should minimize the worst-case probability of producing "bad" results (pQE) because of an error-condition associated with the event.
- the X /S rule is preferably used, because it has been shown that the X /S rule is the best QC rule for testing a single group of QC samples. (See, e.g., Parvin CA. New insight into the comparative power of quality-control rules that use control observations within a single analytical run. Clin Chem 1993;39:440-7 ).
- pQE probability of producing a bad result
- dpE out-of-control error condition
- ped probability of error detection
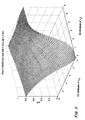
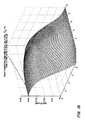
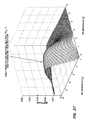
- Figures 9 and 11 show examples of the probability of error detection (ped) plotted as a function of SE and RE simultaneously, producing a surface plot that generalizes the power function to cover all combinations of systematic and random error conditions.
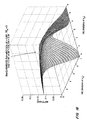
- Figure 13 shows an example of a pQE surface as a function of RE and SE.
- Step 4 Vary error limits to minimize pQE
- Figures 14 through 18 illustrate how assigning error detection ability between X and S can be used to select the QC rule to minimize the worst-case probability of "bad” results. As shown, as the X and S values vary, the relative power for detecting a shift in the away from the target value (SE) or an increase in stable analytic imprecision (RE) also varies.
- SE target value
- RE stable analytic imprecision
- Step 5 Vary rejection limits 1 to guarantee that pQE is never >5%
- X and S rejection limits are varied and the number of QC samples over a range of total allowable error specifications (TE a ) and false rejection rates (p fr ) are varied to guarantee that the pQE never exceeds 5%, regardless of the error condition. It should be appreciated that the selection of 5% for the pQE was arbitrary, and it could be smaller or larger as desired. In addition, the number of QC samples is restricted to multiples of two, which is generally the number of samples that labs run for general chemistry tests.
- Steps 1 and 2 require no further discussion at this time.
- the algorithm is preferably configured to consider out-of-control error conditions that result in a shift from target values (SE), an increase in stable analytic imprecision (RE), and/or an increase in both SE and RE.
- SE target values
- RE stable analytic imprecision
- the probability of error detection (p ed ) is plotted as a function of SE and RE simultaneously.
- This surface plot generalizes the power function to cover all the combinations of systematic and random error conditions.
- the floor defines the SE/RE combinations in multiples of the analytic SD.
- a value of 0 means that there is no systematic error (i.e., the system is in control)
- a value of 1 means a 1 SD shift from the target value, etc.
- a value of one indicates that the analytic imprecision is one multiple of the in-control imprecision
- a value of 2 indicates that the stable analytic imprecision has doubled so that it is now twice what it should be when the system is in control, etc.
- RE scale represents multiples of the SD for random error
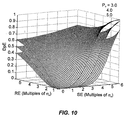
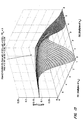
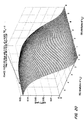
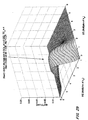
- Figure 10 shows the increase in the probability of producing a "bad” result (dpE) due to an out-of-control error condition, where a "bad” result is defined as a result with an error that exceeds total allowable error specification (TE a ), according to one embodiment.
- the probability of a "bad” result depends on the magnitude of the out-of-control error condition (SE, RE) and on the total allowable error condition.
- SE, RE out-of-control error condition
- a single X /S rule is preferably used.
- an X rejection limit of 2.43 and an S rejection limit of 3.53 are used to obtain a 1 in 1000 probability of rejection. It should be understood that other rejection limits may be used.
- z scores for each of the two QC values are created and averaged. An average z score with absolute value greater than 2.43 is a rejection.
- S value the SD of the two z scores is calculated and an SD greater than 3.53 is a rejection.
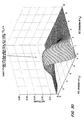
- the probability of producing "bad” results subsequent to an "event” is a function of the probability of producing "bad” results because of the error condition (see Figure 10 ) and the probability of failing to detect the error condition (see Figure 9 ).
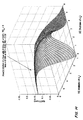
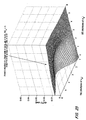
- Figure 11 shows the probability of error detection for a particular QC rule.
- the surface shown in Figure 11 generally depends on the QC rule being used to evaluate data points, the rejection limits, and the number of QC samples tested.
- Figure 12 shows the probability of producing "bad” results. This "surface” depends on the total allowable error specification (TE a ). Figure 12 shows the probability of producing "bad” results (dpE) with a total allowable error specification (TE a ) of 3. The TE a determines the surface of the plot. The surface does not depend on the rule.
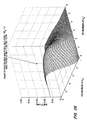
- Figure 13 shows the probability of producing "bad” results if this QC rule is used after an "event".
- Figure 13 is the product of Figures 11 and 12 . More specifically, Figure 13 shows the probability of producing "bad” results (pQE) when the QC rule Xbar(2.43)/S(3.53) is used after an "event.”
- the maximum point on the surface in Figure 13 (an arrow indicates this maximum point) is at an error condition that produces a shift of 2.04 in-control analytical SDs from target and an increase in analytical SD to 2.39 times its in-control level.
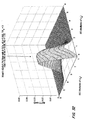
- the rejection limits of X and SD values are varied to determine the values that produce the smallest pQE.
- Figures 14 through 18 show how the pQE surface changes as the control limits for the X /S rule are varied to provide more or less error detection for SE errors versus RE errors.
- the relative power for detecting a shift in the mean or an increase in imprecision varies.
- Table 1 summarizes the conclusions drawn from Figures 14-18 .
- Figure 16 shows the rejection limits that minimize the maximum point on the surface. ( i.e ., it has the smallest peak.)
- STEP 5 DISCUSSION Figure Xbar SD Max. Peak SE RE 14 2.33 4.31 0.199 0.00 3.38 15 2.37 3.72 0.184 0.00 3.29 16 2.43 3.53 0.181 2.04 2.39 17 2.50 3.43 0.185 2.30 1.99 18 2.80 3.31 0.219 2.62 1.45
- step 4 the rejection limits are varied to determine the optimum number of QC samples to minimize the pQE.
- step 5 the X and S rejection rates and the number of QC samples are varied over a range of total allowable error specifications (TE a ) and false rejection rates (p fr ) to determine the pQE that never exceeds a desired value, e.g., 5%., regardless of the error condition.
- Figures 19 through 34 are useful for determining the optimal combinations of X and SD at different false rejections rates and total allowable error specifications.
- Figures 19-34 illustrate the number of QC samples required with the optimal combination of rejection limits for an X /S rule so that the maximum probability of producing a "bad" result after QC testing is less than or equal to 0.05 (5%) for the following false rejection rates (p f ) and total allowable error specifications (TE a ):
- Restrictions placed on the model as illustrated in Figure 19-34 include:
- the number of QC samples required after an event can be determined by varying total allowable error specifications (TE a ) and false rejection rates (p fr ). If event-related QC fails to detect the out-of-control error condition, how long the error condition will persist and, consequently, the number of bad results reported will be a function of the routine QC testing strategy and will depend on the average number of patient samples to error detection (ANP ed ). (See, e.g., Ye, Jay et. al. Performance Evaluation and Planning for Patient-Based Quality Control Procedures. Amm J Clin Pathol 2000:113:240-248 ).
- the expected number of bad results due to the event is equal to the pQE surface multiplied times the ANP ed . For example, if the ANP ed is 20 and the pQE is never allowed to exceed 5%, the expected number of bad results will never exceed 20*0.5 or 1 bad result, which is probably acceptable. However, if the ANP ed is 200, the expected number of bad results will be 10. Whether or not this is acceptable depends on factors such as the probability of this error condition occurring. For example, if the "event" is daily instrument maintenance and the p fr is 1:500, then the likelihood of a p fr associated with daily maintenance is less than once a year. Because the cost of a p fr is probably high, labs will probably want to make the p fr as small as possible. (p fr costs generally include running additional QC samples, additional maintenance, delay in reporting patient results, etc.)
- Figures 19-34 can be divided into groups of four as shown in Table 2, where:
- the system is configured so that It is also possible to set the number of QC samples tested to a continuous value. This allows N to range from 2 to any number. In one embodiment, this is done using a 2 stage testing approach: initially test 2 QC samples and depending on the values of these 2 samples either accept and assume that the testing system is okay and immediately test additional QC samples. For example, the first 2 QC samples are not accepted and 2 additional samples are immediately tested, a QC rule based on the 4 samples combined is needed. In this case, the number of QC samples tested is a random variable based on whether the first pair of QC samples is accepted or rejected. Using this strategy, it is possible to determine the smallest N that results in a pQE of, e.g., exactly .05. It is fairly common practice in the laboratory to repeat out-of-range control samples, and if the repeat controls are within range, to accept them and continue testing.
- This supplemental approach has several advantages over the mean/range ( X /S) rule. For example, it will generally provide better results, on average, than the mean range rule at detecting error when using the same number of QC samples. Additionally, it is advantageous to have the flexibility to set the number of QC samples to any number. This is particularly useful with tri-level controls where the number of QC samples are in multiples of 3.
- the laboratory provides certain pieces of information before the application is installed and configured.
- data processing is typically performed by the central application (i.e., module 40), or by peripheral software and hardware modules in conjunction with the central application.
- peripheral software and/or hardware modules may also perform the function and report results to the central application.
- the information provided by the laboratory is used to:
- the Lab Number is the primary number for identifying the laboratory and tracking performance. • 26a .
- the Lab Number is alpha numeric. • 26b.
- the Lab Number originates from the central system at QSD but can be requested and issued by subsidiaries. • 26c.
- the character of the Lab Number is designed so that lab location can be easily identified by visual means.
- the Lab Number includes labbreviation of state or country
- the application provides entry for the following information to further configure the lab number. • 27a.
- the sub-group number for the coagulation department (04) of Lab Number TX75028123 would be TX7502812304.
- 27b.1.3 If a department exists but is not listed therefore has no code number, a user (e.g., with administrative access) can modify the application to include the new listing and code number.
- 27b.1.4 Modifications to the Department Code list (name and code number) as a general release is issued at regular intervals.
- Lot number is used to identify the control product, the calibrator, and reagent.
- Equilibration includes a twelve week period in which both QC data and patient data are collected and analyzed by the Biometric model. While equilibration officially ends after twelve weeks, it may be six months to a year before the model is fully optimized for some tests.
- the purpose of the equilibration period is to collect sufficient data to recommend QC testing frequencies (routine QC) and to validate and adjust when necessary the operation of EWMA (or CUSUM) models in the laboratory setting.
- Testing of control materials yields data used to determine whether the analytical process is in control. The decision when to test control materials and which levels of control to test has always been arbitrary because the laboratory has never been given any guidance. Process control models such as Westgard make no recommendation about when to test control materials. Governments require testing of control materials at regular intervals but do not direct or guide the user about the timing of testing. Some laboratories test QC once per day at the beginning of the day and other labs will test one level of control at the beginning of a batch and another level of control at the end of the batch. Fundamentally, laboratories use no empirical or scientific basis to determine the frequency or character (i.e., which levels of control are to be tested )of QC testing.
- Biometric model is designed to provide a more rational and intelligent approach to analytical process control. It removes the uncertainty from planning a QC protocol by giving the test operator directions and guidance on when to test QC materials and which levels to test.
- the Biometric model includes a unique free-standing statistical model that assesses risk which are used to customize the day to day process control scheme. Signals (or lack of signals) from both QC and patient-based systems are used after the equilibration phase to determine the frequency and character of QC testing required for each test.
- Control-based monitoring of the analytical process in the Biometric model includes:
- Routine QC testing for each test occurs at regular intervals.
- the laboratory chooses the character and frequency of routine QC testing based on risk assessment.
- Routine QC is monitored by a 1k s rule, and confirmation testing will be in effect. Troubleshooting, corrective action and confirmation testing occurs when actionable error is identified.
- EWMA Exponentially Weighted Moving Averages
- CUSUM CUSUM is another statistical technique used to monitor for shifts and trends in data as well variance. While EWMA is the primary model for routine QC, some laboratories may prefer to use CUSUM. The application accommodates both models.
- the patient data model complements the process control model, it is the patient data model that contributes the most unique value to the overall system. Models for analytical process control currently in use by most laboratories focus on testing of control materials rather than on patient data.
- the Biometric model is unique because routine QC and patient data QC are co-dependent in one embodiment.
- the patient data model evaluates individual patient test results in a time series model alerting the test operator when a potential for error may be present in the test system.
- the model requires establishment of a time-interval baseline, a mathematical model that evaluates each patient test result as it is produced, and a decision tree for treatment of signals issued by the patient model.
- Any statistical model using patient data for analytical process control should account for the time that testing occurs (hour of the day combined with day of the week or month). It follows that multiple customized time-series baselines are required if a patient-based control system is to be both accurate and sensitive to change.
- the application accounts for criticality by calculating a truncated mean and standard deviation for each hourly time interval.
- the time interval mean can be calculated using hourly data or data collected for multiple consecutive hours.. Accounting for time-series variability will decrease statistical noise and increase error detection potential. Such customization improves analytical control performance.
- Baseline populations that contain 100% of the sample are insensitive to change because outlying abnormal (low, high) values often skew the mean and increase the standard deviation. Furthermore, patient populations that are inaccurately derived generate inaccurate comparisons.
- the peak effectiveness of a baseline patient population is directly related to the character of that population. (See, e.g., Parvin Curtis A., Ye Jay J., Ingels Stephen C, Performance Evaluation and Planning for Patient-Based Quality Control Procedures, Am J Clin Pathol 2000, vol 113, pp.240-248 ) In other words, some patient test results are considered to be appropriate for inclusion in the baseline population while other data are not. Appropriateness is determined through pre-defined truncation limits derived by simulation.
- Actionable events require evaluation, troubleshooting, confirmation testing and documentation. Actionable events include:
- Feature The system is able to recognize and characterize recurring trends in both patient data and QC data, then alert the test operator when such trends are identified.
- Instrument-specific or kit-specific troubleshooting guidance with keyword search is available online or through internet access.
- the calibration index helps distinguish error flags that are due to faulty or non-optimal calibrations.
- the temperature index can isolate incubator temperatures as the source of error when the assay incubation temperature fluctuates or changes.
- the clinical index can differentiate between a test system malfunction and a change in patient population.
- the analytical index can identify when a problem may exist with a method or reagent.
- the wavelength index focuses on the optical component of a medical device. Since many tests use the same optical filter, grouping tests by wavelength can help identify when an optical system of a medical device is malfunctioning.
- the relationship between the number of reagents used in the assay may be used to indicate when problems occur with the dispensing system.
- the POCT index is used to monitor the reliability of POCT results.
- confirmation testing module 46 The scope and character of confirmation testing is test dependent.
- a statistical model e.g., implemented by confirmation testing module 46 is used to determine the number and concentration of materials to be tested.
Landscapes
- Health & Medical Sciences (AREA)
- Engineering & Computer Science (AREA)
- Epidemiology (AREA)
- General Health & Medical Sciences (AREA)
- Medical Informatics (AREA)
- Primary Health Care (AREA)
- Public Health (AREA)
- Measurement And Recording Of Electrical Phenomena And Electrical Characteristics Of The Living Body (AREA)
- Investigating Or Analysing Biological Materials (AREA)
- Medical Treatment And Welfare Office Work (AREA)
Claims (9)
- Computerimplementiertes Verfahren zur QC-(Quality Control)-Prüfung, um zu bestätigen, dass ein Laboranalyseprozess nach dem Auftreten eines Ereignisses unter Kontrolle ist, wobei das Verfahren Folgendes beinhaltet:Bestimmen, für eine vorbestimmte QC-Regel, von Kontrollgrenzen für die Regel und einer Anzahl von nach der Regel zu prüfenden QC-Proben, gekennzeichnet durch:Variieren der Kontrollgrenzen und der Anzahl von QC-Proben über einen vorbestimmten Bereich von zulässigen Gesamtfehlerspezifikationen TEa und Falschrückweisungsraten pfr, und Berechnen der Wahrscheinlichkeit der Erzeugung schlechter Ergebnisse pQE, die einen Analysefehler enthalten, der TEa für jede Kombination von Kontrollgrenzen, Anzahl von QC-Proben, TEa und pfr übersteigt; undBestimmen einer Kombination von Kontrollgrenzen und einer Anzahl von QC-Proben für TEa und pfr, die einen maximalen pQE-Wert erzeugt, der gleich oder kleiner als ein vorbestimmter pQE-Wert ist;Prüfen des Analyseprozesses, um zu bestimmen, ob ein behebbarer Fehler vorliegt, durch Anwenden der vorbestimmten QC-Regel auf die vorbestimmte Anzahl von QC-Proben unter Anwendung der bestimmten Kontrollgrenzen für einen definierten Wert von TEa und pfr; undErzeugen eines Alarms, wenn festgestellt wird, dass ein behebbarer Fehler vorliegt.
- Verfahren nach einem vorherigen Anspruch, wobei die pQE-Werte durch Multiplizieren einer Fehlererkennungswahrscheinlichkeit ped mit der Wahrscheinlichkeit des Erzeugens eines schlechten Ergebnisses aufgrund eines Außer-Kontrolle-Fehlerzustands dpE berechnet werden.
- Verfahren nach Anspruch 2, wobei die pQE-Werte mit der Formel pQE=dpE*(1-ped) berechnet werden.
- Verfahren nach Anspruch 2 oder 3, wobei die pQE-Werte in Abhängigkeit von systematischen (SE) und zufälligen (RE) Fehlerzuständen über alle Kombinationen von SE-Werten auf einer SE-Skala und von RE-Werten auf einer RE-Skala berechnet werden.
- Verfahren nach Anspruch 4, wobei die SE-Skala eine Verschiebung von Zielwerten repräsentiert und im Bereich von 0 bis 6 liegt, wobei ein Wert von 0 bedeutet, dass es keinen systematischen Fehler gibt, und ein Wert von 1 eine Standardabweichungsverschiebung vom Zielwert von 1 bedeutet.
- Verfahren nach Anspruch 4, wobei die RE-Skala Vielfache der Standardabweichung für Zufallsfehler repräsentiert und im Bereich von 1 bis 6 liegt, wobei ein Wert von 1 anzeigt, dass die Analyseungenauigkeit ein Vielfaches der Unter-Kontrolle-Ungenauigkeit ist, und ein Wert von 2 anzeigt, dass die stabile Analyseungenauigkeit das Zweifache von dem beträgt, was er betragen sollte, wenn das System unter Kontrolle ist.
- Verfahren nach einem vorherigen Anspruch, wobei der vorbestimmte Bereich von TEa-Werten 3, 4, 5 und 6 umfasst.
- Verfahren nach einem vorherigen Anspruch, wobei der vorbestimmte Bereich von pfr-Werten 0,01, 0,005, 0,002 und 0,001 umfasst.
- Verfahren nach einem vorherigen Anspruch, wobei der vorbestimmte pQE-Wert 5 % ist.
Applications Claiming Priority (2)
| Application Number | Priority Date | Filing Date | Title |
|---|---|---|---|
| US31492301P | 2001-08-24 | 2001-08-24 | |
| EP02753539A EP1428021A4 (de) | 2001-08-24 | 2002-08-23 | Biometrisches qualtiätskontrollverfahren |
Related Parent Applications (1)
| Application Number | Title | Priority Date | Filing Date |
|---|---|---|---|
| EP02753539A Division EP1428021A4 (de) | 2001-08-24 | 2002-08-23 | Biometrisches qualtiätskontrollverfahren |
Publications (3)
| Publication Number | Publication Date |
|---|---|
| EP1933247A2 EP1933247A2 (de) | 2008-06-18 |
| EP1933247A3 EP1933247A3 (de) | 2008-09-03 |
| EP1933247B1 true EP1933247B1 (de) | 2016-10-05 |
Family
ID=39399152
Family Applications (1)
| Application Number | Title | Priority Date | Filing Date |
|---|---|---|---|
| EP08004915.8A Expired - Lifetime EP1933247B1 (de) | 2001-08-24 | 2002-08-23 | Biometrisches Qualitätskontrollverfahren |
Country Status (1)
| Country | Link |
|---|---|
| EP (1) | EP1933247B1 (de) |
Families Citing this family (1)
| Publication number | Priority date | Publication date | Assignee | Title |
|---|---|---|---|---|
| CN117129698B (zh) * | 2023-10-26 | 2024-01-23 | 北京众驰伟业科技发展有限公司 | 全自动凝血测试仪的异常报警与重测系统及方法 |
Family Cites Families (3)
| Publication number | Priority date | Publication date | Assignee | Title |
|---|---|---|---|---|
| US5937364A (en) * | 1996-05-07 | 1999-08-10 | Westgard Quality Corporation | Automatic selection of statistical quality control procedures |
| US6269276B1 (en) * | 1998-03-31 | 2001-07-31 | Roche Diagnostics Corporation | Multi-rule quality control method and apparatus |
| US6292761B1 (en) * | 1998-09-02 | 2001-09-18 | William Franklin Hancock, Jr. | Methods and apparatus for interpreting measured laboratory data |
-
2002
- 2002-08-23 EP EP08004915.8A patent/EP1933247B1/de not_active Expired - Lifetime
Also Published As
| Publication number | Publication date |
|---|---|
| EP1933247A2 (de) | 2008-06-18 |
| EP1933247A3 (de) | 2008-09-03 |
Similar Documents
| Publication | Publication Date | Title |
|---|---|---|
| US7299153B2 (en) | Biometric quality control process | |
| US8099257B2 (en) | Biometric quality control process | |
| AU2002313818A1 (en) | Biometric quality control process | |
| US8059001B2 (en) | System and method for automatic quality control of clinical diagnostic processes | |
| Ruppert et al. | ICU delirium-prediction models: a systematic review | |
| Loh et al. | Recommendations for laboratory informatics specifications needed for the application of patient-based real time quality control | |
| US20120253840A1 (en) | System and methods for estimating hba1c, treatment response, and hypoglycemia risk using self-monitoring of blood glucose data | |
| CN111406294A (zh) | 自动生成用于实验室仪器的规则 | |
| Chou et al. | Hospital occupancy and its effect on emergency department evaluation | |
| EP1933247B1 (de) | Biometrisches Qualitätskontrollverfahren | |
| US10943675B2 (en) | Altering patient care based on long term SDD | |
| Wright et al. | A multi-site randomized trial of a clinical decision support intervention to improve problem list completeness | |
| Getzen et al. | Leveraging informative missing data to learn about acute respiratory distress syndrome and mortality in long-term hospitalized COVID-19 patients throughout the years of the pandemic | |
| Loh et al. | Delta checks | |
| Wells et al. | Using electronic health records for the learning health system: creation of a diabetes research registry | |
| KR102619409B1 (ko) | 검사 제어 장치, 방법 및 기록매체 | |
| Smerek | Assessing Data Quality for Healthcare Systems Data Used in Clinical Research (Version 1.0) | |
| Tabak | Using Electronic Health Records Data for Mortality Predictive Model Development: Study Concept Development and Data Preparation Process | |
| Smerek | Assessi g Data Quality for Healthcare “yste s Data Used i Cli ical Research Versio. | |
| Leaven | A Mathematical Modeling Framework for Phlebotomist Scheduling and Blood Draw Assignments in Laboratory Medicine |
Legal Events
| Date | Code | Title | Description |
|---|---|---|---|
| PUAI | Public reference made under article 153(3) epc to a published international application that has entered the european phase |
Free format text: ORIGINAL CODE: 0009012 |
|
| AC | Divisional application: reference to earlier application |
Ref document number: 1428021 Country of ref document: EP Kind code of ref document: P |
|
| AK | Designated contracting states |
Kind code of ref document: A2 Designated state(s): DE FR GB IT |
|
| PUAL | Search report despatched |
Free format text: ORIGINAL CODE: 0009013 |
|
| RIN1 | Information on inventor provided before grant (corrected) |
Inventor name: COOPER, GREG Inventor name: CEMBROWSKI, GEORGE Inventor name: PARVIN, CURTIS |
|
| AK | Designated contracting states |
Kind code of ref document: A3 Designated state(s): DE FR GB IT |
|
| 17P | Request for examination filed |
Effective date: 20090302 |
|
| 17Q | First examination report despatched |
Effective date: 20090401 |
|
| AKX | Designation fees paid |
Designated state(s): DE FR GB IT |
|
| GRAP | Despatch of communication of intention to grant a patent |
Free format text: ORIGINAL CODE: EPIDOSNIGR1 |
|
| INTG | Intention to grant announced |
Effective date: 20160311 |
|
| GRAS | Grant fee paid |
Free format text: ORIGINAL CODE: EPIDOSNIGR3 |
|
| GRAA | (expected) grant |
Free format text: ORIGINAL CODE: 0009210 |
|
| AC | Divisional application: reference to earlier application |
Ref document number: 1428021 Country of ref document: EP Kind code of ref document: P |
|
| AK | Designated contracting states |
Kind code of ref document: B1 Designated state(s): DE FR GB IT |
|
| REG | Reference to a national code |
Ref country code: GB Ref legal event code: FG4D |
|
| REG | Reference to a national code |
Ref country code: DE Ref legal event code: R096 Ref document number: 60248397 Country of ref document: DE |
|
| REG | Reference to a national code |
Ref country code: DE Ref legal event code: R097 Ref document number: 60248397 Country of ref document: DE |
|
| PLBE | No opposition filed within time limit |
Free format text: ORIGINAL CODE: 0009261 |
|
| STAA | Information on the status of an ep patent application or granted ep patent |
Free format text: STATUS: NO OPPOSITION FILED WITHIN TIME LIMIT |
|
| REG | Reference to a national code |
Ref country code: FR Ref legal event code: PLFP Year of fee payment: 16 |
|
| PG25 | Lapsed in a contracting state [announced via postgrant information from national office to epo] |
Ref country code: IT Free format text: LAPSE BECAUSE OF FAILURE TO SUBMIT A TRANSLATION OF THE DESCRIPTION OR TO PAY THE FEE WITHIN THE PRESCRIBED TIME-LIMIT Effective date: 20161005 |
|
| 26N | No opposition filed |
Effective date: 20170706 |
|
| REG | Reference to a national code |
Ref country code: FR Ref legal event code: PLFP Year of fee payment: 17 |
|
| REG | Reference to a national code |
Ref country code: DE Ref legal event code: R079 Ref document number: 60248397 Country of ref document: DE Free format text: PREVIOUS MAIN CLASS: G06F0019000000 Ipc: G16Z0099000000 |
|
| REG | Reference to a national code |
Ref country code: DE Ref legal event code: R082 Ref document number: 60248397 Country of ref document: DE Representative=s name: MAUCHER JENKINS PATENTANWAELTE & RECHTSANWAELT, DE |
|
| PGFP | Annual fee paid to national office [announced via postgrant information from national office to epo] |
Ref country code: FR Payment date: 20210830 Year of fee payment: 20 |
|
| PGFP | Annual fee paid to national office [announced via postgrant information from national office to epo] |
Ref country code: GB Payment date: 20210826 Year of fee payment: 20 |
|
| PGFP | Annual fee paid to national office [announced via postgrant information from national office to epo] |
Ref country code: DE Payment date: 20211027 Year of fee payment: 20 |
|
| REG | Reference to a national code |
Ref country code: DE Ref legal event code: R071 Ref document number: 60248397 Country of ref document: DE |
|
| REG | Reference to a national code |
Ref country code: GB Ref legal event code: PE20 Expiry date: 20220822 |
|
| PG25 | Lapsed in a contracting state [announced via postgrant information from national office to epo] |
Ref country code: GB Free format text: LAPSE BECAUSE OF EXPIRATION OF PROTECTION Effective date: 20220822 |
|
| P01 | Opt-out of the competence of the unified patent court (upc) registered |
Effective date: 20230412 |