EP1886131B1 - Method and ultrasonic meter system for determining pipe roughness - Google Patents
Method and ultrasonic meter system for determining pipe roughness Download PDFInfo
- Publication number
- EP1886131B1 EP1886131B1 EP06759872.2A EP06759872A EP1886131B1 EP 1886131 B1 EP1886131 B1 EP 1886131B1 EP 06759872 A EP06759872 A EP 06759872A EP 1886131 B1 EP1886131 B1 EP 1886131B1
- Authority
- EP
- European Patent Office
- Prior art keywords
- transducer
- flow
- spool piece
- fluids
- diagnostic data
- Prior art date
- Legal status (The legal status is an assumption and is not a legal conclusion. Google has not performed a legal analysis and makes no representation as to the accuracy of the status listed.)
- Active
Links
- 238000000034 method Methods 0.000 title claims description 24
- 239000012530 fluid Substances 0.000 claims description 52
- 238000011144 upstream manufacturing Methods 0.000 claims description 36
- 230000001419 dependent effect Effects 0.000 claims description 2
- 238000012544 monitoring process Methods 0.000 claims 3
- 238000005259 measurement Methods 0.000 description 5
- 239000007789 gas Substances 0.000 description 4
- 238000012423 maintenance Methods 0.000 description 3
- 238000010586 diagram Methods 0.000 description 2
- 239000007788 liquid Substances 0.000 description 2
- 238000012986 modification Methods 0.000 description 2
- 230000004048 modification Effects 0.000 description 2
- 239000004215 Carbon black (E152) Substances 0.000 description 1
- 230000001154 acute effect Effects 0.000 description 1
- 230000007797 corrosion Effects 0.000 description 1
- 238000005260 corrosion Methods 0.000 description 1
- 230000007812 deficiency Effects 0.000 description 1
- 230000008021 deposition Effects 0.000 description 1
- 230000003628 erosive effect Effects 0.000 description 1
- 229930195733 hydrocarbon Natural products 0.000 description 1
- 150000002430 hydrocarbons Chemical class 0.000 description 1
- 238000004519 manufacturing process Methods 0.000 description 1
- 238000005457 optimization Methods 0.000 description 1
- 230000000644 propagated effect Effects 0.000 description 1
- 239000007787 solid Substances 0.000 description 1
- 239000013598 vector Substances 0.000 description 1
Images


Classifications
-
- G—PHYSICS
- G01—MEASURING; TESTING
- G01F—MEASURING VOLUME, VOLUME FLOW, MASS FLOW OR LIQUID LEVEL; METERING BY VOLUME
- G01F1/00—Measuring the volume flow or mass flow of fluid or fluent solid material wherein the fluid passes through a meter in a continuous flow
- G01F1/66—Measuring the volume flow or mass flow of fluid or fluent solid material wherein the fluid passes through a meter in a continuous flow by measuring frequency, phase shift or propagation time of electromagnetic or other waves, e.g. using ultrasonic flowmeters
- G01F1/667—Arrangements of transducers for ultrasonic flowmeters; Circuits for operating ultrasonic flowmeters
-
- G—PHYSICS
- G01—MEASURING; TESTING
- G01F—MEASURING VOLUME, VOLUME FLOW, MASS FLOW OR LIQUID LEVEL; METERING BY VOLUME
- G01F1/00—Measuring the volume flow or mass flow of fluid or fluent solid material wherein the fluid passes through a meter in a continuous flow
- G01F1/66—Measuring the volume flow or mass flow of fluid or fluent solid material wherein the fluid passes through a meter in a continuous flow by measuring frequency, phase shift or propagation time of electromagnetic or other waves, e.g. using ultrasonic flowmeters
-
- G—PHYSICS
- G01—MEASURING; TESTING
- G01F—MEASURING VOLUME, VOLUME FLOW, MASS FLOW OR LIQUID LEVEL; METERING BY VOLUME
- G01F25/00—Testing or calibration of apparatus for measuring volume, volume flow or liquid level or for metering by volume
- G01F25/10—Testing or calibration of apparatus for measuring volume, volume flow or liquid level or for metering by volume of flowmeters
-
- G—PHYSICS
- G01—MEASURING; TESTING
- G01N—INVESTIGATING OR ANALYSING MATERIALS BY DETERMINING THEIR CHEMICAL OR PHYSICAL PROPERTIES
- G01N29/00—Investigating or analysing materials by the use of ultrasonic, sonic or infrasonic waves; Visualisation of the interior of objects by transmitting ultrasonic or sonic waves through the object
- G01N29/02—Analysing fluids
- G01N29/024—Analysing fluids by measuring propagation velocity or propagation time of acoustic waves
-
- G—PHYSICS
- G01—MEASURING; TESTING
- G01N—INVESTIGATING OR ANALYSING MATERIALS BY DETERMINING THEIR CHEMICAL OR PHYSICAL PROPERTIES
- G01N29/00—Investigating or analysing materials by the use of ultrasonic, sonic or infrasonic waves; Visualisation of the interior of objects by transmitting ultrasonic or sonic waves through the object
- G01N29/22—Details, e.g. general constructional or apparatus details
- G01N29/222—Constructional or flow details for analysing fluids
-
- G—PHYSICS
- G01—MEASURING; TESTING
- G01N—INVESTIGATING OR ANALYSING MATERIALS BY DETERMINING THEIR CHEMICAL OR PHYSICAL PROPERTIES
- G01N29/00—Investigating or analysing materials by the use of ultrasonic, sonic or infrasonic waves; Visualisation of the interior of objects by transmitting ultrasonic or sonic waves through the object
- G01N29/44—Processing the detected response signal, e.g. electronic circuits specially adapted therefor
- G01N29/4463—Signal correction, e.g. distance amplitude correction [DAC], distance gain size [DGS], noise filtering
-
- G—PHYSICS
- G01—MEASURING; TESTING
- G01N—INVESTIGATING OR ANALYSING MATERIALS BY DETERMINING THEIR CHEMICAL OR PHYSICAL PROPERTIES
- G01N2291/00—Indexing codes associated with group G01N29/00
- G01N2291/02—Indexing codes associated with the analysed material
- G01N2291/021—Gases
- G01N2291/0215—Mixtures of three or more gases, e.g. air
-
- G—PHYSICS
- G01—MEASURING; TESTING
- G01N—INVESTIGATING OR ANALYSING MATERIALS BY DETERMINING THEIR CHEMICAL OR PHYSICAL PROPERTIES
- G01N2291/00—Indexing codes associated with group G01N29/00
- G01N2291/02—Indexing codes associated with the analysed material
- G01N2291/028—Material parameters
- G01N2291/02836—Flow rate, liquid level
-
- G—PHYSICS
- G01—MEASURING; TESTING
- G01N—INVESTIGATING OR ANALYSING MATERIALS BY DETERMINING THEIR CHEMICAL OR PHYSICAL PROPERTIES
- G01N2291/00—Indexing codes associated with group G01N29/00
- G01N2291/26—Scanned objects
- G01N2291/263—Surfaces
- G01N2291/2634—Surfaces cylindrical from outside
Definitions
- Ultrasonic flow meters are a class of flow meters that determine volumetric flow of a fluid within a conduit using ultrasonic signals propagated through the fluid.
- Ultrasonic flow meters offer an advantage of generating an abundance of diagnostic data that may reveal potential problems in the performance of the meter.
- shifts in the diagnostic data have been difficult to interpret because the data is most often reviewed after either new meter calibration or field failures of the meter.
- Industry practice calls for fixed routine maintenance and mandatory recalibration intervals of flow meters. Such a maintenance and recalibration schedule may be expensive and time-consuming.
- it is performed on a fixed interval it is uncertain whether the meter actually requires such work to be performed.
- the abundance of diagnostic data provided by the flow meter is not being used efficiently.
- Zanker K J "Diagnostic ability of the Daniel Four-Path UL Ultrasonic Flow meter" 2nd International South Eaust Asian Hydrocarbon Flow measurement workshop; 25-28 March 2003 discloses an ultrasonic meter in which four chordal velocities give an indication of the velocity profile in the meter, established by the flow through the upstream pipe work. An asymmetry ratio, a cross flow ratio and a swirl ratio are used to obtain an indication of pipe roughness.
- ultrasonic meters comprising a spool piece that couples within a flow of fluids, and a first transducer pair mechanically mounted to the spool piece and acoustically coupled to the flow of fluids (wherein the first transducer pair comprises an upstream transducer and a downstream transducer in operational relationship to the upstream transducer and defines a first chord there between).
- the ultrasonic meter is configured to determine diagnostic data based on acoustic signals transmitted between the first transducer pair (wherein the diagnostic data comprises an asymmetry of the flow of fluids in the spool piece, a cross flow of the flow of fluids in the spool piece, and a profile factor of the flow of fluids in the spool piece).
- the ultrasonic meter is configured to determine changes in the roughness of a pipe mechanically coupled to the ultrasonic meter based on a trend of the diagnostic data (wherein the trend comprises a substantially constant value of about unity for both the asymmetry and the cross flow and a substantially changing value for the profile factor).
- Other illustrative embodiments are methods comprising determining diagnostic data based on acoustic signals transmitted between a first transducer pair of an ultrasonic meter (wherein the diagnostic data comprises an asymmetry of a flow of fluids that couples within a spool piece, a cross flow of the flow of fluids in the spool piece, and a profile factor of the flow of fluids in the spool piece), trending the diagnostic data with time, and determining changes in the roughness of a pipe based on the trend of the diagnostic data (wherein the trend comprises a substantially constant value of about unity for both the asymmetry and the cross flow and a substantially changing value for the profile factor).
- Yet still other illustrative embodiments are computer-readable media comprising a plurality of instructions that, when executed by a processor, perform methods comprising determining changes in the roughness of a pipe based on a trend of diagnostic data with time (wherein the diagnostic data is based on acoustic signals transmitted between a first transducer pair and comprises: asymmetry of a flow of fluids that couples within a spool piece; cross flow of the flow of fluids in the spool piece; and profile factor of the flow of fluids in the spool piece).
- the trend comprises a substantially constant value of about unity for both the asymmetry and the cross flow and a substantially changing value for the profile factor.
- the term “comprises” and “comprising” are used in an open-ended fashion, and thus should be interpreted to mean “including, but not limited to".
- the term “couple” or “couples” is intended to mean either an indirect or direct connection. Thus, if a first device couples to a second device, that connection may be through a direct connection, or through an indirect connection via other devices and connections.
- the term “mounted” is intended to mean either an indirect or direct connection. Thus, if a first device is mounted to a second device, that connection may be through a direct connection, or through an indirect connection via other devices and connections.
- FIG. 1 illustrates an ultrasonic meter suitable for measuring fluid flow, such as liquids or gases, in accordance with embodiments of the invention.
- Spool piece 100 suitable for placement between sections of a pipeline, has a predetermined size and defines a measurement section.
- Transducers 120 and 130 are ultrasonic transceivers, meaning that they both generate and receive ultrasonic signals.
- Ultrasonic in this context refers to acoustic signals, in some embodiments having frequencies above about 20 kilohertz.
- the ultrasonic signals may have a frequency of approximately 125 kilohertz (for gas meters), and 1 megahertz (for liquid meters). Regardless of the frequency, these signals may be generated and received by a piezoelectric element in each transducer.
- the piezoelectric element is stimulated electrically, and it responds by vibrating. The vibration of the piezoelectric element generates an ultrasonic signal that travels across the spool piece 100 through the fluid to the corresponding transducer of the transducer pair.
- the receiving piezoelectric element Upon being struck by an ultrasonic signal, vibrates and generates an electrical signal that is detected, digitized, and analyzed by electronics associated with the meter.
- a path 110 exists between transducers 120 and 130 at an angle ⁇ to a centerline 105.
- the length of "chord” 110 is the distance between the face of transducer 120 to the face of transducer 130.
- Points 140 and 145 define the locations where acoustic signals generated by transducers 120 and 130 enter and leave fluid flowing through the spool piece 100.
- the position of transducers 120 and 130 may be defined by the angle ⁇ , by a first length L measured between transducers 120 and 130, a second length X corresponding to the axial distance between points 140 and 145, and a third length D corresponding to the pipe or spool piece diameter. In most cases distances D, X and L are precisely determined during meter fabrication. Further, transducers such as 120 and 130 are usually placed a specific distance from points 140 and 145, respectively, regardless of meter size (i.e. spool piece diameter).
- downstream transducer 120 generates an ultrasonic signal that propagates to and strikes the upstream transducer 130.
- the upstream transducer 130 generates a return ultrasonic signal that propagates to and strikes the downstream transducer 120.
- the transducers 120 and 130 play "pitch and catch" with ultrasonic signals 115 along chordal path 110. During operation, this sequence may occur thousands of times per minute for each transducer pair.
- Velocity vectors 153-158 illustrate that the velocity through spool piece 100 increases toward centerline 105.
- the transit time of the ultrasonic signal 115 between transducers 120 and 130 depends in part upon whether the ultrasonic signal 115 is traveling upstream or downstream with respect to the fluid flow.
- a transit time for an ultrasonic signal 115 traveling downstream ( i.e. in the same direction as the flow) is less than the transit time when traveling upstream ( i.e. against the flow).
- the upstream and downstream transit times can be used to calculate the average velocity along the chordal path 110, and may also be used to calculate the speed of sound in the fluid flow. Given the cross-sectional measurements of the meter carrying the fluid and the average velocity, the volume of fluid flowing through the spool piece 100 may be calculated.
- ultrasonic flow meters comprise a plurality of paths.
- FIG. 2 illustrates a multi-path ultrasonic flow meter.
- spool piece 100 comprises a chordal path A 225, a chordal path B 230, a chordal path C 235, and a chordal path D 240 at varying levels through the fluid flow.
- the multi-path flow meter may comprise a different number of chordal paths.
- Each chordal path A-D corresponds to two transducers behaving alternately as a transmitter and a receiver.
- control electronics 160 which acquire and process the data from the four chordal paths A-D. Hidden from view in FIG. 2 are the four pairs of transducers that correspond to chordal paths A-D.
- the arrangement of the four pairs of transducers may be more easily understood by reference to FIG. 3 .
- Four pairs of transducer ports are mounted on spool piece 100. Each pair of transducer ports corresponds to a single chordal path 110 of FIG. 2 .
- the spool piece 100 has mounted thereon a first pair of transducer ports 125 and 135 as well as associated transducers.
- Another pair of transducer ports comprising ports 165 and 175 (only partially in view) as well as associated transducers is mounted so that its chordal path loosely forms an "X" with respect to the chordal path 110 of transducer ports 125 and 135.
- transducer ports 185 and 195 are placed parallel to transducer ports 165 and 175 but at a different "level" (i.e. a different radial position in the pipe or meter spool piece).
- a fourth pair of transducers and transducer ports is not explicitly shown in FIG. 3 .
- the pairs of transducers are arranged such that the upper two pairs of transducers corresponding to chords A and B form an X, and the lower two pairs of transducers corresponding to chords C and D also form an X.
- the flow velocity of the fluid may be determined at each chord A-D to obtain chordal flow velocities, and the chordal flow velocities may be combined to determine an average flow velocity over the entire pipe or meter spool piece 100.
- the chordal flow velocities are based on a batch of transit times received from the four pairs of transducers.
- a batch of 20 values of ⁇ t may be used to determine an average value of ⁇ t. In alternative embodiments, a different number of values of ⁇ t may be used.
- chordal velocities provide an indication as to changing conditions such as pipe roughness of the pipe work upstream of the meter or roughness within the meter itself.
- the asymmetry, cross flow, and profile factor of the flow of fluids through the pipe or meter spool piece 100 are used to determine pipe roughness. Each of these is discussed in turn.
- the profile factor also provides an indication as to swirl of the flow due to both the varying radial positions and planes of the chordal paths A-D. Under optimum operating conditions, the asymmetry value should be about unity, the cross flow value should be about unity, and the profile factor value should be about 1.17.
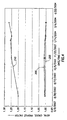
- the asymmetry 200, cross flow 205, and profile factor 210 are plotted as a function of time.
- Time is plotted along the x-axis
- the asymmetry 200, cross flow 205, and profile factor 210 are plotted along the y-axis.
- the trend of this diagnostic data with time illustrates a substantially constant value of about unity (the optimum operating value) for both the asymmetry 200 and the cross flow 205 and a substantially increasing value away from about 1.17 (the optimum operating value) for the profile factor 210 of the flow of fluids through the pipe or meter.
- the diagnostic data illustrated in FIG. 4 is illustrative of an indication as to changing conditions such as pipe or meter roughness. More specifically, the trend of the data as shown in FIG. 4 provides an indication of an increase in pipe roughness of the upstream pipe work or an increase in roughness of the meter spool piece 100.
- the velocity profile 152 is established by the pipe condition upstream of the meter or upstream of the transducers. For example, if the upstream pipe and fittings are fixed, one would not expect a change in the velocity profile 152. However, there are conditions under which the velocity profile 152 may change such as: an upstream flow control valve being adjusted; an upstream branching flow of varying proportion to the metered flow; a flow conditioner trapping debris; or erosion, corrosion, or deposition changing the upstream pipe or meter roughness.
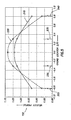
- FIG. 5 illustrates the velocity profile 152 as a function of the location of the chords A-D for both smooth 215 (solid curve) and rough 220 (dashed curve) upstream conditions.
- the chord location is plotted along the x-axis with the position corresponding to chordal path A 225, chordal path B 230, chordal path C 235, and chordal path D 240 also noted.
- the velocity near a pipe or meter wall (V A , V D based on chordal path A 225 and chordal path D 240) is reduced because of increased resistance due to the pipe or meter roughness.
- the velocity near the center of the pipe or meter (V B , V C based on chordal path B 230 and chordal path C 235) is increased because the same mass flow will travel through the flow meter due to the principle of continuity.
- the velocity profile 152 takes on a more acute shape for the case of rough upstream conditions (again, curve 220) as compared to the case of smooth upstream conditions (curve 215).
- FIG. 6 illustrates the velocity profile 152 as a function of time for the varying locations of the chords A-D. Time is plotted along the x-axis, and the velocity profile 152 corresponding to chordal paths A-D is plotted along the y-axis. As similarly illustrated in FIG. 5 , FIG. 6 shows a decrease in velocity near the pipe or meter wall (velocity profile 152 corresponding to chordal path A 225 and chordal path D 240) and a concurrent increase in velocity near the center of the pipe or meter (velocity profile 152 corresponding to chordal path B 230 and chordal path C 235). Moreover, FIG. 6 shows this change as a function of time. Thus, the velocity profile 152 component of the diagnostic data as illustrated in FIG. 6 provides an additional indicator as to the changing conditions of the pipe or meter over time.
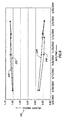
- FIG. 7 is an illustration of turbulence 245 as a function of time. Time is plotted along the x-axis, and the percentage of turbulence 245 is plotted along the y-axis. As shown in FIG. 7 , the initial percentage of turbulence 245 is higher for chordal paths A 225 and D 240 as compared to the turbulence 245 for chordal paths B 230 and C 235. With increasing time, the turbulence 245 along all chordal paths increases. This result is indicative of an increased upstream pipe or meter roughness as such factors may cause increased turbulence 245 as well as increases in friction loss and shear stress. Thus, the turbulence data also provides an additional indicator as to the changing conditions of the upstream pipe work.
- FIG. 8 illustrates a flow diagram for an algorithm used for determining pipe roughness in accordance with embodiments of the invention.
- the process starts (block 300) and proceeds to the determination of diagnostic data based on ultrasonic signals (block 302) transmitted between pairs of transducers.
- the diagnostic data comprises the asymmetry 200, cross flow 205, and profile factor 210 of the flow of fluids through the pipe or meter spool piece 100. Other embodiments may consider velocity profile 152 and turbulence data 245 as well.
- the process then proceeds to the trending of the diagnostic data with time (block 304). The trending may be performed over a period of time as determined by a user as being adequate, and in some embodiments may be on the order of months or years.
- the process proceeds to the determination of changes in the roughness of the pipe or meter based on the trend of the data (block 306).
- the determination of pipe roughness is made based on the subset of diagnostic data comprising the asymmetry 200, cross flow 205, and profile factor 210.
- the determination of pipe or meter roughness may be supported as well by the velocity profile 152 and turbulence data 245.
- the process then proceeds to the determination of additional diagnostic data based on ultrasonic signals 115 (block 302).
Description
- Measurements of mass and volume flow rates or fluid through a conduit are a part of operations in the oil and gas industry. One of the tools used to accomplish such a measurement is an ultrasonic flow meter. Ultrasonic flow meters are a class of flow meters that determine volumetric flow of a fluid within a conduit using ultrasonic signals propagated through the fluid.
- Ultrasonic flow meters offer an advantage of generating an abundance of diagnostic data that may reveal potential problems in the performance of the meter. However, shifts in the diagnostic data have been difficult to interpret because the data is most often reviewed after either new meter calibration or field failures of the meter. Industry practice calls for fixed routine maintenance and mandatory recalibration intervals of flow meters. Such a maintenance and recalibration schedule may be expensive and time-consuming. Furthermore, if it is performed on a fixed interval, it is uncertain whether the meter actually requires such work to be performed. Thus, the abundance of diagnostic data provided by the flow meter is not being used efficiently.
- There has been some practice of trending a limited quantity of diagnostic parameters with time in order to glean additional information. However, current methodologies are incomplete and lack optimization. These methodologies fall short of providing data significant enough to curb the need for fired maintenance and calibration intervals. Additionally, current methods are not able to predict system performance beyond the flow meter such as an upstream pipe condition.
- Zanker K J: "Diagnostic ability of the Daniel Four-Path UL Ultrasonic Flow meter" 2nd International South Eaust Asian Hydrocarbon Flow measurement workshop; 25-28 March 2003 discloses an ultrasonic meter in which four chordal velocities give an indication of the velocity profile in the meter, established by the flow through the upstream pipe work. An asymmetry ratio, a cross flow ratio and a swirl ratio are used to obtain an indication of pipe roughness.
- The problems noted above are solved in large part by a method and ultrasonic meter system for determining pipe roughness. At least some of the illustrative embodiments are ultrasonic meters comprising a spool piece that couples within a flow of fluids, and a first transducer pair mechanically mounted to the spool piece and acoustically coupled to the flow of fluids (wherein the first transducer pair comprises an upstream transducer and a downstream transducer in operational relationship to the upstream transducer and defines a first chord there between). The ultrasonic meter is configured to determine diagnostic data based on acoustic signals transmitted between the first transducer pair (wherein the diagnostic data comprises an asymmetry of the flow of fluids in the spool piece, a cross flow of the flow of fluids in the spool piece, and a profile factor of the flow of fluids in the spool piece). The ultrasonic meter is configured to determine changes in the roughness of a pipe mechanically coupled to the ultrasonic meter based on a trend of the diagnostic data (wherein the trend comprises a substantially constant value of about unity for both the asymmetry and the cross flow and a substantially changing value for the profile factor).
- Other illustrative embodiments are methods comprising determining diagnostic data based on acoustic signals transmitted between a first transducer pair of an ultrasonic meter (wherein the diagnostic data comprises an asymmetry of a flow of fluids that couples within a spool piece, a cross flow of the flow of fluids in the spool piece, and a profile factor of the flow of fluids in the spool piece), trending the diagnostic data with time, and determining changes in the roughness of a pipe based on the trend of the diagnostic data (wherein the trend comprises a substantially constant value of about unity for both the asymmetry and the cross flow and a substantially changing value for the profile factor).
- Yet still other illustrative embodiments are computer-readable media comprising a plurality of instructions that, when executed by a processor, perform methods comprising determining changes in the roughness of a pipe based on a trend of diagnostic data with time (wherein the diagnostic data is based on acoustic signals transmitted between a first transducer pair and comprises: asymmetry of a flow of fluids that couples within a spool piece; cross flow of the flow of fluids in the spool piece; and profile factor of the flow of fluids in the spool piece). The trend comprises a substantially constant value of about unity for both the asymmetry and the cross flow and a substantially changing value for the profile factor.
- The disclosed devices and methods comprise a combination of features and advantages which enable it to overcome the deficiencies of the prior art devices. The various characteristics described above, as well as other features, will be readily apparent to those skilled in the art upon reading the following detailed description, and by referring to the accompanying drawings.
- For a detailed description of the various embodiments of the invention, reference will now be made to the accompanying drawings in which:
-
FIG. 1 illustrates a cut-away top view of an ultrasonic gas flow meter; -
FIG. 2 illustrates an end view of an ultrasonic flow meter in accordance with embodiments of the invention comprising a spool piece and chordal paths A-D; -
FIG. 3 illustrates a top view of an ultrasonic flow meter in accordance with embodiments of the invention comprising a spool piece housing transducer pairs; -
FIG. 4 illustrates a trend of diagnostic data with time in accordance with embodiments of the invention comprising asymmetry, cross flow, and profile factor data; -
FIG. 5 illustrates diagnostic data in accordance with embodiments of the invention comprising velocity profile data for smooth and rough pipelines; -
FIG. 6 illustrates a trend of diagnostic data with time in accordance with embodiments of the invention comprising velocity profile data; -
FIG. 7 illustrates a trend of diagnostic data with time in accordance with embodiments of the invention comprising turbulence data; and -
FIG. 8 shows an exemplary flow diagram for determining pipe roughness. - Certain terms are used throughout the following description and claims to refer to particular system components. This document does not intend to distinguish between components that differ in name but not function.
- In the following discussion and in the claims, the term "comprises" and "comprising" are used in an open-ended fashion, and thus should be interpreted to mean "including, but not limited to...". Also, the term "couple" or "couples" is intended to mean either an indirect or direct connection. Thus, if a first device couples to a second device, that connection may be through a direct connection, or through an indirect connection via other devices and connections. Further, the term "mounted" is intended to mean either an indirect or direct connection. Thus, if a first device is mounted to a second device, that connection may be through a direct connection, or through an indirect connection via other devices and connections.
-
FIG. 1 illustrates an ultrasonic meter suitable for measuring fluid flow, such as liquids or gases, in accordance with embodiments of the invention.Spool piece 100, suitable for placement between sections of a pipeline, has a predetermined size and defines a measurement section. A pair oftransducers respective housings spool piece 100.Transducers spool piece 100 through the fluid to the corresponding transducer of the transducer pair. Upon being struck by an ultrasonic signal, the receiving piezoelectric element vibrates and generates an electrical signal that is detected, digitized, and analyzed by electronics associated with the meter. - A
path 110, sometimes referred to as a "chord," exists betweentransducers centerline 105. The length of "chord" 110 is the distance between the face oftransducer 120 to the face oftransducer 130.Points transducers spool piece 100. The position oftransducers transducers points points - Initially,
downstream transducer 120 generates an ultrasonic signal that propagates to and strikes theupstream transducer 130. Some time later, theupstream transducer 130 generates a return ultrasonic signal that propagates to and strikes thedownstream transducer 120. Thus, thetransducers ultrasonic signals 115 alongchordal path 110. During operation, this sequence may occur thousands of times per minute for each transducer pair. - A fluid flows in the
spool piece 100 in adirection 150 with avelocity profile 152. Velocity vectors 153-158 illustrate that the velocity throughspool piece 100 increases towardcenterline 105. The transit time of theultrasonic signal 115 betweentransducers ultrasonic signal 115 is traveling upstream or downstream with respect to the fluid flow. A transit time for anultrasonic signal 115 traveling downstream (i.e. in the same direction as the flow) is less than the transit time when traveling upstream (i.e. against the flow). The upstream and downstream transit times can be used to calculate the average velocity along thechordal path 110, and may also be used to calculate the speed of sound in the fluid flow. Given the cross-sectional measurements of the meter carrying the fluid and the average velocity, the volume of fluid flowing through thespool piece 100 may be calculated. - To more precisely determine the average velocity over the meter cross-section, ultrasonic flow meters comprise a plurality of paths.
FIG. 2 illustrates a multi-path ultrasonic flow meter. In theseembodiments spool piece 100 comprises a chordal path A 225, achordal path B 230, achordal path C 235, and achordal path D 240 at varying levels through the fluid flow. In alternative embodiments, the multi-path flow meter may comprise a different number of chordal paths. Each chordal path A-D corresponds to two transducers behaving alternately as a transmitter and a receiver. Also shown arecontrol electronics 160, which acquire and process the data from the four chordal paths A-D. Hidden from view inFIG. 2 are the four pairs of transducers that correspond to chordal paths A-D. - The arrangement of the four pairs of transducers may be more easily understood by reference to
FIG. 3 . Four pairs of transducer ports are mounted onspool piece 100. Each pair of transducer ports corresponds to a singlechordal path 110 ofFIG. 2 . Thespool piece 100 has mounted thereon a first pair oftransducer ports ports comprising ports 165 and 175 (only partially in view) as well as associated transducers is mounted so that its chordal path loosely forms an "X" with respect to thechordal path 110 oftransducer ports transducer ports transducer ports FIG. 3 is a fourth pair of transducers and transducer ports. TakingFIGS. 2 and3 together, the pairs of transducers are arranged such that the upper two pairs of transducers corresponding to chords A and B form an X, and the lower two pairs of transducers corresponding to chords C and D also form an X. Based on the transit times, the flow velocity of the fluid may be determined at each chord A-D to obtain chordal flow velocities, and the chordal flow velocities may be combined to determine an average flow velocity over the entire pipe ormeter spool piece 100. - The chordal flow velocities are based on a batch of transit times received from the four pairs of transducers. The batch of transit times comprise a batch of a difference in transit time ('Δt') between a downstream transit time 't1' and an upstream transit time 't2' generated by substantially the following equation:

A batch of 20 values of Δt may be used to determine an average value of Δt. In alternative embodiments, a different number of values of Δt may be used. - Based on the average value of Δt, an average chordal flow velocity may be determined as defined by substantially the following equation:

meter spool piece 100 may be determined by substantially the following equation:
wherein 'WA', 'WB', 'WC', and 'WD' are chord-dependent weighting factors. - When combined in various fashions, the chordal velocities provide an indication as to changing conditions such as pipe roughness of the pipe work upstream of the meter or roughness within the meter itself. Specifically, in accordance with some embodiments the asymmetry, cross flow, and profile factor of the flow of fluids through the pipe or
meter spool piece 100 are used to determine pipe roughness. Each of these is discussed in turn. - Asymmetry compares the flow in the top half of the pipe or meter (VA, VB) with that in the bottom half of the pipe or meter (VC, VD) and may be generated by substantially the following equation:

The cross flow compares the flow in one vertical plane (e.g., a plane defined bychordal path A 225 andchordal path C 235, with corresponding chordal velocities VA and VC) to the flow in another vertical plane (e.g., a plane defined bychordal path B 230 andchordal path D 240, with corresponding chordal velocities VB and VD) that may be oriented substantially at a right angle with respect to one another and may be generated by substantially the following equation:
Profile factor compares the flow near the center of the pipe or meter (VB, VC) to the flow near the pipe or meter wall (VA, VD) and may be generated by substantially the following equation:
The profile factor also provides an indication as to swirl of the flow due to both the varying radial positions and planes of the chordal paths A-D. Under optimum operating conditions, the asymmetry value should be about unity, the cross flow value should be about unity, and the profile factor value should be about 1.17. - Referring now to the illustration of
FIG. 4 , theasymmetry 200,cross flow 205, andprofile factor 210 are plotted as a function of time. Time is plotted along the x-axis, and theasymmetry 200,cross flow 205, andprofile factor 210 are plotted along the y-axis. The trend of this diagnostic data with time illustrates a substantially constant value of about unity (the optimum operating value) for both theasymmetry 200 and thecross flow 205 and a substantially increasing value away from about 1.17 (the optimum operating value) for theprofile factor 210 of the flow of fluids through the pipe or meter. This trend in the data indicates that flow remains symmetrical and there is substantially no cross flow, while the flow velocities near the center of the pipe or meter (chordal paths B 230 and C 235) are increasing as compared to flow velocities near the pipe or meter wall (chordal paths A 225 and D 240). - The diagnostic data illustrated in
FIG. 4 is illustrative of an indication as to changing conditions such as pipe or meter roughness. More specifically, the trend of the data as shown inFIG. 4 provides an indication of an increase in pipe roughness of the upstream pipe work or an increase in roughness of themeter spool piece 100. - Returning to
FIG. 1 , thevelocity profile 152 is established by the pipe condition upstream of the meter or upstream of the transducers. For example, if the upstream pipe and fittings are fixed, one would not expect a change in thevelocity profile 152. However, there are conditions under which thevelocity profile 152 may change such as: an upstream flow control valve being adjusted; an upstream branching flow of varying proportion to the metered flow; a flow conditioner trapping debris; or erosion, corrosion, or deposition changing the upstream pipe or meter roughness. - The change in
velocity profile 152 due to one of the aforementioned factors may be more easily understood with reference toFIG. 5. FIG. 5 illustrates thevelocity profile 152 as a function of the location of the chords A-D for both smooth 215 (solid curve) and rough 220 (dashed curve) upstream conditions. The chord location is plotted along the x-axis with the position corresponding to chordal path A 225,chordal path B 230,chordal path C 235, andchordal path D 240 also noted. The velocity profile 152 (which is a dimensionless number) is plotted along the y-axis wherein thevelocity profile 152 is defined by substantially the following equation:
wherein 'VCHORD' is the chordal flow velocity of one of the chords A-D and VAVG is the average velocity of the flow of fluids in the spool piece as defined above. - For rough upstream conditions (curve 220) the velocity near a pipe or meter wall (VA, VD based on
chordal path A 225 and chordal path D 240) is reduced because of increased resistance due to the pipe or meter roughness. Concurrently, the velocity near the center of the pipe or meter (VB, VC based onchordal path B 230 and chordal path C 235) is increased because the same mass flow will travel through the flow meter due to the principle of continuity. Thus, thevelocity profile 152 takes on a more acute shape for the case of rough upstream conditions (again, curve 220) as compared to the case of smooth upstream conditions (curve 215). -
FIG. 6 illustrates thevelocity profile 152 as a function of time for the varying locations of the chords A-D. Time is plotted along the x-axis, and thevelocity profile 152 corresponding to chordal paths A-D is plotted along the y-axis. As similarly illustrated inFIG. 5 ,FIG. 6 shows a decrease in velocity near the pipe or meter wall (velocity profile 152 corresponding tochordal path A 225 and chordal path D 240) and a concurrent increase in velocity near the center of the pipe or meter (velocity profile 152 corresponding tochordal path B 230 and chordal path C 235). Moreover,FIG. 6 shows this change as a function of time. Thus, thevelocity profile 152 component of the diagnostic data as illustrated inFIG. 6 provides an additional indicator as to the changing conditions of the pipe or meter over time. - Another component of the diagnostic data, a turbulence value, may be generated based on the batch of Δft values. Taking the average Δft and a standard deviation of Δft ('σΔt'), turbulence (i.e. velocity fluctuation) may be defined substantially by the following equation:

chordal paths B 230 andC 235 and about 3-4% for outer chordal paths A 225 andD 240. -
FIG. 7 is an illustration ofturbulence 245 as a function of time. Time is plotted along the x-axis, and the percentage ofturbulence 245 is plotted along the y-axis. As shown inFIG. 7 , the initial percentage ofturbulence 245 is higher for chordal paths A 225 andD 240 as compared to theturbulence 245 forchordal paths B 230 andC 235. With increasing time, theturbulence 245 along all chordal paths increases. This result is indicative of an increased upstream pipe or meter roughness as such factors may cause increasedturbulence 245 as well as increases in friction loss and shear stress. Thus, the turbulence data also provides an additional indicator as to the changing conditions of the upstream pipe work. -
FIG. 8 illustrates a flow diagram for an algorithm used for determining pipe roughness in accordance with embodiments of the invention. The process starts (block 300) and proceeds to the determination of diagnostic data based on ultrasonic signals (block 302) transmitted between pairs of transducers. In some embodiments, the diagnostic data comprises theasymmetry 200,cross flow 205, andprofile factor 210 of the flow of fluids through the pipe ormeter spool piece 100. Other embodiments may considervelocity profile 152 andturbulence data 245 as well. The process then proceeds to the trending of the diagnostic data with time (block 304). The trending may be performed over a period of time as determined by a user as being adequate, and in some embodiments may be on the order of months or years. After predetermined period of time allocated for trending of the diagnostic data, the process proceeds to the determination of changes in the roughness of the pipe or meter based on the trend of the data (block 306). In some embodiments the determination of pipe roughness is made based on the subset of diagnostic data comprising theasymmetry 200,cross flow 205, andprofile factor 210. In other embodiments the determination of pipe or meter roughness may be supported as well by thevelocity profile 152 andturbulence data 245. After determination of the pipe and meter condition, the process then proceeds to the determination of additional diagnostic data based on ultrasonic signals 115 (block 302). - From the description provided herein, those skilled in the art are readily able to combine the methods as described to create software that when combined with appropriate general purpose or special purpose computer hardware may be used to create a computer system and/or computer subcomponents embodying the invention, to create a computer system and/or computer subcomponents for carrying out the method of the invention, and/or to create a computer-readable media for storing a software program to implement the method aspects of the invention.
- The above discussion is meant to be illustrative of the principles and various embodiments of the present invention. Numerous variations and modifications will become apparent to those skilled in the art once the above disclosure is fully appreciated. It is intended that the following claims be interpreted to embrace all such variations and modifications.
Claims (21)
- An ultrasonic meter comprising:a spool piece (100) that couples within a flow of fluids; anda plurality of transducer pairs mechanically mounted to the spool piece (100) and acoustically coupled to the flow of fluids, each transducer pair comprising an upstream transducer (130) and a downstream transducer (120) in operational relationship to the upstream transducer and defining a respective chord (110) there between;wherein each transducer pair in said plurality of transducer pairs is mounted at a different radial position within the spool piece to each other transducer pair in said plurality of transducer pairs;wherein the ultrasonic meter further comprises analysis electronics (160) configured to determine diagnostic data based on acoustic signals transmitted between the plurality of transducer pairs, the diagnostic data comprising: asymmetry (200) of the flow of fluids in the spool piece (100); cross flow (205) of the flow of fluids in the spool piece (100); and profile factor (210) of the flow of fluids in the spool piece (100); andwherein the analysis electronics (160) are configured to determine that changes in the roughness of a pipe mechanically coupled to the ultrasonic meter have occurred when a trend of the diagnostic data with respect to time comprises a substantially constant value of about unity for both the asymmetry (200) and the cross flow (205) and a substantially changing value for the profile factor (210).
- The ultrasonic meter as defined in claim 1 wherein the diagnostic data further comprises a velocity profile (152) of the flow of fluids in the spool piece (100), and the analysis electronics (160) are further configured to determine that changes in the roughness of the pipe have occurred based on the velocity profile.
- The ultrasonic meter as defined in claim 1 wherein the diagnostic data further comprises a value indicative of turbulence of the flow of fluids in the spool piece (100), and the analysis electronic (160) are further configured to determine that changes in the roughness of the pipe have occurred based on the value indicative of turbulence.
- The ultrasonic meter as defined in claims 3 wherein the value indicative of turbulence of the flow of fluids in the spool piece (100) is generated by substantially the following equation:

wherein 'Δt' is a difference between a transit time 't1' and a transit time 't2' generated by substantially the following equation:
wherein 'σΔt' is a standard deviation of 'Δt'. - The ultrasonic meter as defined in claim 1 wherein the plurality of transducer pairs comprises:a first transducer pair mechanically mounted to the spool piece (100) and acoustically coupled to the flow of fluids, the first transducer pair comprising an upstream transducer (130) and a downstream transducer (120) in operational relationship to the upstream transducer and defining a first chord (110) there between;a second transducer pair mechanically mounted to the spool piece (100) and acoustically coupled to the flow of fluids, the second transducer pair comprising an upstream transducer and a downstream transducer in operational relationship to the upstream transducer and defining a second chord there between;a third transducer pair mechanically mounted to the spool piece (100) and acoustically coupled to the flow of fluids, the third transducer pair comprising an upstream transducer and a downstream transducer in operational relationship to the upstream transducer and defining a third chord there between; anda fourth transducer pair mechanically mounted to the spool piece (100) and acoustically coupled to the flow of fluids, the fourth transducer pair comprising an upstream transducer and a downstream transducer in operational relationship to the upstream transducer and defining a fourth chord there between;wherein the analysis electronics (160) is configured to determine diagnostic data based on acoustic signals transmitted between each of the second, third, and fourth transducer pairs.
- The ultrasonic meter as defined in claim 5 wherein each of the first, second, third, and fourth chords are defined at varying radial position within the spool piece (100).
- The ultrasonic meter as defined in claims 6 wherein the diagnostic data further comprises a velocity profile (152) of the flow of fluids in the spool piece (100) based on the varying radial positions of the chords, and the analysis electronics (100) are configured to determine that changes in the roughness of the pipe have occurred based on the velocity profile (152).
- The ultrasonic meter as defined in claim 5 wherein the analysis electronic is further configured to determine a velocity 'VA' associated with the first transducer pair, a velocity 'VB' associated with the second transducer pair, a velocity 'VC' associated with the third transducer pair, and a velocity 'VD' associated with the fourth transducer pair.
- The ultrasonic meter as defined in claim 8 wherein the asymmetry (200) of the flow of fluids in the spool piece (100) is generated by substantially the following equation:

- The ultrasonic meter as defined in claim 8 wherein the cross flow (205) of the flow of fluids in the spool piece (100) is generated by substantially the following equation:

- The ultrasonic meter as defined in claim 8 wherein the profile factor (210) of the flow of fluids in the spool piece (100) is generated by substantially the following equation:

- The ultrasonic meter as defined in claim 8 wherein a velocity profile (152) of the flow of fluids in the spool piece (100) is generated by substantially the following equation:

wherein 'VCHORD' comprises 'VA', 'VB', 'VC', and 'VD', and wherein 'VAVG' is an average velocity of the flow of fluids in the spool piece (100) and is generated by substantially the following equation:
and
wherein 'WA', 'WB', 'WC', and 'WD' are chord-dependent weighting factors. - The ultrasonic meter as defined in claim 1 wherein the analysis electronics (160) is configured to use the diagnostic data for condition based monitoring of the ultrasonic meter.
- The ultrasonic meter of any preceding claims, wherein chords defined by said plurality of transducer pairs cross when viewed from above.
- A method comprising:determining diagnostic data based on acoustic signals transmitted between a plurality of transducer pairs of an ultrasonic meter, each transducer pair in said plurality of transducer pairs comprising an upstream transducer (130), a downstream transducer (120) in operational relationship to the upstream transducer and defining a respective chord (110) there between, wherein each transducer pair in said plurality of transducer pairs is mounted at a different radial position within a spool piece (100) to each other transducer pair in said plurality of transducer pairs, the diagnostic data comprising: asymmetry (200) of a flow of fluids that couples within the spool piece (100); cross flow (205) of the flow of fluids in the spool piece; and profile factor (210) of the flow of fluids in the spool piece;trending the diagnostic data with time; anddetermining that changes in the roughness of a pipe have occurred when the trend comprises a substantially constant value of about unity for both the asymmetry (200) and the cross flow (205) and a substantially changing value for the profile factor (210).
- The method as defined in claim 15 wherein:the diagnostic data further comprises a velocity profile (152) of the flow of fluids in the spool piece (100); andwherein the method further comprises determining that changes in the roughness of the pipe have occurred based on the velocity profile (152).
- The method as defined in claim 15 wherein:the diagnostic data further comprises a turbulence of the flow of fluids in the spool piece (100); andwherein the method further comprises determining that changes in the roughness of the pipe have occurred based on the turbulence.
- The method as defined in claim 15 wherein determining diagnostic data comprises determining diagnostic data based on acoustic signals transmitted between each of a first, second, third, and fourth transducer pair.
- The method as defined in claim 15 further comprising using the diagnostic data for condition based monitoring of an ultrasonic meter.
- A computer-readable media comprising a plurality of instructions that, when executed by a processor, perform the method set out in claim 15.
- The computer-readable media as defined in claim 20 wherein the diagnostic data is used. for condition based monitoring of an ultrasonic meter.
Applications Claiming Priority (3)
| Application Number | Priority Date | Filing Date | Title |
|---|---|---|---|
| US68624905P | 2005-06-01 | 2005-06-01 | |
| US11/382,160 US7373808B2 (en) | 2005-06-01 | 2006-05-08 | Method and ultrasonic meter system for determining pipe roughness |
| PCT/US2006/018780 WO2006130337A2 (en) | 2005-06-01 | 2006-05-16 | Method and ultrasonic meter system for determining pipe roughness |
Publications (3)
| Publication Number | Publication Date |
|---|---|
| EP1886131A2 EP1886131A2 (en) | 2008-02-13 |
| EP1886131A4 EP1886131A4 (en) | 2010-11-10 |
| EP1886131B1 true EP1886131B1 (en) | 2013-12-04 |
Family
ID=37482129
Family Applications (1)
| Application Number | Title | Priority Date | Filing Date |
|---|---|---|---|
| EP06759872.2A Active EP1886131B1 (en) | 2005-06-01 | 2006-05-16 | Method and ultrasonic meter system for determining pipe roughness |
Country Status (9)
| Country | Link |
|---|---|
| US (1) | US7373808B2 (en) |
| EP (1) | EP1886131B1 (en) |
| CN (1) | CN101189508B (en) |
| BR (1) | BRPI0610904B8 (en) |
| CA (1) | CA2605943C (en) |
| HK (1) | HK1108733A1 (en) |
| MX (1) | MX2007013611A (en) |
| RU (1) | RU2446393C2 (en) |
| WO (1) | WO2006130337A2 (en) |
Families Citing this family (32)
| Publication number | Priority date | Publication date | Assignee | Title |
|---|---|---|---|---|
| US7240537B2 (en) * | 2001-08-02 | 2007-07-10 | Eni S.P.A. | Method for the determination of the wall friction profile along pipes by pressure transients measurements |
| US8170812B2 (en) * | 2007-10-16 | 2012-05-01 | Daniel Measurement And Control, Inc. | Method and system for detecting deposit buildup within an ultrasonic flow meter |
| US7917321B2 (en) * | 2008-02-25 | 2011-03-29 | Daniel Measurement And Control, Inc. | Method and system of determining a pattern of arrival time cycle skip in an acoustic flow meter |
| US8155895B2 (en) | 2008-07-08 | 2012-04-10 | Daniel Measurement And Control, Inc. | Method and system of detecting liquid in an acoustic flow meter |
| US7942068B2 (en) * | 2009-03-11 | 2011-05-17 | Ge Infrastructure Sensing, Inc. | Method and system for multi-path ultrasonic flow rate measurement |
| GB2472081B (en) * | 2009-07-24 | 2014-03-05 | Bios Developments Ltd | A method for determining speed of a signal species in a medium and associated apparatus |
| US8626466B2 (en) * | 2010-02-11 | 2014-01-07 | Daniel Measurement And Control, Inc. | Flow meter validation |
| CA3177996A1 (en) | 2010-06-16 | 2011-12-22 | Mueller International, Llc | Infrastructure monitoring devices, systems, and methods |
| US9772250B2 (en) | 2011-08-12 | 2017-09-26 | Mueller International, Llc | Leak detector and sensor |
| US8656780B2 (en) | 2011-11-09 | 2014-02-25 | Chevron U.S.A. Inc. | Methods for retrofitting natural gas meters |
| WO2014066764A1 (en) | 2012-10-26 | 2014-05-01 | Mueller International, Llc | Detecting leaks in a fluid distribution system |
| US9322690B2 (en) * | 2013-01-28 | 2016-04-26 | Canada Pipeline Accessories, Co. Ltd | Metering tubes for improved fluid flow measurement |
| US9116137B1 (en) | 2014-07-15 | 2015-08-25 | Leeo, Inc. | Selective electrical coupling based on environmental conditions |
| US20160061640A1 (en) * | 2014-08-27 | 2016-03-03 | Leeo, Inc. | Fluid-flow monitor |
| US10102566B2 (en) | 2014-09-08 | 2018-10-16 | Leeo, Icnc. | Alert-driven dynamic sensor-data sub-contracting |
| US9528903B2 (en) | 2014-10-01 | 2016-12-27 | Mueller International, Llc | Piezoelectric vibration sensor for fluid leak detection |
| US10026304B2 (en) | 2014-10-20 | 2018-07-17 | Leeo, Inc. | Calibrating an environmental monitoring device |
| US9404782B2 (en) | 2014-10-21 | 2016-08-02 | Honeywell International, Inc. | Use of transducers with a piezo ceramic array to improve the accuracy of ultra sonic meters |
| US9801013B2 (en) | 2015-11-06 | 2017-10-24 | Leeo, Inc. | Electronic-device association based on location duration |
| US10805775B2 (en) | 2015-11-06 | 2020-10-13 | Jon Castor | Electronic-device detection and activity association |
| US10305178B2 (en) | 2016-02-12 | 2019-05-28 | Mueller International, Llc | Nozzle cap multi-band antenna assembly |
| US10283857B2 (en) | 2016-02-12 | 2019-05-07 | Mueller International, Llc | Nozzle cap multi-band antenna assembly |
| GB2562976B (en) * | 2016-03-10 | 2021-09-15 | Nec Corp | Diagnostic device, diagnostic system, diagnostic method, and program |
| EP3355035B1 (en) * | 2016-05-26 | 2020-06-17 | Fuji Electric Co., Ltd. | Fluid-measuring device |
| US10809107B2 (en) | 2017-12-19 | 2020-10-20 | Daniel Measurement And Control, Inc. | Multi-fluid calibration |
| US20190313164A1 (en) | 2018-04-05 | 2019-10-10 | Honeywell International Inc. | System and method for connected metering |
| US10859462B2 (en) | 2018-09-04 | 2020-12-08 | Mueller International, Llc | Hydrant cap leak detector with oriented sensor |
| US11342656B2 (en) | 2018-12-28 | 2022-05-24 | Mueller International, Llc | Nozzle cap encapsulated antenna system |
| US11473993B2 (en) | 2019-05-31 | 2022-10-18 | Mueller International, Llc | Hydrant nozzle cap |
| US10801876B1 (en) * | 2020-05-12 | 2020-10-13 | Rmg Messtechnik Gmbh | Self-checking ultrasonic fluid flow measurement system |
| US11542690B2 (en) | 2020-05-14 | 2023-01-03 | Mueller International, Llc | Hydrant nozzle cap adapter |
| CN112560362B (en) * | 2020-12-15 | 2022-11-01 | 同济大学 | Aging diagnosis method and system for water supply pipeline of old community |
Family Cites Families (10)
| Publication number | Priority date | Publication date | Assignee | Title |
|---|---|---|---|---|
| US4300401A (en) * | 1979-10-09 | 1981-11-17 | Panametrics, Inc. | Method and apparatus for determining fluid flow |
| SU1310339A1 (en) * | 1986-02-07 | 1987-05-15 | Научно-Производственное Объединение По Технологии Машиностроения "Цниитмаш" | Method for ultrasonic inspection of article roughness |
| RU2029225C1 (en) * | 1991-06-28 | 1995-02-20 | Азербайджанский научно-исследовательский электротехнический институт Научно-производственного объединения "Азерэлектромаш" | Method of contact measuring of single-profile structure surface roughness |
| US6047602A (en) * | 1996-10-29 | 2000-04-11 | Panametrics, Inc. | Ultrasonic buffer/waveguide |
| EP0855577A1 (en) * | 1997-01-28 | 1998-07-29 | Electrowatt Technology Innovation AG | Method for autonomous parameter adjustment of an ultrasonic measuring device |
| US6067861A (en) * | 1998-06-18 | 2000-05-30 | Battelle Memorial Institute | Method and apparatus for ultrasonic doppler velocimetry using speed of sound and reflection mode pulsed wideband doppler |
| US6463808B1 (en) * | 1998-10-05 | 2002-10-15 | Robert H. Hammond | Ultrasonic measurement system with chordal path |
| CN2505004Y (en) * | 2001-09-26 | 2002-08-14 | 叶学强 | Movable domestic ultrasonic instrument |
| US20030101804A1 (en) * | 2001-11-30 | 2003-06-05 | Zanker Klaus Joachim | Ultrasonic meter to detect pipeline corrosion and buildup |
| US6950768B2 (en) * | 2003-09-08 | 2005-09-27 | Daniel Industries, Inc. | Self-tuning ultrasonic meter |
-
2006
- 2006-05-08 US US11/382,160 patent/US7373808B2/en active Active
- 2006-05-16 BR BRPI0610904A patent/BRPI0610904B8/en active IP Right Grant
- 2006-05-16 CN CN2006800195747A patent/CN101189508B/en active Active
- 2006-05-16 RU RU2007147721/28A patent/RU2446393C2/en not_active Application Discontinuation
- 2006-05-16 CA CA2605943A patent/CA2605943C/en active Active
- 2006-05-16 EP EP06759872.2A patent/EP1886131B1/en active Active
- 2006-05-16 WO PCT/US2006/018780 patent/WO2006130337A2/en active Application Filing
- 2006-05-16 MX MX2007013611A patent/MX2007013611A/en active IP Right Grant
-
2008
- 2008-02-26 HK HK08102101.4A patent/HK1108733A1/en unknown
Also Published As
| Publication number | Publication date |
|---|---|
| WO2006130337A3 (en) | 2007-07-05 |
| HK1108733A1 (en) | 2008-05-16 |
| CA2605943A1 (en) | 2006-12-07 |
| US7373808B2 (en) | 2008-05-20 |
| CN101189508B (en) | 2013-01-30 |
| BRPI0610904B8 (en) | 2022-08-30 |
| BRPI0610904A2 (en) | 2008-12-16 |
| WO2006130337A2 (en) | 2006-12-07 |
| US20060272417A1 (en) | 2006-12-07 |
| MX2007013611A (en) | 2008-11-06 |
| RU2446393C2 (en) | 2012-03-27 |
| CA2605943C (en) | 2010-11-16 |
| RU2007147721A (en) | 2009-07-20 |
| EP1886131A4 (en) | 2010-11-10 |
| CN101189508A (en) | 2008-05-28 |
| EP1886131A2 (en) | 2008-02-13 |
| BRPI0610904B1 (en) | 2018-01-30 |
Similar Documents
| Publication | Publication Date | Title |
|---|---|---|
| EP1886131B1 (en) | Method and ultrasonic meter system for determining pipe roughness | |
| EP2203721B1 (en) | A method and system for detecting deposit buildup within an ultrasonic flow meter | |
| US9310237B2 (en) | Ultrasonic flow metering using compensated computed temperature | |
| US7581453B2 (en) | Ultrasonic flow meter system | |
| EP2255283B1 (en) | Method and system of determining forthcoming failure of transducers | |
| US9134155B2 (en) | Reynolds number based verification for ultrasonic flow metering systems | |
| EP2324328B1 (en) | Method and system of detecting liquid in an acoustic flow meter | |
| RU2601223C1 (en) | Ultrasonic flow meter system with pressure transducer arranged upstream | |
| US9134154B2 (en) | Percentage deviation based evaluation of velocity dependent characteristics in ultrasonic flow metering systems | |
| RU2560139C2 (en) | Flow meter check | |
| JP2004271496A (en) | Ultrasonic flow measuring method | |
| EP1726920A1 (en) | Doppler type ultrasonic flowmeter | |
| US9797760B2 (en) | Quantitative analysis of flow profile characteristics for ultrasonic metering systems | |
| US20030101804A1 (en) | Ultrasonic meter to detect pipeline corrosion and buildup | |
| RU2471153C2 (en) | Method and system for measurement of total flow of liquid medium and ultrasonic flow metre |
Legal Events
| Date | Code | Title | Description |
|---|---|---|---|
| PUAI | Public reference made under article 153(3) epc to a published international application that has entered the european phase |
Free format text: ORIGINAL CODE: 0009012 |
|
| 17P | Request for examination filed |
Effective date: 20071025 |
|
| AK | Designated contracting states |
Kind code of ref document: A2 Designated state(s): AT BE BG CH CY CZ DE DK EE ES FI FR GB GR HU IE IS IT LI LT LU LV MC NL PL PT RO SE SI SK TR |
|
| REG | Reference to a national code |
Ref country code: HK Ref legal event code: DE Ref document number: 1108733 Country of ref document: HK |
|
| DAX | Request for extension of the european patent (deleted) | ||
| A4 | Supplementary search report drawn up and despatched |
Effective date: 20101013 |
|
| RIC1 | Information provided on ipc code assigned before grant |
Ipc: G01F 1/66 20060101ALI20101007BHEP Ipc: G01N 29/02 20060101AFI20101007BHEP Ipc: G01N 29/44 20060101ALI20101007BHEP Ipc: G01N 29/22 20060101ALI20101007BHEP Ipc: G01N 29/024 20060101ALI20101007BHEP |
|
| 17Q | First examination report despatched |
Effective date: 20120514 |
|
| GRAP | Despatch of communication of intention to grant a patent |
Free format text: ORIGINAL CODE: EPIDOSNIGR1 |
|
| INTG | Intention to grant announced |
Effective date: 20130725 |
|
| GRAS | Grant fee paid |
Free format text: ORIGINAL CODE: EPIDOSNIGR3 |
|
| GRAA | (expected) grant |
Free format text: ORIGINAL CODE: 0009210 |
|
| AK | Designated contracting states |
Kind code of ref document: B1 Designated state(s): AT BE BG CH CY CZ DE DK EE ES FI FR GB GR HU IE IS IT LI LT LU LV MC NL PL PT RO SE SI SK TR |
|
| REG | Reference to a national code |
Ref country code: GB Ref legal event code: FG4D |
|
| REG | Reference to a national code |
Ref country code: CH Ref legal event code: EP |
|
| REG | Reference to a national code |
Ref country code: IE Ref legal event code: FG4D Ref country code: AT Ref legal event code: REF Ref document number: 643726 Country of ref document: AT Kind code of ref document: T Effective date: 20140115 |
|
| REG | Reference to a national code |
Ref country code: DE Ref legal event code: R096 Ref document number: 602006039513 Country of ref document: DE Effective date: 20140130 |
|
| REG | Reference to a national code |
Ref country code: NL Ref legal event code: T3 |
|
| REG | Reference to a national code |
Ref country code: AT Ref legal event code: MK05 Ref document number: 643726 Country of ref document: AT Kind code of ref document: T Effective date: 20131204 |
|
| PG25 | Lapsed in a contracting state [announced via postgrant information from national office to epo] |
Ref country code: FI Free format text: LAPSE BECAUSE OF FAILURE TO SUBMIT A TRANSLATION OF THE DESCRIPTION OR TO PAY THE FEE WITHIN THE PRESCRIBED TIME-LIMIT Effective date: 20131204 Ref country code: LT Free format text: LAPSE BECAUSE OF FAILURE TO SUBMIT A TRANSLATION OF THE DESCRIPTION OR TO PAY THE FEE WITHIN THE PRESCRIBED TIME-LIMIT Effective date: 20131204 Ref country code: SE Free format text: LAPSE BECAUSE OF FAILURE TO SUBMIT A TRANSLATION OF THE DESCRIPTION OR TO PAY THE FEE WITHIN THE PRESCRIBED TIME-LIMIT Effective date: 20131204 |
|
| REG | Reference to a national code |
Ref country code: HK Ref legal event code: GR Ref document number: 1108733 Country of ref document: HK |
|
| REG | Reference to a national code |
Ref country code: DE Ref legal event code: R082 Ref document number: 602006039513 Country of ref document: DE Representative=s name: MARKS & CLERK (LUXEMBOURG) LLP, LU |
|
| REG | Reference to a national code |
Ref country code: LT Ref legal event code: MG4D |
|
| PG25 | Lapsed in a contracting state [announced via postgrant information from national office to epo] |
Ref country code: LV Free format text: LAPSE BECAUSE OF FAILURE TO SUBMIT A TRANSLATION OF THE DESCRIPTION OR TO PAY THE FEE WITHIN THE PRESCRIBED TIME-LIMIT Effective date: 20131204 Ref country code: AT Free format text: LAPSE BECAUSE OF FAILURE TO SUBMIT A TRANSLATION OF THE DESCRIPTION OR TO PAY THE FEE WITHIN THE PRESCRIBED TIME-LIMIT Effective date: 20131204 Ref country code: CY Free format text: LAPSE BECAUSE OF FAILURE TO SUBMIT A TRANSLATION OF THE DESCRIPTION OR TO PAY THE FEE WITHIN THE PRESCRIBED TIME-LIMIT Effective date: 20131204 |
|
| PG25 | Lapsed in a contracting state [announced via postgrant information from national office to epo] |
Ref country code: EE Free format text: LAPSE BECAUSE OF FAILURE TO SUBMIT A TRANSLATION OF THE DESCRIPTION OR TO PAY THE FEE WITHIN THE PRESCRIBED TIME-LIMIT Effective date: 20131204 Ref country code: IS Free format text: LAPSE BECAUSE OF FAILURE TO SUBMIT A TRANSLATION OF THE DESCRIPTION OR TO PAY THE FEE WITHIN THE PRESCRIBED TIME-LIMIT Effective date: 20140404 Ref country code: BE Free format text: LAPSE BECAUSE OF FAILURE TO SUBMIT A TRANSLATION OF THE DESCRIPTION OR TO PAY THE FEE WITHIN THE PRESCRIBED TIME-LIMIT Effective date: 20131204 |
|
| PG25 | Lapsed in a contracting state [announced via postgrant information from national office to epo] |
Ref country code: CZ Free format text: LAPSE BECAUSE OF FAILURE TO SUBMIT A TRANSLATION OF THE DESCRIPTION OR TO PAY THE FEE WITHIN THE PRESCRIBED TIME-LIMIT Effective date: 20131204 Ref country code: PT Free format text: LAPSE BECAUSE OF FAILURE TO SUBMIT A TRANSLATION OF THE DESCRIPTION OR TO PAY THE FEE WITHIN THE PRESCRIBED TIME-LIMIT Effective date: 20140404 Ref country code: SK Free format text: LAPSE BECAUSE OF FAILURE TO SUBMIT A TRANSLATION OF THE DESCRIPTION OR TO PAY THE FEE WITHIN THE PRESCRIBED TIME-LIMIT Effective date: 20131204 Ref country code: PL Free format text: LAPSE BECAUSE OF FAILURE TO SUBMIT A TRANSLATION OF THE DESCRIPTION OR TO PAY THE FEE WITHIN THE PRESCRIBED TIME-LIMIT Effective date: 20131204 Ref country code: ES Free format text: LAPSE BECAUSE OF FAILURE TO SUBMIT A TRANSLATION OF THE DESCRIPTION OR TO PAY THE FEE WITHIN THE PRESCRIBED TIME-LIMIT Effective date: 20131204 Ref country code: RO Free format text: LAPSE BECAUSE OF FAILURE TO SUBMIT A TRANSLATION OF THE DESCRIPTION OR TO PAY THE FEE WITHIN THE PRESCRIBED TIME-LIMIT Effective date: 20131204 |
|
| REG | Reference to a national code |
Ref country code: DE Ref legal event code: R097 Ref document number: 602006039513 Country of ref document: DE |
|
| PLBE | No opposition filed within time limit |
Free format text: ORIGINAL CODE: 0009261 |
|
| STAA | Information on the status of an ep patent application or granted ep patent |
Free format text: STATUS: NO OPPOSITION FILED WITHIN TIME LIMIT |
|
| PG25 | Lapsed in a contracting state [announced via postgrant information from national office to epo] |
Ref country code: DK Free format text: LAPSE BECAUSE OF FAILURE TO SUBMIT A TRANSLATION OF THE DESCRIPTION OR TO PAY THE FEE WITHIN THE PRESCRIBED TIME-LIMIT Effective date: 20131204 |
|
| 26N | No opposition filed |
Effective date: 20140905 |
|
| REG | Reference to a national code |
Ref country code: DE Ref legal event code: R097 Ref document number: 602006039513 Country of ref document: DE Effective date: 20140905 |
|
| PG25 | Lapsed in a contracting state [announced via postgrant information from national office to epo] |
Ref country code: LU Free format text: LAPSE BECAUSE OF FAILURE TO SUBMIT A TRANSLATION OF THE DESCRIPTION OR TO PAY THE FEE WITHIN THE PRESCRIBED TIME-LIMIT Effective date: 20140516 |
|
| REG | Reference to a national code |
Ref country code: CH Ref legal event code: PL |
|
| PG25 | Lapsed in a contracting state [announced via postgrant information from national office to epo] |
Ref country code: LI Free format text: LAPSE BECAUSE OF NON-PAYMENT OF DUE FEES Effective date: 20140531 Ref country code: MC Free format text: LAPSE BECAUSE OF FAILURE TO SUBMIT A TRANSLATION OF THE DESCRIPTION OR TO PAY THE FEE WITHIN THE PRESCRIBED TIME-LIMIT Effective date: 20131204 Ref country code: CH Free format text: LAPSE BECAUSE OF NON-PAYMENT OF DUE FEES Effective date: 20140531 |
|
| REG | Reference to a national code |
Ref country code: IE Ref legal event code: MM4A |
|
| PG25 | Lapsed in a contracting state [announced via postgrant information from national office to epo] |
Ref country code: SI Free format text: LAPSE BECAUSE OF FAILURE TO SUBMIT A TRANSLATION OF THE DESCRIPTION OR TO PAY THE FEE WITHIN THE PRESCRIBED TIME-LIMIT Effective date: 20131204 |
|
| PG25 | Lapsed in a contracting state [announced via postgrant information from national office to epo] |
Ref country code: IT Free format text: LAPSE BECAUSE OF FAILURE TO SUBMIT A TRANSLATION OF THE DESCRIPTION OR TO PAY THE FEE WITHIN THE PRESCRIBED TIME-LIMIT Effective date: 20131204 Ref country code: IE Free format text: LAPSE BECAUSE OF NON-PAYMENT OF DUE FEES Effective date: 20140516 |
|
| REG | Reference to a national code |
Ref country code: FR Ref legal event code: PLFP Year of fee payment: 11 |
|
| PG25 | Lapsed in a contracting state [announced via postgrant information from national office to epo] |
Ref country code: BG Free format text: LAPSE BECAUSE OF FAILURE TO SUBMIT A TRANSLATION OF THE DESCRIPTION OR TO PAY THE FEE WITHIN THE PRESCRIBED TIME-LIMIT Effective date: 20131204 |
|
| PG25 | Lapsed in a contracting state [announced via postgrant information from national office to epo] |
Ref country code: GR Free format text: LAPSE BECAUSE OF FAILURE TO SUBMIT A TRANSLATION OF THE DESCRIPTION OR TO PAY THE FEE WITHIN THE PRESCRIBED TIME-LIMIT Effective date: 20140305 |
|
| PG25 | Lapsed in a contracting state [announced via postgrant information from national office to epo] |
Ref country code: HU Free format text: LAPSE BECAUSE OF FAILURE TO SUBMIT A TRANSLATION OF THE DESCRIPTION OR TO PAY THE FEE WITHIN THE PRESCRIBED TIME-LIMIT; INVALID AB INITIO Effective date: 20060516 Ref country code: TR Free format text: LAPSE BECAUSE OF FAILURE TO SUBMIT A TRANSLATION OF THE DESCRIPTION OR TO PAY THE FEE WITHIN THE PRESCRIBED TIME-LIMIT Effective date: 20131204 |
|
| REG | Reference to a national code |
Ref country code: FR Ref legal event code: PLFP Year of fee payment: 12 |
|
| REG | Reference to a national code |
Ref country code: FR Ref legal event code: PLFP Year of fee payment: 13 |
|
| REG | Reference to a national code |
Ref country code: GB Ref legal event code: 732E Free format text: REGISTERED BETWEEN 20220804 AND 20220810 |
|
| REG | Reference to a national code |
Ref country code: DE Ref legal event code: R081 Ref document number: 602006039513 Country of ref document: DE Owner name: MICRO MOTION, INC., BOULDER, US Free format text: FORMER OWNER: DANIEL MEASUREMENT & CONTROL, INC, HOUSTON, TEX., US Ref country code: DE Ref legal event code: R082 Ref document number: 602006039513 Country of ref document: DE Representative=s name: VOSSIUS & PARTNER PATENTANWAELTE RECHTSANWAELT, DE |
|
| REG | Reference to a national code |
Ref country code: NL Ref legal event code: PD Owner name: MICRO MOTION, INC.; CA Free format text: DETAILS ASSIGNMENT: CHANGE OF OWNER(S), ASSIGNMENT; FORMER OWNER NAME: DANIEL MEASUREMENT & CONTROL, INC. Effective date: 20221223 |
|
| PGFP | Annual fee paid to national office [announced via postgrant information from national office to epo] |
Ref country code: NL Payment date: 20230419 Year of fee payment: 18 |
|
| P01 | Opt-out of the competence of the unified patent court (upc) registered |
Effective date: 20230530 |
|
| PGFP | Annual fee paid to national office [announced via postgrant information from national office to epo] |
Ref country code: FR Payment date: 20230420 Year of fee payment: 18 Ref country code: DE Payment date: 20230419 Year of fee payment: 18 |
|
| PGFP | Annual fee paid to national office [announced via postgrant information from national office to epo] |
Ref country code: GB Payment date: 20230420 Year of fee payment: 18 |