EP1848983B1 - Fluorescence correlation microscopy with real-time alignment readout - Google Patents
Fluorescence correlation microscopy with real-time alignment readout Download PDFInfo
- Publication number
- EP1848983B1 EP1848983B1 EP05736243A EP05736243A EP1848983B1 EP 1848983 B1 EP1848983 B1 EP 1848983B1 EP 05736243 A EP05736243 A EP 05736243A EP 05736243 A EP05736243 A EP 05736243A EP 1848983 B1 EP1848983 B1 EP 1848983B1
- Authority
- EP
- European Patent Office
- Prior art keywords
- fluorescence
- confocal
- detector
- image
- microscope
- Prior art date
- Legal status (The legal status is an assumption and is not a legal conclusion. Google has not performed a legal analysis and makes no representation as to the accuracy of the status listed.)
- Expired - Fee Related
Links
- 238000000386 microscopy Methods 0.000 title description 2
- 238000005259 measurement Methods 0.000 claims description 25
- 239000000835 fiber Substances 0.000 claims description 14
- 230000035945 sensitivity Effects 0.000 claims description 14
- 238000001514 detection method Methods 0.000 claims description 11
- 230000005284 excitation Effects 0.000 claims description 11
- 230000003287 optical effect Effects 0.000 claims description 10
- 238000003384 imaging method Methods 0.000 claims description 8
- 238000000034 method Methods 0.000 claims description 8
- 239000013307 optical fiber Substances 0.000 claims description 7
- 239000003086 colorant Substances 0.000 claims description 3
- 238000013461 design Methods 0.000 claims description 3
- 230000008569 process Effects 0.000 claims description 2
- 230000003213 activating effect Effects 0.000 claims 1
- 238000001914 filtration Methods 0.000 claims 1
- 238000002060 fluorescence correlation spectroscopy Methods 0.000 description 48
- 239000000523 sample Substances 0.000 description 8
- 239000012528 membrane Substances 0.000 description 7
- 239000000872 buffer Substances 0.000 description 6
- 238000009792 diffusion process Methods 0.000 description 6
- 238000012545 processing Methods 0.000 description 5
- VOFUROIFQGPCGE-UHFFFAOYSA-N nile red Chemical compound C1=CC=C2C3=NC4=CC=C(N(CC)CC)C=C4OC3=CC(=O)C2=C1 VOFUROIFQGPCGE-UHFFFAOYSA-N 0.000 description 4
- 210000004027 cell Anatomy 0.000 description 3
- 238000010226 confocal imaging Methods 0.000 description 3
- 239000000243 solution Substances 0.000 description 3
- FAPWRFPIFSIZLT-UHFFFAOYSA-M Sodium chloride Chemical compound [Na+].[Cl-] FAPWRFPIFSIZLT-UHFFFAOYSA-M 0.000 description 2
- XAGFODPZIPBFFR-UHFFFAOYSA-N aluminium Chemical compound [Al] XAGFODPZIPBFFR-UHFFFAOYSA-N 0.000 description 2
- 229910052782 aluminium Inorganic materials 0.000 description 2
- 239000004411 aluminium Substances 0.000 description 2
- 238000004458 analytical method Methods 0.000 description 2
- 238000004624 confocal microscopy Methods 0.000 description 2
- 210000000805 cytoplasm Anatomy 0.000 description 2
- 238000010586 diagram Methods 0.000 description 2
- 238000005516 engineering process Methods 0.000 description 2
- 239000002245 particle Substances 0.000 description 2
- JKMHFZQWWAIEOD-UHFFFAOYSA-N 2-[4-(2-hydroxyethyl)piperazin-1-yl]ethanesulfonic acid Chemical compound OCC[NH+]1CCN(CCS([O-])(=O)=O)CC1 JKMHFZQWWAIEOD-UHFFFAOYSA-N 0.000 description 1
- WQZGKKKJIJFFOK-GASJEMHNSA-N Glucose Natural products OC[C@H]1OC(O)[C@H](O)[C@@H](O)[C@@H]1O WQZGKKKJIJFFOK-GASJEMHNSA-N 0.000 description 1
- 239000007995 HEPES buffer Substances 0.000 description 1
- 239000007836 KH2PO4 Substances 0.000 description 1
- 238000009825 accumulation Methods 0.000 description 1
- 230000003416 augmentation Effects 0.000 description 1
- LLSDKQJKOVVTOJ-UHFFFAOYSA-L calcium chloride dihydrate Chemical compound O.O.[Cl-].[Cl-].[Ca+2] LLSDKQJKOVVTOJ-UHFFFAOYSA-L 0.000 description 1
- 210000000170 cell membrane Anatomy 0.000 description 1
- 230000008859 change Effects 0.000 description 1
- 150000001875 compounds Chemical class 0.000 description 1
- 238000005100 correlation spectroscopy Methods 0.000 description 1
- 230000001419 dependent effect Effects 0.000 description 1
- 238000001917 fluorescence detection Methods 0.000 description 1
- 238000002073 fluorescence micrograph Methods 0.000 description 1
- 238000000799 fluorescence microscopy Methods 0.000 description 1
- 239000008103 glucose Substances 0.000 description 1
- XLYOFNOQVPJJNP-ZSJDYOACSA-N heavy water Substances [2H]O[2H] XLYOFNOQVPJJNP-ZSJDYOACSA-N 0.000 description 1
- 238000007654 immersion Methods 0.000 description 1
- WRUGWIBCXHJTDG-UHFFFAOYSA-L magnesium sulfate heptahydrate Chemical compound O.O.O.O.O.O.O.[Mg+2].[O-]S([O-])(=O)=O WRUGWIBCXHJTDG-UHFFFAOYSA-L 0.000 description 1
- 239000000203 mixture Substances 0.000 description 1
- 238000012986 modification Methods 0.000 description 1
- 230000004048 modification Effects 0.000 description 1
- VYQNWZOUAUKGHI-UHFFFAOYSA-N monobenzone Chemical group C1=CC(O)=CC=C1OCC1=CC=CC=C1 VYQNWZOUAUKGHI-UHFFFAOYSA-N 0.000 description 1
- 229910000402 monopotassium phosphate Inorganic materials 0.000 description 1
- 230000037361 pathway Effects 0.000 description 1
- 230000000737 periodic effect Effects 0.000 description 1
- GNSKLFRGEWLPPA-UHFFFAOYSA-M potassium dihydrogen phosphate Chemical compound [K+].OP(O)([O-])=O GNSKLFRGEWLPPA-UHFFFAOYSA-M 0.000 description 1
- 239000001044 red dye Substances 0.000 description 1
- 238000002500 scanning fluorescence correlation spectroscopy Methods 0.000 description 1
- 238000004557 single molecule detection Methods 0.000 description 1
- 239000011780 sodium chloride Substances 0.000 description 1
- 238000004611 spectroscopical analysis Methods 0.000 description 1
- 230000002123 temporal effect Effects 0.000 description 1
- 238000012360 testing method Methods 0.000 description 1
- 238000013519 translation Methods 0.000 description 1
- 238000012795 verification Methods 0.000 description 1
- 230000000007 visual effect Effects 0.000 description 1
- XLYOFNOQVPJJNP-UHFFFAOYSA-N water Substances O XLYOFNOQVPJJNP-UHFFFAOYSA-N 0.000 description 1
Images


Classifications
-
- G—PHYSICS
- G01—MEASURING; TESTING
- G01N—INVESTIGATING OR ANALYSING MATERIALS BY DETERMINING THEIR CHEMICAL OR PHYSICAL PROPERTIES
- G01N21/00—Investigating or analysing materials by the use of optical means, i.e. using sub-millimetre waves, infrared, visible or ultraviolet light
- G01N21/62—Systems in which the material investigated is excited whereby it emits light or causes a change in wavelength of the incident light
- G01N21/63—Systems in which the material investigated is excited whereby it emits light or causes a change in wavelength of the incident light optically excited
- G01N21/64—Fluorescence; Phosphorescence
- G01N21/645—Specially adapted constructive features of fluorimeters
- G01N21/6456—Spatial resolved fluorescence measurements; Imaging
- G01N21/6458—Fluorescence microscopy
-
- G—PHYSICS
- G01—MEASURING; TESTING
- G01J—MEASUREMENT OF INTENSITY, VELOCITY, SPECTRAL CONTENT, POLARISATION, PHASE OR PULSE CHARACTERISTICS OF INFRARED, VISIBLE OR ULTRAVIOLET LIGHT; COLORIMETRY; RADIATION PYROMETRY
- G01J1/00—Photometry, e.g. photographic exposure meter
- G01J1/42—Photometry, e.g. photographic exposure meter using electric radiation detectors
- G01J1/44—Electric circuits
- G01J1/46—Electric circuits using a capacitor
-
- G—PHYSICS
- G01—MEASURING; TESTING
- G01N—INVESTIGATING OR ANALYSING MATERIALS BY DETERMINING THEIR CHEMICAL OR PHYSICAL PROPERTIES
- G01N21/00—Investigating or analysing materials by the use of optical means, i.e. using sub-millimetre waves, infrared, visible or ultraviolet light
- G01N21/17—Systems in which incident light is modified in accordance with the properties of the material investigated
- G01N2021/1738—Optionally different kinds of measurements; Method being valid for different kinds of measurement
-
- G—PHYSICS
- G01—MEASURING; TESTING
- G01N—INVESTIGATING OR ANALYSING MATERIALS BY DETERMINING THEIR CHEMICAL OR PHYSICAL PROPERTIES
- G01N21/00—Investigating or analysing materials by the use of optical means, i.e. using sub-millimetre waves, infrared, visible or ultraviolet light
- G01N21/62—Systems in which the material investigated is excited whereby it emits light or causes a change in wavelength of the incident light
- G01N21/63—Systems in which the material investigated is excited whereby it emits light or causes a change in wavelength of the incident light optically excited
- G01N21/64—Fluorescence; Phosphorescence
- G01N2021/6417—Spectrofluorimetric devices
- G01N2021/6421—Measuring at two or more wavelengths
-
- G—PHYSICS
- G01—MEASURING; TESTING
- G01N—INVESTIGATING OR ANALYSING MATERIALS BY DETERMINING THEIR CHEMICAL OR PHYSICAL PROPERTIES
- G01N21/00—Investigating or analysing materials by the use of optical means, i.e. using sub-millimetre waves, infrared, visible or ultraviolet light
- G01N21/62—Systems in which the material investigated is excited whereby it emits light or causes a change in wavelength of the incident light
- G01N21/63—Systems in which the material investigated is excited whereby it emits light or causes a change in wavelength of the incident light optically excited
- G01N21/64—Fluorescence; Phosphorescence
- G01N21/645—Specially adapted constructive features of fluorimeters
- G01N2021/6484—Optical fibres
-
- G—PHYSICS
- G01—MEASURING; TESTING
- G01N—INVESTIGATING OR ANALYSING MATERIALS BY DETERMINING THEIR CHEMICAL OR PHYSICAL PROPERTIES
- G01N2201/00—Features of devices classified in G01N21/00
- G01N2201/02—Mechanical
- G01N2201/022—Casings
- G01N2201/0221—Portable; cableless; compact; hand-held
Definitions
- Fluorescence correlation spectroscopy was invented by Magde, Elson, and Webb in 1972.
- Marvin Minsky introduced the stage-scanning confocal microscope in 1957.
- Confocal laser-scanning microscope was developed by Aslund et al.
- an augmentation of confocal microscope was developed by Webb and coworkers.
- Gratton and coworkers performed FCS with two-photon excitation in 1995.
- Jovin and coworkers effectively combined a stage scanning microscope and a fluorescence correlation spectrometer in year 1998. Combination of confocal microscope and FCS is now available from multiple commercial vendors as described later in the text.
- FCS fluorescence detection in FCS needs to be highly sensitive; essentially, a single molecule detection sensitivity is desired.
- FCS unit is pre-aligned to a fixed spot in the object space whose coordinates are stored in the computer.
- a high resolution motorized specimen stage moves that location of the specimen to this pre-aligned fixed location. Collection efficiency of FCS unit is good as the path length of the fluorescence from the specimen to the detector is small. Also light does not pass through too many optical elements, so reflection losses are kept to a minimum, improving the collection efficiency.
- the second commercially available instrument viz Leica TCS SP scanhead® with FCS extension uses the first method.
- the fluorescence for FCS is collected after it traverses through the confocal aperture in the scanning unit. Since the fluorescence reaches both the confocal imaging detector and the FCS detector after it has passed through the same aperture, it is likely that the alignment between these two detectors are reliably maintained. So directly the excitation beam can be parked at any location of the specimen and an FCS measurement can be obtained from there. It doesn't need any high resolution automated stage.
- Fluorescence passes through the scanning optics, and many other optics in the confocal scanning unit, which lowers the sensitivity of FCS.
- the path length to the detector is long, which further lowers sensitivity for scattering specimens. Also, non-descanned multiphoton measurement cannot be performed.
- the third commercially available instrument is ALBA FCS® from ISS. This employs scheme number 3.
- the positioning of the detectors can be accurate and the beam need not pass through scanning optics, as there are no scanning optics in the instrument.
- a major drawback of this scheme is the slow rate at which the images are acquired.
- a heavy microscope stage moves at a much slower rate than a scanning mirror. This is precisely the problem that was solved by the invention of laser scanning by Aslund.
- US patent application 20020121610 describes a fluorescence correaltion spectroscopy module for a microscope which has a separate FCS detection unit where a pinhole array is stably pre-aligned with, and can be connected with a typical fluorescence microscope.
- US 5,815,262 teaches an apparatus for carrying out laser-induced two-photon fluorescence correlation spectroscopy (TPA-FCS), in which a plurality of volumes (6) are delimited or defined in the apparatus in such a way that samples (3) introduced into these volumes can be excited and observed in parallel by means of a single laser (1).
- TPA-FCS laser-induced two-photon fluorescence correlation spectroscopy
- DE 100 08 594 A1 discloses a method and an arrangement for detecting light emitted from a probe, in which FCS analysis results are used for image generation.
- the main objective of the present invention is to propose a high sensitivity confocal florescence correlation microscope instrument which provides an automatic real time read out of the location where FCS measurement would be performed.
- Yet another object of the present invention is to propose an instrument which does not rely for its sensitivity on the accuracy and stability of a prior alignment.
- Still another object of the present invention is to propose an instrument whose optical path length is small.
- Further object of the present invention is to propose an instrument wherein fluorescence goes directly to a separate FCS unit without much reflection losses thus ensuring high sensitivity of the system.
- Yet further object of the present invention is to propose an instrument which does not require the automated high accuracy translation stage thereby to reduce the cost and complexity of the instrument.
- Still further object of the present invention is to propose an instrument by which high sensitivity confocal detection can be performed without change in the alignment of the detection path.
- Another object of the present invention is to propose an instrument which can be used to determine the point spread function of confocal microscope inside the actual specimen.
- Yet another object of the present invention is to propose an instrument which is comparatively smaller in size.
- Still another object of the present invention is to propose an instrument in which there is minimal loss of fluorescence signal due to scattering and reflection in scanning optics.
- Still another object of the present invention is to have a continuous visual display of the location in a confocal image where the FCS measurement can be performed.
- a confocal fluorescence correlation microscope comprising a combination of fluorescence confocal microscope providing 3-D fluorescence images of the sample with the resolution of the wavelength of the laser light and a fluorescence correlation spectroscope for FCS measurement of the size of fluorescent articles present within the imaged area of the specimen.
- the present invention relates to a high sensitivity a confocal fluorescence correlation microscope for real time alignment read out of a confocal image for performing FCS measurement of a specimen as defined in claim 1.
- the at least one fluorescence detector is preferably an APD detector.
- the correlator and signal processor preferably comprise a digital correlator, which accepts the output of the detector (preferably through an electronic buffer circuitry to protect the detector) for performing FCS measurements.
- the present invention also relates to a process for FCS measurement with the confocal fluorescence correlation microscope of claim 1 comprising: of the steps defined in claim 8.
- the reflected fraction is split into more than one part for multicolor detection, with each part following the design outlined above.
- the beam splitter as shown in figure 1 splits the signal fluorescence light into two parts. One part travels to the apertured detector for FCS, the other to the imaging detectors of the confocal microscope.
- the splitting ratio of the splitter (for fluorescence light) can vary such that between 10% to 70% of the light goes to the imaging detector. A smaller ratio (towards 10%) makes the image quality poorer and the FCS data quality better, and, vice versa.
- the splitting mirror may be colour dependent.
- the splitter should pass more than 25% of the light, and ideally should pass as close to 100% of the light as practicable.
- the angle that the beam splitter makes with the fluorescence beam coming from the objective lens should be around 45 degree for best results, but angles between 30 to 60 degrees would work.
- the figure 2 shows the detector, which should preferably be of the single: photon counting type. It should be able to produce an electrical (either voltage or current) pulse for each photon detected. Better detection efficiency (usually termed the quantum efficiency of the detector) would yield betted results, but a detection efficiency of at least 10% is required for satisfactory operation.
- the detector should be fast, that is, a photon arriving after a microsecond (or later) after the previous photon should be detectable as a separate photon by the detector counting amongst the currently available technologies, a single photon counting avalanche photodiode with up to 70% detection efficiency best suits the requirements of the apparatus.
- the detector should have low inherent noise, and it should not count more than 1000 photons per second in absence of a real signal.
- the detector signal output is fed in parallel to the signal processing unit for performing the autocorrelation, and to an input channel of the confocal imagine microscope.
- a typical confocal microscope has multiple detection channels, which can receive signals from its own “internal” photodetectors, or optionally, also from external photodetectors.
- the confocal microscope used in conjunction with this apparatus has (at least) one of its channels connected to the "internal" detector that receives one part of the signal that is split by the splitter. Another channel receives signal from the apertured FCS detector that is a part of this apparatus and which receives the reflected part of the fluorescence signal.
- the data professing machinery of the confocal detector displays the signal received from both of these channels as separate images.
- the image from the internal detector is similar (albeit less bright due to splitting) to the image that would normally (that is without our apparatus attached to the confocal microscope) be obtained from the same specimen.
- the image from the other detector consists of a spot, due to the fact that the signal beam is scanning infront of the fiber face, which is coupled to the FCS detector.
- the image processing abilities of the confocal microscope is utilized to merge these two images together, which reports the location of the aperture with respect to the specimen.
- one preferred embodiment of the present invention consists of a confocal scanner (MRC 600, Bio-Rad) coupled with an inverted microscope (eclipse TE300, Nikon, Japan) and a He:Ne laser (1.2 mW at 543.5 nm, Jain Laser Technology, India) for excitation.
- MRC 600 Bio-Rad
- an inverted microscope eclipse TE300, Nikon, Japan
- He:Ne laser 1.2 mW at 543.5 nm, Jain Laser Technology, India
- a dichroic 560DCLP, Chroma Inc.
- the FCS detection housing has an aluminium plate containing the fiber which is kept within approximately 0.5 mm of the focus plane.
- the FCS housing is an aluminium cylinder that holds the achromat lens and a filter (HQ645/110, Chroma Inc.).
- the fiber is coupled to a single photon counting avalanche photodiode (APD) detector (SPCM-AQR-150, Perkin-Elmer).
- APD avalanche photodiode
- SPCM-AQR-150 Perkin-Elmer
- the rest 70% of the fluorescence reaches the normal detector of the confocal microscope after traveling back through the galvanometric scanning mirrors and an emission filter (D625/30, Chroma Inc.) ( Fig.1 )
- Images are taken from both the channels (the APD and the internal confocal PMT detector) simultaneously and merged ( Fig. 2 ).
- the sample is positioned so that the APD spot falls on a part of the membrane that is not very bright, in order to have a low number of fluorophores in the probe volume.
- the output of the APD is fed to the digital autocorrelator (ALV-5000, ALV-Laser V.m-b.H, Germany) and an FCS measurement, is performed.
- ALV-5000 ALV-Laser V.m-b.H, Germany
- the principle behind the FCS measurement is as follows.
- the fluorescence collected from the specimen by the objective lens is split with a beam splitter, placed in the microscope 'slider' assembly at the base of the objective ( Fig. 1 ).
- the transmitted fraction travels back to the normal confocal detector through the scanning mirrors and the pinhole. This is used for generating the confocal image in one of the imaging channels.
- the reflected fraction of the fluorescence is focused with a lens.
- the plane of focus contains an optical fiber (with a diameter approximately equal to the Airy disc of the focused spot) at an arbitrary location.
- the light from the fiber is coupled into a high sensitivity detector whose output is fed separately to one of the input channels of the confocal microscope, and in parallel to a hardware signal correlator.
- the confocal excitation beam scans the object plane
- the focused fluorescence spot also scans the transverse image plane containing the fiber face.
- the focus moves through the fixed fiber face, generating a momentary signal. Therefore the image from the fiber channel consists only of a small spot, while the fraction which goes to the confocal system generates the full image of the object.
- the images from the two channels are merged, it shows a normal confocal image with a spot on it.
- this spot can be moved in real time to any desired location of the image by manually moving the sample stage.
- the location of the spot is read from the image and the scanning beam is parked at this location. Since the spot automatically marks the location that the collecting fiber is confocally aligned to, the output of the hardware correlator now provides the FCS measurement at this location.
- This scheme thus achieves automatic FCS alignment by exploiting the capability of parking individual scanning mirrors of the confocal microscope to any desired position, obviating the need for a separate mechanized stage. But most importantly, it provides a real time feedback for the location of the sample where the FCS measurement would be done. This principle is also applicable for a multiphoton microscope.
- RN46A Cells were incubated in 10nM Nile red contained in Thomson's buffer (composition in mM:HEPES 20, Na 2 HPO 4 .2H 2 O 0.3, KH 2 PO 4 0.4. NaCl 146.1, KCl 5.4, CaCl 2 .2H 2 O 1.8 MgSO 4 .7H 2 O 0.8, glucose 5.0) for three minutes, and then washed thrice with clear buffer.
- Thomson's buffer composition in mM:HEPES 20, Na 2 HPO 4 .2H 2 O 0.3, KH 2 PO 4 0.4. NaCl 146.1, KCl 5.4, CaCl 2 .2H 2 O 1.8 MgSO 4 .7H 2 O 0.8, glucose 5.0
- Fig. 5 shows the image of the cells (green) together with the spot (red) formed by the pinholed eternal APD detector. The beam is then parked at this location.
- a 60 second (three runs) accumulation of the data yields the autocorrelation curves as shown in Fig. 6 .
- the figure shows two curves: one (dash) for 5 nM Nile red solution in the buffer (above the cells) and another (dash dot) is for a location on the cell membrane.
- the curve is fitted by the MEMFCS analysis routine ( Fig. 6 inset). This routine fits the data to the widest possible distribution of diffusion times that is consistent with the errors in the data, eliminating bias in the fitting routine.
Landscapes
- Health & Medical Sciences (AREA)
- Nuclear Medicine, Radiotherapy & Molecular Imaging (AREA)
- Physics & Mathematics (AREA)
- Life Sciences & Earth Sciences (AREA)
- Chemical & Material Sciences (AREA)
- Analytical Chemistry (AREA)
- Biochemistry (AREA)
- General Health & Medical Sciences (AREA)
- General Physics & Mathematics (AREA)
- Immunology (AREA)
- Pathology (AREA)
- Microscoopes, Condenser (AREA)
- Investigating, Analyzing Materials By Fluorescence Or Luminescence (AREA)
Description
- This invention relates to a confocal fluorescence correlation microscope with real-time alignment read out, wherein the confocal microscope can be a typical confocal or multiphoton microscope. Fluorescence correlation spectroscopy is used to measure the size of the particles diffusing in the solution down to sub-nanometer resolution. Confocal fluorescence correlation microscope gives 3-D images of the specimen under test with the resolution of the wavelength of the laser light (usually hundreds of nanometers) used for imaging. Combination of these two devices makes an instrument with which it is possible to do confocal imaging together with the particle size determination at a chosen location in the specimen. It is popularly known as confocal fluorescence correlation microscopy.
- Fluorescence correlation spectroscopy (FCS) was invented by Magde, Elson, and Webb in 1972. Marvin Minsky introduced the stage-scanning confocal microscope in 1957. Confocal laser-scanning microscope was developed by Aslund et al. Later, an augmentation of confocal microscope, the so called multiphoton microscope, was developed by Webb and coworkers. Gratton and coworkers performed FCS with two-photon excitation in 1995. Jovin and coworkers effectively combined a stage scanning microscope and a fluorescence correlation spectrometer in year 1998. Combination of confocal microscope and FCS is now available from multiple commercial vendors as described later in the text.
- There are three main challenges in combining a confocal microscope with a fluorescence correlation spectrometer. First, the fluorescence detection in FCS needs to be highly sensitive; essentially, a single molecule detection sensitivity is desired.
- This is typically not possible in a confocal microscope. Secondly, when a location is chosen from the confocal image for FCS study, it needs to be ensured that the FCS measurement is actually performed at that chosen location. Finally, the optical design needs to be versatile enough so that it is applicable for both confocal and multiphoton excitation.
- There are three demonstrated ways of combining confocal microscopy with fluorescence correlation spectroscopy.
- (1) Using the same fluorescence pathway as the confocal microscopy. Only the confocal microscope detector is typically replaced with a higher sensitivity detector. In this scheme the fluorescence passes through the scanning optics of the confocal microscope unit. In one implementation, a sliding mirror switches the fluorescence between the confocal imaging detector and the FCS detector, according to what is needed.
- (2) Using a separate FCS unit as, for example, in
DE 100 08 594 A1 - (3) Using a stage scanning confocal microscope unit. No laser beam scanning is employed in this scheme.
- There are at least three commercially available systems:
- In the first instrument viz
- Zeiss ConfoCor® 2/LSM 510 combi, from Carl Zeiss, Germany the second method is used. The FCS unit is pre-aligned to a fixed spot in the object space whose coordinates are stored in the computer. When the user chooses a location in the confocal image for FCS measurements, a high resolution motorized specimen stage moves that location of the specimen to this pre-aligned fixed location. Collection efficiency of FCS unit is good as the path length of the fluorescence from the specimen to the detector is small. Also light does not pass through too many optical elements, so reflection losses are kept to a minimum, improving the collection efficiency.
- However, this system suffers from the following disadvantages:
- (i) In this scheme one has to rely on the stability of the fixed alignment between the confocal and the FCS units, as there is no real verification of where exactly the measurement would be carried out. This "fixed" alignment needs periodic calibration.
- (ii) It needs to use a high resolution automated stage which increases the cost and complexity of the instrument.
- (iii) It cannot combine confocal and "non-descanned" (i.e. higher sensitivity) multiphoton detection.
- The second commercially available instrument viz Leica TCS SP scanhead® with FCS extension uses the first method. The fluorescence for FCS is collected after it traverses through the confocal aperture in the scanning unit. Since the fluorescence reaches both the confocal imaging detector and the FCS detector after it has passed through the same aperture, it is likely that the alignment between these two detectors are reliably maintained. So directly the excitation beam can be parked at any location of the specimen and an FCS measurement can be obtained from there. It doesn't need any high resolution automated stage.
- However, this instrument also suffers from the following drawback.
- Fluorescence passes through the scanning optics, and many other optics in the confocal scanning unit, which lowers the sensitivity of FCS. The path length to the detector is long, which further lowers sensitivity for scattering specimens. Also, non-descanned multiphoton measurement cannot be performed.
- The third commercially available instrument is ALBA FCS® from ISS. This employs
scheme number 3. The positioning of the detectors can be accurate and the beam need not pass through scanning optics, as there are no scanning optics in the instrument. - A major drawback of this scheme is the slow rate at which the images are acquired. A heavy microscope stage moves at a much slower rate than a scanning mirror. This is precisely the problem that was solved by the invention of laser scanning by Aslund.
-
US patent application 20020121610 describes a fluorescence correaltion spectroscopy module for a microscope which has a separate FCS detection unit where a pinhole array is stably pre-aligned with, and can be connected with a typical fluorescence microscope. -
US 5,815,262 teaches an apparatus for carrying out laser-induced two-photon fluorescence correlation spectroscopy (TPA-FCS), in which a plurality of volumes (6) are delimited or defined in the apparatus in such a way that samples (3) introduced into these volumes can be excited and observed in parallel by means of a single laser (1). Such an apparatus can be used to screen active compounds. -
DE 100 08 594 A1 - The main objective of the present invention is to propose a high sensitivity confocal florescence correlation microscope instrument which provides an automatic real time read out of the location where FCS measurement would be performed.
- Yet another object of the present invention is to propose an instrument which does not rely for its sensitivity on the accuracy and stability of a prior alignment.
- Still another object of the present invention is to propose an instrument whose optical path length is small.
- Further object of the present invention is to propose an instrument wherein fluorescence goes directly to a separate FCS unit without much reflection losses thus ensuring high sensitivity of the system.
- Yet further object of the present invention is to propose an instrument which does not require the automated high accuracy translation stage thereby to reduce the cost and complexity of the instrument.
- Still further object of the present invention is to propose an instrument by which high sensitivity confocal detection can be performed without change in the alignment of the detection path.
- Another object of the present invention is to propose an instrument which can be used to determine the point spread function of confocal microscope inside the actual specimen.
- Yet another object of the present invention is to propose an instrument which is comparatively smaller in size.
- Still another object of the present invention is to propose an instrument in which there is minimal loss of fluorescence signal due to scattering and reflection in scanning optics.
- Still another object of the present invention is to have a continuous visual display of the location in a confocal image where the FCS measurement can be performed.
- Further objects and advantages of the present invention will be apparent from the following detailed description.
- According to the present invention which is defined by the claims there is provided a confocal fluorescence correlation microscope comprising a combination of fluorescence confocal microscope providing 3-D fluorescence images of the sample with the resolution of the wavelength of the laser light and a fluorescence correlation spectroscope for FCS measurement of the size of fluorescent articles present within the imaged area of the specimen.
- The present invention relates to a high sensitivity a confocal fluorescence correlation microscope for real time alignment read out of a confocal image for performing FCS mesurement of a specimen as defined in
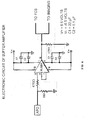
claim 1. The at least one fluorescence detector is preferably an APD detector. The correlator and signal processor preferably comprise a digital correlator, which accepts the output of the detector (preferably through an electronic buffer circuitry to protect the detector) for performing FCS measurements. - The present invention also relates to a process for FCS measurement with the confocal fluorescence correlation microscope of
claim 1 comprising: of the steps defined in claim 8. - In a preferred embodiment of the invention, the reflected fraction is split into more than one part for multicolor detection, with each part following the design outlined above.
- At the onset of the description, which follows it is to be understood that the ensuing description only illustrates a particular form of a preferred embodiment of this invention. However, such a particular form is only an exemplary embodiment and without intending to be understood as exemplary teaching of invention and not intended to be taken restrictively.
-
- According to the preferred embodiment, the present invention is illustrated through the following drawings:
-
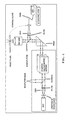
Fig. 1 gives the schematic diagram of the confocal correlation microscope. -
Fig. 2 gives the schematic diagram of the novel features. -
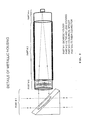
Fig. 3 gives the details of metallic housing containing dichroic, filter, lens and the fiber holder. -
Fig. 4 gives the details of the electronic buffer circuit which is preferably used for protecting the detector. -
Fig. 5 shows an example of the merged image from FCS and imaging detectors. -
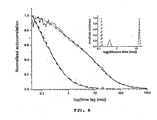
Fig. 6 gives an example of the graphical representation of correlation data and fits obtained from the specimen.
-
- The beam splitter as shown in
figure 1 splits the signal fluorescence light into two parts. One part travels to the apertured detector for FCS, the other to the imaging detectors of the confocal microscope. The splitting ratio of the splitter (for fluorescence light) can vary such that between 10% to 70% of the light goes to the imaging detector. A smaller ratio (towards 10%) makes the image quality poorer and the FCS data quality better, and, vice versa. The splitting mirror may be colour dependent. For the excitation light, the splitter should pass more than 25% of the light, and ideally should pass as close to 100% of the light as practicable. The angle that the beam splitter makes with the fluorescence beam coming from the objective lens should be around 45 degree for best results, but angles between 30 to 60 degrees would work. Thefigure 2 shows the detector, which should preferably be of the single: photon counting type. It should be able to produce an electrical (either voltage or current) pulse for each photon detected. Better detection efficiency (usually termed the quantum efficiency of the detector) would yield betted results, but a detection efficiency of at least 10% is required for satisfactory operation. The detector should be fast, that is, a photon arriving after a microsecond (or later) after the previous photon should be detectable as a separate photon by the detector counting amongst the currently available technologies, a single photon counting avalanche photodiode with up to 70% detection efficiency best suits the requirements of the apparatus. The detector should have low inherent noise, and it should not count more than 1000 photons per second in absence of a real signal. - The Autocorrelator or the signal processing unit as shown in
figure 2 should be able to record the signal from the detector and communicate these results to a personal computer. The comupter should be able to accept data at a high rate, at least a 100,000 inputs per second, from the detector. The computer itself, or digital signal processing board, performs an autocorrelation of the detected temporal pattern of the photons (as defined in Maiti et al., Proc. Natl. Acad. Sci. USA, 1997). Currently, a digital signal processing board able to perform a fast autocorrelation is the best option. - The detector signal output is fed in parallel to the signal processing unit for performing the autocorrelation, and to an input channel of the confocal imagine microscope. A typical confocal microscope has multiple detection channels, which can receive signals from its own "internal" photodetectors, or optionally, also from external photodetectors. The confocal microscope used in conjunction with this apparatus has (at least) one of its channels connected to the "internal" detector that receives one part of the signal that is split by the splitter. Another channel receives signal from the apertured FCS detector that is a part of this apparatus and which receives the reflected part of the fluorescence signal. The data professing machinery of the confocal detector displays the signal received from both of these channels as separate images. The image from the internal detector is similar (albeit less bright due to splitting) to the image that would normally (that is without our apparatus attached to the confocal microscope) be obtained from the same specimen. The image from the other detector consists of a spot, due to the fact that the signal beam is scanning infront of the fiber face, which is coupled to the FCS detector. The image processing abilities of the confocal microscope is utilized to merge these two images together, which reports the location of the aperture with respect to the specimen.
- In accordance with the present invention one preferred embodiment of the present invention consists of a confocal scanner (MRC 600, Bio-Rad) coupled with an inverted microscope (eclipse TE300, Nikon, Japan) and a He:Ne laser (1.2 mW at 543.5 nm, Jain Laser Technology, India) for excitation. In the confocal scanner a dichroic (560DCLP, Chroma Inc.) is used to separate the excitation and the emission beams. The fluorescence is split for FCS just before the objective lens (60X, 1.2 NA, water immersion, Plan-Apo, Nikon, Japan) with a 70/30 beam splitter (Chroma Inc.) placed in the dichroic "slider" box of the microscope 30% of the fluorescence is focussed with an achromat lens (F =250 mm, Newport, USA) onto a plane containing a 60 µm core diameter multimode optical fiber (Newport, USA). The FCS detection housing has an aluminium plate containing the fiber which is kept within approximately 0.5 mm of the focus plane. The FCS housing is an aluminium cylinder that holds the achromat lens and a filter (HQ645/110, Chroma Inc.). The fiber is coupled to a single photon counting avalanche photodiode (APD) detector (SPCM-AQR-150, Perkin-Elmer). The rest 70% of the fluorescence reaches the normal detector of the confocal microscope after traveling back through the galvanometric scanning mirrors and an emission filter (D625/30, Chroma Inc.) (
Fig.1 ) Images are taken from both the channels (the APD and the internal confocal PMT detector) simultaneously and merged (Fig. 2 ). The sample is positioned so that the APD spot falls on a part of the membrane that is not very bright, in order to have a low number of fluorophores in the probe volume. Location of the spot is read by the software and the beam is parked to the same point in the sample. The output of the APD is fed to the digital autocorrelator (ALV-5000, ALV-Laser V.m-b.H, Germany) and an FCS measurement, is performed. - The principle behind the FCS measurement is as follows. The fluorescence collected from the specimen by the objective lens is split with a beam splitter, placed in the microscope 'slider' assembly at the base of the objective (
Fig. 1 ). The transmitted fraction travels back to the normal confocal detector through the scanning mirrors and the pinhole. This is used for generating the confocal image in one of the imaging channels. The reflected fraction of the fluorescence is focused with a lens. The plane of focus contains an optical fiber (with a diameter approximately equal to the Airy disc of the focused spot) at an arbitrary location. The light from the fiber is coupled into a high sensitivity detector whose output is fed separately to one of the input channels of the confocal microscope, and in parallel to a hardware signal correlator. While the confocal excitation beam scans the object plane, the focused fluorescence spot also scans the transverse image plane containing the fiber face. During each X-Y scan, the focus moves through the fixed fiber face, generating a momentary signal. Therefore the image from the fiber channel consists only of a small spot, while the fraction which goes to the confocal system generates the full image of the object. When the images from the two channels are merged, it shows a normal confocal image with a spot on it. While the imaging is going on, this spot can be moved in real time to any desired location of the image by manually moving the sample stage. For performing the FCS measurement, the location of the spot is read from the image and the scanning beam is parked at this location. Since the spot automatically marks the location that the collecting fiber is confocally aligned to, the output of the hardware correlator now provides the FCS measurement at this location. This scheme thus achieves automatic FCS alignment by exploiting the capability of parking individual scanning mirrors of the confocal microscope to any desired position, obviating the need for a separate mechanized stage. But most importantly, it provides a real time feedback for the location of the sample where the FCS measurement would be done. This principle is also applicable for a multiphoton microscope. - Modifications can be made in following parts:
- i) Filters: Multiple filters can be used instead of a single one. This may be necessary to make the rejection of background light stronger in some cases.
- ii) The confocal microscope can be a "typical confocal", or a "multiphoton microscope".
- iii) There can be multiple detectors detecting different emission colours separately. This can be achieved by adding a second splitter in our apparatus which can separate two different colours emanating from the specimen. Then an autocorrelation can be performed on each individual channels, and/or a cross-correlation can be performed on the two signals obtained from the two detectors.
- RN46A Cells were incubated in 10nM Nile red contained in Thomson's buffer (composition in mM:HEPES 20, Na2HPO4.2H2O 0.3, KH2PO4 0.4. NaCl 146.1, KCl 5.4, CaCl2.2H2O 1.8 MgSO4.7H2O 0.8, glucose 5.0) for three minutes, and then washed thrice with clear buffer.
-
Fig. 5 shows the image of the cells (green) together with the spot (red) formed by the pinholed eternal APD detector. The beam is then parked at this location. A 60 second (three runs) accumulation of the data yields the autocorrelation curves as shown inFig. 6 . The figure shows two curves: one (dash) for 5 nM Nile red solution in the buffer (above the cells) and another (dash dot) is for a location on the cell membrane. The curve is fitted by the MEMFCS analysis routine (Fig. 6 inset). This routine fits the data to the widest possible distribution of diffusion times that is consistent with the errors in the data, eliminating bias in the fitting routine. In the solution (dashed curve) we obtain a narrow distribution (indicating a single diffusing species) centered at 0.126 ms. In the membrane (dash and dot curve) we get two components, one at 0.360 ms and another with higher amplitude at 13.0 ms. The smaller amplitude may be due to the diffusion of free Nile Red dye inside the cytoplasm. Because excitation volume is much bigger than the membrane thickness some part of the signal unavoidably arises outside the membrane also. The longer component (13.0 ms) is ascribed to the Nile Red in membrane. It is found that the diffusion constant in the membrane is nearly 100 times larger than that of the buffer, yielding a relative viscosity of the membrane of the order of 100, which is reasonable. - Present method is different from scanning correlation spectroscopy, which also is performed on a confocal microscope. Scanning FCS either does not measure diffusion or at best does it with nearly - ms time resolution. This makes these techniques inappropriate for measuring diffusion of small fluorophores, such as GFP, inside the cytoplasm (typical diffusion times of nearly - 100 is through the probe volume). The method presented here is equivalent in time resolution and optical sensitivity to the best available stand-alone FCS instruments, which are fixed excitation point APD coupled devices.
Claims (8)
- A high sensitivity confocal fluorescence correlation microscope for real time alignment read out of a confocal image for performing FCS measurement of a specimen, comprising-- a movable sample stage;-- a microscope slider assembly;-- an objective lens for excitation of the specimen and for collecting fluorescence from the specimen;-- a fluorescence confocal microscope comprising scanning optics, at least one imaging detector, and at least one input channel;-- a fluorescence correlation spectroscope comprising an apertured detector for the FCS measurement,-- a correlator and a signal processor, and-- a beam splitter placed in the microscope slider assembly at the base of the objective lens and ahead of the scanning optics to receive the fluorescence emitted by the specimen placed on the movable sample stage and split it into transmitted part and reflected part, wherein the transmitted part travels to the at least one imaging detector of the confocal microscope for image generation via said scanning optics and the reflected part, which is non descanned and thus a high sensitivity signal, travels separately to the apertured detector for the FCS measurement;-- wherein said apertured detector for FCS measurement comprises means for generating an image of a focused spot and for performing the FCS measurement comprising:-- at least one optical filter placed within 0.5 m of the beam splitter,-- an optical lens placed adjacent to the filter along the direction of the reflected fluorescence beam for focusing the beam,-- at least one fluorescence detector,-- an optical fiber coupled to the least one fluorescence detector for producing an output including an electric pulse for each photon collected through the optical fiber and also generate said image of a focused spot;-- wherein said fluorescence detector output including said image of a focused spot is fed separately to one of the input channels of the confocal microscope and also in parallel to the correlator,-- wherein the said confocal microscope is adapted to merge its images with said spot image to produce an image with a spot and having the means for moving the specimen in real time and parking the scanning beam at a desired spot in the specimen, and-- wherein said correlator is adapted to carryout the FCS measurement at the desired location in the image by feeding the output of said correlator to the signal processor for performing said FCS measurement.
- The confocal fluorescence correlation microscope according to claim 1, wherein the beam splitter is a dichroic or a partially reflective mirror.
- The confocal fluorescence correlation microscope according to claim 1, wherein the fluorescence correlation spectroscope comprises a cylindrical metallic housing having said optical lens which is an achromatic lens and said at least one optical filter.
- The confocal fluorescence correlation microscope according to claim 1, further comprising a metallic hosing with a metallic plate, wherein the optical fiber is held in place by said metallic plate provided in the metallic housing;
wherein the optical fiber is a multimode fiber, said multimode fiber is held near the focal plane of the optical lens, wherein said optical lens is an achromatic lens, and wherein said achromatic lens is placed in the path between the filter and the multimode fiber. - The confocal fluorescence correlation microscope according to claim 1, wherein said at least one fluorescence detector comprises a single photon counting avalanche photodiode.
- The confocal fluorescence correlation microscope according to claim 1, wherein said reflected part of the splitted beam is further splitted into more than one part for multicolour detection with each part following essentially the same design.
- A confocal fluorescence correlation microscope according to claim 1, comprising plurality of colour-separating splitters placed after said beam splitter in the said reflected path of said fluorescence beam, which are adapted to split said fluorescence based on the colour for detecting different emission fluorescence colours separately by said apertured detectors and either separate autocorrelation or cross-correlation performed on signals obtained from any pair of said separate apertured detectors.
- A process for FCS measurement with the confocal fluorescence correlation microscope of claim 1 comprising:a) exciting a specimen with a laser scanning beam for emission of fluorescence;b) collecting the fluorescence from the specimen by the objective lens;c) splitting the fluorescence simultaneously or sequentially with the beam splitter into two parts, the transmitted part and the reflected part;d) passing the transmitted part through the scanning mirrors, filtering the part through the filter, passing the filtered part through the lens to the at least one imaging detector comprising a PMT detector for generating the confocal image;e) passing the reflected part not through the scanning mirrors but through the filter, lens, to the optical fiber present along the plane of focus, coupled with a high sensitive APD detector, as the fluorescence detector, and feeding the output to one of the input channels of the confocal microscope and also in parallel to the correlator which is an autocorrelator;f) scanning the object plane by the confocal excitation beam and scanning the transverse image plane containing the fiber by the focused fluorescence emitted from the specimen;g) providing a spot image from the fiber channel to the confocal microscope and generating a full image of the specimen by the confocal microscope ;h) merging the images from both channels to produce an image with a spot;i) moving the specimen in real time so that the overlaid spot coincides with the desired position where FCS measurement is required;j) parking the scanning beam at the position of the overlaid spot in the specimen;k) making the FCS measurement at the desired location in the image by activating the auto correlator and feeding the output of the auto correlator to the signal processor.
Applications Claiming Priority (1)
| Application Number | Priority Date | Filing Date | Title |
|---|---|---|---|
| PCT/IN2005/000015 WO2006087727A1 (en) | 2005-02-15 | 2005-02-15 | Fluorescence correlation microscopy with real-time alignment readout |
Publications (2)
| Publication Number | Publication Date |
|---|---|
| EP1848983A1 EP1848983A1 (en) | 2007-10-31 |
| EP1848983B1 true EP1848983B1 (en) | 2013-03-27 |
Family
ID=34982174
Family Applications (1)
| Application Number | Title | Priority Date | Filing Date |
|---|---|---|---|
| EP05736243A Expired - Fee Related EP1848983B1 (en) | 2005-02-15 | 2005-02-15 | Fluorescence correlation microscopy with real-time alignment readout |
Country Status (3)
| Country | Link |
|---|---|
| US (1) | US7705987B2 (en) |
| EP (1) | EP1848983B1 (en) |
| WO (1) | WO2006087727A1 (en) |
Families Citing this family (9)
| Publication number | Priority date | Publication date | Assignee | Title |
|---|---|---|---|---|
| US20110216306A1 (en) * | 2007-08-14 | 2011-09-08 | Rudolf Rigler | Method for determining the flow of a fluid close to a surface of an object immersed in the fluid |
| DE102008004549B4 (en) * | 2008-01-15 | 2013-04-18 | PicoQuant GmbH. Unternehmen für optoelektronische Forschung und Entwicklung | Apparatus and method for simultaneous time resolved single photon registration from a plurality of detection channels |
| DE102009031231A1 (en) * | 2009-06-26 | 2010-12-30 | Carl Zeiss Microlmaging Gmbh | Methods and arrangements for fluorescence microscopy |
| DE102011051086A1 (en) * | 2011-06-15 | 2012-12-20 | MAX-PLANCK-Gesellschaft zur Förderung der Wissenschaften e.V. | Method for imaging fluorescent dye with labeled structure in sample, involves emitting fluorescent light in form of detectable photons, and assigning image of structure from location to photons over repetitive scanning of scanning area |
| US20150185131A1 (en) * | 2013-12-26 | 2015-07-02 | National Cheng Kung University | Method and device for measuring the liquid viscosity |
| WO2016164751A1 (en) * | 2015-04-08 | 2016-10-13 | The Regents Of The University Of California | Cathodoluminescence-activated nanoscale imaging |
| TWI546533B (en) * | 2015-07-14 | 2016-08-21 | 龍彩科技股份有限公司 | Measurement system of real-time spatial-resolved spectrum and time-resolved spectrum and measurement module thereof |
| US11841311B2 (en) | 2018-11-19 | 2023-12-12 | Samsung Electronics Co., Ltd. | Multimodal dust sensor |
| CN117491327B (en) * | 2023-11-06 | 2024-12-06 | 山西大学 | A microscopic confocal fluorescence spectrometer |
Family Cites Families (8)
| Publication number | Priority date | Publication date | Assignee | Title |
|---|---|---|---|---|
| DE19533092A1 (en) * | 1995-09-07 | 1997-03-13 | Basf Ag | Device for parallelized two-photon fluorescence correlation spectroscopy (TPA-FCS) and its use for drug screening |
| DE19649605A1 (en) * | 1996-11-29 | 1998-06-04 | Deutsches Krebsforsch | Fluorescence correlation spectroscopy module for a microscope |
| DE19951482C2 (en) * | 1999-10-26 | 2003-01-09 | Zeiss Carl Jena Gmbh | fluorescence microscope |
| US6582907B1 (en) * | 1999-12-09 | 2003-06-24 | Pharmacia & Upjohn Company | Use of fluorescence correlation spectroscopy to identify compounds that bind to target species under isothermal denaturing conditions |
| DE10008594B4 (en) * | 2000-02-22 | 2018-09-20 | Carl Zeiss Microscopy Gmbh | Device and method for spatially resolved fluorescence correlation spectroscopy |
| DE10111420A1 (en) * | 2001-03-09 | 2002-09-12 | Gnothis Holding Sa Ecublens | To detect an analyte by fluorescence correlation spectroscopy, a set gap is established between the light focusing unit and the volume of the sample, and the sample carrier is thermally insulated from the light source |
| DE10327486B4 (en) * | 2003-06-17 | 2006-07-20 | Leica Microsystems Cms Gmbh | Device for determining directional transport processes |
| WO2005017598A1 (en) * | 2003-08-06 | 2005-02-24 | Gnothis Holding S.A. | Method and device for identifying luminescent molecules according to the fluorescence correlation spectroscopy method |
-
2005
- 2005-02-15 WO PCT/IN2005/000015 patent/WO2006087727A1/en not_active Ceased
- 2005-02-15 US US11/816,387 patent/US7705987B2/en not_active Expired - Fee Related
- 2005-02-15 EP EP05736243A patent/EP1848983B1/en not_active Expired - Fee Related
Also Published As
| Publication number | Publication date |
|---|---|
| EP1848983A1 (en) | 2007-10-31 |
| US7705987B2 (en) | 2010-04-27 |
| US20090086204A1 (en) | 2009-04-02 |
| WO2006087727A1 (en) | 2006-08-24 |
Similar Documents
| Publication | Publication Date | Title |
|---|---|---|
| CN113267252B (en) | A four-dimensional detection system for staring confocal microscopy morphology and spectrum | |
| US6947133B2 (en) | Method for increasing the spectral and spatial resolution of detectors | |
| US9201011B2 (en) | Increased depth-resolution microscopy | |
| JP4783931B2 (en) | Method for increasing the spectroscopic and spatial resolution of a detector | |
| Sytsma et al. | Time‐gated fluorescence lifetime imaging and microvolume spectroscopy using two‐photon excitation | |
| US6703621B2 (en) | Method for the optical acquisition of characteristic sizes of an illuminated sample | |
| US6858852B2 (en) | Method and apparatus for rapid change of fluorescence bands in the detection of dyes in fluorescence microscopy | |
| US7170598B2 (en) | Multi-parameter fluorimetric analysis in a massively parallel multi-focal arrangement and the use thereof | |
| JP4509940B2 (en) | Method and apparatus for determining wavelength dependent characteristics of illuminated samples | |
| US20090257107A1 (en) | Device for controlling light radiation | |
| US20060146325A1 (en) | Device for multifocal confocal microscopic determination of spatial distribution and for multifocal fluctuation analysis of fluorescent molecules and structures with flexible spectral detection | |
| JP2005534944A (en) | Fluorescence correlation spectrometer | |
| Naredi‐Rainer et al. | Confocal microscopy | |
| US7705987B2 (en) | Fluorescence correlation microscopy with real-time alignment readout | |
| US20040257562A1 (en) | Method for measuring fluorescence correlations in the presence of slow signal fluctuations | |
| EP1872167B1 (en) | Multi-photon fluorescence microscope | |
| JP4481827B2 (en) | Multiparameter fluorescence analysis and its use in massively parallel multifocal arrays | |
| CN118209563A (en) | Wafer photoluminescence detection device and method | |
| Wier et al. | A custom confocal and two-photon digital laser scanning microscope | |
| Müller et al. | Construction and performance of a custom-built two-photon laser scanning system | |
| JP2004354937A (en) | Laser microscope | |
| JP2004361087A (en) | Biomolecule analyzer | |
| US20050017197A1 (en) | Scanning microscope and method for scanning microscopy | |
| JP2004354346A (en) | Measuring device | |
| CN221826776U (en) | Wafer photoluminescence detection device |
Legal Events
| Date | Code | Title | Description |
|---|---|---|---|
| PUAI | Public reference made under article 153(3) epc to a published international application that has entered the european phase |
Free format text: ORIGINAL CODE: 0009012 |
|
| 17P | Request for examination filed |
Effective date: 20070814 |
|
| AK | Designated contracting states |
Kind code of ref document: A1 Designated state(s): DE GB |
|
| 17Q | First examination report despatched |
Effective date: 20080115 |
|
| RBV | Designated contracting states (corrected) |
Designated state(s): DE GB |
|
| DAX | Request for extension of the european patent (deleted) | ||
| GRAP | Despatch of communication of intention to grant a patent |
Free format text: ORIGINAL CODE: EPIDOSNIGR1 |
|
| RIC1 | Information provided on ipc code assigned before grant |
Ipc: G01N 21/64 20060101AFI20120723BHEP |
|
| GRAS | Grant fee paid |
Free format text: ORIGINAL CODE: EPIDOSNIGR3 |
|
| GRAA | (expected) grant |
Free format text: ORIGINAL CODE: 0009210 |
|
| AK | Designated contracting states |
Kind code of ref document: B1 Designated state(s): DE GB |
|
| REG | Reference to a national code |
Ref country code: GB Ref legal event code: FG4D |
|
| REG | Reference to a national code |
Ref country code: DE Ref legal event code: R096 Ref document number: 602005038762 Country of ref document: DE Effective date: 20130523 |
|
| PLBE | No opposition filed within time limit |
Free format text: ORIGINAL CODE: 0009261 |
|
| STAA | Information on the status of an ep patent application or granted ep patent |
Free format text: STATUS: NO OPPOSITION FILED WITHIN TIME LIMIT |
|
| 26N | No opposition filed |
Effective date: 20140103 |
|
| REG | Reference to a national code |
Ref country code: DE Ref legal event code: R097 Ref document number: 602005038762 Country of ref document: DE Effective date: 20140103 |
|
| PGFP | Annual fee paid to national office [announced via postgrant information from national office to epo] |
Ref country code: DE Payment date: 20150226 Year of fee payment: 11 |
|
| PGFP | Annual fee paid to national office [announced via postgrant information from national office to epo] |
Ref country code: GB Payment date: 20150116 Year of fee payment: 11 |
|
| REG | Reference to a national code |
Ref country code: DE Ref legal event code: R119 Ref document number: 602005038762 Country of ref document: DE |
|
| GBPC | Gb: european patent ceased through non-payment of renewal fee |
Effective date: 20160215 |
|
| PG25 | Lapsed in a contracting state [announced via postgrant information from national office to epo] |
Ref country code: DE Free format text: LAPSE BECAUSE OF NON-PAYMENT OF DUE FEES Effective date: 20160901 Ref country code: GB Free format text: LAPSE BECAUSE OF NON-PAYMENT OF DUE FEES Effective date: 20160215 |