EP1847215A1 - Living body measurement system and method - Google Patents
Living body measurement system and method Download PDFInfo
- Publication number
- EP1847215A1 EP1847215A1 EP07006887A EP07006887A EP1847215A1 EP 1847215 A1 EP1847215 A1 EP 1847215A1 EP 07006887 A EP07006887 A EP 07006887A EP 07006887 A EP07006887 A EP 07006887A EP 1847215 A1 EP1847215 A1 EP 1847215A1
- Authority
- EP
- European Patent Office
- Prior art keywords
- unit
- subject
- blood volume
- heart rate
- arterial pressure
- Prior art date
- Legal status (The legal status is an assumption and is not a legal conclusion. Google has not performed a legal analysis and makes no representation as to the accuracy of the status listed.)
- Withdrawn
Links
- 238000005259 measurement Methods 0.000 title claims abstract description 36
- 238000000034 method Methods 0.000 title claims description 31
- 230000002490 cerebral effect Effects 0.000 claims abstract description 60
- 230000004872 arterial blood pressure Effects 0.000 claims abstract description 59
- 239000008280 blood Substances 0.000 claims abstract description 39
- 210000004369 blood Anatomy 0.000 claims abstract description 39
- 238000000605 extraction Methods 0.000 claims abstract description 23
- 230000002792 vascular Effects 0.000 claims abstract description 15
- 238000009532 heart rate measurement Methods 0.000 claims abstract description 14
- 238000001228 spectrum Methods 0.000 claims description 28
- 238000003745 diagnosis Methods 0.000 claims description 15
- 230000035945 sensitivity Effects 0.000 claims description 11
- 230000008859 change Effects 0.000 claims description 7
- 239000000284 extract Substances 0.000 claims description 4
- 238000012937 correction Methods 0.000 claims description 3
- 238000000691 measurement method Methods 0.000 claims description 3
- 238000012360 testing method Methods 0.000 description 13
- 208000026106 cerebrovascular disease Diseases 0.000 description 10
- 208000019553 vascular disease Diseases 0.000 description 9
- 239000013307 optical fiber Substances 0.000 description 7
- 238000010586 diagram Methods 0.000 description 6
- 210000004204 blood vessel Anatomy 0.000 description 5
- 238000012545 processing Methods 0.000 description 5
- 230000032683 aging Effects 0.000 description 4
- 238000006243 chemical reaction Methods 0.000 description 4
- 230000014509 gene expression Effects 0.000 description 4
- 108010054147 Hemoglobins Proteins 0.000 description 3
- 102000001554 Hemoglobins Human genes 0.000 description 3
- 230000003287 optical effect Effects 0.000 description 3
- 239000000523 sample Substances 0.000 description 3
- INGWEZCOABYORO-UHFFFAOYSA-N 2-(furan-2-yl)-7-methyl-1h-1,8-naphthyridin-4-one Chemical compound N=1C2=NC(C)=CC=C2C(O)=CC=1C1=CC=CO1 INGWEZCOABYORO-UHFFFAOYSA-N 0.000 description 2
- 206010008088 Cerebral artery embolism Diseases 0.000 description 2
- 206010028851 Necrosis Diseases 0.000 description 2
- 108010064719 Oxyhemoglobins Proteins 0.000 description 2
- 208000034189 Sclerosis Diseases 0.000 description 2
- 230000005856 abnormality Effects 0.000 description 2
- 210000005013 brain tissue Anatomy 0.000 description 2
- 238000004364 calculation method Methods 0.000 description 2
- 230000003727 cerebral blood flow Effects 0.000 description 2
- 108010002255 deoxyhemoglobin Proteins 0.000 description 2
- 238000001514 detection method Methods 0.000 description 2
- 230000000694 effects Effects 0.000 description 2
- 230000004060 metabolic process Effects 0.000 description 2
- 230000001114 myogenic effect Effects 0.000 description 2
- 230000017074 necrotic cell death Effects 0.000 description 2
- 238000005070 sampling Methods 0.000 description 2
- 210000002460 smooth muscle Anatomy 0.000 description 2
- 230000003595 spectral effect Effects 0.000 description 2
- 238000012876 topography Methods 0.000 description 2
- 201000001320 Atherosclerosis Diseases 0.000 description 1
- 206010008111 Cerebral haemorrhage Diseases 0.000 description 1
- 206010008132 Cerebral thrombosis Diseases 0.000 description 1
- 208000005189 Embolism Diseases 0.000 description 1
- 208000032843 Hemorrhage Diseases 0.000 description 1
- 201000001429 Intracranial Thrombosis Diseases 0.000 description 1
- 208000006011 Stroke Diseases 0.000 description 1
- 208000032851 Subarachnoid Hemorrhage Diseases 0.000 description 1
- 208000007536 Thrombosis Diseases 0.000 description 1
- 238000010521 absorption reaction Methods 0.000 description 1
- 230000001154 acute effect Effects 0.000 description 1
- 210000002551 anterior cerebral artery Anatomy 0.000 description 1
- 210000001367 artery Anatomy 0.000 description 1
- 238000009534 blood test Methods 0.000 description 1
- 210000004556 brain Anatomy 0.000 description 1
- 210000001627 cerebral artery Anatomy 0.000 description 1
- 206010008118 cerebral infarction Diseases 0.000 description 1
- 230000034994 death Effects 0.000 description 1
- 230000003247 decreasing effect Effects 0.000 description 1
- 230000007850 degeneration Effects 0.000 description 1
- 230000004882 diastolic arterial blood pressure Effects 0.000 description 1
- 201000010099 disease Diseases 0.000 description 1
- 208000037265 diseases, disorders, signs and symptoms Diseases 0.000 description 1
- 230000002068 genetic effect Effects 0.000 description 1
- 210000003128 head Anatomy 0.000 description 1
- 238000003384 imaging method Methods 0.000 description 1
- 230000006872 improvement Effects 0.000 description 1
- 201000010849 intracranial embolism Diseases 0.000 description 1
- 208000028867 ischemia Diseases 0.000 description 1
- 230000003902 lesion Effects 0.000 description 1
- 230000007246 mechanism Effects 0.000 description 1
- 210000003657 middle cerebral artery Anatomy 0.000 description 1
- 238000012986 modification Methods 0.000 description 1
- 230000004048 modification Effects 0.000 description 1
- 230000002969 morbid Effects 0.000 description 1
- 210000005036 nerve Anatomy 0.000 description 1
- 230000001537 neural effect Effects 0.000 description 1
- 230000001272 neurogenic effect Effects 0.000 description 1
- 210000000056 organ Anatomy 0.000 description 1
- 210000005037 parasympathetic nerve Anatomy 0.000 description 1
- 230000001936 parietal effect Effects 0.000 description 1
- 238000013186 photoplethysmography Methods 0.000 description 1
- 230000003449 preventive effect Effects 0.000 description 1
- 210000004761 scalp Anatomy 0.000 description 1
- 238000002603 single-photon emission computed tomography Methods 0.000 description 1
- 210000003625 skull Anatomy 0.000 description 1
- 210000002330 subarachnoid space Anatomy 0.000 description 1
- 230000002889 sympathetic effect Effects 0.000 description 1
- 208000024891 symptom Diseases 0.000 description 1
- 230000004873 systolic arterial blood pressure Effects 0.000 description 1
- 230000002123 temporal effect Effects 0.000 description 1
- 210000001519 tissue Anatomy 0.000 description 1
- 210000001186 vagus nerve Anatomy 0.000 description 1
- 230000001457 vasomotor Effects 0.000 description 1
Images


Classifications
-
- A—HUMAN NECESSITIES
- A61—MEDICAL OR VETERINARY SCIENCE; HYGIENE
- A61B—DIAGNOSIS; SURGERY; IDENTIFICATION
- A61B5/00—Measuring for diagnostic purposes; Identification of persons
- A61B5/02—Detecting, measuring or recording for evaluating the cardiovascular system, e.g. pulse, heart rate, blood pressure or blood flow
- A61B5/026—Measuring blood flow
- A61B5/0261—Measuring blood flow using optical means, e.g. infrared light
-
- A—HUMAN NECESSITIES
- A61—MEDICAL OR VETERINARY SCIENCE; HYGIENE
- A61B—DIAGNOSIS; SURGERY; IDENTIFICATION
- A61B5/00—Measuring for diagnostic purposes; Identification of persons
- A61B5/68—Arrangements of detecting, measuring or recording means, e.g. sensors, in relation to patient
- A61B5/6801—Arrangements of detecting, measuring or recording means, e.g. sensors, in relation to patient specially adapted to be attached to or worn on the body surface
- A61B5/6813—Specially adapted to be attached to a specific body part
- A61B5/6814—Head
-
- A—HUMAN NECESSITIES
- A61—MEDICAL OR VETERINARY SCIENCE; HYGIENE
- A61B—DIAGNOSIS; SURGERY; IDENTIFICATION
- A61B5/00—Measuring for diagnostic purposes; Identification of persons
- A61B5/02—Detecting, measuring or recording for evaluating the cardiovascular system, e.g. pulse, heart rate, blood pressure or blood flow
- A61B5/021—Measuring pressure in heart or blood vessels
-
- A—HUMAN NECESSITIES
- A61—MEDICAL OR VETERINARY SCIENCE; HYGIENE
- A61B—DIAGNOSIS; SURGERY; IDENTIFICATION
- A61B5/00—Measuring for diagnostic purposes; Identification of persons
- A61B5/02—Detecting, measuring or recording for evaluating the cardiovascular system, e.g. pulse, heart rate, blood pressure or blood flow
- A61B5/024—Measuring pulse rate or heart rate
- A61B5/02416—Measuring pulse rate or heart rate using photoplethysmograph signals, e.g. generated by infrared radiation
Definitions
- the present invention relates to a measurement system and method for measuring living bodies to conduct noninvasive cerebrovascular disease tests.
- the cerebrovascular disease (or stroke) is a general term for morbid states which bring about neural symptoms by an organic abnormality or a functional abnormality, and it holds the third place in death causes of the Japanese people at the present time.
- necrosis (softening) of the brain tissue there are cerebral thrombosis caused by atherosclerosis of the cerebral artery and cerebral embolism caused by an embolus coming from the outside of the skull.
- the hemorrhage there are cerebral hemorrhage into the cerebral parenchyma and subarachnoid hemorrhage into the subarachnoid space.
- Tests in the acute stage are conducted by using a blood test, an electrocardiogram, and the X-ray CT, and so on.
- the MRI, PET, SPECT and cerebrovascular imaging are used subsidiarily.
- the regional cerebral blood volume change can be measured in a noninvasive manner by using the optical topography method.
- the optical topography method is a method of exposing a subject to light having a wavelength belonging to the visible region to the infrared region, detecting light beams of a plurality of signals by using the same photodetector, and measuring the hemoglobin change quantity ( JP-A-9-019408 and so on). This method has a feature that the restraint upon the subject is also low as compared with the cerebral function measurement techniques such as the MRI and PET.
- the cerebral blood volume variation and the arterial pressure and/or the heart rate variation are measured, the cerebral vascular stiffness and their changes are evaluated on the basis of properties of low frequency components in those variations, and a disease region and a danger region are presumed and displayed.
- a living body measurement system including a cerebral blood volume measurement unit for measuring a regional cerebral blood volume of a subject, an arterial pressure/heart rate measurement unit for measuring an arterial pressure and/or a heart rate of the subject, an analysis unit for analyzing signals measured by the cerebral blood volume measurement unit and the arterial pressure/heart rate measurement unit, an extraction unit for extracting information concerning a regional cerebral vascular state of the subject on the basis of an output of the analysis unit, and a display unit for displaying a measurement result measured by the cerebral blood volume measurement unit and/or the arterial pressure/heart rate measurement unit, an analysis result analyzed by the analysis unit, or an extraction result extracted by the extraction unit.
- the present invention it becomes possible to test the cerebrovascular disease in a noninvasive manner and with high precision.
Landscapes
- Health & Medical Sciences (AREA)
- Life Sciences & Earth Sciences (AREA)
- Heart & Thoracic Surgery (AREA)
- Medical Informatics (AREA)
- Physics & Mathematics (AREA)
- Veterinary Medicine (AREA)
- Biophysics (AREA)
- Pathology (AREA)
- Engineering & Computer Science (AREA)
- Biomedical Technology (AREA)
- Public Health (AREA)
- General Health & Medical Sciences (AREA)
- Molecular Biology (AREA)
- Surgery (AREA)
- Animal Behavior & Ethology (AREA)
- Physiology (AREA)
- Hematology (AREA)
- Cardiology (AREA)
- Measurement Of The Respiration, Hearing Ability, Form, And Blood Characteristics Of Living Organisms (AREA)
- Measuring Pulse, Heart Rate, Blood Pressure Or Blood Flow (AREA)
Abstract
Description
- The present invention relates to a measurement system and method for measuring living bodies to conduct noninvasive cerebrovascular disease tests.
- The cerebrovascular disease (or stroke) is a general term for morbid states which bring about neural symptoms by an organic abnormality or a functional abnormality, and it holds the third place in death causes of the Japanese people at the present time. Necrosis (softening) of the brain tissue caused by cerebral infarction, i.e., ischemia occupies 70% of cerebrovascular diseases. In the necrosis (softening) of the brain tissue, there are cerebral thrombosis caused by atherosclerosis of the cerebral artery and cerebral embolism caused by an embolus coming from the outside of the skull. In the hemorrhage, there are cerebral hemorrhage into the cerebral parenchyma and subarachnoid hemorrhage into the subarachnoid space. Tests in the acute stage are conducted by using a blood test, an electrocardiogram, and the X-ray CT, and so on. The MRI, PET, SPECT and cerebrovascular imaging are used subsidiarily.
- The regional cerebral blood volume change can be measured in a noninvasive manner by using the optical topography method. The optical topography method is a method of exposing a subject to light having a wavelength belonging to the visible region to the infrared region, detecting light beams of a plurality of signals by using the same photodetector, and measuring the hemoglobin change quantity (
JP-A-9-019408 -
- Patent document 1:
JP-A-9-019408 - Non-patent document 1: A. Maki et al., Medical Physics, vol. 22, pp. 1997-2005 (1995)
- Non-patent document 2: M. L. Schroeter et al., Journal of Cerebral Blood Flow & Metabolism, vol. 24, pp. 1183-1191 (2004)
- Non-patent document 3: M. L. Schroeter et al., Journal of Cerebral Blood Flow & Metabolism, vol. 25, pp. 1675-1684 (2005)
- In the above-described cerebrovascular disease tests, however, an invasive method is used or a severe burden is cast upon the subject although the test is noninvasive, in some cases. Furthermore, the possibility of overlooking a small lesion is high. Therefore, it is difficult to preventively conduct a cerebrovascular disease test.
- In accordance with the present invention, the cerebral blood volume variation and the arterial pressure and/or the heart rate variation are measured, the cerebral vascular stiffness and their changes are evaluated on the basis of properties of low frequency components in those variations, and a disease region and a danger region are presumed and displayed.
- The problem can be solved by a living body measurement system including a cerebral blood volume measurement unit for measuring a regional cerebral blood volume of a subject, an arterial pressure/heart rate measurement unit for measuring an arterial pressure and/or a heart rate of the subject, an analysis unit for analyzing signals measured by the cerebral blood volume measurement unit and the arterial pressure/heart rate measurement unit, an extraction unit for extracting information concerning a regional cerebral vascular state of the subject on the basis of an output of the analysis unit, and a display unit for displaying a measurement result measured by the cerebral blood volume measurement unit and/or the arterial pressure/heart rate measurement unit, an analysis result analyzed by the analysis unit, or an extraction result extracted by the extraction unit.
- Hereafter, contents of the present invention will be described in detail with reference to concrete examples.
- According to the present invention, it becomes possible to test the cerebrovascular disease in a noninvasive manner and with high precision.
- Other objects, features and advantages of the invention will become apparent from the following description of the embodiments of the invention taken in conjunction with the accompanying drawings.
-
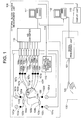
- Fig. 1 shows a configuration of a living body measurement system;
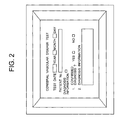
- Fig. 2 shows an input screen of the living body measurement system;
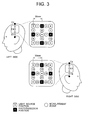
- Fig. 3 shows an example of a measurement probe;
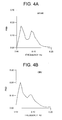
- Figs. 4A and 4B show low frequency components of a power spectrum;
- Fig. 5 shows a result display example;
- Fig. 6 shows a processing flow in an analysis unit and an extraction unit;
- Fig. 7 is a standard vascularity diagram;
- Fig. 8 shows result display with sensitivity distribution information attached;
- Fig. 9 shows an adjustment procedure for thresholds TH1 and TH2; and
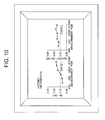
- Fig. 10 shows utilization of history information of the same subject.
-
- (1) FIG. 1 shows a configuration of a system. The present system includes an input unit, an analysis unit, a storage unit and an extraction unit included in a
computer 112, a cerebral bloodvolume measurement unit 120, an arterial pressure/heartrate measurement unit 130 and adisplay unit 113. If thecomputer 112 has the display function, thecomputer 112 can be substituted for thedisplay unit 113.
In the input unit, information required for the test, for example, the age, the distinction of sex and the handedness of the subject, diagnosis information such as a diagnosis at the current time point and treatment history, in particular, whether there is a confirmed diagnosis result are input by an operator. How an input screen is displayed is shown in FIG. 2. In this example, the subject is identified by using a patient No. However, the name may be used. If there is a confirmed diagnosis result, a square in item No. 1 is checked. In that case, test results are stored in a database automatically.
The regional cerebral blood volume (oxyhemoglobin, deoxyhemoglobin, and total hemoglobin) is obtained in the cerebral bloodvolume measurement unit 120 by exposing a head of the subject to light having a wavelength belonging to the visible region to the infrared region, and detecting and measuring light beams of a plurality of signals passed through the inside of the subject by using the same photodetector.
A plurality oflight sources 102a to 102d have wavelengths that are different from each other. (Thelight sources light sources light sources oscillators coupler 104a (104b) couples light beams subjected to strength modulation, throughoptical fibers coupler 104a (104b) to different positions on a scalp of asubject 106 via a light irradiationoptical fiber 105a (105b). A plurality of light sensingoptical fibers 107a to 107f are provided so as to have tips positioned in the vicinity of light irradiation positions of the light irradiation means and at equal distances (which are supposed to be 30 mm here) from the light irradiation means. A plurality of light sensing means formed oflight sensors 108a to 108f are provided respectively for the light sensingoptical fibers 107a to 107f. Light beams transmitted through the living body are collected by using the six light sensingoptical fibers 107a to 107f, and subjected to photoelectric conversion in thelight sensors 108a to 108f. The light sensing means detect light beams reflected within the subject and convert them to electric signals. As the light sensors 108, photoelectric conversion elements represented by photomultipliers or photodiodes are used.
The electric signals (hereafter referred to as living body passed light strength signals) representing living body passed light strength obtained by photoelectric conversion conducted in thelight sensors 108a to 108f are input to lock-inamplifiers 109a to 109h. Thelight sensors optical fibers optical fibers light sensors light sensor 108c is input to the lock-inamplifiers light sensor 108d is input to the lock-inamplifiers oscillators amplifiers 109a to 109d as reference frequencies. Strength modulation frequencies from theoscillators amplifiers 109e to 109h as reference frequencies. Therefore, living body passed light strength signals for thelight sources amplifiers 109a to 109d, and living body passed light strength signals for thelight sources amplifiers 109e to 109h.
The separated passed light strength signals for respective wavelengths output from the lock-inamplifiers 109a to 109h are subjected to analog-digital conversion in an analog-digital converter 110, and resultant digital signals are sent to ameasurement control computer 111. Themeasurement control computer 111 computes relative change quantities of the oxyhemoglobin concentration, deoxyhemoglobin concentration, and total hemoglobin concentration from signals detected at the detection points according to the procedure described in thenon-patent document 1 by using the passed light intensity signals, and stores them in the storage unit as information at the plurality of measurement points with time.
Herein an embodiment in which a plurality of light beams are separated by using the modulation method has been described. However, this is not restrictive, but, for example, a time division method of discriminating a plurality of light beams by shifting timing of applying a plurality of light beams in time can also be used.
On the other hand, the arterial pressure/heartrate measurement unit 130 measures the heart rate and/or the arterial pressure by using the photoplethysmography. Acuff 122 is attached to a finger tip, and the heart rate is detected by optical detection and the arterial pressure (systolic arterial pressure, diastolic arterial pressure, and average arterial pressure) are detected simultaneously. The arterial pressure value is interpolated at a sampling frequency of 200 Hz in asignal processing unit 121, and sent to the analysis unit in thecomputer 112. Herein, the arterial pressure/heartrate measurement unit 130 for measuring the heart rate and the arterial pressure is shown. However, it is sufficient if either the heart rate or the arterial pressure can be measured. Herein, the photoelectric volume pulse wave recording is used because of easiness of handling. However, it is also possible to use an electrocardiograph for the hear rate and use an invasive sphygmomanometer for the arterial pressure.
The analysis unit analyzes the power spectra of the measured regional cerebral blood volume and the arterial pressure or heart rate. Results of them are delivered to the storage unit in thecomputer 112.
The storage unit temporarily stores the measurement information on the subject to make subsequent processing possible. On the other hand, for example, if there is a confirmed diagnosis, it is also possible to store the measured information as a database. The database information is used not only when the parameter automatic adjustment is conducted as described later, but also when making a diagnosis on the basis of results of the test conducted by the present system.
The extraction unit in thecomputer 112 extracts information concerning the cerebrovascular disease from the power spectrum of the signal analyzed by the analysis unit and quantitative information concerning the power spectrum according to a method described later. The information concerning the cerebrovascular disease extracted by the extraction unit is displayed by thedisplay unit 113.
In FIG. 1, thecomputer 111 and thecomputer 112 are drawn separately. However, it is a matter of course that one computer may be used instead of thecomputer 111 and thecomputer 112.
FIG. 3 schematically shows a probe for measuring the cerebral blood volume. Cz, T3 and T4 are characters indicating standard positions for electroencephalogram measurement, and represent the vertex, a part located immediately above the left ear, and a part located immediately above the right ear, respectively. C3 and C4 denote the middle point between Cz and T3 and the middle point between Cz and T4, respectively. Measurement is possible for 12 left channels and 12 right channels, i.e., 24 channels in total. Each channel is identified by a number (hereafter referred to as channel number) given to a measurement point.
Examples of the power spectrum obtained by the analysis unit are shown in Figs. 4A and 4B. Fig. 4A shows an average value (represented as AP/HR) of a power spectrum obtained from the arterial pressure (AP) and heart rate (HR). Fig. 4B shows a power spectrum of the regional cerebral blood volume (CBV). The ordinate represents the power spectral density (PSD). The power spectral density is normalized so as to yield unity when power is integrated with respect to the frequency. The frequency on the abscissa is a coordinate corresponding to a time axis obtained by conducting Fourier transform on the arterial pressure & heart rate which is time series data, and includes a range from zero Hz to the Nyquist frequency (half of the sampling frequency). Figs. 4A and 4B show a part thereof. The arterial pressure & heart rate shown in Fig. 4A has been measured by attaching a probe to the third finger of the left hand and using the arterial pressure/heartrate measurement unit 130. A result shown in Fig. 4B has been calculated from the regional cerebral blood volume measured on thechannel 4 in Fig. 3. The arterial pressure & heart rate is compared with the regional cerebral blood volume with respect to a power ratio Rp. Here, the power ratio Rp is represented as Rp=PLF/PVLF and it is the ratio of average power PLF in a low-frequency (LF) region (0.07-0.11 Hz) to average power PVLF in a very-low-frequency (VLF) region (0.01-0.05 Hz). As a result, it is appreciated that the arterial pressure & heart rate is greater in power ratio Rp than the regional cerebral blood volume. Fluctuations in these regions deeply relate to the regulation function of the vascular system. The regulation is dominated by a vasomotor center, a sympathetic nerve, a parasympathetic nerve (vagus nerve) or the like. However, the fluctuations are partly neurogenic and partly myogenic. According to thenon-patent documents
In the present invention, the power ratio Rp, which is the ratio of the average power PLF in the LF region (0.07-0.11 Hz) to the average power PVLF in the VLF region (0.01-0.05 Hz), is used as an index for the vascular stiffness. For the above-described reason, the power ratio Rp becomes a parameter reflecting the vascular stiffness. As described above, the power ratio Rp is calculated on the basis of the average power values in respective regions. Or the power ratio Rp may be calculated from a ratio between power integral values in corresponding frequency regions. In addition, if the 1/f spectrum component in the power spectrum is previously removed at that time, the vascular property can be evaluated more accurately. The 1/f spectrum component is a spectrum structure that does not have a characteristic frequency and that is often observed in the power spectrum of a living body, especially the artery pressure & heart rate. It is considered that the 1/f spectrum component represents that the variabilities in artery pressure and heart rate are generated from a complicated feedback structure. However, details of the generation mechanism are still unknown.
The method for previously removing the 1/f spectrum component will be described hereafter. First, the power spectrum is plotted in full logarithmic exhibition, and the low frequency part is approximated by a straight line.
A slope α represents an exponent of the 1/f spectrum component. These parameters α and β are determined by using the least square method, and a spectrum with the straight line part removed is calculated. When conducting the least square calculation, the data of the LF region and the VLF region are not included. In Figs. 4A and 4B, this processing has been conducted.
The vessel in that region is judged to be stiffer as the power ratio Rp thus found becomes smaller. In addition, power ratios respectively obtained from the arterial pressure & heart rate and the regional cerebral blood volume are denoted by Rp(AP/HR) and Rp(CBV), respectively. Hereafter, AP, HR and CBV in a parenthesis represent a relation to the artery pressure, the heart rate and the regional cerebral blood volume, respectively. As for the arterial pressure & heart rate, a power spectrum is found from each of the arterial pressure and the heart rate independently. An average of resultant power spectra is found and regarded as a power spectrum of the arterial pressure & heart rate. The power ratio Rp is calculated on the basis of the averaged power spectrum. Instead of using both the arterial pressure and the heart rate, only either the arterial pressure or the heart rate may be used. At that time, indication AP or HR is used so as to correspond to actually used data, instead of the indication AP/HR. The power ratios obtained from the arterial pressure & heart rate and the regional cerebral blood volume are represented by the following expressions.

In the present embodiment, the test for the vascular disease is conducted by using these relations (theexpressions 2 and 3) and the following two criteria.- <1> When

or
a cerebral vascular disease tends to occur. - <2> In a region satisfying the (
expression 4 or 5) and
a cerebral vascular disease especially tends to occur.
In the present embodiment, one left channel and one right channel satisfy the criterion <1>. The display unit displays the results as shown in Fig. 5. Here, the risk of the cerebral vascular disease is displayed in the following three stages. A first stage is displayed with white to indicate that there is no problem. A second stage is displayed with gray to indicate that care must be taken and the progress should be observed. A third stage is displayed with black to indicate that a close test is required. In this example, a great part is in the first stage and only two channels are in the second stage.
Fig. 6 shows a flow of processing conducted especially in the analysis unit and the extraction unit ranging from the acquisition of measured data to the result display. The power spectra are calculated from the measured data of the cerebral blood volume and the arterial pressure or the heart rate by using the Fast Fourier Transform (FFT). As for the power spectrum calculation method, there are various methods such as nonparametric methods like the Welch method and parametric methods like the Yule method. Any of these methods may be used. Subsequently, the 1/f spectrum component is removed from the obtained power spectra by using the above-described method, and the power ratios RP(AP/HR) and RP(CBV) are calculated according to the above-described method. The extraction unit extracts information concerning the cerebral vascular disease on the basis of the obtained power ratios and the criteria <1> and <2>. The display unit displays results. - <1> When
- (2) However, these results are susceptible to the influence of the vascularity. It is important to conduct an analysis with the influence of the vascularity taken into consideration. Hereafter, a measurement method with the influence of the vascularity taken into consideration will be described.
First, a sensitivity map is created according to the measurement regions from a standard vascularity diagram previously stored in the storage unit. An example of the standard vascularity diagram is shown in Fig. 7. A dotted line roughly represents the distribution of the cerebral tissue. Here, arterial distribution is represented by thick solid lines. The anterior cerebral artery, the middle cerebral artery and their terminal branches are included. The standard vascularity diagram is bisymmetrical. The standard vascularity diagram is prepared for the frontal, the parietal and the occipital areas as well besides the temporal area. A procedure for creating a sensitivity map on the basis of the standard vascularity diagram will now be described. In the present embodiment, a sensitivity map of two stages is created. The standard sensitivity is set equal to 1, and the sensitivity is set equal to 0.5 in a region where a comparatively thick artery is located. The power ratio Rp appearing in theexpression non-patent documents display unit 113 to display sensitivity distribution obtained from the standard vascularity information together. In the case of the present embodiment, the display becomes as shown in Fig. 8. It is indicated that the sensitivity becomes 0.5 at channel Nos. 8 and 22.
In a region having a thick blood vessel, detected light tends to become weak, and consequently it can be denied that the reliability becomes low. Therefore, such information is information that is useful to the user. - (3) The thresholds used in extraction of the information concerning the cerebral vascular disease can be improved by storing data. The present system has an automatic adjustment function for that purpose. A threshold adjustment procedure is summarized in Fig. 9. First, channels of data obtained from a confirmed diagnosis are classified into three stages: "no problem"; "care must be taken (progress should be observed)"; and "close test is required". The threshold TH1 is optimized on the basis of the information of the power ratio stored in the storage unit. TH1 is a threshold for separating the first stage from the rest. TH1 is determined so as to maximize the average of the correct answer rates in respective groups. The threshold TH2 is optimized. TH2 is a threshold for separating the second stage from the third stage. TH2 is determined so as to maximize the average of the correct answer rates in respective groups. It is possible to change the thresholds to more suitable values by thus conforming to the confirmed diagnosis information.
- (4) In the present system, it is possible to provide information useful to the diagnosis and treatment by suitably displaying serially stored history information such as measured, analyzed and extracted information of the same subject. One example is shown in Fig. 10. Measurements are conducted on the subject once per month for half a year, i.e., six times in total. Until July, the risk is in the second stage (care must be taken). From August on, the risk is in the first stage (no problem). It is considered to be an effect of treatment conducted during that time. It is also possible to evaluate an effect of a specific treatment by thus utilizing the history information.
The present invention can be applied to a measurement system and method for measuring living bodies to conduct noninvasive cerebrovascular disease tests.
It should be further understood by those skilled in the art that although the foregoing description has been made on embodiments of the invention, the invention is not limited thereto and various changes and modifications may be made without departing from the spirit of the invention and the scope of the appended claims.
Claims (14)
- A living body measurement system comprising:a cerebral blood volume measurement unit (120) for measuring a regional cerebral blood volume of a subject;an arterial pressure/heart rate measurement unit (130) for measuring an arterial pressure and/or a heart rate of the subject;an analysis unit (112) for analyzing signals measured by the cerebral blood volume measurement unit and the arterial pressure/heart rate measurement unit;an extraction unit (112) for extracting information concerning a regional cerebral vascular state of the subject on the basis of an output of the analysis unit; anda display unit (113) for displaying a measurement result measured by the cerebral blood volume measurement unit and/or the arterial pressure/heart rate measurement unit, an analysis result analyzed by the analysis unit, or an extraction result extracted by the extraction unit.
- The system of claim 1, further comprising an input unit for inputting living body information and/or diagnosis information of the subject.
- The system of claim 1, wherein the display unit classifies the information concerning the regional cerebral vascular state of the subject into classes for each region in the head.
- The system of claim 1, wherein the display unit displays history of past diagnosis information of the subject.
- The system of claim 1, further comprising a storage unit (112) for storing a measurement result measured by the cerebral blood volume measurement unit and/or the arterial pressure/heart rate measurement unit, an analysis result analyzed by the analysis unit, or an extraction result extracted by the extraction unit as a database,
wherein the extraction unit extracts the information concerning the regional cerebral vascular state of the subject on the basis of the database stored in the storage unit and an output of the analysis unit. - The system of claim 5, wherein the database stores standard cerebral vascularity information, and the extraction unit conducts sensitivity correction in each cerebral region for the subject on the basis of the standard cerebral vascularity information.
- The system of claim 4, further comprising a storage unit (112) for storing confirmed diagnosis information of a plurality of subjects, wherein the extraction unit determines magnitude of the first threshold and/or the second threshold so as to maximize a correct answer rate of the extraction on the basis of the confirmed diagnosis information.
- The system of claim 1, wherein the cerebral blood volume measurement unit (120) comprises:a plurality of light irradiation means (105) for applying light beams to a head of the subject;a plurality of light sensing means (108) for detecting light beams applied from the light irradiation means and passed through a head of the subject; anda computing unit (111) for calculating a blood volume change of the head of the subject on the basis of light beams detected by the light sensing means.
- A living body measurement method comprising the steps of:measuring a regional cerebral blood volume of a subject;measuring an arterial pressure and/or a heart rate of the subject;analyzing the measured regional cerebral blood volume and the measured arterial pressure and/or heart rate; andextracting information concerning a regional cerebral vascular state of the subject on the basis of information obtained by the analysis.
- The system of claim 1 or the method of claim 9, including analyzing power spectra of the measured regional cerebral blood volume and the measured arterial pressure and/or heart rate.
- The system or method of claim 10, including calculating a first power strength ratio in a first frequency band and a second frequency band of the artery pressure and/or the heart'rate and a second power strength ratio in the first frequency band and the second frequency band of the regional cerebral blood volume on the basis of an analysis result obtained at the analyzing step, and extracting information concerning the cerebral vascular state on the basis of whether the first power strength ratio and/or the second power strength ratio is greater than a first threshold.
- The system or method of claim 11, including extracting information concerning the cerebral vascular state on the basis of whether the first power strength ratio and the second power strength ratio is greater than a second threshold.
- The system or method of claim 11, wherein the first frequency band is in a range of 0.01 to 0.05 Hz, and the second frequency band is in a range of 0.07 to 0.11 Hz.
- The system or method of claim 10, including removing a 1/f spectrum component from the power spectra.
Applications Claiming Priority (1)
| Application Number | Priority Date | Filing Date | Title |
|---|---|---|---|
| JP2006117402A JP2007289224A (en) | 2006-04-21 | 2006-04-21 | Biological measuring device and biological measuring method |
Publications (1)
| Publication Number | Publication Date |
|---|---|
| EP1847215A1 true EP1847215A1 (en) | 2007-10-24 |
Family
ID=38222087
Family Applications (1)
| Application Number | Title | Priority Date | Filing Date |
|---|---|---|---|
| EP07006887A Withdrawn EP1847215A1 (en) | 2006-04-21 | 2007-04-02 | Living body measurement system and method |
Country Status (4)
| Country | Link |
|---|---|
| US (1) | US20070287922A1 (en) |
| EP (1) | EP1847215A1 (en) |
| JP (1) | JP2007289224A (en) |
| CN (1) | CN100508877C (en) |
Families Citing this family (13)
| Publication number | Priority date | Publication date | Assignee | Title |
|---|---|---|---|---|
| JP5094326B2 (en) * | 2007-10-18 | 2012-12-12 | 株式会社日立製作所 | Biological measuring device |
| JP5303184B2 (en) * | 2008-05-08 | 2013-10-02 | 株式会社日立製作所 | Biological light measurement device |
| JP5420860B2 (en) * | 2008-06-12 | 2014-02-19 | セイコーインスツル株式会社 | Cerebrovascular disease risk assessment device |
| US7744541B2 (en) * | 2008-07-29 | 2010-06-29 | Raba Equity Partners Ii, Llc | Cerebral vascular reactivity monitoring |
| WO2010038393A1 (en) | 2008-09-30 | 2010-04-08 | 国立大学法人奈良先端科学技術大学院大学 | Intracerebral information measuring device |
| CN102333489A (en) * | 2009-03-19 | 2012-01-25 | 株式会社岛津制作所 | Photobiological measuring device and analyzing method |
| KR101081659B1 (en) * | 2010-01-29 | 2011-11-09 | 이병훈 | Auto-diagnostic blood manometer |
| KR101138256B1 (en) | 2010-08-20 | 2012-04-24 | 손영달 | Appratus for lighting control by biofeedback |
| US9474451B2 (en) * | 2011-04-01 | 2016-10-25 | Raba Equity Partners Ii, Llc | Systems and methods for varying blood flow to identify autoregulatory ranges in a patient |
| WO2013040724A1 (en) * | 2011-09-21 | 2013-03-28 | 深圳市乐心医疗电子有限公司 | Method and system for processing health data |
| US10537275B2 (en) | 2013-06-25 | 2020-01-21 | The General Hospital Corporation | System and method for non-invasive, intracranial brain motion monitoring |
| CN105380764A (en) * | 2015-10-26 | 2016-03-09 | 中国人民解放军第306医院 | Novel movable nursing system |
| US10791981B2 (en) * | 2016-06-06 | 2020-10-06 | S Square Detect Medical Devices | Neuro attack prevention system, method, and apparatus |
Citations (8)
| Publication number | Priority date | Publication date | Assignee | Title |
|---|---|---|---|---|
| EP0502270A1 (en) * | 1991-03-07 | 1992-09-09 | Hamamatsu Photonics K.K. | Tissue oxygen measuring system |
| EP0807402A1 (en) * | 1996-04-15 | 1997-11-19 | Ohmeda Inc. | Photoplethysmographic perfusion index monitoring |
| WO2003059164A2 (en) * | 2002-01-15 | 2003-07-24 | Orsan Medical Equipment Ltd. | Device for monitoring blood flow to brain |
| EP1380253A1 (en) * | 2002-07-08 | 2004-01-14 | Hitachi, Ltd. | Optical system for measuring metabolism in a body |
| EP1452136A1 (en) * | 2003-02-28 | 2004-09-01 | Hitachi, Ltd. | Optical device for measuring cerebral function |
| US20040240612A1 (en) * | 2001-06-22 | 2004-12-02 | Katsumi Suzuki | X-ray image diagnostic device, and x-ray image data correcting method |
| US20060025688A1 (en) * | 2002-10-07 | 2006-02-02 | Tohoku Techno Arch Co. Ltd. | Blood flow visualizing diagnostic apparatus |
| WO2006011128A1 (en) * | 2004-07-15 | 2006-02-02 | Orsan Medical Technologies Ltd. | Cerebral perfusion monitor |
Family Cites Families (11)
| Publication number | Priority date | Publication date | Assignee | Title |
|---|---|---|---|---|
| JPH01204655A (en) * | 1988-02-09 | 1989-08-17 | Toshiba Corp | Device for treating blood flowing sound in cranium |
| JPH09215664A (en) * | 1996-02-13 | 1997-08-19 | Nippon Colin Co Ltd | Evaluator of autonomic nerve function |
| US20040082862A1 (en) * | 2002-07-10 | 2004-04-29 | Britton Chance | Examination and imaging of brain cognitive functions |
| JP2002112974A (en) * | 2000-10-05 | 2002-04-16 | Citizen Watch Co Ltd | Method and device for discriminating state of organism |
| JP2002209862A (en) * | 2001-01-19 | 2002-07-30 | Toyota Central Res & Dev Lab Inc | Physical condition determination device and body condition determination device |
| JP2003250767A (en) * | 2002-03-05 | 2003-09-09 | Seiko Instruments Inc | Dynamic circulation movement measurement apparatus |
| AU2003227315A1 (en) * | 2002-04-02 | 2003-10-13 | Yeda Research And Development Co. Ltd. | Characterization of moving objects in a stationary background |
| WO2004036379A2 (en) * | 2002-10-17 | 2004-04-29 | The General Hospital Corporation | Arrangement and method for detecting abnormalities and inconsistencies in a body |
| IL155955A0 (en) * | 2003-05-15 | 2003-12-23 | Widemed Ltd | Adaptive prediction of changes of physiological/pathological states using processing of biomedical signal |
| JP4474145B2 (en) * | 2003-11-12 | 2010-06-02 | 株式会社日立メディコ | Optical measuring device |
| US8485978B2 (en) * | 2006-01-17 | 2013-07-16 | The Trustees Of Dartmouth College | Systems and methods for noninvasively monitoring baroreflex response and nominal blood volume |
-
2006
- 2006-04-21 JP JP2006117402A patent/JP2007289224A/en active Pending
-
2007
- 2007-02-28 CN CNB2007100850805A patent/CN100508877C/en not_active Expired - Fee Related
- 2007-04-02 EP EP07006887A patent/EP1847215A1/en not_active Withdrawn
- 2007-04-04 US US11/696,295 patent/US20070287922A1/en not_active Abandoned
Patent Citations (8)
| Publication number | Priority date | Publication date | Assignee | Title |
|---|---|---|---|---|
| EP0502270A1 (en) * | 1991-03-07 | 1992-09-09 | Hamamatsu Photonics K.K. | Tissue oxygen measuring system |
| EP0807402A1 (en) * | 1996-04-15 | 1997-11-19 | Ohmeda Inc. | Photoplethysmographic perfusion index monitoring |
| US20040240612A1 (en) * | 2001-06-22 | 2004-12-02 | Katsumi Suzuki | X-ray image diagnostic device, and x-ray image data correcting method |
| WO2003059164A2 (en) * | 2002-01-15 | 2003-07-24 | Orsan Medical Equipment Ltd. | Device for monitoring blood flow to brain |
| EP1380253A1 (en) * | 2002-07-08 | 2004-01-14 | Hitachi, Ltd. | Optical system for measuring metabolism in a body |
| US20060025688A1 (en) * | 2002-10-07 | 2006-02-02 | Tohoku Techno Arch Co. Ltd. | Blood flow visualizing diagnostic apparatus |
| EP1452136A1 (en) * | 2003-02-28 | 2004-09-01 | Hitachi, Ltd. | Optical device for measuring cerebral function |
| WO2006011128A1 (en) * | 2004-07-15 | 2006-02-02 | Orsan Medical Technologies Ltd. | Cerebral perfusion monitor |
Also Published As
| Publication number | Publication date |
|---|---|
| CN101057778A (en) | 2007-10-24 |
| US20070287922A1 (en) | 2007-12-13 |
| CN100508877C (en) | 2009-07-08 |
| JP2007289224A (en) | 2007-11-08 |
Similar Documents
| Publication | Publication Date | Title |
|---|---|---|
| EP1847215A1 (en) | Living body measurement system and method | |
| Esmaelpoor et al. | A multistage deep neural network model for blood pressure estimation using photoplethysmogram signals | |
| JP5094326B2 (en) | Biological measuring device | |
| US6507753B1 (en) | Method and apparatus to detect acute cardiac syndromes in specified groups of patients using ECG | |
| KR100954817B1 (en) | System and method for testing blood vessel's health and stress through signal analysis of pluse wave | |
| US8275436B2 (en) | Method and apparatus for non-invasive fetal oximetry | |
| US10201314B2 (en) | System and method for evaluation of circulatory function | |
| US6178343B1 (en) | Pulse rate and heart rate coincidence detection for pulse oximetry | |
| US20080242955A1 (en) | Reliability in determination of clinical state of a subject | |
| US20120136226A1 (en) | Pulse Oximetry For Determining Heart Rate Variability As A Measure Of Susceptibility To Stress | |
| WO2011077294A1 (en) | Method of and apparatus for processing photoplethymograph signals | |
| Zhang et al. | Development of continuous cuffless blood pressure prediction platform using enhanced 1-D SENet–LSTM | |
| JP2002010986A (en) | Non-invasive measuring device for blood volume in brain | |
| EP4027872B1 (en) | A system for non-invasively measuring blood volume oscillations inside cranium of a human subject | |
| Castro et al. | Systematic review of intrapartum fetal heart rate spectral analysis and an application in the detection of fetal acidemia | |
| Kobayashi et al. | Development of a mental disorder screening system using support vector machine for classification of heart rate variability measured from single-lead electrocardiography | |
| US20070149870A1 (en) | Systems and methods for determining an organism's pathology | |
| US10327648B2 (en) | Blood vessel mechanical signal analysis | |
| Ignacz et al. | NB-SQI: A novel non-binary signal quality index for continuous blood pressure waveforms | |
| Annunziata et al. | Computerized analysis of fetal heart rate variability signal during the stages of labor | |
| Luttkus et al. | Correlation of fetal oxygen saturation to fetal heart rate patterns, Evaluation of fetal pulse oximetry with two different oxisensors | |
| JP5388511B2 (en) | Biological light measurement device with evaluation function | |
| Huang et al. | Application of heart rate variability during blood pressure measurement in patients with somatic symptom disorder | |
| CN117322876A (en) | Cerebral oxygen supply and demand monitoring system, method and medium based on artery and vein parameters of neck | |
| Rundo et al. | Deep bio-sensing embedded system for a robust car-driving safety assessment |
Legal Events
| Date | Code | Title | Description |
|---|---|---|---|
| PUAI | Public reference made under article 153(3) epc to a published international application that has entered the european phase |
Free format text: ORIGINAL CODE: 0009012 |
|
| AK | Designated contracting states |
Kind code of ref document: A1 Designated state(s): AT BE BG CH CY CZ DE DK EE ES FI FR GB GR HU IE IS IT LI LT LU LV MC MT NL PL PT RO SE SI SK TR |
|
| AX | Request for extension of the european patent |
Extension state: AL BA HR MK YU |
|
| 17P | Request for examination filed |
Effective date: 20080331 |
|
| 17Q | First examination report despatched |
Effective date: 20080603 |
|
| AKX | Designation fees paid |
Designated state(s): DE FR GB |
|
| STAA | Information on the status of an ep patent application or granted ep patent |
Free format text: STATUS: THE APPLICATION IS DEEMED TO BE WITHDRAWN |
|
| 18D | Application deemed to be withdrawn |
Effective date: 20090818 |