EP1760634A2 - Messung der mitotischen Aktivität - Google Patents
Messung der mitotischen Aktivität Download PDFInfo
- Publication number
- EP1760634A2 EP1760634A2 EP06024926A EP06024926A EP1760634A2 EP 1760634 A2 EP1760634 A2 EP 1760634A2 EP 06024926 A EP06024926 A EP 06024926A EP 06024926 A EP06024926 A EP 06024926A EP 1760634 A2 EP1760634 A2 EP 1760634A2
- Authority
- EP
- European Patent Office
- Prior art keywords
- mitotic
- image
- profile
- pixels
- value
- Prior art date
- Legal status (The legal status is an assumption and is not a legal conclusion. Google has not performed a legal analysis and makes no representation as to the accuracy of the status listed.)
- Granted
Links
Images


Classifications
-
- G—PHYSICS
- G06—COMPUTING OR CALCULATING; COUNTING
- G06V—IMAGE OR VIDEO RECOGNITION OR UNDERSTANDING
- G06V20/00—Scenes; Scene-specific elements
- G06V20/60—Type of objects
- G06V20/69—Microscopic objects, e.g. biological cells or cellular parts
-
- G—PHYSICS
- G06—COMPUTING OR CALCULATING; COUNTING
- G06T—IMAGE DATA PROCESSING OR GENERATION, IN GENERAL
- G06T7/00—Image analysis
- G06T7/0002—Inspection of images, e.g. flaw detection
- G06T7/0012—Biomedical image inspection
-
- G—PHYSICS
- G01—MEASURING; TESTING
- G01N—INVESTIGATING OR ANALYSING MATERIALS BY DETERMINING THEIR CHEMICAL OR PHYSICAL PROPERTIES
- G01N15/00—Investigating characteristics of particles; Investigating permeability, pore-volume or surface-area of porous materials
- G01N15/10—Investigating individual particles
- G01N15/14—Optical investigation techniques, e.g. flow cytometry
- G01N15/1429—Signal processing
- G01N15/1433—Signal processing using image recognition
-
- G—PHYSICS
- G06—COMPUTING OR CALCULATING; COUNTING
- G06T—IMAGE DATA PROCESSING OR GENERATION, IN GENERAL
- G06T2207/00—Indexing scheme for image analysis or image enhancement
- G06T2207/30—Subject of image; Context of image processing
- G06T2207/30004—Biomedical image processing
- G06T2207/30024—Cell structures in vitro; Tissue sections in vitro
Definitions
- This invention relates to a method, an apparatus and a computer program for measurement of mitotic activity, which indicates cell division taking place in a tissue specimen: it is particularly relevant to making measurements on potentially cancerous tissue such as breast cancer tissue.
- the method is also relevant to other forms of cancer such as colon and cervical cancer.
- Breast cancer is a common form of female cancer, and also occurs to a lesser extent in the male: once a lesion indicative of breast cancer has been detected, tissue samples are taken and examined by a histopathologist to establish a diagnosis, prognosis and treatment plan.
- pathological analysis of tissue samples is a time consuming and inaccurate process. It entails interpretation of images by human eye, which is highly subjective: it is characterised in particular by considerable subjectivity in observations of the same samples by different observers and even by the same observer at different times. For example, two different observers assessing the same ten tissue samples may give different opinions for three of the slides - 30% error. The problem is exacerbated by heterogeneity, i.e. complexity of some tissue sample features.
- WO 02/47032 A1 relates to measurement of DNA in cells from cell images to indicate mitotic phase. It refers to the use of other image analysis parameters giving one example, magnitude of intensity variance, but does not give details of how this variance can be used to indicate mitotic activity.
- the present invention provides a method of measuring mitotic activity from histopathological specimen image data, characterised in that the method has the steps of:
- the invention preferably includes counting the image region as indicating a mitotic figure if its profile has a first value not greater than the prearranged threshold at a position in the profile having intensity associated with mitotic figure imagery, a second value greater than a prearranged second threshold, a third value greater than a prearranged third threshold, and a minimum value less than a prearranged fourth threshold.
- the first value may be at one end of the profile, the first and second values may adjoin one another in the profile and the third value may not adjoin the second value.
- the image data may comprise a first Principal Component obtained by Principal Component Analysis (PCA) of coloured image data, and step a) may include preprocessing image data by:
- PCA Principal Component Analysis
- pixels may be cued for acceptance or rejection as regards indicating mitotic figures by:
- pixels may alternatively be cued for acceptance or rejection as regards indicating mitotic figures by:
- the present invention provides computer apparatus for measuring mitotic activity from histopathological specimen image data, characterised in that it is programmed to execute the steps of:
- the present invention provides a computer program for use in measuring mitotic activity from histopathological specimen image data, characterised in that its instructions provide for implementing the steps of:
- the computer apparatus and computer program aspects of the invention may have preferred features equivalent to corresponding method aspects of the invention.
- the present invention provides a method of measuring mitotic activity from histopathological specimen image data, characterised in that the method includes cueing pixels for acceptance or rejection as regards indicating mitotic figures for subsequent mitosis assessment by:
- the present invention provides a method of measuring mitotic activity from histopathological specimen image data, characterised in that the method includes cueing pixels for acceptance or rejection as regards indicating mitotic figures for subsequent mitosis assessment by:
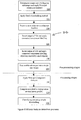
- FIG. 1 a procedure 10 for the assessment of tissue samples in the form of histopathological slides of potential carcinomas of the breast is shown.
- This drawing illustrates processes for measuring mitotic activity to produce a parameter for use by a pathologist as the basis for assessing patient diagnosis.
- the procedure 10 employs a database 12, which maintains digitised image data obtained from histological slides as will be described later. Sections are taken (cut) from breast tissue samples (biopsies) and placed on respective slides. Slides are stained using the staining agent haematoxylin & eosin (H&E), which is a common stain for delineating tissue and cellular structure. Tissue stained with H&E is used to assess mitotic activity.
- H&E haematoxylin & eosin
- Measurement of mitotic activity in a tissue specimen gives an indication of the degree of cell division that is taking place.
- a histopathological slide is a snap shot representing a very short time interval in a cell division process, so the chance of such a slide showing a particular phase of mitotic activity is very small: if such a phase is in fact present in a slide, that is a good indicator of how fast a potential tumour is growing.
- a clinician places a slide under a microscope and examines a region of it (referred to as a tile) at magnification of x40 for indications of mitotic activity.
- This manual procedure involves a pathologist subjectively and separately estimating unusual colour, size, shape and boundary definition of cells in a tissue sample. The values obtained in this way are combined by the pathologist to give a single measurement for use in diagnosis.
- the process hereinafter described in this example replaces the prior art manual procedure with an objective procedure.
- the invention uses image data from histological slides.
- image data were obtained by a pathologist using Zeiss Axioskop microscope with a Jenoptiks Progres 3012 digital camera.
- Image data from each slide is a set of digital images obtained at a linear magnification of 40 (i.e. 40X), each image being an electronic equivalent of a tile.
- a pathologist scans the microscope over a slide, and at 40X magnification selects regions (tiles) of the slide which appear to be most promising in terms of analysing of mitotic activity. Each of these regions is then photographed using the microscope and digital camera referred to above, and this produces for each region a respective digitised image in three colours, i.e. red, green and blue (R, G & B). Three intensity values are obtained for each pixel in a pixel array to provide an image as a combination of R, G and B image planes. This image data is stored temporarily at 12 for later use. Ten digitised images are required for measurement of mitotic activity at 14 which then provides input to a diagnostic report at 28.
- a number of alternative processes 16 to 24 will be described to measure mitotic activity in a given sample: these comprise two alternative mitotic cueing processes 16 and 18 and two alternative mitotic feature detection processes 20 and 24.
- the measure of mitotic activity is converted at 26 into a mitotic count for use by a pathologist.
- the first alternative mitotic cueing process 16 is shown in more detail. If it is selected for use, it is carried out for each of the ten digitised images mentioned above, but will now be described for one such image referred to as the input image. It is used to cue or identify dark image regions, which may correspond to mitotic cells.
- three histograms are formed showing the occurrence frequency of pixel intensities, one histogram representing R (red) intensities, one B (blue) and one G (green).
- R red
- B blue
- G green
- an image with 8 bits per colour per pixel would have a histogram abscissa axis of 256 intensity values, 0 to 255, and a histogram ordinate axis of number of pixels in the image having each intensity value.
- the histograms and the thresholds T R , T G and T B are then used for each image plane to select low intensity pixels whose total number does not exceed the threshold T R , T G or T B .
- T B is 2x10 4 /140 or ⁇ 142.
- the red image plane histogram might have numbers of pixels 3, 20, 50, 7, 20, 80 and 65 at pixel intensity values 0 to 6 respectively.
- the total number of pixels having pixel intensity values 0 to 6 is 245, which exceeds the red image plane threshold T R of 200; however the total number over pixel intensity values 0 to 5 is less than 200, and these are therefore retained and pixels with intensity values 6 to 255 are rejected.
- the procedure retains a small part of the histogram, which corresponds to the darker regions of the red image plane (mitotic cells tend to be dark). This procedure is repeated for the green and blue image planes using their respective thresholds.
- the objective is to retain in each image plane a number of pixels which are likely to be in proportion to the number of pixels in the image.
- the next stage 34 is spatial filtering: here the red, green and blue retained pixels are compared and every pixel which is not retained in all three image planes after thresholding is rejected. Each pixel remaining after spatial filtering is then cued by assigning it a binary 1 value and all other pixels in the image which have rejected are set to binary 0: this creates a single combined binary image for output from the stage 34.
- CCL connected component labelling
- CCL gives numerical labels to image regions which are "blobs" in the binary image, blobs being groups of contiguous or connected pixels of the same value 1 in a binary image containing 0s and 1s only: each group or blob is assigned a number (label) different to those of other groups to enable individual blobs to be distinguished from others.
- CCL also provides blob areas in terms of number of pixels.
- Blobs are then retained (pixels set to 1) or rejected (pixels set to 0) based on their dimensions: blobs are retained if they both contain from 95 to 5000 pixels inclusive and have height and width of not more than 2000 pixels.
- the minimum area of 95 pixels is deliberately set to a small value to avoid rejecting too many blobs that might be of interest for possible mitotic activity.
- the maximum area is set to a large value for the same reason.
- the output of stage 36 is a binary image containing a set of labelled blobs for analysis for mitotic activity as will be described later. Stage 36 is useful for removing blobs which aren't likely to be relevant for later processing, but it is not essential.
- the second mitotic cueing process 18 is shown in more detail. As in the previous example, if the process 18 is selected for use, it is carried out for each of the ten digitised images mentioned above, but will now be described for one such image.
- a single iteration of a technique known as "Hidden Markov Random Field segmentation" is performed on the red component of an original (RGB) input image of a tile.
- This segmentation is a known image processing technique, see by Devijver P.A., 'Image segmentation using causal Markov Random Field models', Pattern Recognition, J.Kittler (ed) Lecture Notes in Computer Science 301, Springer-Verlag 1988 ; also Ducksbury P.G., 'Parallel model based segmentation using a 3rd order hidden Markov model', 4th IEE Int. Conf. Image Processing and its Applications, Maastricht, 7-9 April, 1992 .
- the input image is quantised into four levels (i.e. reduced from potentially 256 grey levels to just four): the first of these levels corresponds to very dark areas of the input image, second and third levels are progressively less dark and the fourth level corresponds to light image areas.
- the Equation (1) distributions form the basis of image segmentation, which is defined as separation of objects from a background in a digital image.
- the output from this stage 40 is a mask image where each pixel has been allocated one of four numbers (1, 2, 3 or 4). Only pixels having label 1 (corresponding to dark image areas) are used in subsequent processing stages.
- K-means clustering process is performed: this is a known process which is described by J.A. Hartigan and M.A. Wong in a paper entitled 'A K-means clustering algorithm', Algorithm AS 136, Applied Statistics Journal, 1979 .
- K-means is an iterative statistical technique for computing an optimal set of clusters (groups of data items sharing some common property) from a dataset. This process uses raw image pixels from the red component of the original (RGB) input image of a tile input at 40: it selects those red pixels that are located in the same image position as pixels labelled 1 in the mask image generated at 40.
- CCL connected component labelling
- CCL is applied to the mask created at 42 which marks the joint cluster (cluster 1 OR cluster 2).
- CCL also gives the areas of labelled blobs in terms of numbers of pixels. Blobs that are outside an allowed area range are rejected, and those within this range are retained as indicated in the table below and renumbered sequentially from label 1 upwards.
- the output from stage 44 is a set of labelled blobs. EITHER blob size ⁇ 70 pixels OR size > 262144 pixels Reject blob - set all its pixels to 0 and exclude from set of labelled blobs 70 pixels ⁇ blob size ⁇ 262144 pixels Accept for further processing and include in set of labelled blobs
- stage 44 is useful to remove unwanted blobs but could be dispensed with.
- each labelled blob generated at 44 is considered and accepted or rejected based on a contextual analysis of its cluster 1/(cluster 1 + cluster 2) score; i.e. from the results of 42, for each blob find how many of its pixels are in cluster 1 (NC1) and how many in cluster 2 (NC2): then calculate the ratio NC1/(NC1 + NC2), and accept the blob for further processing if this ratio is 0.6 or greater. Reject the blob if the ratio is less than 0.6. The result is a reduced set of blobs.
- Contextual measure ⁇ cluster context threshold (60%) Accept for further processing into set of blobs
- Contextual measure ⁇ cluster context threshold (60%)
- Reject blob At 48 take the reduced set of blobs generated at 46 and perform a rejection using a 'necrotic filter': such a filter computes a standard metric referred to as the Euclidean metric M Eu of normalised quantised boundary phase (as described later).
- the 'necrotic filter' process is as follows: firstly, a Sobel edge filter is applied to the labelled image obtained from step 44 and the raw image - i.e. the red component of the original (RGB) input image input to stage 40 tile.
- the labelled image is used to obtain the boundary of the blob that may correspond to a mitotic figure and the raw image is used to obtain the phase angle of pixels in the raw image.
- Sobel is a standard image processing technique published in Klette R., & Zamperoni P., 'Handbook of image processing operators', John Wiley & Sons, 1995 .
- a Sobel filter consists of two 3x3 arrays of numbers S P and S Q , each of which is convolved with successive 3x3 arrays of pixels in an image.
- S P 1 2 1 0 0 0 - 1 - 2 - 1
- S Q 1 0 - 1 2 0 - 2 1 0 - 1
- a first 3x3 array of pixels is selected in the top left hand corner of the labeled image: designating as C ij a general labelled pixel in row i and column j, the top left hand corner of the image consists of pixels C 11 to C 13 , C 21 to C 23 and C 31 to C 33 .
- C ij is then multiplied by the respective digit of S P located in the S P array as C ij is in the 3x3 cyan pixel array: i.e. C 11 to C 13 are mutilplied by 1, 2 and 1 respectively, C 21 to C 23 by zeroes and C 31 to C 33 by -1, -2 and -1 respectively.
- the products so formed are added algebraically and provide a value p.
- the value of p will be relatively low for pixel values changing slowly between the first and third rows either side of the row of C 22 , and relatively high for pixel values changing rapidly between those rows: in consequence p provides an indication of edge sharpness across rows.
- This procedure is repeated using the same pixel array but with S Q replacing S P , and a value q is obtained: q is relatively low for pixel values changing slowly between the first and third columns either side of the column of C 22 , and relatively high for pixel values changing rapidly between those columns, and q therefore provides an indication of edge sharpness across columns.
- the square root of the sum of the squares of p and q are then computed i.e.
- Tan -1 p/q is also obtained at each pixel and is defined as a "phase angle".
- a general pixel T ij (row i, column j) in the transformed image is derived from C i-1,j-1 to C i-1,j+1 , C i,j-1 to C i,j+1 and C i+1,j-1 to C i+1,j+1 of the labeled image.
- p and q are calculated for successive 3X3 pixel arrays by incrementing j by 1 and evaluating Equations (2) and (3) for each such array until the end of a row is reached; j is then incremented by 1 and the procedure is repeated for a second row and so on until the whole image has been transformed.
- the Sobel filter cannot calculate values for pixels at image edges having no adjacent pixels on one or other of its sides: i.e. in a pixel array having N rows and M columns, edge pixels are the top and bottom rows and the first and last columns, or in the transformed image pixels T 11 to T 1M , T N1 to T NM , T 11 to T 1M and T 1M to T NM .
- the output of the Sobel filter comprises two transformed images, one (the edge filtered image) contains the boundaries of the labeled blobs produced at 44 whilst the other contains the "phase angle" of the raw input image.
- a pixel of a labelled blob is a boundary pixel if the like-located pixel in the Sobel edge filtered image is non-zero: for each boundary pixel the phase angle is extracted from the like-located pixel in the Sobel phase angle image. This phase angle information is then quantised to reduce it to four orientation ranges (0 - 44, 45 - 89, 90 - 134, 135 - 179 degrees) and the number of boundary pixels in each orientation is normalised by dividing it by the number of pixels in the perimeter of the blob.
- each of the blobs remaining after step 48 is examined and a 'hairy edge filter' operation is performed.
- a 'hairy edge filter' measures the amount of edge structure in an area around a blob, this being a rough approximation to the 'hairy fibres' sometimes seen around mitotic figures. This is computed for each blob as follows: a) Two morphological dilations are applied using filters 5x5 and 13x13 pixels in size as shown below.
- the expansion operation comprises locating each pixel with value 1 and setting pixels in its vicinity also to 1.
- a central 1 indicates a pixel found to be 1 in the image
- other 1s indicate the relative positions of nearby pixels set to 1 to implement morphological dilation
- 0s represent pixels left unchanged.
- Morphology is an image processing technique based on shape and geometry. It is a standard image processing procedure published in Umbaugh S.C., 'Colour vision and image processing', Prentice Hall, 1998 . Morphology applies a filter of some size and shape to an image. In the simplest sense dilation (dilates (or expands) an object) at each pixel position the output of the dilation is the logical OR of the inputs.
- the filters used contain approximations to circles as shown above.
- the application of the two dilation operations results in two dilated results.
- Each blob is dilated by two different amounts, as described with reference to Equations (6) and (7): the blob resulting from the 5x5 filter is then subtracted from that resulting from the 13x13 filter, which results in a border around the blob. This is repeated for each of the blobs remaining after step 48.
- a Sobel filter (as previously described) is applied to obtain the gradient of the raw image - i.e. the red component of the original (RGB) input image of a tile input at 40.
- a summation of gradient values is formed within the area of the border (mask) determined at a) around each blob and is used as a filter measure for comparison with a Hairy Threshold for acceptance and rejection of blobs as shown in the table immediately below.
- step b) is a set of cued blobs considered valid for use in mitosis feature detection as will be described later.
- Stages 46, 48 and 50 are desirable to reduce unwanted blobs, but are not essential if the consequent processing burden in mitotic feature detection can be tolerated.
- an input RGB image is preferably white balanced by remapping its most luminous pixel to white.
- RatioR 255 / LumMaxR ⁇ 1.05
- RatioG 255 / LumMaxG ⁇ 1.05
- RatioB 255 / LumMaxB ⁇ 1.05
- the final stage is to clip the new white balanced image so that no pixel values lie outside the eight bit range (0 to 255). If any pixel value is less than 0, it is set to zero and if any pixel value is greater than 255, it is set to 255. Production of a white balanced image is not essential but desirable to reduce variation between images.
- the clipped white balanced image from step 60 is filtered with a 3x3 median filter to remove spatial noise (desirable but not essential).
- the filter is applied independently to each of the balanced red (BalancedR), green (BalancedG) and blue (BalancedB) image planes computed at 60: the median filter operation selects each pixel in these image planes in succession (other than edge pixels) and takes a 3 x 3 array of those pixels centred on the selected pixel.
- the 3 x 3 array of pixels is then sorted into ascending order of pixel value using what is referred to as "quicksort".
- an 'autopick colour' process is applied which picks or locates a pixel having the lowest luminance (darkest) in the median filtered image (excluding outlying pixels relatively remote from pixels of similar luminance): this means that the chosen pixel has at least one relatively nearby pixel with luminance similar to its own. Dark pixels are selected because mitotic figures tend to have relatively low luminance using conventional histological slide preparation techniques.
- Equation (15) provides a luminance image: in the luminance image a first pixel value and its location is stored as a current darkest pixel. Successive pixels in that image are compared with the first pixel: if any comparison pixel has L i darker (lower value of luminance) than the current darkest then its pixel value and its location are stored in a list of darkest pixels. After the list has reached ten entries, the current least dark pixel in it is removed and replaced by a later pixel on each occasion a later pixel is darker than the least dark pixel: this process continues until all pixels have been compared with and where appropriate added to the list.
- the list of darkest pixels is sorted into descending order of darkness using Quicksort (as mentioned above) so that the darkest is first. If the procedure results in less than ten darkest pixels, the stored comparison luminance value originally obtained from the first pixel is increased and the procedure repeated.
- the next step is to determine whether or not the darkest pixel satisfies the condition that it is located relatively near another of the ten darkest pixels: i.e. the condition is that these two pixels be separated by a distance of not more than twenty pixels in any direction (along a row, a column diagonally or between a diagonal and a row or column).
- This condition applies to an image of dimensions 1476 pixels by 1160 pixels, so the maximum separation is 2% of the smaller image dimension. If this condition is satisfied, a darkest pixel has been located having a comparatively near neighbour of similar luminance and therefore not considered to be an outlying pixel: the luminance of this darkest pixel is denoted by L picked colour .
- the procedure is iterated by discarding the current darkest pixel from the list and taking the remaining darkest pixel ; iteration continues until the condition is met.
- the list size of ten was determined by analysis of the ten images selected as previously described, but it is not critical and a different number can be chosen. The pixel from which L picked colour is taken should therefore be selected from a small group (twenty or less) of the darkest pixels.
- a 'colour proximity highlighting' is carried out which locates image pixels in the median filtered image that have luminances differing from L picked colour by less than 20 (i.e. less than 8% for an eight-bit intensity range from 0 to 255). This is carried out by creating a mask image as follows: for each pixel in the median filtered image, if a luminance inequality condition (16) below is true then the pixel is accepted and represented by a value 255 in the equivalent position in the mask image. 0.299 ⁇ R i + 0.587 ⁇ G i + 0.114 ⁇ B i - L picked colour ⁇ 20
- the above computer program steps provide a mechanism for continuing to grow a cell from an original single pixel in the mask image by reassessing further pixels for growth.
- Nearest neighbour pixels of a 'seed' mask image pixel to be grown are assessed: each of the nearest neighbours which becomes added (changed to 1) in growth is also added to the Action List for its uncompared nearest neighbours to be assessed. Growth therefore proceeds until all pixels adjoining but not part of a grown cell have been assessed and have failed one or more of the three luminance criteria (a), (b) and (c). Growth then terminates for that cell and restarts for another cell based on a new 'seed' mask image pixel.
- the result of 68 is a new image 'grow' which now contains a set of blobs (image regions of contiguous pixels of value 1) which are candidates for indicating positions of real cells that are likely to be of interest for mitosis.
- the blobs are processed at 70 by connected component labelling as previously described: this derives a set of measurements for each blob as follows:
- the perturbed difference is computed as follows:
- a logical EXOR function is then computed between the new larger and smaller blobs: i.e. each pixel in the smaller blob is EXORed with a respective pixel in the same position in the larger blob. Outer pixels of the larger blob for which there are no like-located pixels in the small blob are treated as being EXORed with a different pixel value.
- the EXOR function yields a 1 for a pair of pixels of different value and a 0 for a pair of pixels of the same value. Its results provide an EXOR image with each EXOR value located as a pixel in the same position as the blob pixels giving rise to it. The number of pixels equal to 1 in the EXOR image is then counted and this number is the perturbed difference.
- the Hue difference is obtained for each blob as follows: the average colour of the median filtered image pixels located in the same positions as the pixels of the blob is computed. This average colour and the background pixel colour obtained earlier are then converted from red/green/blue (RGB) to a different image space hue/saturation/value (HSV).
- RGB red/green/blue
- HSV hue/saturation/value
- the RGB to HSV transformation is described by K. Jack in 'Video Demystified', 2nd ed., HighText Publications, San Diego, 1996 . In this example the V and S components are not required.
- the difference between the H values of the average colour of the median filtered image pixels in the blob and the background pixel is then calculated for each blob and becomes designated as the Hue difference for that blob.
- a blob's parameters satisfy all the conditions in the table immediately below then the blob is accepted for further processing, otherwise it is rejected (deleted) by setting all its pixels to 0.
- Parameters for Accepted Blobs 355 pixels ⁇ Area ⁇ 1700 pixels 0.17 ⁇ Compactness ⁇ 0.77 Ratio of width/height ⁇ 2.7 Luminance percentage ⁇ 44 Perturbed difference ⁇ Area x 23/100 Hue difference > 0
- the Hue difference will virtually always be true (due to the zero threshold in the table immediately above). However in some circumstances it may be desirable to have a non-zero threshold. Luminance percentage, perturbed difference and Hue difference are not essential, and can be omitted from the thresholds in the table above governing further processing or otherwise.
- a two quicksorts are applied to the blobs to sort them into two lists, one of blobs in ascending order of blob area and the other of blobs in ascending order of blob luminance in the median filtered image.
- the blobs in the two lists are now referred to in accordance with groupings that they mark the end of: i.e. a blob is referred to as the "darkest X% blob" to indicate that it together with blobs (if any) of lower luminance than it are X% of the total number of blobs.
- a blob is referred to as the "largest Y% blob" to indicate that it together with blobs (if any) of greater area than it are Y% of the total number of blobs.
- a blob of median area (the "median blob", central in the area list) is now identified. If there is an even number of blobs in the area list, the average area of the two central blobs is taken as the median area. Also at 72, unwanted blobs are eliminated to leave those assessed as corresponding to mitotic figures as follows: if more than A blobs are present and the largest blob is more than B percent of the area of the median blob, we retain each of the largest C blobs which has a luminance not greater than that of the darkest D percent blob.
- the criterion number of blobs is not greater than A may be the only one used if desired, the mitotic count being taken as zero if this is not satisfied.
- the "otherwise" criterion, i.e. number of blobs greater than A and subsequent criteria, provide a further option.
- the process 20 is carried out for a total of ten images or tiles: this repetition is to increase the likelihood of observing mitotic activity.
- the mitotic counts for the ten images are then added together to provide a sum which is converted to a mitotic activity grading as will be described later.
- FIG. 6 there is shown a flow diagram of an alternative mitotic feature detection process 24 which is carried out for each of the ten digitised images mentioned above.
- the digitised image (hereinafter the "input image") is for convenience separated into overlapping windows of size 128x128 pixels. The windows overlap with 64 pixels in both horizontal and vertical directions. Thus, each window overlaps half of its preceding window above and to the left (if available).
- PCA Principal Component Analysis
- PCA Karhunen-Loeve Transform
- PCA is a standard mathematical technique described by Jollie I.T., 'Principal Component Analysis', Springer series in statistics, Springer Verlag, 1986.
- PCA is a technique for transforming a set of (possibly correlated) variables into a smaller number of uncorrelated variables called principal components.
- the first principal component accounts for as much of the variability in the set of variables as possible as compared to the other components: because of this it can be superior to taking a red, green or blue image plane or an average thereof, which are also options at this stage.
- PCA involves obtaining a covariance matrix of the set of variables and solving for its eigenvalues and eigenvectors.
- the covariance matrix is 3x3 and PCA yields three eigenvectors: the eigenvectors are treated as a 3x3 matrix, which is used to multiply the transpose of the Nx3 image matrix to produce a product matrix.
- the product matrix has an Nx1 first column which is the first principal component, which may be considered as the most important component. It is the component with the maximum eigenvalue, and it provides a greyscale sub-image (one pixel value for each of N pixels) with a maximum range of information compared to equivalents associated with other components.
- PCA is carried out for each of the overlapping windows defined above and each provides a respective first principal component and greyscale sub-image of size 128x128 pixels.
- each sub-image resulting from 120 is converted to a corresponding binary sub-image by applying a thresholding method referred to as "Otsu".
- Otsu is a standard thresholding technique published by Otsu N., 'A thresholding selection method from grey level histograms', IEEE Trans Systems, Man & Cybernetics, vol. 9, 1979, pp 62-66 .
- the Otsu threshold selection method aims to minimise for two classes a ratio of between-class variance to within-class variance: i.e. the higher the variance between classes the better the separation.
- the two classes are a below-threshold class (pixel value 0) and an above-threshold class (pixel value 1), so by applying Otsu thresholding the greyscale sub-image is converted into a binary sub-image containing a set of blobs.
- the outputs from 124 are inverted and connected component labelling (CCL, as described earlier) is applied in order to enable any holes in the blobs to be removed. This is not essential, but it provides spatial filtering which improves results somewhat. Because of the inversion, areas of pixel value 1 labelled by CCL labelling will be background pixels and holes within blobs. Holes, i.e. all labelled areas other than background pixels, are removed (filled in) by setting pixels of holes in each blob to the value of the blob's other pixels.
- CCL connected component labelling
- the outputs from 126 are inverted once more and CCL is applied: after this inversion, the labelled areas are the blobs within the sub-image filled at 126. CCL also yields blob centre positions used later. Any blobs smaller than a minimum area threshold of 400 pixels are rejected, i.e. set to an image background value, in accordance with the table immediately below. This is another desirable but not essential spatial filtering step. Blob size ⁇ min area (400 pixels) Reject blob Otherwise Accept for further processing into set of labelled blobs
- step 130 multiple sub-images output at 128 are reassembled into a new binary image which is the same size as the original before decomposition at 120; the new binary image has undergone filtering and now contains only blobs that are of interest for subsequent mitosis processing.
- Image preprocessing terminates with step 130: the set of blobs remaining has been cleared both of unwanted small blobs and of holes within blobs.
- Image preprocessing using steps 120-130 is advantageous because it does not significantly affect shapes of blob perimeters, which is important for mitosis analysis. Results from whichever of the mitosis cueing processes 16 and 18 has been used are introduced in this step 130: i.e.
- a blob is accepted or rejected according to whether or not there is a blob in the mitosis cued image in substantially the same position (this could be implemented using a logical AND operation). It is not essential to use a process 16 or 18 here but it is useful to reduce processing burden.
- PCA Principal Component Analysis
- a feature extraction procedure 134 is applied to a local window of 51x51 pixels centered on the centres of each of the blobs identified in pre-processing at 130 and appearing in the greyscale image.
- the procedure 134 determines an average cross-section (profile) for that respective region of the greyscale image that corresponds to each blob: for the purposes of this calculation each grayscale value used is normalised to lie in the range 0 to 1 by dividing it by 255.
- a respective series of profiles of each blob is taken using a line fifty-one pixels long extending across the respective greyscale image region corresponding to that blob and centered on the blob centre: this gives fifty-one pixel values or histogram points per profile, and profiles are taken at nine different angular orientations at 20 degree intervals: the respective mean of the nine profiles of each blob is then calculated.
- a respective histogram of each mean profile is then obtained and quantised to just five intervals or bins 1 to 5 as follows, (1) 0 ⁇ profile ⁇ 0.2, (2) 0.2 ⁇ profile ⁇ 0.4, (3) 0.4 ⁇ profile ⁇ 0.6, (4) 0.6 ⁇ profile ⁇ 0.8, and (5) 0.8 ⁇ profile ⁇ 1.0.
- the bins have centres at 0.1, 0.3, 0.5, 0.7 and 0.9 respectively.
- Each bin contains the number of pixels in the mean profile having its respective intensity value: because this number is averaged over the nine profiles it need not be an integer.
- Bin 1 corresponds to a darkest group of image intensity values, i.e.
- bins 2 to 4 correspond to progressively brighter values and bin 5 to the brightest of the five values. These are relative though because the profiles all come from relatively dark image regions.
- An approximate mean profile is represented by five values each of which is an intensity value in a respective bin averaged over nine measured profiles. Each set of five values characterises a blob now treated as indicating an actual cell. The minimum value of each mean profile is recorded as the variable 'minprofile', this being the contents (number of pixels averaged over nine profiles) of the bin having the smallest contents of all five bins.
- the first criterion - bin (1) > 7.6 - may if desired be the only one used to determine whether a cell is mitotic.
- the " otherwise " criterion - bin (1) ⁇ 7.6 - is optional.
- Each alternative mitotic feature detection technique 20 and 24 produces measurements derived from ten images.
- Each mitotic feature detection technique is applied to ten images or tiles as has been said: the mitotic figures are counted for each image and the counts are added together to provide a total for the ten images.
- the mitotic figure count for a technique is low, medium or high with points 1, 2 or 3 according to whether it is 0 to 5, 6 to 10 or 11 or more respectively as shown in the table below. Measurement: Number of Mitotic figures in Ten Images Meaning Points 0-5 Low 1 6 - 10 Moderate 2 ⁇ 11 High 3
- the measurement of mitosis may be combined with others obtained for pleomorphism and tubules by different methods to derive an overall grading referred to in medicine as a "Bloom and Richardson grading": it is used by clinicians as a measure of cancer status.
Landscapes
- Engineering & Computer Science (AREA)
- Physics & Mathematics (AREA)
- Health & Medical Sciences (AREA)
- Theoretical Computer Science (AREA)
- General Health & Medical Sciences (AREA)
- General Physics & Mathematics (AREA)
- Radiology & Medical Imaging (AREA)
- Multimedia (AREA)
- Biomedical Technology (AREA)
- Medical Informatics (AREA)
- Nuclear Medicine, Radiotherapy & Molecular Imaging (AREA)
- Life Sciences & Earth Sciences (AREA)
- Quality & Reliability (AREA)
- Computer Vision & Pattern Recognition (AREA)
- Molecular Biology (AREA)
- Image Analysis (AREA)
- Image Processing (AREA)
- Investigating Or Analysing Biological Materials (AREA)
- Measurement Of The Respiration, Hearing Ability, Form, And Blood Characteristics Of Living Organisms (AREA)
- Analysing Materials By The Use Of Radiation (AREA)
- Investigating Or Analysing Materials By Optical Means (AREA)
- Measuring And Recording Apparatus For Diagnosis (AREA)
- Saccharide Compounds (AREA)
- Polysaccharides And Polysaccharide Derivatives (AREA)
Applications Claiming Priority (2)
| Application Number | Priority Date | Filing Date | Title |
|---|---|---|---|
| GBGB0226787.0A GB0226787D0 (en) | 2002-11-18 | 2002-11-18 | Measurement of mitotic activity |
| EP03811421A EP1579375B1 (de) | 2002-11-18 | 2003-11-13 | Messung der mitoseaktivität |
Related Parent Applications (1)
| Application Number | Title | Priority Date | Filing Date |
|---|---|---|---|
| EP03811421A Division EP1579375B1 (de) | 2002-11-18 | 2003-11-13 | Messung der mitoseaktivität |
Publications (3)
| Publication Number | Publication Date |
|---|---|
| EP1760634A2 true EP1760634A2 (de) | 2007-03-07 |
| EP1760634A3 EP1760634A3 (de) | 2007-08-01 |
| EP1760634B1 EP1760634B1 (de) | 2009-10-21 |
Family
ID=9947976
Family Applications (2)
| Application Number | Title | Priority Date | Filing Date |
|---|---|---|---|
| EP06024926A Expired - Lifetime EP1760634B1 (de) | 2002-11-18 | 2003-11-13 | Verfahren, Vorrichtung und Computerprogramm zur Messung der mitotischen Aktivität |
| EP03811421A Expired - Lifetime EP1579375B1 (de) | 2002-11-18 | 2003-11-13 | Messung der mitoseaktivität |
Family Applications After (1)
| Application Number | Title | Priority Date | Filing Date |
|---|---|---|---|
| EP03811421A Expired - Lifetime EP1579375B1 (de) | 2002-11-18 | 2003-11-13 | Messung der mitoseaktivität |
Country Status (8)
| Country | Link |
|---|---|
| US (1) | US7577280B2 (de) |
| EP (2) | EP1760634B1 (de) |
| JP (2) | JP4174050B2 (de) |
| AT (2) | ATE446557T1 (de) |
| AU (1) | AU2003302054A1 (de) |
| DE (2) | DE60310267T2 (de) |
| GB (1) | GB0226787D0 (de) |
| WO (1) | WO2004047004A2 (de) |
Cited By (3)
| Publication number | Priority date | Publication date | Assignee | Title |
|---|---|---|---|---|
| WO2010040371A1 (en) * | 2008-10-07 | 2010-04-15 | Bio Explorer B.V. | Device and method for automatically analyzing micro organisms in a sample |
| CN101866484A (zh) * | 2010-06-08 | 2010-10-20 | 华中科技大学 | 一种图像中像素显著程度的计算方法 |
| WO2018031096A1 (en) * | 2016-08-09 | 2018-02-15 | Qualcomm Incorporated | Methods and systems of performing blob filtering in video analytics |
Families Citing this family (21)
| Publication number | Priority date | Publication date | Assignee | Title |
|---|---|---|---|---|
| US7333656B2 (en) * | 2003-11-26 | 2008-02-19 | Matsushita Electric Industrial Co., Ltd. | Image processing method and image processing apparatus |
| US7689038B2 (en) * | 2005-01-10 | 2010-03-30 | Cytyc Corporation | Method for improved image segmentation |
| US7536064B2 (en) * | 2005-05-31 | 2009-05-19 | Microsoft Corporation | Image comparison by metric embeddings |
| GB2430026A (en) | 2005-09-09 | 2007-03-14 | Qinetiq Ltd | Automated selection of image regions |
| JP4921858B2 (ja) * | 2006-06-07 | 2012-04-25 | オリンパス株式会社 | 画像処理装置および画像処理プログラム |
| TWI314424B (en) * | 2006-06-23 | 2009-09-01 | Marketech Int Corp | System and method for image signal contrast adjustment and overflow compensation |
| JP4944641B2 (ja) * | 2007-03-05 | 2012-06-06 | 学校法人順天堂 | 染色組織標本の陽性細胞の自動検出法 |
| WO2010003041A2 (en) * | 2008-07-03 | 2010-01-07 | Nec Laboratories America, Inc. | Mitotic figure detector and counter system and method for detecting and counting mitotic figures |
| JP5535727B2 (ja) * | 2010-04-01 | 2014-07-02 | ソニー株式会社 | 画像処理装置、画像処理方法、およびプログラム |
| WO2012049845A1 (ja) * | 2010-10-12 | 2012-04-19 | パナソニック株式会社 | 色信号処理装置 |
| US8351676B2 (en) * | 2010-10-12 | 2013-01-08 | Sony Corporation | Digital image analysis using multi-step analysis |
| JP5670695B2 (ja) * | 2010-10-18 | 2015-02-18 | ソニー株式会社 | 情報処理装置及び方法、並びにプログラム |
| WO2012063107A1 (en) * | 2010-11-08 | 2012-05-18 | Manipal Institute Of Technology | Automated tuberculosis screening |
| KR20120102447A (ko) * | 2011-03-08 | 2012-09-18 | 삼성전자주식회사 | 진단장치 및 방법 |
| US10186236B2 (en) * | 2013-05-23 | 2019-01-22 | Intel Corporation | Universal codec |
| US9495753B2 (en) * | 2013-05-30 | 2016-11-15 | Canon Kabushiki Kaisha | Spectral image data processing apparatus and two-dimensional spectral apparatus |
| MA41117A (fr) | 2014-12-05 | 2017-10-10 | Myfiziq Ltd | Imagerie d'un corps |
| DE102016105102A1 (de) * | 2016-03-18 | 2017-09-21 | Leibniz-Institut für Photonische Technologien e. V. | Verfahren zur Untersuchung verteilter Objekte |
| JP7181886B2 (ja) * | 2017-03-14 | 2022-12-01 | サンシャイン・レイク・ファーマ・カンパニー・リミテッド | 免疫グロブリンのFc部分を含む二重標的融合タンパク質 |
| CN112347823B (zh) * | 2019-08-09 | 2024-05-03 | 中国石油天然气股份有限公司 | 沉积相边界识别方法及装置 |
| JPWO2022101983A1 (de) | 2020-11-10 | 2022-05-19 |
Citations (1)
| Publication number | Priority date | Publication date | Assignee | Title |
|---|---|---|---|---|
| WO2002047032A1 (en) | 2000-12-04 | 2002-06-13 | Cytokinetics, Inc. | Classifying cells based on information contained in cell images |
Family Cites Families (9)
| Publication number | Priority date | Publication date | Assignee | Title |
|---|---|---|---|---|
| US5235522A (en) * | 1990-10-10 | 1993-08-10 | Cell Analysis Systems, Inc. | Method and apparatus for automated analysis of biological specimens |
| IL101522A (en) | 1992-04-08 | 1997-09-30 | Combact Imaging Systems Ltd | Detection of microorganisms in a sample and determination of the sensitivity of microorganisms to antibiotics |
| JPH0993445A (ja) * | 1995-09-20 | 1997-04-04 | Fuji Xerox Co Ltd | 画像処理装置 |
| EP0864082B1 (de) * | 1995-11-30 | 2003-04-02 | Chromavision Medical Systems, Inc. | Verfahren zur automatischen bildanalyse biologischer proben |
| US6261760B1 (en) * | 1998-03-09 | 2001-07-17 | The Regents Of The University Of California | Regulation of the cell cycle by sterols |
| US7176293B1 (en) * | 1999-07-29 | 2007-02-13 | The Wistar Institute Of Anatomy And Biology | Compositions and methods to enhance sensitivity of cancer cells to mitotic stress |
| CA2391289A1 (en) * | 1999-11-24 | 2001-05-31 | Confirma, Inc. | Dynamic thresholding of segmented data sets and display of similarity values in a similarity image |
| JP3393106B2 (ja) * | 2000-03-01 | 2003-04-07 | 株式会社テプコシステムズ | 太線の抽出方法 |
| US7016787B2 (en) * | 2001-02-20 | 2006-03-21 | Cytokinetics, Inc. | Characterizing biological stimuli by response curves |
-
2002
- 2002-11-18 GB GBGB0226787.0A patent/GB0226787D0/en not_active Ceased
-
2003
- 2003-11-13 EP EP06024926A patent/EP1760634B1/de not_active Expired - Lifetime
- 2003-11-13 AT AT06024926T patent/ATE446557T1/de not_active IP Right Cessation
- 2003-11-13 AU AU2003302054A patent/AU2003302054A1/en not_active Abandoned
- 2003-11-13 AT AT03811421T patent/ATE347718T1/de not_active IP Right Cessation
- 2003-11-13 JP JP2004552855A patent/JP4174050B2/ja not_active Expired - Fee Related
- 2003-11-13 DE DE60310267T patent/DE60310267T2/de not_active Expired - Lifetime
- 2003-11-13 US US10/535,140 patent/US7577280B2/en active Active
- 2003-11-13 WO PCT/GB2003/004916 patent/WO2004047004A2/en not_active Ceased
- 2003-11-13 EP EP03811421A patent/EP1579375B1/de not_active Expired - Lifetime
- 2003-11-13 DE DE60329792T patent/DE60329792D1/de not_active Expired - Lifetime
-
2007
- 2007-11-14 JP JP2007295170A patent/JP4864857B2/ja not_active Expired - Fee Related
Patent Citations (1)
| Publication number | Priority date | Publication date | Assignee | Title |
|---|---|---|---|---|
| WO2002047032A1 (en) | 2000-12-04 | 2002-06-13 | Cytokinetics, Inc. | Classifying cells based on information contained in cell images |
Non-Patent Citations (13)
| Title |
|---|
| ARAMBULA COSIO ET AL., PROC. IEEE EMBS, 2001, pages 2567 - 2570 |
| DEVIJVER P.A.: "Pattern Recognition", vol. 301, 1988, SPRINGER-VERLAG, article "image segmentation using causal Markov Random Field models" |
| DUCKSBURY P.G.: "Parallel model based segmentation using a 3rd order hidden Markov model", 4TH IEE INT. CONF. IMAGE PROCESSING AND ITS APPLICATIONS, 7 April 1992 (1992-04-07) |
| J.A. HARTIGAN; M.A. WONG: "K-means clustering algorithm", APPLIED STATISTICS JOURNAL, 1979 |
| JACKSON J.E.: "A User Guide to Principal Components", 1991, JOHN WILEY & SONS, pages: 1 - 25 |
| JOLLIE I.T.: "Springer series in statistics", 1986, SPRINGER VERLAG, article "Principal Component Analysis" |
| K. JACK: "Video Demystified", 1996, HIGHTEXT PUBLICATIONS |
| KLETTE R.; ZAMPERONI P.: "Handbook of image processing operators", 1995, JOHN WILEY & SONS |
| KLETTE R.; ZAMPERONIU P.: "Handbook of Image Processing Operators", 1996, JOHN WILEY & SONS |
| OTSU N.: "A thresholding selection method from grey level histograms", IEEE TRANS SYSTEMS, MAN & CYBERNETICS, vol. 9, 1979, pages 62 - 66 |
| SUNDBLAD ET AL., JOURN EXP BOTANY, vol. 49, no. 327, 1998, pages 1749 - 1756 |
| UMBAUGH S.C.: "Colour vision and image processing", 1998, PRENTICE HALL |
| VEGA-ALVARADO ET AL., PROC. IEEE EMBS, 2001, pages 2560 - 2562 |
Cited By (6)
| Publication number | Priority date | Publication date | Assignee | Title |
|---|---|---|---|---|
| WO2010040371A1 (en) * | 2008-10-07 | 2010-04-15 | Bio Explorer B.V. | Device and method for automatically analyzing micro organisms in a sample |
| US11226347B2 (en) | 2008-10-07 | 2022-01-18 | Biotrack Holding B.V. | Method for simultaneously and automatically analyzing microorganisms in a sample using filter cytometry |
| CN101866484A (zh) * | 2010-06-08 | 2010-10-20 | 华中科技大学 | 一种图像中像素显著程度的计算方法 |
| CN101866484B (zh) * | 2010-06-08 | 2012-07-04 | 华中科技大学 | 一种图像中像素显著程度的计算方法 |
| WO2018031096A1 (en) * | 2016-08-09 | 2018-02-15 | Qualcomm Incorporated | Methods and systems of performing blob filtering in video analytics |
| US10152630B2 (en) | 2016-08-09 | 2018-12-11 | Qualcomm Incorporated | Methods and systems of performing blob filtering in video analytics |
Also Published As
| Publication number | Publication date |
|---|---|
| EP1579375B1 (de) | 2006-12-06 |
| ATE347718T1 (de) | 2006-12-15 |
| WO2004047004A3 (en) | 2005-08-11 |
| DE60310267T2 (de) | 2007-06-14 |
| US20060098858A1 (en) | 2006-05-11 |
| JP4174050B2 (ja) | 2008-10-29 |
| WO2004047004A2 (en) | 2004-06-03 |
| DE60310267D1 (de) | 2007-01-18 |
| ATE446557T1 (de) | 2009-11-15 |
| US7577280B2 (en) | 2009-08-18 |
| DE60329792D1 (de) | 2009-12-03 |
| JP2008077677A (ja) | 2008-04-03 |
| EP1760634B1 (de) | 2009-10-21 |
| GB0226787D0 (en) | 2002-12-24 |
| JP2006506635A (ja) | 2006-02-23 |
| AU2003302054A1 (en) | 2004-06-15 |
| EP1579375A2 (de) | 2005-09-28 |
| EP1760634A3 (de) | 2007-08-01 |
| JP4864857B2 (ja) | 2012-02-01 |
Similar Documents
| Publication | Publication Date | Title |
|---|---|---|
| EP1760634B1 (de) | Verfahren, Vorrichtung und Computerprogramm zur Messung der mitotischen Aktivität | |
| Leemans et al. | Defects segmentation on ‘Golden Delicious’ apples by using colour machine vision | |
| US7079675B2 (en) | Histological assessment | |
| Es-Saady et al. | Automatic recognition of plant leaves diseases based on serial combination of two SVM classifiers | |
| EP1563457B1 (de) | Bildanalyse | |
| US5987158A (en) | Apparatus for automated identification of thick cell groupings on a biological specimen | |
| EP1699016A2 (de) | Verfahren und Vorrichtung zur automatisierten Analyse biologischer Proben | |
| EP1579366B1 (de) | Histologische bewertung des nuklearpleomorphismus | |
| CN113537182B (zh) | 染色体中期分裂相显微图像的自动识别方法与系统 | |
| Kumari et al. | Performance analysis of support vector machine in defective and non defective mangoes classification | |
| CN105787928A (zh) | 基于视觉模糊度的模糊眼底图像自动检测与筛查方法 | |
| US8068132B2 (en) | Method for identifying Guignardia citricarpa | |
| US8229674B2 (en) | Automated histological grading of tubules | |
| Banerjee et al. | Color image segmentation technique using natural grouping of pixels | |
| Chitra et al. | Detection of aml in blood microscopic images using local binary pattern and supervised classifier | |
| Wiryadinata et al. | California papaya fruit maturity classification uses learning vector quantization | |
| Akbari et al. | Automatic segmentation of DNA bands in one dimensional gel images produced by hybridizing techniques | |
| Marroquín et al. | Nonlinear image analysis for fuzzy classification of breast cancer | |
| AU2002354969B2 (en) | Chromatin segmentation | |
| CN119863722A (zh) | 一种基于无人机图像的籽莲品种识别方法及系统 | |
| Crisologo et al. | Statistical Feature-based Craquelure Classification | |
| CN121170793A (zh) | 一种基于深度学习的病理切片智能分析方法及系统 | |
| CN116503311A (zh) | 免疫组织化学染色影像的分析方法 | |
| Galatus et al. | Computer Aided Diagnosis Tool for Cytological Slides | |
| AU2002354969A1 (en) | Chromatin segmentation |
Legal Events
| Date | Code | Title | Description |
|---|---|---|---|
| PUAI | Public reference made under article 153(3) epc to a published international application that has entered the european phase |
Free format text: ORIGINAL CODE: 0009012 |
|
| 17P | Request for examination filed |
Effective date: 20061201 |
|
| AC | Divisional application: reference to earlier application |
Ref document number: 1579375 Country of ref document: EP Kind code of ref document: P |
|
| AK | Designated contracting states |
Kind code of ref document: A2 Designated state(s): AT BE BG CH CY CZ DE DK EE ES FI FR GB GR HU IE IT LI LU MC NL PT RO SE SI SK TR |
|
| RIC1 | Information provided on ipc code assigned before grant |
Ipc: G06K 9/00 20060101ALI20070404BHEP Ipc: G06T 7/00 20060101AFI20070404BHEP |
|
| PUAL | Search report despatched |
Free format text: ORIGINAL CODE: 0009013 |
|
| AK | Designated contracting states |
Kind code of ref document: A3 Designated state(s): AT BE BG CH CY CZ DE DK EE ES FI FR GB GR HU IE IT LI LU MC NL PT RO SE SI SK TR |
|
| 17Q | First examination report despatched |
Effective date: 20070913 |
|
| AKX | Designation fees paid |
Designated state(s): AT BE BG CH CY CZ DE DK EE ES FI FR GB GR HU IE IT LI LU MC NL PT RO SE SI SK TR |
|
| GRAP | Despatch of communication of intention to grant a patent |
Free format text: ORIGINAL CODE: EPIDOSNIGR1 |
|
| RTI1 | Title (correction) |
Free format text: METHOD, APPARATUS AND COMPUTER PROGRAM FOR MEASUREMENT OF MITOTIC ACTIVITY |
|
| GRAS | Grant fee paid |
Free format text: ORIGINAL CODE: EPIDOSNIGR3 |
|
| GRAA | (expected) grant |
Free format text: ORIGINAL CODE: 0009210 |
|
| AC | Divisional application: reference to earlier application |
Ref document number: 1579375 Country of ref document: EP Kind code of ref document: P |
|
| AK | Designated contracting states |
Kind code of ref document: B1 Designated state(s): AT BE BG CH CY CZ DE DK EE ES FI FR GB GR HU IE IT LI LU MC NL PT RO SE SI SK TR |
|
| REG | Reference to a national code |
Ref country code: GB Ref legal event code: FG4D |
|
| REG | Reference to a national code |
Ref country code: CH Ref legal event code: EP |
|
| REG | Reference to a national code |
Ref country code: IE Ref legal event code: FG4D |
|
| REF | Corresponds to: |
Ref document number: 60329792 Country of ref document: DE Date of ref document: 20091203 Kind code of ref document: P |
|
| PGFP | Annual fee paid to national office [announced via postgrant information from national office to epo] |
Ref country code: NL Payment date: 20091112 Year of fee payment: 7 |
|
| PG25 | Lapsed in a contracting state [announced via postgrant information from national office to epo] |
Ref country code: ES Free format text: LAPSE BECAUSE OF FAILURE TO SUBMIT A TRANSLATION OF THE DESCRIPTION OR TO PAY THE FEE WITHIN THE PRESCRIBED TIME-LIMIT Effective date: 20100201 Ref country code: SE Free format text: LAPSE BECAUSE OF FAILURE TO SUBMIT A TRANSLATION OF THE DESCRIPTION OR TO PAY THE FEE WITHIN THE PRESCRIBED TIME-LIMIT Effective date: 20091021 Ref country code: PT Free format text: LAPSE BECAUSE OF FAILURE TO SUBMIT A TRANSLATION OF THE DESCRIPTION OR TO PAY THE FEE WITHIN THE PRESCRIBED TIME-LIMIT Effective date: 20100222 Ref country code: FI Free format text: LAPSE BECAUSE OF FAILURE TO SUBMIT A TRANSLATION OF THE DESCRIPTION OR TO PAY THE FEE WITHIN THE PRESCRIBED TIME-LIMIT Effective date: 20091021 |
|
| PG25 | Lapsed in a contracting state [announced via postgrant information from national office to epo] |
Ref country code: SI Free format text: LAPSE BECAUSE OF FAILURE TO SUBMIT A TRANSLATION OF THE DESCRIPTION OR TO PAY THE FEE WITHIN THE PRESCRIBED TIME-LIMIT Effective date: 20091021 |
|
| PG25 | Lapsed in a contracting state [announced via postgrant information from national office to epo] |
Ref country code: BE Free format text: LAPSE BECAUSE OF FAILURE TO SUBMIT A TRANSLATION OF THE DESCRIPTION OR TO PAY THE FEE WITHIN THE PRESCRIBED TIME-LIMIT Effective date: 20091021 Ref country code: AT Free format text: LAPSE BECAUSE OF FAILURE TO SUBMIT A TRANSLATION OF THE DESCRIPTION OR TO PAY THE FEE WITHIN THE PRESCRIBED TIME-LIMIT Effective date: 20091021 Ref country code: MC Free format text: LAPSE BECAUSE OF NON-PAYMENT OF DUE FEES Effective date: 20091130 |
|
| REG | Reference to a national code |
Ref country code: CH Ref legal event code: PL |
|
| PG25 | Lapsed in a contracting state [announced via postgrant information from national office to epo] |
Ref country code: RO Free format text: LAPSE BECAUSE OF FAILURE TO SUBMIT A TRANSLATION OF THE DESCRIPTION OR TO PAY THE FEE WITHIN THE PRESCRIBED TIME-LIMIT Effective date: 20091021 Ref country code: BG Free format text: LAPSE BECAUSE OF FAILURE TO SUBMIT A TRANSLATION OF THE DESCRIPTION OR TO PAY THE FEE WITHIN THE PRESCRIBED TIME-LIMIT Effective date: 20100121 Ref country code: EE Free format text: LAPSE BECAUSE OF FAILURE TO SUBMIT A TRANSLATION OF THE DESCRIPTION OR TO PAY THE FEE WITHIN THE PRESCRIBED TIME-LIMIT Effective date: 20091021 Ref country code: DK Free format text: LAPSE BECAUSE OF FAILURE TO SUBMIT A TRANSLATION OF THE DESCRIPTION OR TO PAY THE FEE WITHIN THE PRESCRIBED TIME-LIMIT Effective date: 20091021 |
|
| PLBE | No opposition filed within time limit |
Free format text: ORIGINAL CODE: 0009261 |
|
| REG | Reference to a national code |
Ref country code: FR Ref legal event code: ST Effective date: 20100730 |
|
| STAA | Information on the status of an ep patent application or granted ep patent |
Free format text: STATUS: NO OPPOSITION FILED WITHIN TIME LIMIT |
|
| PG25 | Lapsed in a contracting state [announced via postgrant information from national office to epo] |
Ref country code: SK Free format text: LAPSE BECAUSE OF FAILURE TO SUBMIT A TRANSLATION OF THE DESCRIPTION OR TO PAY THE FEE WITHIN THE PRESCRIBED TIME-LIMIT Effective date: 20091021 Ref country code: CZ Free format text: LAPSE BECAUSE OF FAILURE TO SUBMIT A TRANSLATION OF THE DESCRIPTION OR TO PAY THE FEE WITHIN THE PRESCRIBED TIME-LIMIT Effective date: 20091021 |
|
| 26N | No opposition filed |
Effective date: 20100722 |
|
| PG25 | Lapsed in a contracting state [announced via postgrant information from national office to epo] |
Ref country code: IE Free format text: LAPSE BECAUSE OF NON-PAYMENT OF DUE FEES Effective date: 20091113 Ref country code: CH Free format text: LAPSE BECAUSE OF NON-PAYMENT OF DUE FEES Effective date: 20091130 Ref country code: FR Free format text: LAPSE BECAUSE OF NON-PAYMENT OF DUE FEES Effective date: 20091221 Ref country code: GR Free format text: LAPSE BECAUSE OF FAILURE TO SUBMIT A TRANSLATION OF THE DESCRIPTION OR TO PAY THE FEE WITHIN THE PRESCRIBED TIME-LIMIT Effective date: 20100122 Ref country code: LI Free format text: LAPSE BECAUSE OF NON-PAYMENT OF DUE FEES Effective date: 20091130 |
|
| PG25 | Lapsed in a contracting state [announced via postgrant information from national office to epo] |
Ref country code: IT Free format text: LAPSE BECAUSE OF FAILURE TO SUBMIT A TRANSLATION OF THE DESCRIPTION OR TO PAY THE FEE WITHIN THE PRESCRIBED TIME-LIMIT Effective date: 20091021 |
|
| PG25 | Lapsed in a contracting state [announced via postgrant information from national office to epo] |
Ref country code: LU Free format text: LAPSE BECAUSE OF NON-PAYMENT OF DUE FEES Effective date: 20091113 |
|
| REG | Reference to a national code |
Ref country code: NL Ref legal event code: V1 Effective date: 20110601 |
|
| PG25 | Lapsed in a contracting state [announced via postgrant information from national office to epo] |
Ref country code: HU Free format text: LAPSE BECAUSE OF FAILURE TO SUBMIT A TRANSLATION OF THE DESCRIPTION OR TO PAY THE FEE WITHIN THE PRESCRIBED TIME-LIMIT Effective date: 20100422 |
|
| PG25 | Lapsed in a contracting state [announced via postgrant information from national office to epo] |
Ref country code: TR Free format text: LAPSE BECAUSE OF FAILURE TO SUBMIT A TRANSLATION OF THE DESCRIPTION OR TO PAY THE FEE WITHIN THE PRESCRIBED TIME-LIMIT Effective date: 20091021 Ref country code: NL Free format text: LAPSE BECAUSE OF NON-PAYMENT OF DUE FEES Effective date: 20110601 |
|
| PG25 | Lapsed in a contracting state [announced via postgrant information from national office to epo] |
Ref country code: CY Free format text: LAPSE BECAUSE OF FAILURE TO SUBMIT A TRANSLATION OF THE DESCRIPTION OR TO PAY THE FEE WITHIN THE PRESCRIBED TIME-LIMIT Effective date: 20091021 |
|
| PGFP | Annual fee paid to national office [announced via postgrant information from national office to epo] |
Ref country code: DE Payment date: 20121121 Year of fee payment: 10 |
|
| PGFP | Annual fee paid to national office [announced via postgrant information from national office to epo] |
Ref country code: GB Payment date: 20121120 Year of fee payment: 10 |
|
| GBPC | Gb: european patent ceased through non-payment of renewal fee |
Effective date: 20131113 |
|
| PG25 | Lapsed in a contracting state [announced via postgrant information from national office to epo] |
Ref country code: DE Free format text: LAPSE BECAUSE OF NON-PAYMENT OF DUE FEES Effective date: 20140603 |
|
| REG | Reference to a national code |
Ref country code: DE Ref legal event code: R119 Ref document number: 60329792 Country of ref document: DE Effective date: 20140603 |
|
| PG25 | Lapsed in a contracting state [announced via postgrant information from national office to epo] |
Ref country code: GB Free format text: LAPSE BECAUSE OF NON-PAYMENT OF DUE FEES Effective date: 20131113 |