EP1712182B1 - Méthode de détection par ultrasons et localisation de microbulles d'agent de contraste et méthode pour l'administration localisée de médicaments en utilisant les microbulles comme véhicule - Google Patents
Méthode de détection par ultrasons et localisation de microbulles d'agent de contraste et méthode pour l'administration localisée de médicaments en utilisant les microbulles comme véhicule Download PDFInfo
- Publication number
- EP1712182B1 EP1712182B1 EP05425222.6A EP05425222A EP1712182B1 EP 1712182 B1 EP1712182 B1 EP 1712182B1 EP 05425222 A EP05425222 A EP 05425222A EP 1712182 B1 EP1712182 B1 EP 1712182B1
- Authority
- EP
- European Patent Office
- Prior art keywords
- microbubble
- signal
- reflected
- small
- population
- Prior art date
- Legal status (The legal status is an assumption and is not a legal conclusion. Google has not performed a legal analysis and makes no representation as to the accuracy of the status listed.)
- Active
Links
- 238000000034 method Methods 0.000 title claims description 93
- 239000002872 contrast media Substances 0.000 title claims description 46
- 238000001514 detection method Methods 0.000 title claims description 19
- 230000004807 localization Effects 0.000 title claims description 13
- 238000001647 drug administration Methods 0.000 title description 5
- 239000000969 carrier Substances 0.000 title description 2
- 210000001519 tissue Anatomy 0.000 claims description 126
- 238000004458 analytical method Methods 0.000 claims description 53
- 238000001228 spectrum Methods 0.000 claims description 29
- 238000004422 calculation algorithm Methods 0.000 claims description 18
- 238000013528 artificial neural network Methods 0.000 claims description 9
- 239000003446 ligand Substances 0.000 claims description 9
- 238000012545 processing Methods 0.000 claims description 9
- 238000003909 pattern recognition Methods 0.000 claims description 7
- 210000003038 endothelium Anatomy 0.000 claims description 4
- 238000012567 pattern recognition method Methods 0.000 claims description 3
- 238000012549 training Methods 0.000 claims description 3
- 230000004927 fusion Effects 0.000 claims description 2
- 230000003449 preventive effect Effects 0.000 claims 1
- 230000003595 spectral effect Effects 0.000 description 30
- 239000000523 sample Substances 0.000 description 23
- 238000003384 imaging method Methods 0.000 description 18
- 239000013598 vector Substances 0.000 description 10
- 239000003814 drug Substances 0.000 description 8
- 229940079593 drug Drugs 0.000 description 7
- 230000003068 static effect Effects 0.000 description 7
- 238000010586 diagram Methods 0.000 description 6
- 230000003692 lymphatic flow Effects 0.000 description 6
- 230000004044 response Effects 0.000 description 6
- 230000002792 vascular Effects 0.000 description 6
- 230000008901 benefit Effects 0.000 description 5
- 230000006378 damage Effects 0.000 description 4
- 230000001934 delay Effects 0.000 description 4
- 230000000694 effects Effects 0.000 description 4
- 238000000605 extraction Methods 0.000 description 4
- 230000008569 process Effects 0.000 description 4
- 206010028980 Neoplasm Diseases 0.000 description 3
- 230000005540 biological transmission Effects 0.000 description 3
- 239000003086 colorant Substances 0.000 description 3
- 230000005284 excitation Effects 0.000 description 3
- 230000006872 improvement Effects 0.000 description 3
- 238000005259 measurement Methods 0.000 description 3
- 210000004088 microvessel Anatomy 0.000 description 3
- 230000011218 segmentation Effects 0.000 description 3
- 230000001413 cellular effect Effects 0.000 description 2
- 230000001419 dependent effect Effects 0.000 description 2
- 239000002961 echo contrast media Substances 0.000 description 2
- 238000001914 filtration Methods 0.000 description 2
- 238000002347 injection Methods 0.000 description 2
- 239000007924 injection Substances 0.000 description 2
- 239000000463 material Substances 0.000 description 2
- 230000001575 pathological effect Effects 0.000 description 2
- 238000005309 stochastic process Methods 0.000 description 2
- 230000000007 visual effect Effects 0.000 description 2
- 206010060862 Prostate cancer Diseases 0.000 description 1
- 208000000236 Prostatic Neoplasms Diseases 0.000 description 1
- 230000002159 abnormal effect Effects 0.000 description 1
- 230000009471 action Effects 0.000 description 1
- 238000003491 array Methods 0.000 description 1
- 238000005311 autocorrelation function Methods 0.000 description 1
- 239000008280 blood Substances 0.000 description 1
- 210000004204 blood vessel Anatomy 0.000 description 1
- 230000008859 change Effects 0.000 description 1
- 238000013527 convolutional neural network Methods 0.000 description 1
- 230000008878 coupling Effects 0.000 description 1
- 238000010168 coupling process Methods 0.000 description 1
- 238000005859 coupling reaction Methods 0.000 description 1
- 238000001739 density measurement Methods 0.000 description 1
- 238000003745 diagnosis Methods 0.000 description 1
- 239000003937 drug carrier Substances 0.000 description 1
- 238000012377 drug delivery Methods 0.000 description 1
- 238000002592 echocardiography Methods 0.000 description 1
- 238000009499 grossing Methods 0.000 description 1
- 210000001365 lymphatic vessel Anatomy 0.000 description 1
- 238000002595 magnetic resonance imaging Methods 0.000 description 1
- 230000002503 metabolic effect Effects 0.000 description 1
- 238000012544 monitoring process Methods 0.000 description 1
- 230000003534 oscillatory effect Effects 0.000 description 1
- 230000037361 pathway Effects 0.000 description 1
- 230000035515 penetration Effects 0.000 description 1
- 230000010412 perfusion Effects 0.000 description 1
- 230000002265 prevention Effects 0.000 description 1
- 238000012552 review Methods 0.000 description 1
- 238000010183 spectrum analysis Methods 0.000 description 1
- 239000000126 substance Substances 0.000 description 1
- 238000002560 therapeutic procedure Methods 0.000 description 1
- 238000002604 ultrasonography Methods 0.000 description 1
- 238000012285 ultrasound imaging Methods 0.000 description 1
Images


Classifications
-
- G—PHYSICS
- G01—MEASURING; TESTING
- G01S—RADIO DIRECTION-FINDING; RADIO NAVIGATION; DETERMINING DISTANCE OR VELOCITY BY USE OF RADIO WAVES; LOCATING OR PRESENCE-DETECTING BY USE OF THE REFLECTION OR RERADIATION OF RADIO WAVES; ANALOGOUS ARRANGEMENTS USING OTHER WAVES
- G01S7/00—Details of systems according to groups G01S13/00, G01S15/00, G01S17/00
- G01S7/52—Details of systems according to groups G01S13/00, G01S15/00, G01S17/00 of systems according to group G01S15/00
- G01S7/52017—Details of systems according to groups G01S13/00, G01S15/00, G01S17/00 of systems according to group G01S15/00 particularly adapted to short-range imaging
- G01S7/52023—Details of receivers
- G01S7/52036—Details of receivers using analysis of echo signal for target characterisation
- G01S7/52038—Details of receivers using analysis of echo signal for target characterisation involving non-linear properties of the propagation medium or of the reflective target
- G01S7/52039—Details of receivers using analysis of echo signal for target characterisation involving non-linear properties of the propagation medium or of the reflective target exploiting the non-linear response of a contrast enhancer, e.g. a contrast agent
-
- A—HUMAN NECESSITIES
- A61—MEDICAL OR VETERINARY SCIENCE; HYGIENE
- A61B—DIAGNOSIS; SURGERY; IDENTIFICATION
- A61B8/00—Diagnosis using ultrasonic, sonic or infrasonic waves
- A61B8/48—Diagnostic techniques
- A61B8/481—Diagnostic techniques involving the use of contrast agent, e.g. microbubbles introduced into the bloodstream
-
- G—PHYSICS
- G01—MEASURING; TESTING
- G01S—RADIO DIRECTION-FINDING; RADIO NAVIGATION; DETERMINING DISTANCE OR VELOCITY BY USE OF RADIO WAVES; LOCATING OR PRESENCE-DETECTING BY USE OF THE REFLECTION OR RERADIATION OF RADIO WAVES; ANALOGOUS ARRANGEMENTS USING OTHER WAVES
- G01S15/00—Systems using the reflection or reradiation of acoustic waves, e.g. sonar systems
- G01S15/88—Sonar systems specially adapted for specific applications
- G01S15/89—Sonar systems specially adapted for specific applications for mapping or imaging
- G01S15/8906—Short-range imaging systems; Acoustic microscope systems using pulse-echo techniques
- G01S15/8977—Short-range imaging systems; Acoustic microscope systems using pulse-echo techniques using special techniques for image reconstruction, e.g. FFT, geometrical transformations, spatial deconvolution, time deconvolution
-
- G—PHYSICS
- G01—MEASURING; TESTING
- G01S—RADIO DIRECTION-FINDING; RADIO NAVIGATION; DETERMINING DISTANCE OR VELOCITY BY USE OF RADIO WAVES; LOCATING OR PRESENCE-DETECTING BY USE OF THE REFLECTION OR RERADIATION OF RADIO WAVES; ANALOGOUS ARRANGEMENTS USING OTHER WAVES
- G01S7/00—Details of systems according to groups G01S13/00, G01S15/00, G01S17/00
- G01S7/52—Details of systems according to groups G01S13/00, G01S15/00, G01S17/00 of systems according to group G01S15/00
- G01S7/52017—Details of systems according to groups G01S13/00, G01S15/00, G01S17/00 of systems according to group G01S15/00 particularly adapted to short-range imaging
- G01S7/52023—Details of receivers
- G01S7/52036—Details of receivers using analysis of echo signal for target characterisation
- G01S7/52038—Details of receivers using analysis of echo signal for target characterisation involving non-linear properties of the propagation medium or of the reflective target
-
- A—HUMAN NECESSITIES
- A61—MEDICAL OR VETERINARY SCIENCE; HYGIENE
- A61N—ELECTROTHERAPY; MAGNETOTHERAPY; RADIATION THERAPY; ULTRASOUND THERAPY
- A61N7/00—Ultrasound therapy
Definitions
- the invention addresses a method of ultrasonic detection and localization of contrast agent microbubbles, which method comprises the steps of the preamble of claim 1
- the non-linear reflector effect of contrast agent microbubbles is typically used to highlight vascular or lymphatic flows which are not sufficiently echogenic and might not be visible by using conventional imaging, or might be covered with signals reflected from the static tissues of the relevant anatomic region, such as the walls of blood or lymphatic vessels or other tissues.
- Harmonic Imaging provides excellent results when contrast agents are present in considerable amounts in tissues and particularly in vascular or lymphatic flows.
- the signals reflected from such tissues also have spectral components at the second harmonic of the fundamental frequency of the ultrasonic signal transmitted in the relevant anatomic region.
- non linear reflection responses of such type may be also generated by micromovements of tissues.
- the components of reflected signals at frequencies other than the fundamental frequency of the signal transmitted in the anatomic region are typically of lower strength than reflected signals generated by contrast agent microbubbles when said contrast agents are present in considerable amounts. This essentially occurs in large vessels.
- the number of contrast agent microbubbles is very small and may even be as small as one microbubble or a small microbubble population, of the order of one or a few tenths of microbubbles.
- US5526816 discloses an echographic imaging (such as used for medical diagnosis) which uses the injection of specific contrast agents in the body, or more generally in the region to be imaged.
- Different frequency dependent echographic behavior of the ultrasound contrast agents containing microbubbles as compared to echographic behavior of tissue without contrast agents is exploited by providing separated spectral echo responses and then combining them in ways to enhance image contrast.
- These imaging principles exploit certain physical "signatures" of the contrast agent responses, allowing increased contrast with respect to tissue background. This contrast enhancement is much larger than what is determined from direct echo amplitude monitoring.
- EP1341003 discloses a method of spectral analysis of a radio frequency ultrasonic signal reflected by a structure subjected to echographic examination, comprising the steps of: a) transmitting an ultrasonic excitation signal into a portion of said structure under examination; b) receiving a radio frequency response signal from said structure; c) applying a time-frequency transform to said radio frequency response signal, dividing the radio frequency response signal into a plurality of frequency bands; d) calculating a local spectral parameter from the values of the time-frequency transform.
- US2005/054928 discloses an ultrasound imaging method for use in the presence of contrast agents in which acoustic waves are transmitted at a first fundamental transmission frequency and are focused on at least one scan line. Acoustic beams reflected from the body under examination and the contrast agents are separated into at least one harmonic or subharmonic components along with the fundamental frequency component. The amplitudes of these components compared to determine whether the reflecting material is either body tissue or the contrast agent.
- the invention has the object of providing a method as described hereinbefore, which allows detection and localization of single microbubbles or small microbubble populations, i.e. small numbers of contrast agent microbubbles.
- the invention achieves the above purposes by providing a method as described above, which has the combination of features according to the preamble of claim 1 and further comprising the combination of features of the characterizing part of claim 1.
- a first multidimensional projection is provided by analyzing the reflected signal by means of a Higher Order Spectrum, i.e. HOS (see: Mendel JM. tutorial on higher-order statistics (spectra) in signal processing and system theory: theoretical results and some applications. Proc.IEEE, 79, 3, 278-305 )
- HOS Higher Order Spectrum
- the bispectrum is a representation of the reflected signal in a three-dimensional space, which highlights the phase relationships between the spectral components of the reflected signal.
- the reflected signals at the second harmonic of the transmit pulse/s (which is the typical frequency of reflected signals generated by non linear reflectors such as contrast agent microbubbles) have different characteristics depending on whether said reflected signals are generated by the simple tissue of a relevant anatomic district (i.e. having no contrast agent microbubble), or by the tissue of said anatomic region and by one microbubble or a small microbubble population therein.
- the representation of the reflected signal by a bispectrum allows to detect a single microbubble or a small microbubble population by analyzing the characteristics of the bispectrum of said reflected signal.
- the comparison may be performed by analytical mathematical instruments, which extract the typical characteristics of bispectra indicating the presence of one microbubble or a small microbubble population.
- an image e.g. a digital image, of said bispectra may be generated, and the characteristics of said bispectra may be determined by automatic Image Pattern Recognition systems.
- the time localization of signal components with reference to the duration of the signal is particularly relevant for its being related to the reflector position along the signal propagation axis of the axis of view.
- time is known to be equivalent to a measurement of depth or distance from the receiver, therefore time localization of the reflected signal component indicating the presence of one microbubble or a microbubble population is important because such time localization is also a measurement of the reflector position, i.e. of the microbubble or small microbubble population along the axis of view or scan line or along the reflected signal propagation axis.
- the reflected signal is divided into a sequence of segments, so-called blocks, each corresponding to a fraction of the overall duration of the reflected signal.
- the receive signal is first divided into a succession of segments, or blocks, having a predetermined time length, and predetermined start and end times with reference to the overall duration of the receive signal and then projected on the multidimensional space, a corresponding bispectrum being generated for each signal block.
- the bispectrum of each signal block is then subjected to steps of extraction of peculiar characteristics corresponding to the absence or presence of one microbubble or a small microbubble population according to the above steps.
- methods of time-frequency analysis of the reflected signal are used to determine whether or not a single microbubble or a small microbubble population is present in the tissue under examination.
- Such characteristics may be extracted by comparison or other techniques such as Image Pattern Recognition techniques, from the receive signal of an anatomic region under examination, exactly as it was provided when bispectra were used as a method of multidimensional projection of the receive signal.
- the so-called Gabor expansion is used (see: Feichtinger & Strohmer (Eds.), GABOR ANALYSIS & ALGORITHMS: Theory & Applications, Birkhauser / SPRINGER-VERLAG, ISBN: 0817639594 ; Qian, Shie, Introduction to Time-Frequency and Wavelet Transforms, 1st Ed, Prentice Hall PTR, ISBN: 0130303607 ).
- This specific time-frequency analysis of the receive signal allows to recognize and discriminate the presence of one microbubble or a small microbubble population when the spectral component at the second harmonic of the fundamental frequency of the transmit pulse is dominant with respect to the same spectral component of the receive signal generated by a non linear reflection behavior of the tissues in the anatomic region under examination.
- time-frequency analysis is the Wigner-Ville distribution in one of its many variants. (see: 0817639594 ; Qian, Shie, Introduction to Time-Frequency and Wavelet Transforms, 1st Ed, Prentice Hall PTR, ISBN: 0130303607 )
- the PWVD When compared with the bispectrum, the PWVD provides automatic segmentation of the receive signal into successive time blocks, and also highlights the phase relationships between the spectral components of the receive signal.
- the spectral component of the receive signal at the frequency corresponding to the fundamental frequency of the transmit pulse has a considerably higher strength than the spectral components of the receive signal at the second harmonic frequency, regardless of whether these result from one or more contrast agent microbubbles, advantages are obtained by providing an additional step before projecting the receive signal in the multidimensional space and/or dividing it into a succession of time blocks.
- This additional step consists in subjecting the receive signal to filtering or processing to remove the spectral component thereof in the range of the fundamental frequency of the transmit pulse.
- the additional filtering step allows to reduce the differences in strength between the remaining signal components at the second or higher harmonic frequency and thereby improves prediction accuracy, i.e. allows to safely determine whether a single microbubble or a small microbubble population is present or not.
- the determination of the presence and position of a single contrast agent microbubble or a small contrast agent microbubble population is considerably important, not only for checking for small vessels but also in combination with new types of contrast agents, in which microbubbles are designed to only bond to target regions or tissue types. In this case, microbubbles have such a chemical and molecular structure as to bond to a desired tissue type.
- microbubbles may have bioconjugate ligands which are capable of bonding to the endothelium of the new vessels associated to the vascularization caused by the onset of such tumor.
- Contrast agent microbubbles having structures with bioconjugate ligands capable of selectively bonding to specific types of derired tissues are known, for instance, from Dayton P.,Ferrara K., "Targeted Imaging Using Ultrasound” Journal of Magnetic Resonance Imaging , vol.
- microbubbles reach the predetermined tissues and bond to them and, once they are detected, they may be caused to break by using ultrasonic transmit pulses having such a strength as to generate high acoustic pressures.
- the destruction of microbubbles allows local drug delivery to the predetermined tissues.
- the method of detecting single microbubbles or small microbubble populations is provided, according to this invention, in combination with contrast agents whose microbubbles contain bioconjugate ligands capable of bonding to predetermined tissue types.
- the method of this invention is provided in combination with microbubbles containing bioconjugate ligands with drugs therein.
- the invention relates to a method for local drug administration to predetermined tissues, which provides microbubbles having a structure with bioconjugate ligands capable of selectively bonding to predetermined tissue types, and which microbubbles carry predetermined doses of a drug therein whereas detection of microbubbles in predetermined tissues is effected by using the method of detection of single microbubbles or small microbubble populations according to this invention and according to any one of the variants as described above whereas, once the presence and/or position of single microbubbles or a small microbubble population are detected, one or more transmit pulses are transmitted, which have such a strength as to generate a sufficient acoustic pressure to destroy (rupture) said microbubbles.
- a probe In conventional ultrasonic imaging, a probe is used having arrays of piezoelectric transducers which turn an oscillatory electric signal into a corresponding acoustic, particularly ultrasonic signal.
- An anatomic region under examination is scanned for ultrasonic imaging along scan planes corresponding to slices of the relevant anatomic region.
- a succession of pulses is transmitted from the probe toward the relevant anatomic region, along adjacent scan lines which subtend the desired scan plane.
- the scan pulse transmitted from the probe is composed of the contributions of pulses transmitted from each of the ultrasonic transducers of the probe and such transducer contributions to the transmit pulse are focused along the individual scan lines by applying transducer excitation delays to the transmission of the corresponding ultrasonic pulse. Focusing of scan pulses during transmission is known in the field of ultrasonic imaging as beamforming.
- the ultrasonic receive signals along each adjacent scan line form the image data of an ultrasonic two-dimensional image of the relevant anatomic region along a scan line that contains said scan lines.
- the penetration depth of the transmit signal, therefore the reflection depth of the receive signals is proportional to the signal propagation time.
- the receive signals along a scan line are uniquely related to a precise relative position and may be therefore converted into image data to be displayed with different intensities and/or colors in a two-dimensional digital image.
- vascular or lymphatic flows generally have the characteristic of being bad reflectors and the signal reflected therefrom has a much lower strength than that reflected from static tissues of the anatomic region, vascular or lymphatic flows cannot be detected by conventional ultrasonic imaging.
- Vascular or lymphatic flows may be ultrasonically imaged by using a known technique which includes the injection of contrast agents in the anatomic region.
- contrast agents are carried by said flows and their structure allows them to act as non linear reflectors.
- these contrast agents are made of microbubbles, whose structure allows them to reflect an impinging incident ultrasonic pulse at a different frequency from the incident pulse itself.
- the non linear behavior is calibrated in such a manner that the reflected signal deriving from a pulse impinging upon a contrast agent microbubble has a frequency equal to or in a range of frequencies essentially centered on the second harmonic of the fundamental frequency of the incident pulse.
- the receive signals resulting from contrast agent microbubbles may be recognized or discriminated thanks to the fast that they form a different spectral component of the receive signal, even though the strength of the receive signal component at the frequency or in the range of frequencies centered on the fundamental frequency of incident pulses is much higher than the strength of the receive signal component at the frequency or in the range of frequencies centered on the second harmonic of the fundamental frequency of incident pulses.
- the number of contrast agent microbubbles in said microcapillaries may be as small as one microbubble or a small microbubble population.
- the strength of the receive signal component resulting from microbubbles is very low and even lower than the strength of the receive signal component in the same frequency range, resulting from a non linear behavior of static tissue reflectors in the relevant anatomic region. Therefore, conventional Harmonic Imaging cannot directly detect single microbubbles or small microbubble populations.
- the method of the invention provides processing of ultrasonic receive signals along each scan line in two parallel modes.
- the examples of the figures relate to a single scan line, a plane being scanned by successive scanning operations along a plurality of adjacent scan lines subtending said scan plane.
- the Radio Frequency (RF) signal obtained in parallel along each scan line with a known conventional ultrasonic imaging technique, for instance with the known B-mode imaging methods resulting in two-dimensional, generally grey scale digital images is provided to an image data generation channel.
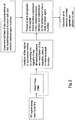
- the RF receive signal is provided in parallel to a processing chain which segments said signal into a succession of time blocks and then analyzes the receive signal segment for each block, whereby any receive signal component resulting from a single microbubble and/or a small microbubble population is detected. Thanks to the analysis of each signal segment of each block, the receive signal, i.e.
- each segment thereof is subjected to extraction of the characteristics associated to the presence of a single microbubble or a small microbubble population.
- a decision is made as to whether said characteristics denote or not the presence of a microbubble or a small microbubble population. (See Figs. 3 and 4 .)
- the B-mode digital image pixel/s may be determined which coincide with the detected single microbubble or with the small microbubble population. Therefore, these pixels are highlighted in the B-mode grey scale image, for instance by an aspect change, e.g. assignment of a predetermined color.
- Parallel processing allows optimal manipulation of the RF receive signal, on the one hand to generate the three-dimensional image and on the other hand to identify the presence of single microbubbles or small microbubble populations.
- display modes allow a visual identification of the position of said microbubbles detected in the tissues of the relevant anatomic region.
- An advantageous method of analysis of the RF receive signal consists in projecting the segment signal of each time block in a multidimensional space.
- An appropriate selection among the existing projections in multidimensional spaces allows to highlight the characteristics of the RF receive signal associated to the presence of single microbubbles or small microbubble populations.
- the characteristics of said projections that are uniquely related to the absence of microbubbles or to the presence of single microbubbles or small microbubble populations may be recognized by determining the projections of receive signals in the selected multidimensional space, which receive signals result from known tissue samples having or lacking single microbubbles or small microbubble populations respectively.
- the information obtained from the projections of receive signals resulting from these samples is used as a reference to identify the characteristics of said projections of receive signals which uniquely denote the presence or absence of single microbubbles or small microbubble populations.
- the signals received from the relevant anatomic region are checked for said characteristics that were identified by the sample receive signals and, depending on whether said characteristics are detected or not, the presence or absence of single microbubbles or small microbubble populations is determined.
- the receive signal characteristics that typically denote the presence or absence of single microbubbles or small microbubble populations as defined above may be extracted by using numeric computation methods.
- graphic representations may be generated in the form of digital images of said multidimensional projections of sample receive signals, to identify the peculiar characteristics of said digital images, that are uniquely related to the absence or presence of single microbubbles or small microbubble populations.
- the peculiar characteristics that were previously identified by using sample receive signals are advantageously extracted from the receive signals reflected from the anatomic region under examination by further generating graphic representations in the form of digital images of the multidimensional projections of the receive signals reflected from said anatomic region under examination and by analyzing said digital images with known automatic image recognition and interpretation algorithms, e.g. by using known Image Pattern Recognition techniques.
- autocorrelation equals to the second order cumulant of the signal.
- the bispectrum is the two-dimensional Fourier Transform (FT2D) of the third order cumulant (tricorrelation).
- the FT phase is NOT removed.
- the bispectrum has complex values and is symmetric, as the plane ( f 1, f 2) repeats the information contained in a particular base triangle 12 times.
- the estimation of the bispectrum may also be a direct or indirect estimation.
- the signal is segmented into partly superposed blocks, and for each of them the FT is determined, as well as the product according to the above equation. In the end, the results of the products are averaged.
- the bispectrum so obtained is also known as biperiodogram.
- a smoothing filter on the plane ( f 1, f 2) is applied, i.e. the Rao-Gabr optimal window.
- the signal is segmented into partly superposed blocks, and for each of them the third order cumulant is estimated, a maximum limit being established for ⁇ and ⁇ .
- the cumulants of the blocks are averaged and the result is smoothed by windowing (e.g. Parzen windowing), to obtain a consistent estimation.
- windowing e.g. Parzen windowing
- the FT2D of the windowed cumulant produces the bispectrum.
- the methods of direct or indirect estimation of the bispectrum may be alternatively used and both provide useful results.
- Signals having superposed spectra may be separated by using bispectrum-based analysis.
- the bispectrum projects the signal onto a bifrequency plane, whereas the conventional spectrum is situated along the bispectrum axes.
- the bispectrum allows to analyze any phase relationships existing between the various frequency components whereof the spectrum only denotes the presence.
- the non-linearities cause phase coupling between the harmonics induced thereby.
- the bispectrum allows to differentiate non-linearities having different natures and proportional entities.
- the energy ratio of the receive signal component associated to that one or small population of microbubbles to the component associated to simple tissue appears to be of -25 to -35 dB, considering the whole spectral range including both the frequency corresponding to the fundamental frequency of the transmit pulse and the frequency corresponding to the second harmonic frequency and/or the third harmonic of said fundamental frequency.
- Such ratio is generally reduced to about -10 dB.
- the removal of the receive signal component in the frequency range corresponding to the fundamental frequency of the transmit pulse does not involve removal of the information useful for detection of single microbubbles or small microbubble populations and further reduces the energy difference between the non linear components of the receive signal, resulting from non linear behavior of tissues and from the presence of microbubbles respectively.
- Figure 5 shows the energy spectrum of the receive signal, resulting from simple tissue and from the presence of one microbubble.
- Figure 5 clearly shows the energy relationships between these signals. The figure also highlights the part of the signal that is allowed to pass by the Band Pass Filter.
- Figures 6 and 7 , 8 and 9 and 10 and 11 respectively show the spectral energy distribution and the graphic representation of the corresponding bispectrum of a transmit pulse and the reflected signal resulting from the reflection of said transmit pulse from a simple tissue reflector and from a single microbubble reflector respectively.
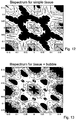
- Figures 12 and 13 are respective graphic representations of the bispectrum of the receive signal generated by the simple tissue of an anatomic region under examination and the bispectrum generated by tissue containing one microbubble. The figures clearly show that differences exist between the two bispectra and that, by representing the receive signal by a bispectrum, the presence or absence of any single microbubble may be highlighted.
- the bispectrum of receive signals may be estimated by numeric methods by using direct and indirect estimation means, to identify whether such signals contain or not characteristics indicative of the presence of one microbubble.
- the bispectrum of a receive signal obtained from an anatomic region under examination may be compared with the sample bispectra to check for resemblance of the digital image representing the bispectrum of said receive signal to the digital images representing the bispectra of sample receive signals.
- Image Pattern Recognition techniques as well as predictive algorithms, such as neural networks or the like may be used.
- any pixel of the image may be individually coded.
- Various coding methods may be provided. One method consists in defining a window of surrounding pixels for each image pixel to be coded, and in using the information regarding the parameters that determine the aspect of the pixel to be coded and those of the pixels of the surrounding pixel window, as parameters of an coding vector for the pixel to be coded.
- each pixel is uniquely defined by these parameters and the vector comprising said parameters as coefficients forms the input of the predictive algorithm.
- the coding process may be limited to a portion of the bispectrum, such as the portion between lines L1 and L2 in Figure 17 . Therefore, the number of pixels is dramatically reduced. Furthermore, considering that the window has for instance nine pixels, with the central pixel being the pixel to be coded, the computational load for coding is not excessive.
- the database of bispectrum digital images of sample receive signals comprises, as input variables, the coding vectors for each pixel, as represented by the coefficients of the individual components of said vectors as defined above, and, as output values, the indication as to whether the coded image of each bispectrum of each sample receive signal corresponds to the absence or presence of single microbubbles or small microbubble populations.
- Such information is coded, for instance, by a vector having two components, e.g. 0 and 1 for the absence of microbubbles, i.e. simple tissue, and 1 and 0 for the presence of microbubbles.
- These vectors form the output values which are presumptively known from the database of the digital images representing the bispectra of sample receive signals.
- the predictive algorithm e.g. an artificial neural network
- the predictive algorithm is trained by providing it with the input data and the output data of the database.
- the network adjusts the weight of each knot.
- the network Once the network has been trained, it is able to determine whether the digital image representing the bispectrum of the receive signals from a relevant anatomic region relates to simple tissue or to a tissue containing single microbubbles or a small microbubble population.
- the digital images representing the bispectra of receive signals reflected from the relevant anatomic region should be coded with the same methods that are used for the digital images representing the bispectra of sample receive signals contained in the database of known cases.
- the transmit pulses that are used to respectively generate sample receive signals and signals reflected by the relevant anatomic region shall also have similar, preferably identical characteristics
- This method of extraction of the characteristics denoting the presence or absence of single microbubbles or small microbubble populations avoids complex signal analysis, and allows to make a decision as to whether the receive signal contains information denoting the presence of single microbubbles or small microbubble populations, on the basis of the digital images representing the bispectra.
- the predictive step shall be performed for the digital image representing the bispectrum of each signal segment of each time block.
- the digital image representing the bispectrum may be coded in such a manner as to also include the segmentation of the receive signal into blocks by one computational step.
- the predictive algorithm will provide a set of outputs, still by one computational step, which outputs will be the predictions regarding the absence or presence of single microbubbles or small microbubble populations for each of the time blocks composing the receive signal.
- Digital image coding in combination with predictive algorithms is described in greater detail in EP 1,345,154 .
- Figure 14 shows the diagram of the spectral distribution the receive signal energy for a receive signal reflected from simple tissue and a receive signal reflected from a small microbubble population.
- Figure 15 and 16 show graphic representations of the bispectra of a receive signal resulting from simple tissue and a receive signal resulting from tissue containing a small microbubble population.
- the comparison of these Figures 14 , 15 and 16 , with Figures 5 , 12 and 13 clearly shows that the bispectrum can highlight the characteristic differences of the receive signal reflected from a tissue with and without a small microbubble population respectively.
- the two conditions in which a single microbubble or a small microbubble population are detected respectively may be processed in substantially equivalent manners.
- FIGS 18 and 19 show the evolution of the bispectrum image with time (in predetermined steps) along line L1 of Figure 17.
- Figures 18 and 19 clearly show that, also along said line L1, the bispectrum can highlight the difference between a receive signal reflected from simple tissue, i.e. containing no microbubble, and the receive signal reflected from the tissue containing one microbubble or a small microbubble population.
- such images may be used instead of the digital images representing the bispectrum in combination with predictive algorithms for extracting graphic characteristics therefrom, and for determining whether such characteristics are indicative of the presence of one microbubble or a small microbubble population in the relevant anatomic region.
- Fig. 20 shows a simplified flow chart, in which a time-frequency analysis method is used as a projection of the receive signal in a multidimensional space.
- time-frequency analysis of the receive signal In time-frequency analysis of the receive signal, the step of dividing the receive signal into a succession of time blocks, each related to a predetermined time segment of the receive signal is no longer needed as it is obviously integrated in the analysis method itself. Time-frequency analysis of the receive signal is particularly related to the evolution of the analyzed receive signal with time.
- a possible time-frequency analysis process is the so-called Gabor expansion or Gabor spectrogram.
- Gabor expansion or Gabor spectrogram is well-known and a more detailed description thereof is contained in: 0817639594 ; Qian, Shie, Introduction to Time-Frequency and Wavelet Transforms, 1st Ed, Prentice Hall PTR, ISBN: 0130303607 .
- Figure 21 shows the spectra of the receive signals reflected from simple tissue, from tissue containing one microbubble or a small microbubble, and from the simple microbubble or a small microbubble population.
- Figure 22 shows the Gabor expansion of the receive signal for tissue containing one microbubble or a microbubble population.
- the signal component for the single microbubble or a small microbubble population is indicated by a circle.
- the presence of such a component may be identified either by applying a threshold to the Gabor expansion modified signal as shown in Fig. 22 or by using Image Pattern Recognition methods as described above with reference to the variant that uses the bispectrum as a projection of the receive signal in the multidimensional space.
- the resulting diagram is once again a three-dimensional diagram, the signal energy or strength being shown with respect to a plane defined by a frequency axis and a time axis.
- the images representing the time-frequency analysis in the figures shown frequency against time, whereas the receive signal energy is denoted by a grey scale or false colors.
- the threshold that is shown in Figure 22 is not complete, as it only relates to the frequency of one spectral component of the signal.
- the threshold is composed of two components, whereof one is related to the frequency of the spectral component and the other is related to the receive signal energy. This applies to any available method of time-frequency analysis of the receive signal, and also to the next embodiment of a further variant method of time-frequency analysis of the receive signal.
- Figure 22 shows an optimal condition in which Gabor expansion provides good results.
- Gabor expansion may not be safe in providing information about the presence of microbubbles and localization thereof.
- time-frequency analysis method is the so-called Wigner-Ville distribution.
- the basic theory of this time-frequency analysis method is described in greater detail in: 0817639594 ; Qian, Shie, Introduction to Time-Frequency and Wavelet Transforms, 1st Ed, Prentice Hall PTR, ISBN: 0130303607 .
- WVD Wigner Ville Distribution
- PWVD Pseudo Wigner Ville Distribution
- Figures 23 and 24 and 25 and 26 graphically highlight the effect of PWVD analysis on the signal.
- the receive signal is shown above the PWVD spectrogram.
- Figures 23 and 25 show the receive signal and the corresponding PWVD of a receive signal resulting from simple tissue
- Figures 24 and 26 show the receive signal and the corresponding PWVD resulting from tissue containing one microbubble or a small microbubble population.
- the differences between Figures 23 and 25 and the corresponding Figures 24 and 26 are highlighted in the latter by a circle.
- single bubbles or small microbubble populations may be detected by setting a double frequency and energy threshold for determining the presence of signal contributions above said frequency thresholds and above a minimum signal energy threshold similar to the threshold defined with reference to the previous Gabor expansion embodiment.
- the threshold may be determined by using known experimental samples to generate a database of sample receive signals to be subjected to PWVD analysis.
- Pattern Recognition methods may be also used, like those described with reference to the previous embodiments.
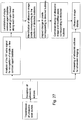
- Figure 27 is a simplified flow chart showing how the results of single microbubble or small microbubble population detection, obtained from the analysis of receive signals, are displayed in parallel with the generation of an ultrasonic image from said signal.
- the echoes of transmit pulses are received and changed into receive signals.
- An ultrasonic image, substantially corresponding to a slice of a relevant anatomic region is detected by transmitting ultrasonic pulses along a plurality of adjacent scan lines which are all arranged over the desired scan plane.
- the receive time for each contribution to the receive signal along the scan line is related to the position of the reflector along the scan line.
- each contribution to the receive signal may be related to one or more pixels in a digital image.
- This information is also accessible for a parallel processing of the receive signals, including the RF signal analysis steps for recognizing the presence of single contrast agent microbubbles or small microbubble populations according to one of the above methods. Therefore, the single contrast agent microbubbles or small microbubble populations may be localized along each scan line on the basis of the receive time of the receive signal component resulting from the single microbubble or the small microbubble population. Therefore, this information allows to identify the ultrasonic image pixels corresponding to the detected position of the single microbubble or the small microbubble population.
- the localization of the single microbubble or small microbubble population is simplified when, like in the bispectrum embodiment, the receive signal is divided into a succession of signal time blocks, each comprising a signal segment.
- the aspect of said pixel/s is changed, e.g. by adding specific color with respect to the grey-scale ultrasonic image and the pixel/s are displayed in said ultrasonic image with the aspect that has been changed in the previous step.
- This step in which the single microbubbles or small microbubble populations are localized in an anatomic region under examination and displayed in combination with the ultrasonic image of said anatomic region allows a fast and convenient visual check of the position of the single microbubbles or the small microbubble populations.
- Figure 28 shows a particular advantageous application of the inventive method for detecting single microbubbles or small microbubble populations, particularly for local drug administration.
- microbubbles whose structure comprises bioconjugate ligands capable of bonding to specific tissue types, such as particularly, but without limitation, the endothelium of vessels.
- tissue types such as particularly, but without limitation, the endothelium of vessels.
- These microbubbles which are known as targeted microbubbles, are drawn by the tissues whereto they are capable to bond and bond thereto.
- a particular application consists in providing microbubbles having bioconjugate ligands capable of bonding to the endothelium particularly of new vessels, to highlight abnormal vascularization conditions indicative of tumor tissues.
- Other currently studied examples are inflamed tissues or thrombi.
- targeted microbubbles to bond to selected tissue types allows them to be used as carriers, for carrying drugs to the pathologic region and releasing them directly to the pathologic region. This avoids the use of more invasive local drug administration methods, as well as metabolic delivery pathways, e.g. oral administration, which also provides advantages in terms of prevention of the side effects caused by particularly heavy drugs.
- the local administration method makes use of an additional characteristic of contrast agent microbubbles.
- Microbubbles are known to be destroyed by acoustic pressures of ultrasonic transmit pulses incident on said microbubbles. Therefore, once the microbubbles have bonded to the selected tissue and have carried the drug contained therein, they may be detected and the detected position thereof within the relevant anatomic region may be visually checked, so that said microbubbles may be later destroyed by ultrasonic transmit pulses having an acoustic pressure above the resistance limit of said microbubbles, whereby the latter are destroyed and release the drug.
- the acoustic pressure of the transmit pulse intended for microbubble destruction may be controlled so that only a certain portion of such microbubbles is actually destroyed.
- Microbubble destruction is well known and widely used to measure microbubble perfusion in an anatomic region under examination and the skilled person knows that within an acoustic pressure range of a transmit pulse, the acoustic pressure of said pulse only causes a certain portion of microbubbles to be destroyed, according to known ratios of acoustic pressure of the transmit pulse to the number of actually destroyed microbubbles.
- one or more ultrasonic pulses may be transmitted, to be focused on specific areas of the relevant anatomic region, i.e. on the slice corresponding to the displayed image that contains the detected microbubbles, and the acoustic pressures of said transmit pulses may be controlled to levels above the microbubble destruction threshold, to cause the rupture of a certain portion or all of the detected microbubbles.
- the detection data obtained from various projections in different multidimensional spaces may be combined together.
- simple detection data may be combined by using well known data fusion techniques.
- the results of each different detection method may be combined.
- the results of multidimensional projections by Higher Order Spectrum or time-frequency analysis techniques such as one or more Wigner-Ville Distribution variants and/or such as Gabor expansion or other techniques of multidimensional projection of receive signal spectra may be combined together both before the decision step, in which a decision is made as to whether the signal representation by said projections denotes or not the presence of a single microbubble or a small microbubble population, or after the decision process, on the basis of the receive signal representations according to said projections, the results of said decision step being combined together.
Claims (25)
- Une méthode de détection et localisation par ultrasons de microbulles d'agent de contraste, laquelle méthode comprend les étapes de:a) scanner une région anatomique dans laquelle la présence de microbulles d'agent de contraste est ou peut être prévue, en transmettant une ou plusieurs impulsions ultrasonores en correspondance d'une première fréquence prédéterminée dans ladite région anatomique;b) recevoir les signaux ultrasonores réfléchis résultant des impulsions de transmission;c) identifier la présence des signaux ultrasonores réfléchis ayant au moins une seconde fréquence correspondant au moins à la seconde harmonique de la première fréquence fondamentale des signaux de transmission ultrasonores;d) associer lesdits signaux ultrasonores réfléchis ayant au moins une seconde fréquence correspondant au moins à la seconde harmonique de la première fréquence fondamentale des signaux de transmission ultrasonores aux microbulles d'agent de contraste, agissant comme des réflecteurs;e) déterminer la position desdites microbulles dans la région anatomique en fonction de la localisation temporelle du signal ultrasonore réfléchi ou parties de ce signal ultrasonore réfléchi à ladite au moins un seconde fréquence correspondant à la seconde harmonique de la première fréquence fondamentale des impulsions de transmission ultrasonores pendant toute la durée du signal ultrasonore réfléchicaractérisée en ce qu'elle comprend les étapes supplémentaires suivantes:f) déterminer l'évolution du spectre du signal réfléchi avec le temps et/ou les relations de phases entre les composants du signal réfléchi ayant des différentes fréquences ou plages de fréquence, les composants du signal étant à la fréquence fondamentale de l'/des impulsion(s) de transmission et à la seconde harmonique de l'/des impulsion(s) en projetant les signaux réfléchis dans un ou plusieurs espaces multidimensionnels dont les dimensions sont respectivement liées à ladite première et à ladite seconde fréquence et au temps ou à la phase;g) des signaux ultrasonores d'échantillonnage réfléchis sont détectés, en transmettant des impulsions ultrasonores à des échantillons de tissus connus ne contenant pas de microbulles ou de petites populations de microbulles et sur des échantillons de tissus connus contenant une seule bulle ou une petite population de bulles;h) les signaux ultrasonores d'échantillonnage réfléchis sont projetés dans le(s) même(s) espace(s) multidimensionnel(s) pour mettre en évidence l'évolution du spectre du signal réfléchi avec le temps et/ou les relations de phase entre les composants du signal réfléchi ayant des différentes fréquences ou plages de fréquence;i) les projections des impulsions ultrasonores d'échantillonnage reflétées pour un tissu simple et un tissu ayant une seule microbulle ou une petite population de microbulles dans l'/les espace(s) multidimensionnel(s) sont comparées et des caractéristiques uniques sont définies pour lesdites projections pour un tissu simple et un tissu ayant une seule microbulle ou une petite population de microbulles;j) les projections des signaux réfléchis dans l'/les espace(s) multidimensionnel(s) sont analysées pour identifier lesdites caractéristiques de diversification définies en fonction de la comparaison entre les projections des signaux ultrasonores d'échantillonnage réfléchis dans l'/les espace(s) multidimensionnel(s);k) une projection du signal réfléchi dans ledit/lesdits espace(s) multidimensionnel(s) étant défini comme dérivant d'une seule microbulle ou d'une petite population de microbulles lorsqu'il présente les caractéristiques de projection du signal ultrasonore d'échantillonnage réfléchi dans ledit/lesdits espace(s) multidimensionnel(s) relatif(s) à l'échantillon de tissu connu ayant une seule microbulle ou une petite population de microbulles.
- Une méthode selon la revendication 1, caractérisée en ce que des microbulles individuelles ou de petites populations de microbulles sont localisées dans la région anatomique sous examen à travers les étapes de:l) scanner la région anatomique pertinente en transmettant au moins une impulsion ultrasonore dans ladite région le long d'une pluralité de lignes de balayage adjacentes;m) recevoir le signal réfléchi le long de chacune desdites lignes de balayage;n) analyser le signal réfléchi selon les étapes de la méthode de f) à k) de la revendication 2, le long de chaque ligne de balayage, pour identifier un composant du signal dérivant de la présence d'une microbulle ou d'une petite population de microbulles et identifier ledit composant du signal réfléchi;o) déterminer la position de la microbulle ou de la population de microbulles le long de la ligne de balayage correspondante en fonction de la localisation temporelle dudit composant pendant la durée du signal réfléchi;p) la position de la microbulle ou de la petite population de microbulles dans la région anatomique pertinente étant définie par la position de la ligne de balayage et la position de la microbulle ou de la petite population de microbulles le long de ladite ligne de balayage, comme déterminé dans l'étape o).
- Une méthode selon la revendication 1 ou 2, caractérisée en ce que une projection dans un ou plusieurs espaces multidimensionnels du signal de réception est un Spectre d'Ordre Supérieur (SOS) ou un polyspectre.
- Une méthode selon la revendication 3, caractérisée en ce que le bispectre du signal de réception est utilisé comme un Spectre d'Ordre Supérieur.
- Une méthode selon la revendication 3 ou 4, caractérisée par les étapes suivantes:f1) les signaux réfléchis le long de chaque ligne de balayage ou ligne de visualisation sont représentés par un bispectre;g1) des signaux ultrasonores d'échantillonnage réfléchis sont détectés, en transmettant des impulsions ultrasonores à des échantillons de tissus connus ne contenant pas de microbulles ou de petites populations de microbulles et sur des échantillons de tissus connus contenant une seule bulle ou une petite population de bulles;h1) les signaux ultrasonores d'échantillonnage réfléchis sont également représentés par des bispectres respectifs;i1) les bispectres des impulsions ultrasonores d'échantillonnage reflétées pour un tissu simple et un tissu ayant une seule microbulle ou une petite population de microbulles sont comparés et des caractéristiques uniques sont définies pour lesdits bispectres pour un tissu simple et un tissu ayant une seule microbulle ou une petite population de microbulles;j1) les bispectres des signaux réfléchis sont analysés pour identifier lesdites caractéristiques de diversification définies en fonction de la comparaison entre les bispectres des signaux ultrasonores d'échantillonnage réfléchis;k1) le bispectre du signal réfléchi étant défini comme dérivant d'une seule microbulle ou d'une petite population de microbulles lorsqu'il présente les caractéristiques du bispectre du signal ultrasonore d'échantillonnage réfléchi relatif à l'échantillon de tissu connu ayant une seule microbulle ou une petite population de microbulles.
- Une méthode selon la revendication 5, caractérisée en ce que l'analyse selon les étapes j1) et k1) de la revendication 5 est réalisée par des outils mathématiques analytiques qui extraient les caractéristiques typiques des bispectres indiquant la présence d'une microbulle ou d'une petite population de microbulles.
- Une méthode selon la revendication 5, caractérisée en ce que l'analyse selon les étapes j1) et k1) de la revendication 5 est réalisée par des outils de Reconnaissance de Formes, des images numériques étant générées pour représenter les bispectres des signaux réfléchis d'échantillonnage et les bispectres des signaux réfléchis pertinents.
- Une méthode selon les revendications 3 ou 4 et 7, caractérisée par les étapes suivantes:f2) les signaux réfléchis le long de chaque ligne de balayage ou ligne de visualisation sont représentés par un bispectre et une image numérique représentant ledit bispectre est générée;g2) des signaux ultrasonores d'échantillonnage réfléchis sont détectés, en transmettant des impulsions ultrasonores à des échantillons de tissus connus ne contenant pas de microbulles ou de petites populations de microbulles et sur des échantillons de tissus connus contenant une seule bulle ou une petite population de bulles;h2) les signaux ultrasonores d'échantillonnage réfléchis sont également représentés par des bispectres respectifs;i2) une image numérique est générée représentant les bispectres des signaux ultrasonores d'échantillonnage réfléchis pour un tissu simple et pour un tissu contenant une seule microbulle ou une petite population de microbulles;j2) une base de données de cas connus est générée, laquelle base de données comprend les images numériques représentant les bispectres des signaux d'échantillonnage réfléchis relatifs uniquement à un paramètre indiquant l'association de chaque bispectre à des signaux d'échantillonnage réfléchis résultant d'un tissu simple ou d'un tissu contenant une seule microbulle ou une petite population de microbulles;k2) la base de données des cas connus définie dans l'étape j2) est utilisée pour tester un algorithme prédictif et en particulier un réseau de neurones;l2) une fois que l'algorithme prédictif a été testé selon l'étape k2), il est alimenté avec les images numériques représentant les bispectres des signaux réfléchis, et la sortie de l'algorithme prédictif est utilisé comme indicateur de la correspondance de signal de réception associé à chaque image numérique représentant les bispectres à un signal réfléchi dérivé d'un tissu simple ou à un signal réfléchi dérivant d'un tissu contenant une seule microbulle ou une petite population de microbulles.
- Une méthode selon l'une ou plusieurs des revendications précédentes, caractérisée en ce qu'une étape préventive est prévue dans laquelle le signal réfléchi le long de chaque ligne de balayage est divisé en une pluralité de segments de signal successifs, chacun étant associé à un bloc de temps d'une succession de blocs de temps ayant de différents temps de début et de fin prédéterminés pendant toute la durée du signal de réception, tandis que les étapes de la méthode selon l'une ou plusieurs des revendications 1 à 9 sont exécutées pour le segment de signal de chaque bloc de temps.
- Une méthode selon la revendication 1 ou 2, caractérisée en ce qu'une méthode d'analyse temps-fréquence du signal est utilisée comme projection du signal réfléchi le long des lignes de balayage ou des lignes de visualisation.
- Une méthode selon la revendication 10, caractérisée en ce que l'expansion de Gabor est utilisée comme une analyse temps-fréquence du signal de réception.
- Une méthode selon la revendication 10, caractérisée en ce que la Distribution de Wigner-Ville (DWV) est utilisée comme une analyse temps-fréquence du signal de réception.
- Une méthode selon la revendication 10, caractérisée en ce que la Pseudo Distribution de Wigner-Ville (PDWV) est utilisée comme une analyse temps-fréquence du signal de réception.
- Une méthode selon les revendications 10 à 13, caractérisée par les étapes suivantes:f3) les signaux réfléchis le long de chaque ligne de balayage ou ligne de visualisation sont traités par une méthode d'analyse temps-fréquence;g3) des signaux ultrasonores d'échantillonnage réfléchis sont détectés, en transmettant des impulsions ultrasonores à des échantillons de tissus connus ne contenant pas de microbulles ou de petites populations de microbulles et sur des échantillons de tissus connus contenant une seule bulle ou une petite population de bulles;h3) les signaux ultrasonores d'échantillonnage réfléchis sont également traités par une méthode d'analyse temps-fréquence;i4) des représentations graphiques sont générées des résultats de l'analyse temps-fréquence des signaux de réception d'échantillonnage pour le tissu simple et le tissu ayant une seule microbulle ou une petite population de microbulles et lesdites représentations graphiques sont comparées, des caractéristiques étant définies et lesquelles différencient de manière unique lesdites représentations graphiques des analyses temps-fréquence des signaux de réception d'échantillonnage pour le tissu simple et le tissu ayant une seule microbulle ou une petite population de microbulle;j4) les représentations graphiques des analyses temps-fréquence des signaux réfléchis sont analysées pour identifier lesdites caractéristiques de diversification définies en fonction de la comparaison entre lesdites représentations graphiques des signaux ultrasonores d'échantillonnage réfléchis;k4) le signal réfléchi étant défini comme dérivant d'une seule microbulle ou d'une petite population de microbulles lorsqu'il correspond à une représentation graphique de l'analyse temps-fréquence associée laquelle possède les caractéristiques de la représentation graphique de l'analyse temps-fréquence du signal ultrasonore d'échantillonnage réfléchi relatif à l'échantillon de tissu connu ayant une seule microbulle ou une petite population de microbulles.
- Une méthode selon la revendication 14, caractérisée en ce que, de la comparaison entre les représentations graphiques des analyses temps-fréquence des signaux de réception d'échantillonnage pour le tissu simple et pour le tissu contenant une seule microbulle ou une petite population de microbulles, une règle de décision appropriée est définie, éventuellement consistant de valeurs de seuil de fréquence et d'amplitude, laquelle règle détermine le discriminant entre la représentation graphique de l'analyse temps-fréquence du signal de réception résultant du tissu simple et l'analyse temps-fréquence du signal de réception résultant du tissu contenant une seule microbulle ou une petite population de microbulles.
- Une méthode selon la revendication 14, caractérisée en ce que une image numérique est générée représentant l'analyse temps-fréquence des signaux de réception d'échantillonnage et les signaux de réception réfléchis de la région anatomique pertinente;
la correspondance étant déterminée entre la représentation graphique de l'analyse temps-fréquence du signal de réception et du signal de réception résultant du tissu simple ou du signal de réception résultant du tissu contenant une seule microbulle ou une petite population de microbulles par des méthodes de Reconnaissance de Formes. - Une méthode selon la revendication 16, caractérisée en ce que les images numériques représentant l'analyse temps-fréquence des signaux de réception d'échantillonnage sont associées de manière unique à l'absence ou à la présence d'une seule microbulle ou d'une petite population de microbulles dans le tissu de la région anatomique sous examen, une base de données étant générée;
la base de données de cas connus est utilisée pour tester un algorithme prédictif, tel qu'un réseau de neurones artificiel;
les images numériques représentant l'analyse temps-fréquence des signaux de réception étant alimentées a l'algorithme prédictif testé, l'association desdits signaux de réception au tissu simple ou au tissu contenant une seule microbulle ou une petite population de microbulles étant déterminée en utilisant la sortie dudit algorithme prédictif. - Une méthode selon l'une ou plusieurs des revendications précédentes, caractérisée en ce que les signaux de réception et les signaux de réception d'échantillonnage sont préalablement filtrés pour éliminer le composant du signal de réception dans la plage de la fréquence fondamentale des impulsions de transmission.
- Une méthode selon l'une ou plusieurs des revendications précédentes, caractérisée en ce qu'elle prévoit un traitement parallèle des signaux de réception pour générer et afficher une image ultrasonore.
- Une méthode selon l'une ou plusieurs des revendications précédentes, caractérisée en ce que
le temps ou la fenêtre de temps est détecté(e) pendant lequel/laquelle, en référence à la durée totale du signal de réception, la portion du signal de réception résultant d'une microbulle ou d'une petite population de microbulles est reçue et la position de la microbulle ou de la petite population de microbulles le long de la ligne de balayage est déterminée à partir de tel temps ou de telle fenêtre de temps détecté(e);
une image ultrasonore numérique est générée en parallèle à partir du signal de réception de chaque ligne de balayage;
le temps ou la fenêtre de temps pendant lequel/laquelle la partie du signal de réception résultant de la réflexion d'une microbulle ou d'une petite population de microbulles est reçu le long d'une ligne de balayage prédéterminée est utilisé pour déterminer le pixel ou l'ensemble de pixels de l'image ultrasonore numérique correspondant audit temps de réception ou à ladite fenêtre de temps de réception et à la ligne de balayage;
l'aspect dudit pixel ou dudit ensemble de pixels est changé pour se différencier de l'aspect des pixels de l'image ultrasonore;
ledit pixel ou ledit ensemble de pixels est affiché avec son aspect changé dans l'image ultrasonore numérique. - Une méthode selon la revendication 20, caractérisée en ce que l'image ultrasonore numérique est une image en échelle de gris, tandis que l'aspect du/des pixel(s) correspondant au temps ou à la fenêtre de temps, pendant lequel/laquelle la portion du signal de réception dérivant de la réflexion d'une microbulle ou d'une petite population de microbulles est reçue, est identifié par une couleur.
- Une méthode selon l'une ou plusieurs des revendications précédentes, caractérisée en ce qu'elle est prévue en combinaison avec des microbulles comprenant des ligands bioconjugués capable de se lier à des types de tissus prédéterminés et sélectionnés.
- Une méthode selon la revendication 22, caractérisée en ce que les microbulles ont un ligand bioconjugué capable de se lier à l'endothélium des vaisseaux nouvellement formés.
- Une méthode selon l'une ou plusieurs de revendications 1 à 23, caractérisée en ce que la présence d'une microbulle ou d'une petite population de microbulles est détectée en projetant les signaux de réception dans des espaces multidimensionnels selon deux, trois ou plusieurs projections multidimensionnelles différentes, la présence d'une microbulle ou d'une petite population de microbulles étant déterminée par une combinaison des résultats de détection d'une microbulle ou d'une petite population de microbulles obtenues de chacune desdites projections multidimensionnelles.
- Une méthode selon la revendication 24, caractérisée en ce que la présence d'une microbulle ou d'une petite population de microbulles est détectée en projetant les signaux de réception dans des espaces multidimensionnels selon deux, trois ou plusieurs projections multidimensionnelles différentes, les données de toutes lesdites projections multidimensionnelles étant combinées par des techniques de fusion de données et la présence d'une microbulle ou d'une petite population de microbulles étant déterminée en fonction des données de chacune desdites projections multidimensionnelles des signaux de réception.
Priority Applications (2)
| Application Number | Priority Date | Filing Date | Title |
|---|---|---|---|
| EP05425222.6A EP1712182B1 (fr) | 2005-04-14 | 2005-04-14 | Méthode de détection par ultrasons et localisation de microbulles d'agent de contraste et méthode pour l'administration localisée de médicaments en utilisant les microbulles comme véhicule |
| US11/404,271 US7981040B2 (en) | 2005-04-14 | 2006-04-14 | Method of ultrasonic detection and localization of contrast agent microbubbles and method for local drug administration by using microbubble carriers |
Applications Claiming Priority (1)
| Application Number | Priority Date | Filing Date | Title |
|---|---|---|---|
| EP05425222.6A EP1712182B1 (fr) | 2005-04-14 | 2005-04-14 | Méthode de détection par ultrasons et localisation de microbulles d'agent de contraste et méthode pour l'administration localisée de médicaments en utilisant les microbulles comme véhicule |
Publications (2)
| Publication Number | Publication Date |
|---|---|
| EP1712182A1 EP1712182A1 (fr) | 2006-10-18 |
| EP1712182B1 true EP1712182B1 (fr) | 2020-12-30 |
Family
ID=34943147
Family Applications (1)
| Application Number | Title | Priority Date | Filing Date |
|---|---|---|---|
| EP05425222.6A Active EP1712182B1 (fr) | 2005-04-14 | 2005-04-14 | Méthode de détection par ultrasons et localisation de microbulles d'agent de contraste et méthode pour l'administration localisée de médicaments en utilisant les microbulles comme véhicule |
Country Status (2)
| Country | Link |
|---|---|
| US (1) | US7981040B2 (fr) |
| EP (1) | EP1712182B1 (fr) |
Families Citing this family (12)
| Publication number | Priority date | Publication date | Assignee | Title |
|---|---|---|---|---|
| EP1712182B1 (fr) | 2005-04-14 | 2020-12-30 | Esaote S.p.A. | Méthode de détection par ultrasons et localisation de microbulles d'agent de contraste et méthode pour l'administration localisée de médicaments en utilisant les microbulles comme véhicule |
| CA2508428A1 (fr) * | 2005-05-20 | 2006-11-20 | Hydro-Quebec | Detection, localisation et interpretation de decharge partielle |
| US8259829B2 (en) * | 2006-09-20 | 2012-09-04 | Fundacio Privada Centre Techologic de Telecomunicacions de Catalunya | Method for estimating the time of arrival in ultra wideband systems |
| EP2217150A1 (fr) * | 2007-11-28 | 2010-08-18 | Koninklijke Philips Electronics N.V. | Visualisation ultrasonore d'aiguilles percutanées, de cathéters intravasculaires et d'autres dispositifs invasifs |
| JP2009261657A (ja) * | 2008-04-25 | 2009-11-12 | Ge Medical Systems Global Technology Co Llc | 超音波撮像装置 |
| US20090287083A1 (en) * | 2008-05-14 | 2009-11-19 | Leonid Kushculey | Cavitation detector |
| JP4627556B2 (ja) * | 2008-08-08 | 2011-02-09 | アロカ株式会社 | 超音波診断装置 |
| GB0820377D0 (en) | 2008-11-07 | 2008-12-17 | Isis Innovation | Mapping and characterization of cavitation activity |
| CA2910561C (fr) * | 2013-05-03 | 2021-07-27 | Sunnybrook Health Sciences Centre | Systemes et procedes d'imagerie ultrasonore a super-resolution |
| US10575816B2 (en) * | 2017-01-25 | 2020-03-03 | Insightec, Ltd. | Cavitation localization |
| US11357477B2 (en) | 2018-09-07 | 2022-06-14 | Siemens Medical Solutions Usa, Inc. | Microbubble destruction for medical ultrasound imaging |
| CN110018447A (zh) * | 2019-04-09 | 2019-07-16 | 电子科技大学 | 基于双谱分析与卷积神经网络的信号发射机个体识别方法 |
Citations (1)
| Publication number | Priority date | Publication date | Assignee | Title |
|---|---|---|---|---|
| US20050054928A1 (en) * | 2003-09-09 | 2005-03-10 | Marino Cerofolini | Ultrasound imaging method combined with the presence of contrast media in the body under examination |
Family Cites Families (9)
| Publication number | Priority date | Publication date | Assignee | Title |
|---|---|---|---|---|
| US5140670A (en) | 1989-10-05 | 1992-08-18 | Regents Of The University Of California | Cellular neural network |
| US5526816A (en) * | 1994-09-22 | 1996-06-18 | Bracco Research S.A. | Ultrasonic spectral contrast imaging |
| US5717989A (en) | 1994-10-13 | 1998-02-10 | Full Service Trade System Ltd. | Full service trade system |
| US5776063A (en) * | 1996-09-30 | 1998-07-07 | Molecular Biosystems, Inc. | Analysis of ultrasound images in the presence of contrast agent |
| US6471655B1 (en) * | 1999-06-29 | 2002-10-29 | Vitalwave Corporation | Method and apparatus for the noninvasive determination of arterial blood pressure |
| ITFI20020034A1 (it) * | 2002-02-27 | 2003-08-27 | Actis Active Sensors S R L | Metodo e dispositivo per l'analisi spettrale di un segnale ecografico |
| US6780152B2 (en) * | 2002-06-26 | 2004-08-24 | Acuson Corporation | Method and apparatus for ultrasound imaging of the heart |
| EP1508872A1 (fr) | 2003-08-22 | 2005-02-23 | Semeion | Algorithme pour la reconnaissance des relations entre les données d'une base de données et méthode de reconnaissance d'images basée sur cet algorithme |
| EP1712182B1 (fr) | 2005-04-14 | 2020-12-30 | Esaote S.p.A. | Méthode de détection par ultrasons et localisation de microbulles d'agent de contraste et méthode pour l'administration localisée de médicaments en utilisant les microbulles comme véhicule |
-
2005
- 2005-04-14 EP EP05425222.6A patent/EP1712182B1/fr active Active
-
2006
- 2006-04-14 US US11/404,271 patent/US7981040B2/en active Active
Patent Citations (1)
| Publication number | Priority date | Publication date | Assignee | Title |
|---|---|---|---|---|
| US20050054928A1 (en) * | 2003-09-09 | 2005-03-10 | Marino Cerofolini | Ultrasound imaging method combined with the presence of contrast media in the body under examination |
Also Published As
| Publication number | Publication date |
|---|---|
| US7981040B2 (en) | 2011-07-19 |
| US20070016051A1 (en) | 2007-01-18 |
| EP1712182A1 (fr) | 2006-10-18 |
Similar Documents
| Publication | Publication Date | Title |
|---|---|---|
| EP1712182B1 (fr) | Méthode de détection par ultrasons et localisation de microbulles d'agent de contraste et méthode pour l'administration localisée de médicaments en utilisant les microbulles comme véhicule | |
| US11493616B2 (en) | Method and a device for imaging a visco-elastic medium | |
| US5628322A (en) | Method of ultrasound imaging and diagnostic ultrasound system | |
| EP1599122B1 (fr) | Systeme de caracterisation de plaque | |
| JP3625305B2 (ja) | 超音波診断装置 | |
| US9066679B2 (en) | Ultrasonic technique for assessing wall vibrations in stenosed blood vessels | |
| US6050948A (en) | Ultrasound Doppler diagnostic apparatus | |
| EP1671156B1 (fr) | Procede et dispositif ameliores d'analyse spectrale locale d'un son ultrasonore | |
| CN104013419B (zh) | 医疗超声波中的自适应声压估计 | |
| US20090062644A1 (en) | System and method for ultrasound harmonic imaging | |
| CA2127127A1 (fr) | Examen de la perfusion tissulaire avec un agent de contraste aux ultrasons | |
| CN110325119A (zh) | 卵巢卵泡计数和大小确定 | |
| US5961464A (en) | Ultrasound contrast agent detection using spectral analysis from acoustic scan lines | |
| EP1515640B1 (fr) | Systeme et methode d'analyse d'un tissu | |
| US7815573B2 (en) | Method and device for spectral analysis of an echographic signal | |
| CN109259801A (zh) | 一种剪切波弹性成像方法及装置 | |
| Granchi et al. | Multidimensional spectral analysis of the ultrasonic radiofrequency signal for characterization of media | |
| Leonov et al. | Diagnostic mode detecting solid mineral inclusions in medical ultrasound imaging | |
| US6406429B1 (en) | Detection of cystic structures using pulsed ultrasonically induced resonant cavitation | |
| EP1152256A1 (fr) | Procédé et dispositif d'imagerie par ultrasons, notamment des mobiles tels que des instruments chirurgicaux, tissus, écoulements ou analogues | |
| JP4370482B2 (ja) | 超音波造影描画装置 | |
| Cowe et al. | RF signals provide additional information on embolic events recorded during TCD monitoring | |
| US6171245B1 (en) | Method of imaging scatterers based on acoustically stimulated changes of their acoustic properties | |
| JP4317996B2 (ja) | 超音波造影描画装置 | |
| US20190069875A1 (en) | Ultrasound system for cerebral blood flow imaging and microbubble-enhanced blood clot lysis |
Legal Events
| Date | Code | Title | Description |
|---|---|---|---|
| PUAI | Public reference made under article 153(3) epc to a published international application that has entered the european phase |
Free format text: ORIGINAL CODE: 0009012 |
|
| 17P | Request for examination filed |
Effective date: 20060504 |
|
| AK | Designated contracting states |
Kind code of ref document: A1 Designated state(s): AT BE BG CH CY CZ DE DK EE ES FI FR GB GR HU IE IS IT LI LT LU MC NL PL PT RO SE SI SK TR |
|
| AX | Request for extension of the european patent |
Extension state: AL BA HR LV MK YU |
|
| AKX | Designation fees paid |
Designated state(s): AT BE BG CH CY CZ DE DK EE ES FI FR GB GR HU IE IS IT LI LT LU MC NL PL PT RO SE SI SK TR |
|
| RAP1 | Party data changed (applicant data changed or rights of an application transferred) |
Owner name: ESAOTE S.P.A. |
|
| RAP1 | Party data changed (applicant data changed or rights of an application transferred) |
Owner name: ESAOTE S.P.A. |
|
| 17Q | First examination report despatched |
Effective date: 20150106 |
|
| RAP1 | Party data changed (applicant data changed or rights of an application transferred) |
Owner name: ESAOTE S.P.A. |
|
| STAA | Information on the status of an ep patent application or granted ep patent |
Free format text: STATUS: EXAMINATION IS IN PROGRESS |
|
| GRAP | Despatch of communication of intention to grant a patent |
Free format text: ORIGINAL CODE: EPIDOSNIGR1 |
|
| STAA | Information on the status of an ep patent application or granted ep patent |
Free format text: STATUS: GRANT OF PATENT IS INTENDED |
|
| INTG | Intention to grant announced |
Effective date: 20200910 |
|
| GRAS | Grant fee paid |
Free format text: ORIGINAL CODE: EPIDOSNIGR3 |
|
| GRAA | (expected) grant |
Free format text: ORIGINAL CODE: 0009210 |
|
| STAA | Information on the status of an ep patent application or granted ep patent |
Free format text: STATUS: THE PATENT HAS BEEN GRANTED |
|
| REG | Reference to a national code |
Ref country code: DE Ref legal event code: R081 Ref document number: 602005057093 Country of ref document: DE Owner name: ESAOTE S.P.A., IT Free format text: FORMER OWNER: ESAOTE S.P.A., MILANO, IT |
|
| AK | Designated contracting states |
Kind code of ref document: B1 Designated state(s): AT BE BG CH CY CZ DE DK EE ES FI FR GB GR HU IE IS IT LI LT LU MC NL PL PT RO SE SI SK TR |
|
| REG | Reference to a national code |
Ref country code: GB Ref legal event code: FG4D |
|
| REG | Reference to a national code |
Ref country code: DE Ref legal event code: R096 Ref document number: 602005057093 Country of ref document: DE |
|
| REG | Reference to a national code |
Ref country code: AT Ref legal event code: REF Ref document number: 1349119 Country of ref document: AT Kind code of ref document: T Effective date: 20210115 |
|
| REG | Reference to a national code |
Ref country code: IE Ref legal event code: FG4D |
|
| PG25 | Lapsed in a contracting state [announced via postgrant information from national office to epo] |
Ref country code: FI Free format text: LAPSE BECAUSE OF FAILURE TO SUBMIT A TRANSLATION OF THE DESCRIPTION OR TO PAY THE FEE WITHIN THE PRESCRIBED TIME-LIMIT Effective date: 20201230 Ref country code: GR Free format text: LAPSE BECAUSE OF FAILURE TO SUBMIT A TRANSLATION OF THE DESCRIPTION OR TO PAY THE FEE WITHIN THE PRESCRIBED TIME-LIMIT Effective date: 20210331 |
|
| REG | Reference to a national code |
Ref country code: AT Ref legal event code: MK05 Ref document number: 1349119 Country of ref document: AT Kind code of ref document: T Effective date: 20201230 |
|
| PG25 | Lapsed in a contracting state [announced via postgrant information from national office to epo] |
Ref country code: BG Free format text: LAPSE BECAUSE OF FAILURE TO SUBMIT A TRANSLATION OF THE DESCRIPTION OR TO PAY THE FEE WITHIN THE PRESCRIBED TIME-LIMIT Effective date: 20210330 Ref country code: SE Free format text: LAPSE BECAUSE OF FAILURE TO SUBMIT A TRANSLATION OF THE DESCRIPTION OR TO PAY THE FEE WITHIN THE PRESCRIBED TIME-LIMIT Effective date: 20201230 |
|
| REG | Reference to a national code |
Ref country code: NL Ref legal event code: MP Effective date: 20201230 |
|
| REG | Reference to a national code |
Ref country code: LT Ref legal event code: MG9D |
|
| PG25 | Lapsed in a contracting state [announced via postgrant information from national office to epo] |
Ref country code: RO Free format text: LAPSE BECAUSE OF FAILURE TO SUBMIT A TRANSLATION OF THE DESCRIPTION OR TO PAY THE FEE WITHIN THE PRESCRIBED TIME-LIMIT Effective date: 20201230 Ref country code: SK Free format text: LAPSE BECAUSE OF FAILURE TO SUBMIT A TRANSLATION OF THE DESCRIPTION OR TO PAY THE FEE WITHIN THE PRESCRIBED TIME-LIMIT Effective date: 20201230 Ref country code: PT Free format text: LAPSE BECAUSE OF FAILURE TO SUBMIT A TRANSLATION OF THE DESCRIPTION OR TO PAY THE FEE WITHIN THE PRESCRIBED TIME-LIMIT Effective date: 20210430 Ref country code: NL Free format text: LAPSE BECAUSE OF FAILURE TO SUBMIT A TRANSLATION OF THE DESCRIPTION OR TO PAY THE FEE WITHIN THE PRESCRIBED TIME-LIMIT Effective date: 20201230 Ref country code: CZ Free format text: LAPSE BECAUSE OF FAILURE TO SUBMIT A TRANSLATION OF THE DESCRIPTION OR TO PAY THE FEE WITHIN THE PRESCRIBED TIME-LIMIT Effective date: 20201230 Ref country code: EE Free format text: LAPSE BECAUSE OF FAILURE TO SUBMIT A TRANSLATION OF THE DESCRIPTION OR TO PAY THE FEE WITHIN THE PRESCRIBED TIME-LIMIT Effective date: 20201230 Ref country code: LT Free format text: LAPSE BECAUSE OF FAILURE TO SUBMIT A TRANSLATION OF THE DESCRIPTION OR TO PAY THE FEE WITHIN THE PRESCRIBED TIME-LIMIT Effective date: 20201230 |
|
| PG25 | Lapsed in a contracting state [announced via postgrant information from national office to epo] |
Ref country code: AT Free format text: LAPSE BECAUSE OF FAILURE TO SUBMIT A TRANSLATION OF THE DESCRIPTION OR TO PAY THE FEE WITHIN THE PRESCRIBED TIME-LIMIT Effective date: 20201230 Ref country code: PL Free format text: LAPSE BECAUSE OF FAILURE TO SUBMIT A TRANSLATION OF THE DESCRIPTION OR TO PAY THE FEE WITHIN THE PRESCRIBED TIME-LIMIT Effective date: 20201230 |
|
| PG25 | Lapsed in a contracting state [announced via postgrant information from national office to epo] |
Ref country code: IS Free format text: LAPSE BECAUSE OF FAILURE TO SUBMIT A TRANSLATION OF THE DESCRIPTION OR TO PAY THE FEE WITHIN THE PRESCRIBED TIME-LIMIT Effective date: 20210430 |
|
| REG | Reference to a national code |
Ref country code: DE Ref legal event code: R097 Ref document number: 602005057093 Country of ref document: DE |
|
| PLBE | No opposition filed within time limit |
Free format text: ORIGINAL CODE: 0009261 |
|
| STAA | Information on the status of an ep patent application or granted ep patent |
Free format text: STATUS: NO OPPOSITION FILED WITHIN TIME LIMIT |
|
| PG25 | Lapsed in a contracting state [announced via postgrant information from national office to epo] |
Ref country code: MC Free format text: LAPSE BECAUSE OF FAILURE TO SUBMIT A TRANSLATION OF THE DESCRIPTION OR TO PAY THE FEE WITHIN THE PRESCRIBED TIME-LIMIT Effective date: 20201230 Ref country code: ES Free format text: LAPSE BECAUSE OF FAILURE TO SUBMIT A TRANSLATION OF THE DESCRIPTION OR TO PAY THE FEE WITHIN THE PRESCRIBED TIME-LIMIT Effective date: 20201230 Ref country code: DK Free format text: LAPSE BECAUSE OF FAILURE TO SUBMIT A TRANSLATION OF THE DESCRIPTION OR TO PAY THE FEE WITHIN THE PRESCRIBED TIME-LIMIT Effective date: 20201230 |
|
| 26N | No opposition filed |
Effective date: 20211001 |
|
| GBPC | Gb: european patent ceased through non-payment of renewal fee |
Effective date: 20210414 |
|
| PG25 | Lapsed in a contracting state [announced via postgrant information from national office to epo] |
Ref country code: LU Free format text: LAPSE BECAUSE OF NON-PAYMENT OF DUE FEES Effective date: 20210414 |
|
| REG | Reference to a national code |
Ref country code: BE Ref legal event code: MM Effective date: 20210430 |
|
| PG25 | Lapsed in a contracting state [announced via postgrant information from national office to epo] |
Ref country code: CH Free format text: LAPSE BECAUSE OF NON-PAYMENT OF DUE FEES Effective date: 20210430 Ref country code: LI Free format text: LAPSE BECAUSE OF NON-PAYMENT OF DUE FEES Effective date: 20210430 Ref country code: GB Free format text: LAPSE BECAUSE OF NON-PAYMENT OF DUE FEES Effective date: 20210414 Ref country code: FR Free format text: LAPSE BECAUSE OF NON-PAYMENT OF DUE FEES Effective date: 20210430 |
|
| PG25 | Lapsed in a contracting state [announced via postgrant information from national office to epo] |
Ref country code: SI Free format text: LAPSE BECAUSE OF FAILURE TO SUBMIT A TRANSLATION OF THE DESCRIPTION OR TO PAY THE FEE WITHIN THE PRESCRIBED TIME-LIMIT Effective date: 20201230 |
|
| PG25 | Lapsed in a contracting state [announced via postgrant information from national office to epo] |
Ref country code: IE Free format text: LAPSE BECAUSE OF NON-PAYMENT OF DUE FEES Effective date: 20210414 |
|
| PG25 | Lapsed in a contracting state [announced via postgrant information from national office to epo] |
Ref country code: IS Free format text: LAPSE BECAUSE OF FAILURE TO SUBMIT A TRANSLATION OF THE DESCRIPTION OR TO PAY THE FEE WITHIN THE PRESCRIBED TIME-LIMIT Effective date: 20210430 |
|
| PG25 | Lapsed in a contracting state [announced via postgrant information from national office to epo] |
Ref country code: BE Free format text: LAPSE BECAUSE OF NON-PAYMENT OF DUE FEES Effective date: 20210430 |
|
| PGFP | Annual fee paid to national office [announced via postgrant information from national office to epo] |
Ref country code: DE Payment date: 20220412 Year of fee payment: 18 |
|
| PG25 | Lapsed in a contracting state [announced via postgrant information from national office to epo] |
Ref country code: HU Free format text: LAPSE BECAUSE OF FAILURE TO SUBMIT A TRANSLATION OF THE DESCRIPTION OR TO PAY THE FEE WITHIN THE PRESCRIBED TIME-LIMIT; INVALID AB INITIO Effective date: 20050414 Ref country code: CY Free format text: LAPSE BECAUSE OF FAILURE TO SUBMIT A TRANSLATION OF THE DESCRIPTION OR TO PAY THE FEE WITHIN THE PRESCRIBED TIME-LIMIT Effective date: 20201230 |
|
| P01 | Opt-out of the competence of the unified patent court (upc) registered |
Effective date: 20230426 |
|
| PGFP | Annual fee paid to national office [announced via postgrant information from national office to epo] |
Ref country code: IT Payment date: 20230404 Year of fee payment: 19 |
|
| REG | Reference to a national code |
Ref country code: DE Ref legal event code: R119 Ref document number: 602005057093 Country of ref document: DE |
|
| PG25 | Lapsed in a contracting state [announced via postgrant information from national office to epo] |
Ref country code: DE Free format text: LAPSE BECAUSE OF NON-PAYMENT OF DUE FEES Effective date: 20231103 |