EP1677672B1 - Qt-interval measurement in the electrocardiogram - Google Patents
Qt-interval measurement in the electrocardiogram Download PDFInfo
- Publication number
- EP1677672B1 EP1677672B1 EP03751058A EP03751058A EP1677672B1 EP 1677672 B1 EP1677672 B1 EP 1677672B1 EP 03751058 A EP03751058 A EP 03751058A EP 03751058 A EP03751058 A EP 03751058A EP 1677672 B1 EP1677672 B1 EP 1677672B1
- Authority
- EP
- European Patent Office
- Prior art keywords
- ecg
- wave
- data
- ecg signal
- signal data
- Prior art date
- Legal status (The legal status is an assumption and is not a legal conclusion. Google has not performed a legal analysis and makes no representation as to the accuracy of the status listed.)
- Expired - Lifetime
Links
- 238000005259 measurement Methods 0.000 title claims description 18
- 238000000034 method Methods 0.000 claims abstract description 55
- 239000013598 vector Substances 0.000 claims description 26
- 238000004364 calculation method Methods 0.000 claims description 4
- 238000009499 grossing Methods 0.000 claims description 4
- 238000001914 filtration Methods 0.000 claims description 3
- 238000012886 linear function Methods 0.000 claims description 3
- 238000012360 testing method Methods 0.000 claims description 3
- 238000001514 detection method Methods 0.000 claims 1
- 238000004458 analytical method Methods 0.000 description 4
- 238000012545 processing Methods 0.000 description 4
- 230000000694 effects Effects 0.000 description 3
- 230000008901 benefit Effects 0.000 description 2
- 230000000747 cardiac effect Effects 0.000 description 2
- 150000001875 compounds Chemical class 0.000 description 2
- 238000013500 data storage Methods 0.000 description 2
- 238000010586 diagram Methods 0.000 description 2
- 238000002565 electrocardiography Methods 0.000 description 2
- 238000012544 monitoring process Methods 0.000 description 2
- 238000007781 pre-processing Methods 0.000 description 2
- 230000009466 transformation Effects 0.000 description 2
- 229930091051 Arenine Natural products 0.000 description 1
- 230000002051 biphasic effect Effects 0.000 description 1
- 238000012937 correction Methods 0.000 description 1
- 239000006185 dispersion Substances 0.000 description 1
- 239000003814 drug Substances 0.000 description 1
- 229940079593 drug Drugs 0.000 description 1
- 230000004064 dysfunction Effects 0.000 description 1
- 230000002708 enhancing effect Effects 0.000 description 1
- 238000000691 measurement method Methods 0.000 description 1
- 238000011429 minimisation method (clinical trials) Methods 0.000 description 1
- 230000002107 myocardial effect Effects 0.000 description 1
- 210000004165 myocardium Anatomy 0.000 description 1
- 239000002547 new drug Substances 0.000 description 1
- 230000001575 pathological effect Effects 0.000 description 1
- 230000033764 rhythmic process Effects 0.000 description 1
- 238000009781 safety test method Methods 0.000 description 1
Images


Classifications
-
- A—HUMAN NECESSITIES
- A61—MEDICAL OR VETERINARY SCIENCE; HYGIENE
- A61B—DIAGNOSIS; SURGERY; IDENTIFICATION
- A61B5/00—Measuring for diagnostic purposes; Identification of persons
- A61B5/24—Detecting, measuring or recording bioelectric or biomagnetic signals of the body or parts thereof
- A61B5/316—Modalities, i.e. specific diagnostic methods
- A61B5/318—Heart-related electrical modalities, e.g. electrocardiography [ECG]
- A61B5/346—Analysis of electrocardiograms
- A61B5/349—Detecting specific parameters of the electrocardiograph cycle
- A61B5/36—Detecting PQ interval, PR interval or QT interval
-
- A—HUMAN NECESSITIES
- A61—MEDICAL OR VETERINARY SCIENCE; HYGIENE
- A61B—DIAGNOSIS; SURGERY; IDENTIFICATION
- A61B5/00—Measuring for diagnostic purposes; Identification of persons
- A61B5/24—Detecting, measuring or recording bioelectric or biomagnetic signals of the body or parts thereof
- A61B5/316—Modalities, i.e. specific diagnostic methods
- A61B5/318—Heart-related electrical modalities, e.g. electrocardiography [ECG]
- A61B5/346—Analysis of electrocardiograms
- A61B5/349—Detecting specific parameters of the electrocardiograph cycle
Definitions
- the present invention relates to methods and apparatus for measuring the QT interval on an electrocardiogram.
- An electrocardiogram measures the instantaneous voltage potential difference of myocardial electrical activity in a number of lead vectors.
- Leads or signals
- Each electrode is connected to a signal processing apparatus via a respective wire (or “lead”).
- the term “lead” commonly refers to either a physical wire to an electrode or to an ECG signal itself.
- leads Commonly 12 different leads are used although it is also known to collapse all the information to within three orthogonal X, Y and Z leads or three quasi- orthogonal leads consisting of known ECG leads I, aVf and V2.
- the durations of certain types of waves within the ECG give very important information.
- One important interval is the QT interval which is approximately 400 ms in duration. Variation in the QT interval is a known indicator of cardiac dysfunction. For example, an average increase in the QT interval of as little as 5-10 ms during pharmaceutical compound safety testing indicates the potential for the drug to induce a fatal cardiac rhythm disturbance if the compound were to be more widely prescribed. Therefore accurate measurement of the QT interval in the standard 12 lead ECG is of paramount importance when assessing the safety of a new drug.
- a method according to the preambule of claim 1 is known from: " Agreement and Reproducibility of Automatic Versus Manual Measurement of QT Interval and QT Dispersion” Irina Savelieva et al, American Journal of Cardiology 1998; 81: 471-477 .
- the present invention seeks to provide improved methods and apparatus for the measurement of the QT interval.
- a method of measuring the QT interval of an electrocardiogram (ECG) signal wherein the end of the T wave is identified from ECG data, the end of the T wave being determined by reference to the timing of at least one intersection at which an upright T wave of a first set of derived ECG signal data intersects an inverted T wave of a second set of derived ECG signal data, the two sets of ECG data being superimposed so as to maximise their fit over a segment after the positive T wave peak.
- ECG electrocardiogram
- intersections can be detected visually on superimposed graphs. Preferably, however, they are detected automatically by numerical techniques. With this in mind, the skilled reader will appreciate that reference to “intersection” and “superimposition” should not be interpreted literally, provided that mathematically equivalent operations are applied.
- the fit of said data may be maximised by a least squares calculation.
- the method comprises the steps of:
- the ECG signal data may acquired from, for example ECG electrodes and/or associated apparatus.
- the ECG data may be acquired from a wide variety of storage or communications media, for example a computer memory or over a communications network.
- step (g) the end of the QT interval must be determined by the first point intersection.
- the end of the T wave is defined in one embodiment at the first point of intersection in said segment, provided there is at least one other point of intersection after a predetermined interval. Said interval can be varied according to the noise content in the segment of the ECG deemed to be the isoelectric line
- the step (b) may comprise calculating the median signal for each time from an ensemble of ECG signals for each lead to reduce low frequency baseline noise.
- the method (b) may further comprise smoothing the median ensembled ECG signal with moving median filter to reduce high frequency noise.
- the method (b) may also further comprise filtering the median smoothed, median ensembled ECG using a wavelet frequency thresholding technique which substracts the magnitudes of any non-zero frequency components (noise) within the isoelectric baseline segement from the rest of the ECG thus further de-noising it.
- a wavelet frequency thresholding technique which substracts the magnitudes of any non-zero frequency components (noise) within the isoelectric baseline segement from the rest of the ECG thus further de-noising it.
- the step (b) may further include vertically shifting the smoothed median ensembled ECG signal so that the minimum value after peak of T is zero.
- the step (b) may further comprise the steps of detecting and correcting baseline drift in the first set of ECG data.
- the detecting step may for example include the testing for the presence of a single crossing of one isoelectric line (for example zero).
- the ensembled ECG can be rotated about a zero point or otherwise transformed to reconfigure the set of ECG data to have multiple crossings of said line (for example multiple zero minima).
- the step (b) may further include applying a non-linear function such as squaring the amplitudes of the signal for all time instants, in order to accentuate features of interest and ensure positive deflections of the T wave.
- a non-linear function such as squaring the amplitudes of the signal for all time instants, in order to accentuate features of interest and ensure positive deflections of the T wave.
- the step (b) may further include summing the squared amplitudes of ensembled orthogonal leads over all time instants to give a squared resultant vector ensembled ECG.
- the method may further include finding the beginning of the QT interval by an established method, for example from the median of ensembled ECG signals from all 12 leads.
- the method may include calculating the QT interval by subtracting the beginning of QT from the calculated end of the T wave.
- QT interval is measured for the squared vector resultant data derived from quasi-orthogonal or actual orthogonal XYZ leads, and the longest of QT measurements made in 3 dimensions is made. This has the benefit of avoiding any apparent change in the QT interval of a fixed direction vector which may be caused by a dynamic physiological change in direction of the resultant vector in three dimensions but without causing any change in length of the resultant vector QT interval.
- the ECG signal data may be acquired in step (a) from the set of standard ECG leads including I, aVf and V2.
- a record carrier wherein there are recorded program instructions for causing a programmable processor to perform the steps of the method as set forth above, or to implement an apparatus having the features set forth.
- the present invention further provides an apparatus for measuring the QT interval of an electrocardiogram (ECG) signal wherein there is provided means for identifying the end of then T wave from ECG data, the end of the T wave defined as the first time of intersection at which an upright T wave of a first set of derived ECG signal data intersects an inverted T wave of a second set of derived ECG signal data, the two sets of data being superimposed so as to maximise their fit over a segment after the positive T wave peak.
- ECG electrocardiogram
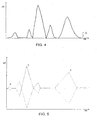
- Figure 1 represents schematically the trace of a typical ECG signal, showing a single lead vector ECG signal.
- 1 is the P wave
- 2 is the onset deflection of the Q wave (the start of the QT interval)
- 3 is the peak of the T wave
- 4 is the approximate end of the QT interval
- 5 is the QT interval duration to be measured
- 6 is the U wave.
- 8 is the isoelectric baseline of the ECG signal.
- the X-axis represents time in milliseconds and the Y-axis represents millivolts above and below the isoelectric line baseline.
- the isoelectric line baseline is the voltage at which there is silent electrical activity within the myocardium, this being theoretically zero millivolts in the absence of noise.
- the start of the QT interval is easily timed at 2 when the wave has high frequency content with a negative or positive deflection from a zero baseline value.
- the end of the QT interval is in theory the time at which the T wave returns to the isoelectric baseline.
- the isoelectric baseline is a theoretical line of constant voltage which in the absence of any noise is theoretically zero millivolts. To measure the QT interval 5, it is only necessary to subtract the one from the other.
- FIGS 2 to 6 will now be described which illustrate the novel steps proposed herein to derive the QT interval in a reliable manner. After describing these steps, a practical ECG apparatus incorporating automatic QT measurement using these techniques will be described, with reference to Figure 7 .
- a wavelet thresholding method can be applied which will remove the frequency components identified in the isoelectric baseline (noise) from the rest of the ECG signal (explained below).
- Figure 2 shows an ECG signal with low frequency noise generating a drifting baseline.
- the point 20 indicates the time point at which the signal has a zero millivolt value.
- the arrow shows the direction of rotation to required re-align the signal as described below.
- Figures 3 and 4 refer to a particular case of orthogonal XYZ leads but the noise minimisation method set forth below can be applied to any set of ECG leads suitable for recording an ECG signal, for example, the standard twelve lead system.
- Figure 3 shows the ECG signal of Figure 2 simultaneously displayed in the XYZ orthogonal vectors.
- P is the P wave
- R is the peak R wave
- T is the peak T wave.
- Figure 4 shows summed squared voltages in the X, Y and Z orthogonal leads over the time period of the signal which gives the squared resultant vector of the ECG signal in three dimensions.
- P is the P wave;
- R is the peak R wave and T the peak T wave.
- the trough 22 is marked as that part of the downslope of the T wave which merges with the isoelectric line, that is, the time segment encompassing the end of the T wave, and prior to onset of the U wave.
- the low frequency baseline noise is firstly reduced by determining the median of the millivoltage values for multiple ensembled ECG signals from the given required vector leads.
- the median millivoltage signal for each time from, for example, ten ensembled ECG signals for each lead can be calculated to reduce low frequency baseline noise.
- the resulting median of the ensembled ECG signal is further smoothed by a moving median filter which has the advantage of reducing the high frequency noise without causing phase distortion.
- a multiresolution Wavelet is used to obtain the magnitudes of noise frequency components which contaminates isoelectric baseline (which has zero frequency in the denoised state).
- the maximum coefficient amplitude seen at the time of the isoelectric baseline within each frequency band is subtracted from the rest of the coefficients within that frequency band.
- the ECG waveform is then reconstituted from the addition of the detail coefficients for each frequency band.
- the resulting median ECG signal is then shifted vertically so that the minimum values/value of the segment of the ECG following the peak T wave are/is zero millivolts. If it is observed that there is only a single time at which the signal value is zero, we judge that there is likely to be baseline drift. To correct this drift, the ECG is "rotated” in both clockwise and anticlockwise directions about the "zero value" axis until the ECG signal within trough 22 intersects the zero baseline at a second or multiple time points. The smallest angle of rotation necessary (which may be clockwise or anti-clockwise) will be accepted as that rotation necessary to correct for baseline drift, and this rotational correction is applied to the median ECG signal to derive the reconfigured ECG for each lead. Strict rotation is not necessary. Another geometric transformation such as a shear transformation may be equally appropriate to achieve the desired result.
- the amplitude of the resulting median reconfigured ECG signal is then converted into microvolts and squared, which will have the effect of forcing the microvolt values below 1 towards zero whilst increasing the microvolt values above 1, thus effectively enhancing the high frequency features of the actual T wave signal end and reducing the low frequency features of the actual T wave signal end, thus making identification of the T wave end easier.
- the selection of a microvolt scale for this purpose is merely a matter of convenience, and a different scale factor could in principle be applied to keep the squared values within any desired range.
- the method of measuring the QT interval can be applied to a reconfigured ECG signal in any vector lead.
- the onset of the Q wave can be identified readily in a known manner.
- the method should be applied to a squared signal because it allows a clearer demarcation between isoelectric baseline and downslope of T wave. It also prepares the measurement for the squared Resultant vector and it keeps the T wave all positive. The method could theoretically be applied to cases of biphasic T waves which occur in certain pathological conditions.
- Figure 5 shows an upright squared ECG signal and a superimposed inverted squared ECG signal. They are superimposed with a vertical offset chosen so that the troughs of the isoelectric baseline following the peak T of both the upright and inverted waves have the best least squares fit.
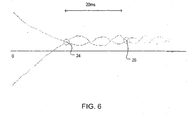
- Figure 6 shows a magnified view of the superimposed part of the T wave downslopes and troughs from the upright and inverted ECGs of Figure 5 , such that there is a least squares best fit between the waves.
- the two circles 24, 26 indicate the two times, separated by 20 milliseconds or more at which the millivolt values of the upright and inverted waves are identical.
- the method to identify the end of the T wave comprises inversion of the reconfigured ECG without horizontal shifting and then merging of the inverted T wave with the reconfigured ECG signal.
- the exact timing of the T wave end can be defined as the first time of intersection at which the inverted version of the T wave intersects with the upright T wave of the reconfigured ECG signal, along the isoelectric line within the trough after the T wave peak shifted on the vertical axis to give the best least squares fit. This is the end of the T wave because it is the time at which both the upright T wave and the inverted version of itself return to the isoelectric line.
- the true isoelectric line is the mean or median value calculated from the superimposed values of the upright and inverted waves, within the trough 22 following the peak T wave, which provide the best least squares fit.
- the end of the T wave can therefore be considered to occur in the trough at the first time point that there is no difference in millivoltage signal along this theoretical isoelectric line.
- the method in this embodiment checks for another point at which the two signals are identical, at a certain time further the tract.
- the time difference between the two time points (along the theoretical isoelectric line) at which the signal amplitudes are compared is arbitrary and a time of 20 ms has been adopted, though this time difference could be varied according to the noise content in the segment of the ECG deemed to be the isoelectric line.
- the time point can be variable, at least 20 ms, but up to any time along the isoelectric baseline before the next succeeding P wave or U wave if present.
- the QT interval of an electrocardiogram in any given lead can be measured.
- the QT interval of the squared vector resultant derived from quasi-orthogonal or actual orthogonal XYZ leads the longest QT measurement in 3 dimensions can be made.
- Figure 7 is a diagram of an apparatus suitable for measuring the QT interval of an ECG by the method described above.
- a subject 30 has a set of ECG leads 35 (or at least one lead) attached for the purpose of recording an ECG signal.
- the ECG signals are passed to an electronic system 40 for processing and analysing.
- the system 40 comprises a conventional signal acquisition module 45 which is connected by the lead wires to electrodes on the subject's body.
- the system further comprises an analogue to digital converter 50 connected to data storage 55 and filter 60.
- the filter is connected to a pre-processing module 65 which is connected to an analysis module 70 which is connected to a module for QT measurement 75.
- the ECG leads and electrodes can be standard ECG electrodes and ECG monitoring sites, for example the standard 12 lead ECG sites, orthogonal or quasi-orthogonal ECG leads.
- the analogue to digital converter digitises the signal so that it may be processed to measure the QT interval.
- the filter 60 smoothes the ECG signal to remove noise, as discussed above.
- the pre-processing module performs the stages of duplicating and inverting the ECG signal, as discussed earlier.
- the analysis module carries out the steps of ascertaining the location of the different ECG features and QT measurement module performs the calculation of the QT interval as set forth above.
- the system 40 is connected to data storage means 55 which can store the data acquired from the signal.
- the stored data can be the raw digitised ECG data, or as final processed data, or in some intermediary format.
- the storage can be hardware suitably integrated with the system 40, such as RAM, a hard drive, floppy drive, or such carrier medium, or be extended across a suitable connected communications network.
- the display 57 can be integrated with the system or connected separately, as a stand alone monitor for viewing data, a computer system's monitor, or suitable display connected across a communications network.
- Analysis means 70 may further comprise means for further manipulating the ECG data.
- a method of determining the QT interval of an ECG wherein the Median millivoltage signal for each time from 10 ensembled ECG signals for each lead to reduce low frequency baseline noise is calculated.
- a Wavelet multiresolution analysis can be used to remove the noisy frequency content, present within the isoelectric baseline, from the whole ECG.
- the complete system can be packaged as a standalone ECG monitoring and processing system or as apart of a larger system, for example, a suitable equipped computer.
- the modules 45 to 75 may be implemented in hardware, software, or a combination of both.
Abstract
Description
- The present invention relates to methods and apparatus for measuring the QT interval on an electrocardiogram.
- An electrocardiogram (ECG) measures the instantaneous voltage potential difference of myocardial electrical activity in a number of lead vectors. "Leads" (or signals) are obtained from a subject using electrodes placed on their skin, placed on standardised locations around the body. Each electrode is connected to a signal processing apparatus via a respective wire (or "lead"). The term "lead" commonly refers to either a physical wire to an electrode or to an ECG signal itself. Commonly 12 different leads are used although it is also known to collapse all the information to within three orthogonal X, Y and Z leads or three quasi- orthogonal leads consisting of known ECG leads I, aVf and V2.
- The durations of certain types of waves within the ECG give very important information. One important interval is the QT interval which is approximately 400 ms in duration. Variation in the QT interval is a known indicator of cardiac dysfunction. For example, an average increase in the QT interval of as little as 5-10 ms during pharmaceutical compound safety testing indicates the potential for the drug to induce a fatal cardiac rhythm disturbance if the compound were to be more widely prescribed. Therefore accurate measurement of the QT interval in the standard 12 lead ECG is of paramount importance when assessing the safety of a new drug.
- Although the onset of the QT interval can be accurately measured by existing methods, there are difficulties measuring the accurate timing of the end of the "T wave" of the ECG due to the low frequency nature of the waveform, superaddition of an ECG "U wave", baseline drift of the signal and other superadded high frequency noise.
- Automated methods to measure the QT interval with good reproducibility in a given ECG vector lead exist. However, they are not considered any more accurate than expert manual measurements hence they can give reproducibly wrong measurements. Even if the current automated methods to measure the QT interval were accurate, errors in measuring the real longest QT interval for the median signal of a 12 lead ECG vector arise because, in addition to the three quasi-orthogonal leads I, aVf and V2 which contain the longest QT interval information, there are nine further lead vectors containing noise and U waves which would contaminate the information from the orthogonal leads, causing measurement error.
- A method according to the preambule of claim 1 is known from: "Agreement and Reproducibility of Automatic Versus Manual Measurement of QT Interval and QT Dispersion" Irina Savelieva et al, American Journal of Cardiology 1998; 81: 471-477.
- The present invention seeks to provide improved methods and apparatus for the measurement of the QT interval.
- According to an aspect of the present invention, there is provided a method of measuring the QT interval of an electrocardiogram (ECG) signal wherein the end of the T wave is identified from ECG data, the end of the T wave being determined by reference to the timing of at least one intersection at which an upright T wave of a first set of derived ECG signal data intersects an inverted T wave of a second set of derived ECG signal data, the two sets of ECG data being superimposed so as to maximise their fit over a segment after the positive T wave peak.
- The intersections can be detected visually on superimposed graphs. Preferably, however, they are detected automatically by numerical techniques. With this in mind, the skilled reader will appreciate that reference to "intersection" and "superimposition" should not be interpreted literally, provided that mathematically equivalent operations are applied.
- The fit of said data may be maximised by a least squares calculation.
- In one embodiment, the method comprises the steps of:
- (a) acquiring ECG signal data,
- (b) deriving a first set of reduced noise ECG signal data from the acquired ECG signal data,
- (c) inverting the first reduced noise set of ECG signal data to derive an inverted set of reduced noise ECG signal data;
- (d) identifying a portion of each set of ECG signal data corresponding to a segment after the T wave,
- (e) calculating an offset such as to fit the first set of data to the inverted set of data over said segment;
- (f) detecting at least one intersection between the first and inverted set of data by reference to said offset; and
- (g) determining the end of said QT intervals by reference to the timing of the detected intersection(s).
- The ECG signal data may acquired from, for example ECG electrodes and/or associated apparatus. Alternatively the ECG data may be acquired from a wide variety of storage or communications media, for example a computer memory or over a communications network.
- In step (g) the end of the QT interval must be determined by the first point intersection. The end of the T wave is defined in one embodiment at the first point of intersection in said segment, provided there is at least one other point of intersection after a predetermined interval. Said interval can be varied according to the noise content in the segment of the ECG deemed to be the isoelectric line
- The step (b) may comprise calculating the median signal for each time from an ensemble of ECG signals for each lead to reduce low frequency baseline noise.
- The method (b) may further comprise smoothing the median ensembled ECG signal with moving median filter to reduce high frequency noise.
- The method (b) may also further comprise filtering the median smoothed, median ensembled ECG using a wavelet frequency thresholding technique which substracts the magnitudes of any non-zero frequency components (noise) within the isoelectric baseline segement from the rest of the ECG thus further de-noising it.
- The step (b) may further include vertically shifting the smoothed median ensembled ECG signal so that the minimum value after peak of T is zero.
- The step (b) may further comprise the steps of detecting and correcting baseline drift in the first set of ECG data. The detecting step may for example include the testing for the presence of a single crossing of one isoelectric line (for example zero). The ensembled ECG can be rotated about a zero point or otherwise transformed to reconfigure the set of ECG data to have multiple crossings of said line (for example multiple zero minima).
- The step (b) may further include applying a non-linear function such as squaring the amplitudes of the signal for all time instants, in order to accentuate features of interest and ensure positive deflections of the T wave.
- The step (b) may further include summing the squared amplitudes of ensembled orthogonal leads over all time instants to give a squared resultant vector ensembled ECG.
- The method may further include finding the beginning of the QT interval by an established method, for example from the median of ensembled ECG signals from all 12 leads.
- The method may include calculating the QT interval by subtracting the beginning of QT from the calculated end of the T wave.
- In one embodiment of the invention QT interval is measured for the squared vector resultant data derived from quasi-orthogonal or actual orthogonal XYZ leads, and the longest of QT measurements made in 3 dimensions is made. This has the benefit of avoiding any apparent change in the QT interval of a fixed direction vector which may be caused by a dynamic physiological change in direction of the resultant vector in three dimensions but without causing any change in length of the resultant vector QT interval.
- The ECG signal data may be acquired in step (a) from the set of standard ECG leads including I, aVf and V2.
- In another aspect of the invention, there is provided a record carrier wherein there are recorded program instructions for causing a programmable processor to perform the steps of the method as set forth above, or to implement an apparatus having the features set forth.
- The present invention, further provides an apparatus for measuring the QT interval of an electrocardiogram (ECG) signal wherein there is provided means for identifying the end of then T wave from ECG data, the end of the T wave defined as the first time of intersection at which an upright T wave of a first set of derived ECG signal data intersects an inverted T wave of a second set of derived ECG signal data, the two sets of data being superimposed so as to maximise their fit over a segment after the positive T wave peak.
- Embodiments of the invention will now be described, by way of example only, by reference to the accompanying drawings, in which:
-
Figure 1 represents the trace of a typical ECG signal; -
Figure 2 shows an ECG signal where low frequency noise generates a drifting baseline; -
Figure 3 shows the ECG signal ofFigure 2 simultaneously displayed in the XYZ orthogonal vectors; -
Figure 4 shows summed squared voltages in the X, Y and Z orthogonal leads over the time period of the signal which gives the squared resultant vector of the ECG signal in three dimensions; -
Figure 5 shows an upright squared ECG signal and a superimposed inverted squared ECG signal; -
Figure 6 is a magnified view of the superimposed part of the T wave downslopes and troughs about the isoelectric baselines from the upright and inverted ECGs ofFigure 5 ; and -
Figure 7 is a diagram of an apparatus suitable for measuring automatically the QT interval of an ECG, in accordance with an embodiment of the present invention. -
Figure 1 represents schematically the trace of a typical ECG signal, showing a single lead vector ECG signal. 1 is the P wave, 2 is the onset deflection of the Q wave (the start of the QT interval), 3 is the peak of the T wave, 4 is the approximate end of the QT interval, 5 is the QT interval duration to be measured, and 6 is the U wave. 8 is the isoelectric baseline of the ECG signal. - The X-axis represents time in milliseconds and the Y-axis represents millivolts above and below the isoelectric line baseline. The isoelectric line baseline is the voltage at which there is silent electrical activity within the myocardium, this being theoretically zero millivolts in the absence of noise.
- The start of the QT interval is easily timed at 2 when the wave has high frequency content with a negative or positive deflection from a zero baseline value. The end of the QT interval is in theory the time at which the T wave returns to the isoelectric baseline. The isoelectric baseline is a theoretical line of constant voltage which in the absence of any noise is theoretically zero millivolts. To measure the
QT interval 5, it is only necessary to subtract the one from the other. - As explained in the introduction, however, identifying the end of the T wave in real signals is difficult and somewhat subjective using known techniques.
-
Figures 2 to 6 will now be described which illustrate the novel steps proposed herein to derive the QT interval in a reliable manner. After describing these steps, a practical ECG apparatus incorporating automatic QT measurement using these techniques will be described, with reference toFigure 7 . - In addition to median ensembling and median smoothing either a wavelet thresholding method can be applied which will remove the frequency components identified in the isoelectric baseline (noise) from the rest of the ECG signal (explained below).
-
Figure 2 shows an ECG signal with low frequency noise generating a drifting baseline. Thepoint 20 indicates the time point at which the signal has a zero millivolt value. The arrow shows the direction of rotation to required re-align the signal as described below. -
Figures 3 and4 refer to a particular case of orthogonal XYZ leads but the noise minimisation method set forth below can be applied to any set of ECG leads suitable for recording an ECG signal, for example, the standard twelve lead system. -
Figure 3 shows the ECG signal ofFigure 2 simultaneously displayed in the XYZ orthogonal vectors. P is the P wave, R is the peak R wave, T is the peak T wave. -
Figure 4 shows summed squared voltages in the X, Y and Z orthogonal leads over the time period of the signal which gives the squared resultant vector of the ECG signal in three dimensions. P is the P wave; R is the peak R wave and T the peak T wave. Thetrough 22 is marked as that part of the downslope of the T wave which merges with the isoelectric line, that is, the time segment encompassing the end of the T wave, and prior to onset of the U wave. - Referring to
Figures 2 to 4 , in the method described herein, the low frequency baseline noise is firstly reduced by determining the median of the millivoltage values for multiple ensembled ECG signals from the given required vector leads. The median millivoltage signal for each time from, for example, ten ensembled ECG signals for each lead can be calculated to reduce low frequency baseline noise. - Next, the resulting median of the ensembled ECG signal is further smoothed by a moving median filter which has the advantage of reducing the high frequency noise without causing phase distortion.
- Next a multiresolution Wavelet is used to obtain the magnitudes of noise frequency components which contaminates isoelectric baseline (which has zero frequency in the denoised state). In the wavelet method, for each frequency band, the maximum coefficient amplitude seen at the time of the isoelectric baseline within each frequency band is subtracted from the rest of the coefficients within that frequency band. The ECG waveform is then reconstituted from the addition of the detail coefficients for each frequency band.
- The resulting median ECG signal is then shifted vertically so that the minimum values/value of the segment of the ECG following the peak T wave are/is zero millivolts. If it is observed that there is only a single time at which the signal value is zero, we judge that there is likely to be baseline drift. To correct this drift, the ECG is "rotated" in both clockwise and anticlockwise directions about the "zero value" axis until the ECG signal within
trough 22 intersects the zero baseline at a second or multiple time points. The smallest angle of rotation necessary (which may be clockwise or anti-clockwise) will be accepted as that rotation necessary to correct for baseline drift, and this rotational correction is applied to the median ECG signal to derive the reconfigured ECG for each lead. Strict rotation is not necessary. Another geometric transformation such as a shear transformation may be equally appropriate to achieve the desired result. - The amplitude of the resulting median reconfigured ECG signal is then converted into microvolts and squared, which will have the effect of forcing the microvolt values below 1 towards zero whilst increasing the microvolt values above 1, thus effectively enhancing the high frequency features of the actual T wave signal end and reducing the low frequency features of the actual T wave signal end, thus making identification of the T wave end easier. The selection of a microvolt scale for this purpose is merely a matter of convenience, and a different scale factor could in principle be applied to keep the squared values within any desired range.
- The above processing to minimise noise results in a squared reconfigured ECG signal of the type shown in
Figure 4 prepared for the QT interval measurement. Baseline drift has also been corrected. - The method of measuring the QT interval can be applied to a reconfigured ECG signal in any vector lead. The onset of the Q wave can be identified readily in a known manner.
- The method should be applied to a squared signal because it allows a clearer demarcation between isoelectric baseline and downslope of T wave. It also prepares the measurement for the squared Resultant vector and it keeps the T wave all positive. The method could theoretically be applied to cases of biphasic T waves which occur in certain pathological conditions.
-
Figure 5 shows an upright squared ECG signal and a superimposed inverted squared ECG signal. They are superimposed with a vertical offset chosen so that the troughs of the isoelectric baseline following the peak T of both the upright and inverted waves have the best least squares fit. -
Figure 6 shows a magnified view of the superimposed part of the T wave downslopes and troughs from the upright and inverted ECGs ofFigure 5 , such that there is a least squares best fit between the waves. The twocircles - Thus, the method to identify the end of the T wave comprises inversion of the reconfigured ECG without horizontal shifting and then merging of the inverted T wave with the reconfigured ECG signal. Referring back to
Figure 5 , the exact timing of the T wave end can be defined as the first time of intersection at which the inverted version of the T wave intersects with the upright T wave of the reconfigured ECG signal, along the isoelectric line within the trough after the T wave peak shifted on the vertical axis to give the best least squares fit. This is the end of the T wave because it is the time at which both the upright T wave and the inverted version of itself return to the isoelectric line. - Referring now to
Figure 6 , it can be shown that the true isoelectric line is the mean or median value calculated from the superimposed values of the upright and inverted waves, within thetrough 22 following the peak T wave, which provide the best least squares fit. The end of the T wave can therefore be considered to occur in the trough at the first time point that there is no difference in millivoltage signal along this theoretical isoelectric line. For robustness, the method in this embodiment, checks for another point at which the two signals are identical, at a certain time further the tract. The time difference between the two time points (along the theoretical isoelectric line) at which the signal amplitudes are compared is arbitrary and a time of 20 ms has been adopted, though this time difference could be varied according to the noise content in the segment of the ECG deemed to be the isoelectric line. The time point can be variable, at least 20 ms, but up to any time along the isoelectric baseline before the next succeeding P wave or U wave if present. - In an embodiment of the method, the QT interval of an electrocardiogram in any given lead can be measured. By measuring the QT interval of the squared vector resultant derived from quasi-orthogonal or actual orthogonal XYZ leads, the longest QT measurement in 3 dimensions can be made.
- This avoids any apparent change in the QT interval of a fixed direction vector which may be caused by a dynamic physiological change in direction of the resultant vector in three dimensions, but without causing any change in length of the resultant vector QT interval.
-
Figure 7 is a diagram of an apparatus suitable for measuring the QT interval of an ECG by the method described above. - A subject 30 has a set of ECG leads 35 (or at least one lead) attached for the purpose of recording an ECG signal. The ECG signals are passed to an
electronic system 40 for processing and analysing. Thesystem 40 comprises a conventionalsignal acquisition module 45 which is connected by the lead wires to electrodes on the subject's body. The system further comprises an analogue todigital converter 50 connected todata storage 55 andfilter 60. The filter is connected to apre-processing module 65 which is connected to ananalysis module 70 which is connected to a module forQT measurement 75. - The ECG leads and electrodes can be standard ECG electrodes and ECG monitoring sites, for example the standard 12 lead ECG sites, orthogonal or quasi-orthogonal ECG leads. The analogue to digital converter digitises the signal so that it may be processed to measure the QT interval. The
filter 60 smoothes the ECG signal to remove noise, as discussed above. The pre-processing module performs the stages of duplicating and inverting the ECG signal, as discussed earlier. The analysis module carries out the steps of ascertaining the location of the different ECG features and QT measurement module performs the calculation of the QT interval as set forth above. - The
system 40 is connected to data storage means 55 which can store the data acquired from the signal. The stored data can be the raw digitised ECG data, or as final processed data, or in some intermediary format. The storage can be hardware suitably integrated with thesystem 40, such as RAM, a hard drive, floppy drive, or such carrier medium, or be extended across a suitable connected communications network. - Similarly, the
display 57 can be integrated with the system or connected separately, as a stand alone monitor for viewing data, a computer system's monitor, or suitable display connected across a communications network. - Analysis means 70 may further comprise means for further manipulating the ECG data. A method of determining the QT interval of an ECG wherein the Median millivoltage signal for each time from 10 ensembled ECG signals for each lead to reduce low frequency baseline noise is calculated. As previously described a Wavelet multiresolution analysis can be used to remove the noisy frequency content, present within the isoelectric baseline, from the whole ECG.
- The complete system can be packaged as a standalone ECG monitoring and processing system or as apart of a larger system, for example, a suitable equipped computer. The
modules 45 to 75 may be implemented in hardware, software, or a combination of both.
Claims (39)
- A method of measuring the QT interval of an electrocardiogram (ECG) signal wherein the end of the T wave is identified from ECG data characterised by the end of the T wave being determined by reference to the timing of at least one intersection at which an upright T wave of a first set of derived ECG signal data intersects an inverted T wave of a second set of derived ECG signal data, the two sets of ECG data being superimposed so as to maximise their fit over a segment of the ECG signal after the positive T wave peak.
- A method as claimed in claim 1 wherein the fit of said data is maximised by a least squares calculation.
- A method as claimed in claim 1 or 2 wherein the method comprises the steps of:(a) acquiring ECG signal data;(b) deriving a first set of reduced noise ECG signal data from the acquired ECG signal data;(c) inverting the first reduced noise set of ECG signal data to derive an inverted set of reduced noise ECG signal data;(d) identifying a portion of each set of ECG signal data corresponding to a segment after the T wave;(e) calculating an offset such as to fit the first set of data to the inverted set of data over said segment;(f) detecting at least one intersection between the first and inverted set of data by reference to said offset; and(g) determining the end of said QT intervals by reference to the timing of the detected intersection(s).
- A method as claimed in claims 3 wherein in step (g) the end of the QT interval is determined by the first point intersection.
- A method as claimed in any previous claim wherein the end of the T wave is defined at the first point of intersection in said segment, provided there is at least one other point of intersection after a predetermined interval.
- A method as claimed in any previous claim wherein said interval can be varied according to the noise content in the segment of the ECG deemed to be the isoelectric line.
- A method as claimed in any of claims 3 to 6 wherein the step (b) comprises calculating the median signal for each time from an ensemble of ECG signals for each lead to reduce low frequency baseline noise.
- A method as claimed in claim 7 wherein the step (b) further comprises smoothing the median of the ensemble of ECG signals with moving median filter to reduce high frequency noise.
- A method as claimed in claim 8 wherein the step (b) further comprises filtering the median smoothed, median of the ensemble of ECG signals using a wavelet frequency thresholding technique which substracts the magnitudes of any non-zero frequency components within the isoelectric baseline segement from the rest of the ECG thus further de-noising it.
- A method as claimed in claims 8 or 9 wherein the step (b) further includes vertically shifting the smoothed median of the ensemble of ECG signals so that the minimum value after peak of T is zero.
- A method as claimed in any of claims 3 to 10 wherein the step (b) further comprises the steps of detecting and correcting baseline drift in the first set of ECG data.
- A method as claimed in any preceding claim wherein the detecting step includes the testing for the presence of a single crossing of one isoelectric line.
- A method as claimed in any preceding claim wherein the ensemble of ECG signals is rotated about a zero point or otherwise transformed to reconfigure the set of ECG data to have multiple crossings of said line.
- A method as claimed in any of claims 3 to 13 wherein the step (b) further includes applying a non-linear function such as squaring the amplitudes of the signal for all time instants, in order to accentuate features of interest and ensure positive deflections of the T wave.
- A method as claimed in claim 14 wherein the step (b) further includes summing the squared amplitudes of an ensemble of orthogonal leads over all time instants to give a squared resultant vector of the ensemble of ECG signals.
- A method as claimed in any preceding claim wherein the method further includes finding the beginning of the QT interval from the median of an ensemble of ECG signals from all 12 leads.
- A method as claimed in any preceding claim wherein the method includes calculating the QT interval by subtracting the beginning of QT from the calculated end of the T wave.
- A method as claimed in any preceding claim wherein the QT interval is measured for the squared vector resultant data derived from quasi-orthogonal or actual orthogonal XYZ leads, and the longest of QT measurements made in 3 dimensions is made.
- A method as claimed in any preceding claim wherein the ECG signal data may be acquired in step (a) from the set of standard ECG leads including I, aVf and V2.
- An apparatus for measuring the QT interval of an electrocardiogram (ECG) signal wherein there is provided means for identifying the end of the T wave from ECG data, characterised by the end of the T wave being determined as the first time of intersection at which an upright T wave of a first set of derived ECG signal data intersects an inverted T wave of a second set of derived ECG signal data, the two sets of data being superimposed so as to maximise their fit over a segment of the ECG signal after the positive T wave peak.
- An apparatus as claimed in claim 20 wherein the fit of said data is maximised by a least squares calculation.
- An apparatus as claimed in claim 20 or 21 wherein the apparatus comprises:means for acquiring ECG signal data;means for deriving a first set of reduced noise ECG signal data from the acquired ECG signal data;means for inverting the first reduced noise set of ECG signal data to derive an inverted set of reduced noise ECG signal data;means for identifying a portion of each set of ECG signal data corresponding to a segment after the T wave;means for calculating an offset such as to fit the first set of data to the inverted set of data over said segment;means for detecting at least one intersection between the first and inverted set of data by reference to said offset; andmeans for determining the end of said QT intervals by reference to the timing of the detected intersection(s).
- An apparatus as claimed in claim 22 wherein in the means for determining the end of said QT interval, the QT interval is determined by the first point of intersection.
- An apparatus as claimed in claims 22 or 23 wherein the end of the T wave is defined at the first point of intersection in said segment, provided there is at least one other point of intersection after a predetermined interval.
- An apparatus as claimed in any of claims 22 to 24 wherein said interval can be STET varied according to the noise content in the segment of the ECG deemed to be the isoelectric line.
- An apparatus as claimed in any of claims 22 to 24 wherein means for deriving a first set of reduced noise ECG signal data comprises means for calculating the median signal for each time from an ensemble of ECG signals for each lead to reduce low frequency baseline noise.
- An apparatus as claimed in claim 26 wherein the means for deriving a first set of reduced noise ECG signal data further comprises means for smoothing the median of the ensemble of ECG signals with moving median filter to reduce high frequency noise.
- An apparatus as claimed in claim 27 wherein the means for deriving a first set of reduced noise ECG signal data further comprises means for filtering the median smoothed, median of the ensemble of ECG signals using a wavelet frequency thresholding technique which substracts the magnitudes of any non-zero frequency components within the isoelectric baseline segement from the rest of the ECG thus further de-noising it.
- An apparatus as claimed in claim 27 or 28 wherein the means for deriving a first set of reduced noise ECG signal data further includes means for vertically shifting the smoothed median of the ensemble of ECG signals so that the minimum value after peak of T is zero.
- An apparatus as claimed in any of claims 22 to 29 wherein the means for deriving a first set of reduced noise ECG signal data further comprises means for detecting and correcting baseline drift in the first set of ECG data.
- An apparatus as claimed in any of claims 20 to 30 wherein detection includes means for the testing for the presence of a single crossing of one isoelectric line.
- An apparatus as claimed in any of claims 20 to 31 wherein there is provided means for rotating the ensemble of ECG signals about a zero point or otherwise transformed to reconfigure the set of ECG data to have multiple crossings of said line.
- An apparatus as claimed in any of claims 22 to 32 wherein the means for deriving a first set of reduced noise ECG signal data further includes means for applying a non-linear function such as squaring the amplitudes of the signal for all time instants, in order to accentuate features of interest and ensure positive deflections of the T wave.
- An apparatus as claimed in claim 33 wherein the means for deriving a first set of reduced noise ECG signal data further includes means for summing the squared amplitudes of an ensemble of orthogonal leads over all time instants to give a squared resultant vector of the ensemble of ECG signals.
- An apparatus as claimed in any of claims 20 to 34 wherein the apparatus further includes means for finding the beginning of the QT interval from the median of an ensemble of ECG signals from all 12 leads.
- An apparatus as claimed in any of claims 20 to 35 wherein the apparatus includes means for calculating the QT interval by subtracting the beginning of QT from the calculated end of the T wave.
- An apparatus as claimed in any of claims 20 to 36 wherein the QT interval is measured for the squared vector resultant data derived from quasi-orthogonal or actual orthogonal XYZ leads, and the longest of QT measurements made in 3 dimensions is made.
- An apparatus as claimed in any of claims 20 to 35 wherein the ECG signal data is acquired from the set of standard ECG leads including I, aVf and V2.
- A record carried wherein are recorded program instructions for causing a programmable processor to perform the steps of the method as claimed in claims 1 to 19, or to implement an apparatus having the features claimed in any of claims 20 to 38.
Applications Claiming Priority (1)
| Application Number | Priority Date | Filing Date | Title |
|---|---|---|---|
| PCT/GB2003/004436 WO2005044102A1 (en) | 2003-10-10 | 2003-10-10 | Qt-interval measurement in the electrocardiogram |
Publications (2)
| Publication Number | Publication Date |
|---|---|
| EP1677672A1 EP1677672A1 (en) | 2006-07-12 |
| EP1677672B1 true EP1677672B1 (en) | 2008-11-26 |
Family
ID=34566422
Family Applications (1)
| Application Number | Title | Priority Date | Filing Date |
|---|---|---|---|
| EP03751058A Expired - Lifetime EP1677672B1 (en) | 2003-10-10 | 2003-10-10 | Qt-interval measurement in the electrocardiogram |
Country Status (7)
| Country | Link |
|---|---|
| US (1) | US7627369B2 (en) |
| EP (1) | EP1677672B1 (en) |
| AT (1) | ATE415124T1 (en) |
| AU (1) | AU2003269280A1 (en) |
| DE (1) | DE60324975D1 (en) |
| ES (1) | ES2318154T3 (en) |
| WO (1) | WO2005044102A1 (en) |
Families Citing this family (29)
| Publication number | Priority date | Publication date | Assignee | Title |
|---|---|---|---|---|
| US20090326351A1 (en) * | 2008-06-30 | 2009-12-31 | Nellcor Puritan Bennett Ireland | Signal Processing Mirroring Technique |
| TWI474275B (en) * | 2009-06-23 | 2015-02-21 | Univ Yuan Ze | 12-lead ecg measurement and report editing system |
| US8478389B1 (en) | 2010-04-23 | 2013-07-02 | VivaQuant, LLC | System for processing physiological data |
| US9492096B2 (en) | 2009-11-03 | 2016-11-15 | Vivaquant Llc | ECG sensing apparatuses, systems and methods |
| US8632465B1 (en) | 2009-11-03 | 2014-01-21 | Vivaquant Llc | Physiological signal denoising |
| US9706956B2 (en) | 2009-11-03 | 2017-07-18 | Vivaquant Llc | Method and apparatus for assessing cardiac and/or mental health |
| US9408549B2 (en) | 2009-11-03 | 2016-08-09 | Vivaquant Llc | Detecting fiducial points in physiological signals |
| US8433395B1 (en) | 2009-11-03 | 2013-04-30 | Vivaquant Llc | Extraction of cardiac signal data |
| US9339202B2 (en) | 2009-11-03 | 2016-05-17 | Vivaquant Llc | System for processing physiological data |
| US9414786B1 (en) | 2009-11-03 | 2016-08-16 | Vivaquant Llc | ECG sensing with noise filtering |
| US9008762B2 (en) | 2009-11-03 | 2015-04-14 | Vivaquant Llc | Method and apparatus for identifying cardiac risk |
| US8688202B2 (en) | 2009-11-03 | 2014-04-01 | Vivaquant Llc | Method and apparatus for identifying cardiac risk |
| US8543195B1 (en) | 2009-11-03 | 2013-09-24 | VivaQuant, LLC | ECG sensing with noise filtering |
| US9314181B2 (en) | 2009-11-03 | 2016-04-19 | Vivaquant Llc | Method and apparatus for detection of heartbeat characteristics |
| US9072438B2 (en) | 2009-11-03 | 2015-07-07 | Vivaquant Llc | Method and apparatus for identifying cardiac risk |
| US9414758B1 (en) | 2011-01-12 | 2016-08-16 | Vivaquant Llc | Apparatus, system and methods for sensing and processing physiological signals |
| UA100450C2 (en) | 2011-05-04 | 2012-12-25 | Владимир Николаевич Сосницкий | METHOD OF MEASUREMENT OF QT, QRS, ST-T-CARDIOCYCLE INTERVALS AND DEVICES FOR ITS PERFORMANCE |
| WO2013075270A1 (en) | 2011-11-25 | 2013-05-30 | Yang Chang-Ming | Object, method, and system for detecting heartbeat or whether or not electrodes are in proper contact |
| US8862216B2 (en) * | 2012-03-15 | 2014-10-14 | Siemens Medical Solutions Usa, Inc. | Adaptive cardiac data patient filter system |
| KR101517988B1 (en) | 2013-07-24 | 2015-05-06 | 광운대학교 산학협력단 | Electrocardiography detection method and apparatus |
| US9704266B2 (en) | 2014-12-11 | 2017-07-11 | Rdi, Llc | Non-contacting monitor for bridges and civil structures |
| US10062411B2 (en) | 2014-12-11 | 2018-08-28 | Jeffrey R. Hay | Apparatus and method for visualizing periodic motions in mechanical components |
| US11103145B1 (en) | 2017-06-14 | 2021-08-31 | Vivaquant Llc | Physiological signal monitoring and apparatus therefor |
| GB2590556B (en) * | 2018-05-08 | 2022-09-14 | Alivecor Inc | Systems and methods of QT interval analysis |
| US11423551B1 (en) | 2018-10-17 | 2022-08-23 | Rdi Technologies, Inc. | Enhanced presentation methods for visualizing motion of physical structures and machinery |
| US11931142B1 (en) | 2019-03-19 | 2024-03-19 | VIVAQUANT, Inc | Apneic/hypopneic assessment via physiological signals |
| US11373317B1 (en) | 2020-01-24 | 2022-06-28 | Rdi Technologies, Inc. | Measuring the speed of rotation or reciprocation of a mechanical component using one or more cameras |
| US11282213B1 (en) | 2020-06-24 | 2022-03-22 | Rdi Technologies, Inc. | Enhanced analysis techniques using composite frequency spectrum data |
| US11322182B1 (en) | 2020-09-28 | 2022-05-03 | Rdi Technologies, Inc. | Enhanced visualization techniques using reconstructed time waveforms |
Family Cites Families (9)
| Publication number | Priority date | Publication date | Assignee | Title |
|---|---|---|---|---|
| US5437285A (en) | 1991-02-20 | 1995-08-01 | Georgetown University | Method and apparatus for prediction of sudden cardiac death by simultaneous assessment of autonomic function and cardiac electrical stability |
| US5419338A (en) * | 1994-02-22 | 1995-05-30 | City Of Hope | Autonomic nervous system testing by bi-variate spectral analysis of heart period and QT interval variability |
| US5560368A (en) | 1994-11-15 | 1996-10-01 | Berger; Ronald D. | Methodology for automated QT variability measurement |
| US5792065A (en) * | 1997-03-18 | 1998-08-11 | Marquette Medical Systems, Inc. | Method and apparatus for determining T-wave marker points during QT dispersion analysis |
| US6324423B1 (en) | 1998-04-17 | 2001-11-27 | Timothy Callahan | Quantitative method and apparatus for measuring QT intervals from ambulatory electrocardiographic recordings |
| US6370423B1 (en) * | 1998-10-05 | 2002-04-09 | Juan R. Guerrero | Method for analysis of biological voltage signals |
| US6615075B2 (en) * | 2000-03-15 | 2003-09-02 | The Regents Of The University Of California | QRST subtraction using an adaptive template for analysis of TU wave obscured atrial activity |
| US6361503B1 (en) | 2000-06-26 | 2002-03-26 | Mediwave Star Technology, Inc. | Method and system for evaluating cardiac ischemia |
| US6836682B2 (en) | 2001-11-16 | 2004-12-28 | Medtronic, Inc. | Rate responsive pacing system with QT sensor based on intrinsic QT data |
-
2003
- 2003-10-10 WO PCT/GB2003/004436 patent/WO2005044102A1/en active Application Filing
- 2003-10-10 EP EP03751058A patent/EP1677672B1/en not_active Expired - Lifetime
- 2003-10-10 US US10/575,340 patent/US7627369B2/en not_active Expired - Fee Related
- 2003-10-10 ES ES03751058T patent/ES2318154T3/en not_active Expired - Lifetime
- 2003-10-10 AU AU2003269280A patent/AU2003269280A1/en not_active Abandoned
- 2003-10-10 AT AT03751058T patent/ATE415124T1/en not_active IP Right Cessation
- 2003-10-10 DE DE60324975T patent/DE60324975D1/en not_active Expired - Lifetime
Also Published As
| Publication number | Publication date |
|---|---|
| ATE415124T1 (en) | 2008-12-15 |
| AU2003269280A1 (en) | 2005-05-26 |
| ES2318154T3 (en) | 2009-05-01 |
| EP1677672A1 (en) | 2006-07-12 |
| US20080262366A1 (en) | 2008-10-23 |
| US7627369B2 (en) | 2009-12-01 |
| WO2005044102A8 (en) | 2005-07-14 |
| WO2005044102A1 (en) | 2005-05-19 |
| DE60324975D1 (en) | 2009-01-08 |
Similar Documents
| Publication | Publication Date | Title |
|---|---|---|
| EP1677672B1 (en) | Qt-interval measurement in the electrocardiogram | |
| CA2794794C (en) | Accurate time annotation of intracardiac ecg signals | |
| Xue et al. | Algorithms for computerized QT analysis | |
| EP0760225B1 (en) | Method and apparatus for correcting for non-physiological variations in ECG signals | |
| US5913308A (en) | Apparatus and method for determining respiratory effort from muscle tremor information in ECG signals | |
| US6491629B1 (en) | Method for determining at least one diagnostic piece of information from signal patterns of medical sensor systems | |
| JP4718033B2 (en) | ECG information processing apparatus and ECG information processing method | |
| Harner | Clinical application of computed EEG topography | |
| US4736295A (en) | Method and apparatus for mathematical characterization of the electrocardiogram | |
| Wartzek et al. | Modeling of motion artifacts in contactless heart rate measurements | |
| Zhou et al. | A multidifferentiator-based approach to the reliable determination of T-wave offset in electrocardiograms | |
| US20110184296A1 (en) | Method and system for quantitative assessment of cardiac electrical events | |
| JP2001504722A (en) | Statistical mapping of the physiological state of the mammalian heart | |
| US8731647B2 (en) | Method and system for analyzing the cardiac activity of a patient and uses thereof | |
| AU2014250610B2 (en) | Accurate time annotation of intracardiac ecg signals | |
| Comani et al. | Influence of gestational age on the effectiveness of spatial and temporal methods for the reconstruction of the fetal magnetocardiogram | |
| Domínguez et al. | Features Extraction from ECG Signals Using Unbiased FIR Filtering | |
| Bhargava et al. | New method for measuring QRS duration using high-frequency electrocardiography | |
| JPS59189831A (en) | Diagnostic method and apparatus by spectrum analysis of cardiographic waves | |
| JPH03201824A (en) | Method for collecting oscillation in signal waveform | |
| JPS5825451B2 (en) | Body surface potential distribution measurement and display device | |
| JPH03202048A (en) | Searching method for peak of signal waveform | |
| JPH02102640A (en) | Electrocardiogram noise detecting method in irregular pulse analyzing device |
Legal Events
| Date | Code | Title | Description |
|---|---|---|---|
| PUAI | Public reference made under article 153(3) epc to a published international application that has entered the european phase |
Free format text: ORIGINAL CODE: 0009012 |
|
| 17P | Request for examination filed |
Effective date: 20060505 |
|
| AK | Designated contracting states |
Kind code of ref document: A1 Designated state(s): AT BE BG CH CY CZ DE DK EE ES FI FR GB GR HU IE IT LI LU MC NL PT RO SE SI SK TR |
|
| DAX | Request for extension of the european patent (deleted) | ||
| RAP1 | Party data changed (applicant data changed or rights of an application transferred) |
Owner name: PSI HEARTSIGNALS (GLOBAL) LIMITED |
|
| GRAP | Despatch of communication of intention to grant a patent |
Free format text: ORIGINAL CODE: EPIDOSNIGR1 |
|
| GRAS | Grant fee paid |
Free format text: ORIGINAL CODE: EPIDOSNIGR3 |
|
| RBV | Designated contracting states (corrected) |
Designated state(s): AT BE BG CH CY CZ DE DK EE ES FI FR GR HU IE IT LI LU MC NL PT RO SE SI SK TR |
|
| GRAA | (expected) grant |
Free format text: ORIGINAL CODE: 0009210 |
|
| AK | Designated contracting states |
Kind code of ref document: B1 Designated state(s): AT BE BG CH CY CZ DE DK EE ES FI FR GR HU IE IT LI LU MC NL PT RO SE SI SK TR |
|
| REG | Reference to a national code |
Ref country code: CH Ref legal event code: EP |
|
| REG | Reference to a national code |
Ref country code: IE Ref legal event code: FG4D |
|
| REF | Corresponds to: |
Ref document number: 60324975 Country of ref document: DE Date of ref document: 20090108 Kind code of ref document: P |
|
| PG25 | Lapsed in a contracting state [announced via postgrant information from national office to epo] |
Ref country code: AT Free format text: LAPSE BECAUSE OF FAILURE TO SUBMIT A TRANSLATION OF THE DESCRIPTION OR TO PAY THE FEE WITHIN THE PRESCRIBED TIME-LIMIT Effective date: 20081126 |
|
| REG | Reference to a national code |
Ref country code: ES Ref legal event code: FG2A Ref document number: 2318154 Country of ref document: ES Kind code of ref document: T3 |
|
| NLV1 | Nl: lapsed or annulled due to failure to fulfill the requirements of art. 29p and 29m of the patents act | ||
| PG25 | Lapsed in a contracting state [announced via postgrant information from national office to epo] |
Ref country code: FI Free format text: LAPSE BECAUSE OF FAILURE TO SUBMIT A TRANSLATION OF THE DESCRIPTION OR TO PAY THE FEE WITHIN THE PRESCRIBED TIME-LIMIT Effective date: 20081126 Ref country code: SI Free format text: LAPSE BECAUSE OF FAILURE TO SUBMIT A TRANSLATION OF THE DESCRIPTION OR TO PAY THE FEE WITHIN THE PRESCRIBED TIME-LIMIT Effective date: 20081126 Ref country code: NL Free format text: LAPSE BECAUSE OF FAILURE TO SUBMIT A TRANSLATION OF THE DESCRIPTION OR TO PAY THE FEE WITHIN THE PRESCRIBED TIME-LIMIT Effective date: 20081126 |
|
| PG25 | Lapsed in a contracting state [announced via postgrant information from national office to epo] |
Ref country code: EE Free format text: LAPSE BECAUSE OF FAILURE TO SUBMIT A TRANSLATION OF THE DESCRIPTION OR TO PAY THE FEE WITHIN THE PRESCRIBED TIME-LIMIT Effective date: 20081126 Ref country code: BE Free format text: LAPSE BECAUSE OF FAILURE TO SUBMIT A TRANSLATION OF THE DESCRIPTION OR TO PAY THE FEE WITHIN THE PRESCRIBED TIME-LIMIT Effective date: 20081126 Ref country code: DK Free format text: LAPSE BECAUSE OF FAILURE TO SUBMIT A TRANSLATION OF THE DESCRIPTION OR TO PAY THE FEE WITHIN THE PRESCRIBED TIME-LIMIT Effective date: 20081126 Ref country code: RO Free format text: LAPSE BECAUSE OF FAILURE TO SUBMIT A TRANSLATION OF THE DESCRIPTION OR TO PAY THE FEE WITHIN THE PRESCRIBED TIME-LIMIT Effective date: 20081126 Ref country code: BG Free format text: LAPSE BECAUSE OF FAILURE TO SUBMIT A TRANSLATION OF THE DESCRIPTION OR TO PAY THE FEE WITHIN THE PRESCRIBED TIME-LIMIT Effective date: 20090226 |
|
| PG25 | Lapsed in a contracting state [announced via postgrant information from national office to epo] |
Ref country code: SE Free format text: LAPSE BECAUSE OF FAILURE TO SUBMIT A TRANSLATION OF THE DESCRIPTION OR TO PAY THE FEE WITHIN THE PRESCRIBED TIME-LIMIT Effective date: 20090226 Ref country code: CZ Free format text: LAPSE BECAUSE OF FAILURE TO SUBMIT A TRANSLATION OF THE DESCRIPTION OR TO PAY THE FEE WITHIN THE PRESCRIBED TIME-LIMIT Effective date: 20081126 Ref country code: PT Free format text: LAPSE BECAUSE OF FAILURE TO SUBMIT A TRANSLATION OF THE DESCRIPTION OR TO PAY THE FEE WITHIN THE PRESCRIBED TIME-LIMIT Effective date: 20090427 |
|
| PG25 | Lapsed in a contracting state [announced via postgrant information from national office to epo] |
Ref country code: SK Free format text: LAPSE BECAUSE OF FAILURE TO SUBMIT A TRANSLATION OF THE DESCRIPTION OR TO PAY THE FEE WITHIN THE PRESCRIBED TIME-LIMIT Effective date: 20081126 |
|
| PLBE | No opposition filed within time limit |
Free format text: ORIGINAL CODE: 0009261 |
|
| STAA | Information on the status of an ep patent application or granted ep patent |
Free format text: STATUS: NO OPPOSITION FILED WITHIN TIME LIMIT |
|
| 26N | No opposition filed |
Effective date: 20090827 |
|
| PG25 | Lapsed in a contracting state [announced via postgrant information from national office to epo] |
Ref country code: MC Free format text: LAPSE BECAUSE OF NON-PAYMENT OF DUE FEES Effective date: 20091031 |
|
| REG | Reference to a national code |
Ref country code: CH Ref legal event code: PL |
|
| PG25 | Lapsed in a contracting state [announced via postgrant information from national office to epo] |
Ref country code: CH Free format text: LAPSE BECAUSE OF NON-PAYMENT OF DUE FEES Effective date: 20091031 Ref country code: GR Free format text: LAPSE BECAUSE OF FAILURE TO SUBMIT A TRANSLATION OF THE DESCRIPTION OR TO PAY THE FEE WITHIN THE PRESCRIBED TIME-LIMIT Effective date: 20090227 Ref country code: IE Free format text: LAPSE BECAUSE OF NON-PAYMENT OF DUE FEES Effective date: 20091010 Ref country code: LI Free format text: LAPSE BECAUSE OF NON-PAYMENT OF DUE FEES Effective date: 20091031 |
|
| PG25 | Lapsed in a contracting state [announced via postgrant information from national office to epo] |
Ref country code: IT Free format text: LAPSE BECAUSE OF FAILURE TO SUBMIT A TRANSLATION OF THE DESCRIPTION OR TO PAY THE FEE WITHIN THE PRESCRIBED TIME-LIMIT Effective date: 20081126 |
|
| PG25 | Lapsed in a contracting state [announced via postgrant information from national office to epo] |
Ref country code: LU Free format text: LAPSE BECAUSE OF NON-PAYMENT OF DUE FEES Effective date: 20091010 |
|
| PG25 | Lapsed in a contracting state [announced via postgrant information from national office to epo] |
Ref country code: HU Free format text: LAPSE BECAUSE OF FAILURE TO SUBMIT A TRANSLATION OF THE DESCRIPTION OR TO PAY THE FEE WITHIN THE PRESCRIBED TIME-LIMIT Effective date: 20090527 |
|
| PG25 | Lapsed in a contracting state [announced via postgrant information from national office to epo] |
Ref country code: TR Free format text: LAPSE BECAUSE OF FAILURE TO SUBMIT A TRANSLATION OF THE DESCRIPTION OR TO PAY THE FEE WITHIN THE PRESCRIBED TIME-LIMIT Effective date: 20081126 |
|
| PG25 | Lapsed in a contracting state [announced via postgrant information from national office to epo] |
Ref country code: CY Free format text: LAPSE BECAUSE OF FAILURE TO SUBMIT A TRANSLATION OF THE DESCRIPTION OR TO PAY THE FEE WITHIN THE PRESCRIBED TIME-LIMIT Effective date: 20081126 |
|
| PGFP | Annual fee paid to national office [announced via postgrant information from national office to epo] |
Ref country code: DE Payment date: 20131022 Year of fee payment: 11 Ref country code: FR Payment date: 20130927 Year of fee payment: 11 |
|
| PGFP | Annual fee paid to national office [announced via postgrant information from national office to epo] |
Ref country code: ES Payment date: 20131024 Year of fee payment: 11 |
|
| REG | Reference to a national code |
Ref country code: DE Ref legal event code: R119 Ref document number: 60324975 Country of ref document: DE |
|
| PG25 | Lapsed in a contracting state [announced via postgrant information from national office to epo] |
Ref country code: DE Free format text: LAPSE BECAUSE OF NON-PAYMENT OF DUE FEES Effective date: 20150501 |
|
| REG | Reference to a national code |
Ref country code: FR Ref legal event code: ST Effective date: 20150630 |
|
| PG25 | Lapsed in a contracting state [announced via postgrant information from national office to epo] |
Ref country code: FR Free format text: LAPSE BECAUSE OF NON-PAYMENT OF DUE FEES Effective date: 20141031 |
|
| REG | Reference to a national code |
Ref country code: ES Ref legal event code: FD2A Effective date: 20151127 |
|
| PG25 | Lapsed in a contracting state [announced via postgrant information from national office to epo] |
Ref country code: ES Free format text: LAPSE BECAUSE OF NON-PAYMENT OF DUE FEES Effective date: 20141011 |