EP1631938B1 - Method for generating a three-dimensional terrain model - Google Patents
Method for generating a three-dimensional terrain model Download PDFInfo
- Publication number
- EP1631938B1 EP1631938B1 EP04739286.5A EP04739286A EP1631938B1 EP 1631938 B1 EP1631938 B1 EP 1631938B1 EP 04739286 A EP04739286 A EP 04739286A EP 1631938 B1 EP1631938 B1 EP 1631938B1
- Authority
- EP
- European Patent Office
- Prior art keywords
- value
- extrapolation
- grid
- values
- height
- Prior art date
- Legal status (The legal status is an assumption and is not a legal conclusion. Google has not performed a legal analysis and makes no representation as to the accuracy of the status listed.)
- Expired - Lifetime
Links
Images

Classifications
-
- G—PHYSICS
- G06—COMPUTING OR CALCULATING; COUNTING
- G06T—IMAGE DATA PROCESSING OR GENERATION, IN GENERAL
- G06T17/00—Three-dimensional [3D] modelling for computer graphics
- G06T17/05—Geographic models
-
- G—PHYSICS
- G06—COMPUTING OR CALCULATING; COUNTING
- G06F—ELECTRIC DIGITAL DATA PROCESSING
- G06F17/00—Digital computing or data processing equipment or methods, specially adapted for specific functions
- G06F17/10—Complex mathematical operations
- G06F17/17—Function evaluation by approximation methods, e.g. inter- or extrapolation, smoothing, least mean square method
- G06F17/175—Function evaluation by approximation methods, e.g. inter- or extrapolation, smoothing, least mean square method of multidimensional data
Definitions
- the invention relates to a method for generating a three-dimensional terrain model for a 3D terrain display and evaluation with the aid of object-oriented vector data, which contain for the terrain descriptive bases at least their cartographic position indicating position values and their height or depth relative to a reference level indicating altitude values.
- Raster data includes pixel information in a raster
- object-oriented vector data contains information about object-specific properties, such as the geological nature of the seabed
- spatial information about objects such as the wreck's geographic coordinates, in spatially unevenly distributed form over the terrain
- matrix data Information about terrain heights or depths in regularly distributed form over the terrain.
- terrain models are obtained by suitable surveying of the terrain surface or the seabed, whereby the measuring points are selected such that terrain forms, such as crests, Depressions, ridges, valleys, breaklines, drop lines, and special objects, such as roads, waters, and buildings, are optimally captured.
- object types and properties are also recorded.
- the generation of terrain models from such data takes place in known methods as largely automatic, human monitored, interactive process, which also includes the quality control of the measurement data.
- regular models in which given by the data predetermined vertices are evenly distributed (matrix data) and other model points are generated by interpolation in the grid, or created irregular models in which the bases are unevenly distributed and further model information z.
- a two-dimensional image of an area of the earth's surface is generated.
- the method of D1 has the goal "to plot by step the two-dimensional configuration of a network of curves or lineaments representing the configuration of objects in a zone of an environment or of a field of vector physical quantities in this zone".
- a network of curves is laid. This network represents the distribution of objects of the area or the variation of a physical quantity in the area.
- a grid with multiple grid fields is placed over the area. For some grids and some curves it is known in which orientation the curve intersects this grid.
- environments are set around grid grids. For each grid field is determined whether at least one curve intersects its surroundings. If a curve intersects the environment, then an average orientation of all the curves in that environment is determined and assigned to the grid fields. As a result of the first step, some grid fields are each assigned an orientation value.
- an orientation value is calculated by extrapolation for those grating fields, which have not been given an orientation value in the first step, and assigned to the grating field.
- the procedure of US 5798768 A can be expanded to obtain a three-dimensional image.
- the invention has for its object to provide a method for generating a three-dimensional terrain model that allows automatic generation of the terrain model of object-oriented, electronic vector data without human interaction.
- the inventive method has the advantage that it is very stable due to the combination of extrapolation and weighted interpolation, d. H. with only object-oriented vector maps that have been created taking into account the visualization of elevation information in plan view, without meaningful human interaction leads to meaningful results. This also applies to phenomena such as displacement, interruption and termination of contour lines, strongly fluctuating point density, entangled contour lines, which occur frequently in maps designed for visualization in plan view (2D representation) and do not occur here. In other methods resulting so-called. Terrace formations are also avoided.
- the terrain model can be created from object-oriented vector maps directly in a tactical application and used together with these maps, so that the terrain model - unlike the prior art - the tactical application must not be supplied externally.
- This results in advantages such as lower provisioning costs for the provision of geographical data for the tactical application, less care required when geographic information is included in the tactical application, and increased consistency between the terrain model or evaluations derived therefrom and object-oriented vector data or images derived therefrom the tactical application. The latter leads to clearer results in the three-dimensional evaluation and presentation of information on the geographical area.
- the height values of the interpolation points in association with the cartographic position of the interpolation points are inscribed as interpolation values in raster fields of a regular raster and the extrapolation of the interpolation values and the subsequent weighted interpolation of the extrapolation values are carried out in the raster.
- the grid is traversed line by line and column by grid, thereby writing in the first pass each stored in a grid height value of a support value in an adjacent in the pass direction, blank grid as Extrapolationswert.
- each height value stored in a grid and any extrapolation value derived therefrom will be added to an empty grid in the pass direction as extrapolation value
- the grid is traversed line by line and column by grid for grid and thereby inscribed in the first pass each stored in a grid support value in an adjacent in the pass direction, blank grid as Extrapolationswert.
- each support value stored in a grid and each extrapolation value derived therefrom will be placed in a blank, adjacent grid field enrolled.
- All extrapolation values are assigned a distance digit which indicates the proximity of the extrapolation value to its base value.
- the passes through the grid are repeated in a predetermined sequence until all the grid fields that have not been used at the start time are assigned extrapolation values.
- the interpolation is carried out in such a way that the grid is again traversed line by line and column by grid and thereby between two immediately adjacent in the direction of height values, which have a height difference not equal to zero and of which at least the height value following in the direction of passage an extrapolation is interpolated in a weighted manner and this extrapolation value is overwritten with the interpolation value.
- the runs are repeated in a predetermined order until no additional extrapolation value is present in the raster, the height indication of which has a height difference deviating from zero to an adjacent height value, which may be a support value or an interpolation value.
- a pass cycle may consist of a line by line pass from left to right, a subsequent line by line pass from right to left, a pass from top to bottom, and a pass from bottom to top.
- the stated sequence of runs in a cycle can be swapped as desired, but will maintain the order once selected in the following cycles.
- the method illustrated in the drawing with reference to a selected example of a terrain cutout generates a three-dimensional terrain model based on object-oriented vector maps, which have been created taking into account the visualization of elevation or depth information in plan view.
- object-oriented vector maps are in electronic Shape available.
- Such terrain models serve for the three-dimensional evaluation and representation of the object-oriented vector maps used for their production.
- the process creates the terrain models fully automatically without human interaction, whereby the creation can be made directly in a tactical application.
- tactical applications are for example ground navigation, path planning, drone deployment planning, mission planning for emergency vehicles with navigation and the like, path planning for a torpedo shot, mission planning for submarines, threat analyzes for air strikes, etc.
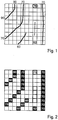
- Fig. 1 is a terrain cut from an object-oriented vector map shown in the objects and elements with height information are correct.
- contour lines are shown with the height indications "90", “70”, “60”.
- "52” represents a mapped height, eg a dome
- the dotted framed “76” is a so-called break point with the height "76”
- the dotted line represents a longer breaking edge without altitude.
- a break point with height indication can be a tower, for example be, a broken edge without height indication eg a river, a dam or the like ..
- the extrapolation proceeds in principle in such a way that the grid is traversed row by row and column by grid and in the first pass each support value stored in a grid is inscribed into an adjacent grid in the pass direction as extrapolation value, if this is unoccupied, and in all further passes of each of the grid values stored in a grid and any extrapolation value derived therefrom are written to a grid adjacent in the pass direction, if this is blank. All extrapolation values will be characterized by the proximity of the extrapolation value to its base value Distance digit assigned. The runs are repeated until all the blank fields at the start of the extrapolation are assigned extrapolation values.
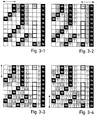
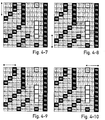
- Fig. 3 the extrapolation is shown in detail, with a total of six line and column-by-pass iterations are required to all Extrapolations staple all grids.
- the direction of the individual passes is in Fig. 3 indicated by arrows on the grid.
- a first line by line pass through the grid according to Fig. 3-1 from left to right, line by line, until the entire grid has passed through.
- the extrapolation values derived from the support values are given the same height specification and in addition the distance digit, which is indicated by "1", because the extrapolation value is derived directly from the support value, ie it has the greatest proximity to it.
- the grids occupied with the resulting extrapolation values are in the grid of the Fig. 3-1 hatched shown. After the passage according to Fig. 3-1 For example, all grids that are to the right of a support value immediately adjacent to it are given an extrapolation value.
- Fig. 3-3 The pass shown will pass the grid column by column, column by column, from top to bottom. Not only are extrapolation values derived from support values, but also from existing extrapolation values. The extrapolation values derived from extrapolation values are given a distance digit which is increased by "1" from the distance figure of the extrapolation value from which the newly-formed extrapolation value is derived.
- Fig. 3-3 For example, in this column-wise pass in the first column, the extrapolation value "90" (hatched) is derived from the support value "90", to which the distance digit "1" is assigned. In the second column, a new extrapolation value "90" with the distance digit "2" (hatched) is derived from the extrapolation value "90" with the distance digit "1" during the column-wise passage from top to bottom.
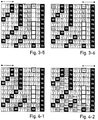
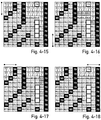
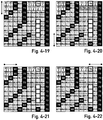
- interpolation the grid is traversed line by line and column by column, grid by grid. Again, it is true that the order of the runs can be varied and only a once selected order of the runs must be maintained until the end of the interpolation.
- Fig. 4 In the individual runs illustrated interpolation is the same sequence of runs observed as in the extrapolation.
- everyone Pass cycle comprises a line by line pass from left to right ( Fig. 4-1 ) and a line by line from right to left ( Fig. 4-2 ), as well as a column-wise pass from top to bottom ( Fig. 4-3 ) and a column-wise pass from bottom to top ( Fig. 4-4 ). This sweep cycle is repeated as many times as necessary until completion of the interpolation.
- Each altitude value which is a base value or an interpolation value, is assigned the distance digit "0" in the calculation according to Eq. (1).
- the row-by-column and column-by-column runs of the grid are performed according to the method described in US Pat Fig. 4-1 to 4-4 illustrated cycle.
- the passage directions are indicated by the arrows shown at the grids.
- the calculated and overwritten during the respective run Interpolation values are marked by shaded grids.
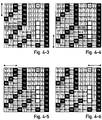
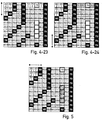
- next pass cycle begins with a line-wise pass from left to right, now the extrapolation values written into the empty raster edge characteristics are derived from the height values preceding it in the pass direction, which are here interpolation values. These extrapolation values are again assigned a distance digit, which now indicates the proximity of the extrapolation value to the altitude value from which the extrapolation value is derived is. Since in the selected embodiment only in each case in the column direction adjacent raster fields have break edge properties, all raster fields are occupied with break edge properties with an extrapolation value, so that further runs are no longer performed with this one pass.
- each grid point is occupied with a given height (support values and break points with height indication) with an interpolated altitude or an extrapolated altitude.
- This terrain model can be evaluated or displayed three-dimensionally by known methods.
Landscapes
- Engineering & Computer Science (AREA)
- Physics & Mathematics (AREA)
- General Physics & Mathematics (AREA)
- Software Systems (AREA)
- Theoretical Computer Science (AREA)
- Data Mining & Analysis (AREA)
- Geometry (AREA)
- Mathematical Physics (AREA)
- Computational Mathematics (AREA)
- Mathematical Analysis (AREA)
- Mathematical Optimization (AREA)
- Pure & Applied Mathematics (AREA)
- Computer Graphics (AREA)
- Algebra (AREA)
- Remote Sensing (AREA)
- Databases & Information Systems (AREA)
- General Engineering & Computer Science (AREA)
- Image Generation (AREA)
- Processing Or Creating Images (AREA)
- Radar Systems Or Details Thereof (AREA)
- Image Analysis (AREA)
Description
Die Erfindung betrifft ein Verfahren zur Generierung eines dreidimensionalen Geländemodells für eine 3D-Geländedarstellung und -auswertung unter Zuhilfenahme von objektorientierten Vektordaten, die für das Gelände beschreibende Stützpunkte mindestens deren kartographische Lage angebende Positionswerte und deren Höhe oder Tiefen gegenüber einem Bezugsniveau angebende Höhenwerte enthalten.The invention relates to a method for generating a three-dimensional terrain model for a 3D terrain display and evaluation with the aid of object-oriented vector data, which contain for the terrain descriptive bases at least their cartographic position indicating position values and their height or depth relative to a reference level indicating altitude values.
Zur Generierung von dreidimensionalen Geländemodellen für eine 3D-Geländedarstellung und -auswertung sind verschiedene Verfahren bekannt, die sich alle auf in elektronischer Form vorliegenden Informationen über den geografischen Raum stützen. Bekannte Formen solcher Informationen sind Rasterdaten, objektorientierte Vektordaten sowie Matrixdaten. Rasterdaten enthalten Bildpunktinformationen in einem Raster, objektorientierte Vektordaten enthalten Informationen zu objektspezifischen Eigenschaften, wie etwa die geologische Beschaffenheit des Meeresbodens, und räumliche Informationen zu Objekten, wie etwa die geographischen Koordinaten eines Wracks, in räumlich ungleichmäßig über das Gelände verteilter Form und Matrixdaten enthalten u. a. Informationen zu Geländehöhen oder -tiefen in regelmäßig über das Gelände verteilter Form.To generate three-dimensional terrain models for 3D terrain visualization and evaluation, various methods are known, all of which rely on information available in electronic form about the geographical area. Known forms of such information are raster data, object-oriented vector data and matrix data. Raster data includes pixel information in a raster, object-oriented vector data contains information about object-specific properties, such as the geological nature of the seabed, and spatial information about objects, such as the wreck's geographic coordinates, in spatially unevenly distributed form over the terrain, and matrix data. a. Information about terrain heights or depths in regularly distributed form over the terrain.
Diese Daten werden durch geeignete Vermessung der Geländeoberfläche bzw. des Meeresboden gewonnen, wobei die Messpunkte so gewählt werden, dass Geländeformen, wie Kuppen, Senken, Rücken, Täler, Bruchkanten, Falllinien, und besondere Objekte, wie Straßen, Gewässer und Gebäude, optimal erfasst werden. Zusätzlich werden auch Objektarten und -eigenschaften erfasst. Die Generierung von Geländemodellen aus solchen Daten erfolgt bei bekannten Verfahren als weitgehend automatischer, menschlich überwachter, interaktiver Prozess, der auch die Qualitätskontrolle der Messdaten mit einbezieht. Dabei werden entweder regelmäßige Modelle, bei denen durch die Daten vorgegebene Stützpunkte gleichmäßig verteilt vorliegen (Matrixdaten) und weitere Modellpunkte durch Interpolation im Raster generiert werden, oder unregelmäßige Modelle erstellt, bei denen die Stützpunkte ungleichmäßig verteilt vorliegen und weitere Modellinformationen z. B. durch Dreiecksvermaschung nach Delauny erstellt werden (
Bei taktischen Systemen, in denen umfangreiche Geländeanalysen durchgeführt werden, werden im allgemeinen regelmäßige Geländemodelle verwendet, die diesen Systemen von extern zugeführt werden. Sollen auf diesen Systemen auch Darstellungen zur Topographie (Straßenverlauf, Lage von Städten etc.) erfolgen, sind hierfür neben dem Geländemodell auch Karten in Form von raster-oder objektorientierten elektronischen Karten in das System einzubringen.In tactical systems where extensive terrain analysis is performed, regular terrain models are generally used which are externally fed to these systems. If you also want to display topography (road layout, location of cities, etc.) on these systems, then in addition to the terrain model, maps in the form of grid-oriented or object-oriented electronic maps should also be included in the system.
Durch das in
Ein Gitter mit mehreren Gitterfeldern wird über das Gebiet gelegt. Für einige Rasterfelder und einige Kurven ist bekannt, in welcher Orientierung die Kurve dieses Rasterfeld schneidet. In einem ersten Schritt werden Umgebungen um Gitterfelder des Gitters festgelegt. Für jedes Gitterfeld wird festgestellt, ob mindestens eine Kurve dessen Umgebung schneidet. Falls eine Kurve die Umgebung schneidet, so wird eine durchschnittliche Orientierung aller Kurven in dieser Umgebung ermittelt und den Gitterfeldern zugeordnet. Als Ergebnis des ersten Schrittes ist einigen Gitterfeldern jeweils ein Orientierungswert zugeordnet. Im zweiten Schritt wird für diejenigen Gitterfelder, denen im ersten Schritt keinen Orientierungswert erhalten haben, jeweils ein Orientierungswert durch Extrapolation berechnet und dem Gitterfeld zugeordnet. Das Verfahren von
Der Erfindung liegt die Aufgabe zugrunde, ein Verfahren zur Generierung eines dreidimensionalen Geländemodells anzugeben, das eine automatische Generierung des Geländemodells aus objektorientierten, elektronischen Vektordaten ohne humane Interaktion ermöglicht.The invention has for its object to provide a method for generating a three-dimensional terrain model that allows automatic generation of the terrain model of object-oriented, electronic vector data without human interaction.
Die Aufgabe ist erfindungsgemäß durch die Merkmale im Anspruch 1 gelöst.The object is achieved by the features in
Zweckmäßige Ausführungsformen des erfindungsgemäßen Verfahrens mit vorteilhaften Weiterbildungen und Ausgestaltungen der Erfindung ergeben sich aus den weiteren Ansprüchen.Advantageous embodiments of the method according to the invention with advantageous developments and embodiments of the invention will become apparent from the other claims.
Das erfindungsgemäße Verfahren hat den Vorteil, dass es durch die Kombination von Extrapolation und gewichteter Interpolation sehr stabil ist, d. h. mit nur objektorientierten Vektorkarten, die unter Berücksichtigung der Visualisierung von Höheninformationen in Draufsicht erstellt worden sind, ohne humane Interaktion zu sinnvollen Ergebnissen führt. Dies gilt auch für Erscheinungen, wie Verdrängung, Unterbrechung und Abbruch von Höhenlinien, stark schwankender Punktdichte, verschlungener Höhenlinien, die bei für die Visualisierung in Draufsicht (2D-Darstellung) ausgelegten Karten häufig vorkommen und hier nicht auftreten. Bei anderen Verfahren sich ergebende sog. Terrassenbildungen werden ebenfalls vermieden.The inventive method has the advantage that it is very stable due to the combination of extrapolation and weighted interpolation, d. H. with only object-oriented vector maps that have been created taking into account the visualization of elevation information in plan view, without meaningful human interaction leads to meaningful results. This also applies to phenomena such as displacement, interruption and termination of contour lines, strongly fluctuating point density, entangled contour lines, which occur frequently in maps designed for visualization in plan view (2D representation) and do not occur here. In other methods resulting so-called. Terrace formations are also avoided.
Das Geländemodell lässt sich aus objektorientierten Vektorkarten direkt in einer taktischen Applikation erstellen und gemeinsam mit diesen Karten verwenden, so dass das Geländemodell - anders als beim Stand der Technik - der taktischen Applikation nicht von extern zugeführt werden muss. Dadurch ergeben sich Vorteile, wie geringerer Versorgungsaufwand bei der Bereitstellung von geografischen Daten für die taktische Applikation, geringerer Pflegeaufwand bei der Einbeziehung von geografischen Informationen in die taktische Applikation und erhöhte Konsistenz zwischen Geländemodell bzw. daraus abgeleiteten Auswertungen und objektorientierten Vektordaten bzw. daraus abgeleiteten Darstellungen in der taktischen Applikation. Letzteres führt zu klareren Ergebnissen bei der dreidimensionalen Auswertung und Darstellung von Informationen zum geografischen Raum.The terrain model can be created from object-oriented vector maps directly in a tactical application and used together with these maps, so that the terrain model - unlike the prior art - the tactical application must not be supplied externally. This results in advantages such as lower provisioning costs for the provision of geographical data for the tactical application, less care required when geographic information is included in the tactical application, and increased consistency between the terrain model or evaluations derived therefrom and object-oriented vector data or images derived therefrom the tactical application. The latter leads to clearer results in the three-dimensional evaluation and presentation of information on the geographical area.
Mit dem erfindungsgemäßen Verfahren lassen sich mit sehr guten Ergebnissen regelmäßige Höhen- oder Tiefenfelder, Kartendarstellungen mit Höhenstufen, Kartendarstellungen mit Schummerung, Sichtbarkeitsbereiche im Gelände für optische und andere elektromagnetische Strahlung, Geländeschnitte, Schrägansichten des Geländes aus objektorientierten Vektorkarten erzeugen und folgende taktische Applikationen unterstützen: Bodennavigation, Bahnplanung, Drohnenplanung, Sichtbarkeitsanalysen für Radar, Plausibilitätsprüfungen für ESM-Daten, Bedrohungsanalyse für Luftangriffe aus verdeckten Tälern, Ausbreitungsberechnungen für Sonarsignale, Bahnplanung für Torpedos und U-Boote und Missionsplanung für Einsatzfahrzeuge.With the method according to the invention can be with very good results regular altitude or depth fields, maps with altitude levels, map displays with Hillshade, terrain terrain visibility for optical and other electromagnetic radiation, terrain mapping, oblique views of the terrain from object oriented vector maps, and supporting tactical applications: ground navigation, orbit planning, drone planning, radar visibility analyzes, plausibility checks for ESM data, threat analysis for air strikes from covert valleys, Propagation calculations for sonar signals, path planning for torpedoes and submarines and mission planning for emergency vehicles.
Erfindungsgemäß werden die Höhenwerte der Stützpunkte in Zuordnung zu der kartographischen Lage der Stützpunkte als Stützwerte in Rasterfelder eines regelmäßigen Rasters eingeschrieben und die Extrapolation der Stützwerte und die anschließende gewichtete Interpolation der Extrapolationswerte im Raster durchgeführt.According to the invention, the height values of the interpolation points in association with the cartographic position of the interpolation points are inscribed as interpolation values in raster fields of a regular raster and the extrapolation of the interpolation values and the subsequent weighted interpolation of the extrapolation values are carried out in the raster.
Erfindungsgemäß wird bei der Extrapolation das Raster zeilen-und spaltenweise, Rasterfeld für Rasterfeld durchlaufen und dabei im ersten Durchlauf jeder in einem Rasterfeld abgelegte Höhenwert eines Stützwerts in ein in Durchlaufrichtung angrenzendes, unbelegtes Rasterfeld als Extrapolationswert eingeschrieben. In allen weiteren Durchläufen wird jeder in einem Rasterfeld abgelegte Höhenwert und jeder davon abgeleitete Extrapolationswert in ein in Durchlaufrichtung angrenzendes, unbelegtes Rasterfeld als Extrapolationswert Zweckmäßige Ausführungsformen des erfindungsgemäßen Verfahrens mit vorteilhaften Weiterbildungen und Ausgestaltungen der Erfindung ergeben sich aus den weiteren Ansprüchen.According to the invention, in the extrapolation, the grid is traversed line by line and column by grid, thereby writing in the first pass each stored in a grid height value of a support value in an adjacent in the pass direction, blank grid as Extrapolationswert. In all further runs, each height value stored in a grid and any extrapolation value derived therefrom will be added to an empty grid in the pass direction as extrapolation value Advantageous embodiments of the method according to the invention with advantageous developments and embodiments of the invention will become apparent from the other claims.
Gemäß einer vorteilhaften Vorgehensweise bei der Extrapolation wird das Raster zeilen- und spaltenweise, Rasterfeld für Rasterfeld durchlaufen und dabei im ersten Durchlauf jeder in einem Rasterfeld abgelegte Stützwert in ein in Durchlaufrichtung angrenzendes, unbelegtes Rasterfeld als Extrapolationswert eingeschrieben. In allen weiteren Durchläufen wird jeder in einem Rasterfeld abgelegte Stützwert und jeder davon abgeleitete Extrapolationswert in ein in Durchlaufrichtung angrenzendes, unbelegtes Rasterfeld eingeschrieben. Allen Extrapolationswerten wird eine Distanzziffer zugeordnet, welche die Nähe des Extrapolationswerts zu seinem Stützwert kennzeichnet. Die Durchläufe durch das Raster werden in vorgegebener Reihenfolge solange wiederholt, bis alle im Startzeitpunkt unbelegten Rasterfelder mit Extrapolationswerten belegt sind.According to an advantageous procedure in the extrapolation, the grid is traversed line by line and column by grid for grid and thereby inscribed in the first pass each stored in a grid support value in an adjacent in the pass direction, blank grid as Extrapolationswert. In all further runs, each support value stored in a grid and each extrapolation value derived therefrom will be placed in a blank, adjacent grid field enrolled. All extrapolation values are assigned a distance digit which indicates the proximity of the extrapolation value to its base value. The passes through the grid are repeated in a predetermined sequence until all the grid fields that have not been used at the start time are assigned extrapolation values.
Erfindungsgemäß wird die Interpolation in der Weise durchgeführt, dass das Raster wiederum zeilen-und spaltenweise, Rasterfeld für Rasterfeld durchlaufen wird und dabei zwischen zwei in Durchlaufrichtung unmittelbar aneinandergrenzenden Höhenwerten, die eine Höhendifferenz ungleich Null aufweisen und von denen zumindest der in Durchlaufrichtung folgende Höhenwert ein Extrapolationswert ist, gewichtet interpoliert und dieser Extrapolationswert mit dem Interpolationswert überschrieben wird. Die Durchläufe werden in vorgegebener Reihenfolge solange wiederholt, bis im Raster kein Extrapolationswert mehr vorhanden ist, dessen Höhenangabe eine von Null abweichende Höhendifferenz zu einem angrenzenden Höhenwert, der ein Stützwert oder ein Interpolationswert sein kann, aufweist.According to the invention, the interpolation is carried out in such a way that the grid is again traversed line by line and column by grid and thereby between two immediately adjacent in the direction of height values, which have a height difference not equal to zero and of which at least the height value following in the direction of passage an extrapolation is interpolated in a weighted manner and this extrapolation value is overwritten with the interpolation value. The runs are repeated in a predetermined order until no additional extrapolation value is present in the raster, the height indication of which has a height difference deviating from zero to an adjacent height value, which may be a support value or an interpolation value.
Die zeilen- und spaltenweisen Durchläufe durch das Rasterfeld bei der Extra- und Interpolation können beliebig vorgenommen werden, wobei eine einmal gewählte Reihenfolge bei weiteren Durchlaufzyklen unverändert beibehalten wird. Beispielsweise kann ein Durchlaufzyklus aus einem zeilenweisen Durchlauf von links nach rechts, einem anschließenden zeilenweisen Durchlauf von rechts nach links, einem Durchlauf von oben nach unten und einen Durchlauf von unten nach oben bestehen. Die genannte Reihenfolge der Durchläufe in einem Durchlaufzyklus kann beliebig vertauscht werden, doch wird die einmal gewählte Reihenfolge in den folgenden Durchlaufzyklen beibehalten.The line and column-wise passes through the grid in the extra and interpolation can be made arbitrarily, with a once selected sequence is maintained unchanged in further cycles. For example, a pass cycle may consist of a line by line pass from left to right, a subsequent line by line pass from right to left, a pass from top to bottom, and a pass from bottom to top. The stated sequence of runs in a cycle can be swapped as desired, but will maintain the order once selected in the following cycles.
Die Erfindung ist anhand eines in der Zeichnung illustrierten Ausführungsbeispiels des Verfahrens im Folgenden näher beschrieben. Es zeigen:
- Fig. 1
- Elemente aus einer objektorientierten Vektorkarte im Vergleich ihrer Lage zu einem regelmäßigen Raster,
- Fig. 2
- ein regelmäßiges Raster mit den registrierten Elementen aus der objektorientierten Vektorkarte in
Fig. 1 , - Fig. 3
- eine Illustrierung des Ablaufs der Extrapolation im Raster über sechs Durchläufe des Rasters (
Fig. 3-1 bis 3-6 ), - Fig. 4
- eine Illustrierung des Ablaufs der gewichteten Interpolation über vierundzwanzig Durchläufe des Rasters (
Fig. 4-1 bis 4-24 ), - Fig. 5
- eine Illustrierung des Ablaufs der Extrapolation von sog. Bruchkanten.
- Fig. 1
- Elements from an object-oriented vector map compared to their location to a regular grid,
- Fig. 2
- a regular grid with the registered elements from the object oriented vector map in
Fig. 1 . - Fig. 3
- an illustration of the process of extrapolation in the grid over six cycles of the grid (
Fig. 3-1 to 3-6 ) - Fig. 4
- an illustration of the process of weighted interpolation over twenty-four cycles of the grid (
Fig. 4-1 to 4-24 ) - Fig. 5
- an illustration of the process of extrapolation of so-called breaklines.
Das in der Zeichnung anhand eines ausgewählten Beispiels für einen Geländeausschnitt illustrierte Verfahren generiert ein dreidimensionales Geländemodell auf Basis von objektorientierten Vektorkarten, die unter starker Berücksichtigung der Visualisierung von Höhen- bzw. Tiefeninformationen in Draufsicht erstellt worden sind. Solche objektorientierten Vektorkarten sind in elektronischer Form verfügbar. Im folgenden wird nur noch von Höhenwerten bzw. Höhenangaben gesprochen, wobei Tiefenwerte bzw. Tiefenangaben als negative Höhenwerte bzw. Höhenangaben betrachtet werden. Solche Geländemodelle dienen zur dreidimensionalen Auswertung und Darstellung der zu ihrer Herstellung verwendeten objektorientierten Vektorkarten. Das Verfahren erstellt die Geländemodelle vollautomatisch ohne menschliche Interaktion, wobei die Erstellung direkt in einer taktischen Applikation vorgenommen werden kann. Solche taktischen Applikationen sind beispielsweise Bodennavigation, Bahnplanung, Drohneneinsatzplanung, Missionsplanung für Einsatzfahrzeuge mit Navigation und dgl., Bahnplanung für einen Torpedoschuss, Missionsplanung für U-Boote, Bedrohungsanalysen für Luftangriffe etc.The method illustrated in the drawing with reference to a selected example of a terrain cutout generates a three-dimensional terrain model based on object-oriented vector maps, which have been created taking into account the visualization of elevation or depth information in plan view. Such object-oriented vector maps are in electronic Shape available. In the following, only height values or altitude data will be discussed, with depth values or depth data being regarded as negative altitude values or altitude information. Such terrain models serve for the three-dimensional evaluation and representation of the object-oriented vector maps used for their production. The process creates the terrain models fully automatically without human interaction, whereby the creation can be made directly in a tactical application. Such tactical applications are for example ground navigation, path planning, drone deployment planning, mission planning for emergency vehicles with navigation and the like, path planning for a torpedo shot, mission planning for submarines, threat analyzes for air strikes, etc.
In
Um mit diesen im Gelände ungleichmäßig verteilten Stützpunkten ein Geländemodell zu erstellen, das zu einer dreidimensionalen Auswertung und Darstellung des Geländeausschnitts tauglich ist, wird wie folgt vorgegangen:
Die aus der objektorientierten Vektorkarte für den gewählten Geländeabschnitt verfügbaren, unregelmäßig verteilten Stützpunkte mit Höhenangaben werden lagerichtig in ein gleichmäßiges Raster übernommen. In
The irregularly distributed interpolation points with height information available from the object-oriented vector map for the selected site section are transferred in the correct position into a uniform grid. In
In diesem so belegten Raster werden nun alle Höhenwerte der Stützpunkte, kurz Stützwerte, extrapoliert und anschließend alle Extrapolationen einer gewichteten Interpolation unterzogen. Die von den Bruchpunkten mit und ohne Höhenangabe belegten Rasterfelder bleiben dabei zunächst ausgespart.In this grid, which is occupied in this way, all the height values of the interpolation points, in short support values, are extrapolated and then all extrapolations are subjected to a weighted interpolation. The raster fields occupied by the break points with and without height indication initially remain blank.
Die Extrapolation verläuft grundsätzlich in der Weise, dass das Raster zeilen- und spaltenweise, Rasterfeld für Rasterfeld durchlaufen wird und dabei im ersten Durchlauf jeder in einem Rasterfeld abgelegte Stützwert in ein in Durchlaufrichtung angrenzendes Rasterfeld als Extrapolationswert eingeschrieben wird, wenn dieses unbelegt ist, und in allen weiteren Durchläufen jeder in einem Rasterfeld abgelegte Stützwert und jeder davon abgeleitete Extrapolationswert in ein in Durchlaufrichtung angrenzendes Rasterfeld eingeschrieben wird, wenn dieses unbelegt ist. Allen Extrapolationswerten wird eine die Nähe des Extrapolationswertes zu seinem Stützwert kennzeichnende Distanzziffer zugeordnet. Die Durchläufe werden solange wiederholt, bis alle beim Start der Extrapolation unbelegten Rasterfelder mit Extrapolationswerten belegt sind.The extrapolation proceeds in principle in such a way that the grid is traversed row by row and column by grid and in the first pass each support value stored in a grid is inscribed into an adjacent grid in the pass direction as extrapolation value, if this is unoccupied, and in all further passes of each of the grid values stored in a grid and any extrapolation value derived therefrom are written to a grid adjacent in the pass direction, if this is blank. All extrapolation values will be characterized by the proximity of the extrapolation value to its base value Distance digit assigned. The runs are repeated until all the blank fields at the start of the extrapolation are assigned extrapolation values.
In
Der nächste Durchlauf erfolgt zeilenweise von rechts nach links, wie dies in
Im dritten, in
Der nächste Durchlauf erfolgt wiederum spaltenweise, diesmal aber von unten nach oben (
Nunmehr erfolgt ein weiterer Durchlauf, diesmal wiederum zeilenmäßig von links nach rechts gemäß
Der nächste Durchlauf wird wiederum zeilenmäßig von rechts nach links vorgenommen. Dieser Durchlauf liefert die in
Es ist nicht zwingend, dass die in
Alle in dem Raster enthaltenen Extrapolationswerte werden nunmehr einer gewichteten Interpolation, die linear ist, unterzogen, wobei zur Wichtung der Interpolation die Distanzziffern der Extrapolationswerte herangezogen werden. Im folgenden wird für Stützwerte, Extrapolationswerte und Interpolationswerte der Oberbegriff "Höhenwerte" benutzt.All extrapolation values contained in the raster are now subjected to a weighted interpolation which is linear, the distance numbers of the extrapolation values being used to weight the interpolation. In the following, the generic term "height values" is used for support values, extrapolation values and interpolation values.
Auch bei der Interpolation wird das Raster zeilen- und spaltenweise, Rasterfeld für Rasterfeld durchlaufen. Auch hier gilt, dass dabei die Reihenfolge der Durchläufe variiert werden kann und lediglich eine einmal gewählte Reihenfolge der Durchläufe bis zum Ende der Interpolation beibehalten werden muss. Bei der in
Bei jedem Durchlauf wird jeweils zwischen zwei in Durchlaufrichtung unmittelbar aneinander angrenzenden Höhenwerten, die eine Höhendifferenz ungleich Null aufweisen und von denen zumindest der in Durchlaufrichtung folgende Höhenwert ein Extrapolationswert ist, gewichtet linear interpoliert und letzterer mit dem Interpolationswert überschrieben. Der Interpolationswert Hi wird berechnet gemäß 
Beispielhaft wird die Berechnung des im ersten Durchlauf gemäß ![]()
![]()
Der an der Interpolation beteiligte Extrapolationswert H2=70, der in Durchlaufrichtung dem zur Interpolation herangezogenen anderen Extrapolationswert H1=90 unmittelbar folgt, wird nunmehr mit diesem Interpolationswert Hi=76,7 überschrieben. Das überschriebene Rasterfeld mit dem Interpolationswert "76,7" ist in
Wenn der erste Durchlaufzyklus beendet ist und im Raster noch nicht mit Interpolationswerten überschriebene Extrapolationswerte vorhanden sind, die zu den in Durchlaufrichtung unmittelbar vorangehende Höhenwert eine Höhendifferenz ungleich Null aufweisen, wird ein weiterer Zyklus von zeilenweisen und spaltenweisen Durchläufen in gleicher Reihenfolge durchgeführt, wie dies aus ![]()
![]()
Mit diesem neuen Interpolationswert Hi=80 wird der Extrapolationswert H2=70 überschrieben, so dass das in
Da nach Abschluss des Durchlaufzyklusses im Raster gemäß
Wie bereits eingangs erwähnt, werden bei der Extrapolation und gewichteten linearen Interpolation Rasterfelder, denen Bruchpunkte oder Bruchkanten zugeordnet sind (im Raster schwarz umrahmt) ausgeklammert. Da Stützwerte mit Bruchkanteneigenschaften ohne Höhenangaben in der Regel einen dem Gelände entsprechenden Höhenwert aufweisen, z.B. ein eine Bruchkante darstellendes Flussufer, werden mit einer anschließenden Extrapolation die Rasterfelder mit Bruchkanteneigenschaften ohne Höhenangabe mit einem Extrapolationswert belegt. In
Abschließend wird geprüft, ob an die Rasterfelder mit Bruchkanteneigenschaft angrenzende Rasterfelder verblieben sind, die noch unbelegt sind. Ist dies der Fall, so werden diese Rasterfelder mit einem Extrapolationswert belegt, der von den in Durchlaufrichtung unmittelbar vorausgehenden Extrapolationswert im Rasterfeld mit Bruchkanteneigenschaften in der beschriebenen Weise abgeleitet wird.Finally, it is checked whether adjacent raster fields which are still unoccupied have remained on the raster edges with break edge property. If this is the case, then these grids are occupied with an extrapolation value, which is derived from the extrapolation value immediately preceding in the direction of passage in the grid with break edge properties in the manner described.
In dem durch das Raster gemäß
Claims (5)
- Method for automatic generation of a three-dimensional terrain model for a 3D terrain representation and evaluation with the assistance of object-oriented electronic vector data, which contains position values which indicate at least the cartographic position of support points which describe the terrain and are obtained by suitable surveying of the terrain surface or of the seabed and height values which indicate their height or depth with respect to a reference level,
wherein extrapolation values are extrapolated from the height values of the support points, and the extrapolation values are subject to weighted interpolation,
wherein the height values of the support points are written to grid fields of a regular grid as support values associated with the cartographic position of the support points, and extrapolation and interpolation are carried out in the grid, wherein the grid is run through in rows and columns, grid field by grid field, for extrapolation and, in the first run in this case, each support value which is stored in a grid field is written as an extrapolation value to an unoccupied grid field which is adjacent in the direction of the run, and, in all the other runs, each support value which is stored in a grid field and each extrapolation value derived therefrom is written to an unoccupied grid field which is adjacent in the direction of the run,
wherein all the extrapolation values are allocated a distance figure which indicates the proximity of the extrapolation value to its support value, wherein the runs are repeated until all of the grid fields which were unoccupied at the extrapolation start time are occupied with extrapolation values which represent height values,
wherein, for interpolation, the grid is run through in rows and columns, grid field by grid field,
wherein weighted interpolation is carried out in each case between two height values which are immediately adjacent to one another in the direction of the run, have a height difference not equal to zero and of which at least the height value which follows in the direction of the run is an extrapolation value, and the latter is overwritten with the interpolation value,
wherein the runs are repeated until there are no more extrapolation values which are adjacent to a height value with a height difference not equal to zero, and
wherein the distance figures of the extrapolation values are used for weighting the interpolation. - Method according to Claim 1, characterized in that the distance figure of an extrapolation value is indicated by "1" when the extrapolation value is derived directly from the support value, and is increased by "1" with respect to its distance figure for each extrapolation value derived from an extrapolation value.
- Method according to Claim 1 or 2, characterized in that the interpolation value Hi is calculated using:

- Method according to one of the preceding claims, characterized in that two successive runs row-by-row through the entire grid are carried out, namely initially one from left to right and then one from right to left, or vice versa, and two successive runs through the entire grid column-by-column are carried out, namely first of all one from top to bottom and then one from bottom to top, or vice versa.
- Method according to Claim 4, characterized in that a run cycle is defined by a sequence of two runs row-by-row and two runs column-by-column and the sequence is left unchanged in successive run cycles.
Applications Claiming Priority (2)
| Application Number | Priority Date | Filing Date | Title |
|---|---|---|---|
| DE10325738A DE10325738B3 (en) | 2003-06-06 | 2003-06-06 | Process for generating a three-dimensional terrain model |
| PCT/EP2004/005464 WO2004109604A1 (en) | 2003-06-06 | 2004-05-21 | Method for generating a three-dimensional terrain model |
Publications (2)
| Publication Number | Publication Date |
|---|---|
| EP1631938A1 EP1631938A1 (en) | 2006-03-08 |
| EP1631938B1 true EP1631938B1 (en) | 2018-09-05 |
Family
ID=33394806
Family Applications (1)
| Application Number | Title | Priority Date | Filing Date |
|---|---|---|---|
| EP04739286.5A Expired - Lifetime EP1631938B1 (en) | 2003-06-06 | 2004-05-21 | Method for generating a three-dimensional terrain model |
Country Status (9)
| Country | Link |
|---|---|
| US (1) | US7446765B2 (en) |
| EP (1) | EP1631938B1 (en) |
| AU (1) | AU2004246071B2 (en) |
| CA (1) | CA2521642C (en) |
| DE (1) | DE10325738B3 (en) |
| IL (1) | IL171184A (en) |
| MY (1) | MY137460A (en) |
| NO (1) | NO334710B1 (en) |
| WO (1) | WO2004109604A1 (en) |
Families Citing this family (23)
| Publication number | Priority date | Publication date | Assignee | Title |
|---|---|---|---|---|
| US7864175B2 (en) * | 2006-03-09 | 2011-01-04 | Ambercore Software Inc | Fast gridding of irregular data |
| CL2009000725A1 (en) | 2008-03-24 | 2009-05-29 | Medivation Technologies Inc | Compounds derived from substituted bridging heterocycles, modulators of adrenergic, serotonin, dopamine and histamine receptors; pharmaceutical composition; pharmaceutical kit; and its use in the treatment of cognitive disorder and psychotic disorder. |
| US8600708B1 (en) | 2009-06-01 | 2013-12-03 | Paradigm Sciences Ltd. | Systems and processes for building multiple equiprobable coherent geometrical models of the subsurface |
| US9418182B2 (en) | 2009-06-01 | 2016-08-16 | Paradigm Sciences Ltd. | Systems and methods for building axes, co-axes and paleo-geographic coordinates related to a stratified geological volume |
| US8711140B1 (en) | 2009-06-01 | 2014-04-29 | Paradigm Sciences Ltd. | Systems and methods for building axes, co-axes and paleo-geographic coordinates related to a stratified geological volume |
| US9536022B1 (en) | 2009-06-01 | 2017-01-03 | Paradigm Sciences Ltd. | Systems and methods for modeling faults in the subsurface |
| US8743115B1 (en) | 2009-10-23 | 2014-06-03 | Paradigm Sciences Ltd. | Systems and methods for coordinated editing of seismic data in dual model |
| US10114134B2 (en) | 2012-03-02 | 2018-10-30 | Emerson Paradigm Holding Llc | Systems and methods for generating a geological model honoring horizons and faults |
| US9759826B2 (en) | 2012-04-03 | 2017-09-12 | Paradigm Sciences Ltd. | System and method for generating an implicit model of geological horizons |
| EP3418778B1 (en) | 2013-03-15 | 2020-07-15 | Emerson Paradigm Holding LLC | Systems and methods to build sedimentary attributes |
| EP2869096B1 (en) | 2013-10-29 | 2019-12-04 | Emerson Paradigm Holding LLC | Systems and methods of multi-scale meshing for geologic time modeling |
| US9810906B2 (en) | 2014-06-17 | 2017-11-07 | Osterhout Group, Inc. | External user interface for head worn computing |
| US9846308B2 (en) | 2014-01-24 | 2017-12-19 | Osterhout Group, Inc. | Haptic systems for head-worn computers |
| US10422923B2 (en) | 2014-03-28 | 2019-09-24 | Emerson Paradigm Holding Llc | Systems and methods for modeling fracture networks in reservoir volumes from microseismic events |
| US9690002B2 (en) | 2015-06-18 | 2017-06-27 | Paradigm Sciences Ltd. | Device, system and method for geological-time refinement |
| US10685482B2 (en) * | 2016-05-13 | 2020-06-16 | Chevron U.S.A. Inc. | System and method for 3D restoration of complex subsurface models |
| CN106251402B (en) * | 2016-07-31 | 2019-05-03 | 四川大学 | Three-dimensional model construction and compactness detection method for filling construction of filling engineering |
| US10466388B2 (en) | 2016-09-07 | 2019-11-05 | Emerson Paradigm Holding Llc | System and method for editing geological models by switching between volume-based models and surface-based structural models augmented with stratigraphic fiber bundles |
| CN108986222B (en) * | 2018-08-15 | 2022-10-14 | 四川大学 | A method for generating digital terrain of Wubra River channel |
| US10520644B1 (en) | 2019-01-10 | 2019-12-31 | Emerson Paradigm Holding Llc | Imaging a subsurface geological model at a past intermediate restoration time |
| US11156744B2 (en) | 2019-01-10 | 2021-10-26 | Emerson Paradigm Holding Llc | Imaging a subsurface geological model at a past intermediate restoration time |
| CN109920028B (en) * | 2019-03-12 | 2022-03-11 | 中国电建集团中南勘测设计研究院有限公司 | Terrain correction method of width average vertical plane two-dimensional model |
| CN110415346B (en) * | 2019-07-10 | 2022-11-25 | 华中师范大学 | Method for simulating water and soil loss by using object-oriented three-dimensional cellular automaton |
Family Cites Families (4)
| Publication number | Priority date | Publication date | Assignee | Title |
|---|---|---|---|---|
| FR2610752B1 (en) * | 1987-02-10 | 1989-07-21 | Sagem | METHOD FOR REPRESENTING THE PERSPECTIVE IMAGE OF A FIELD AND SYSTEM FOR IMPLEMENTING SAME |
| WO1993004437A1 (en) * | 1991-08-15 | 1993-03-04 | Hughes Aircraft Company | Efficient storage of geographic data for visual displays |
| FR2725814B1 (en) | 1994-10-18 | 1997-01-24 | Inst Francais Du Petrole | METHOD FOR MAPPING BY INTERPOLATION, A NETWORK OF LINES, IN PARTICULAR THE CONFIGURATION OF GEOLOGICAL FAULTS |
| KR100361218B1 (en) * | 2000-07-20 | 2002-11-18 | 한국과학기술원 | Intelligent interpolation methods for automatic generation of an accurate digital elevation model |
-
2003
- 2003-06-06 DE DE10325738A patent/DE10325738B3/en not_active Expired - Fee Related
-
2004
- 2004-05-21 US US10/557,248 patent/US7446765B2/en not_active Expired - Fee Related
- 2004-05-21 CA CA002521642A patent/CA2521642C/en not_active Expired - Fee Related
- 2004-05-21 AU AU2004246071A patent/AU2004246071B2/en not_active Ceased
- 2004-05-21 WO PCT/EP2004/005464 patent/WO2004109604A1/en not_active Ceased
- 2004-05-21 EP EP04739286.5A patent/EP1631938B1/en not_active Expired - Lifetime
- 2004-05-21 MY MYPI20041943A patent/MY137460A/en unknown
-
2005
- 2005-09-29 IL IL171184A patent/IL171184A/en active IP Right Grant
- 2005-12-19 NO NO20056023A patent/NO334710B1/en not_active IP Right Cessation
Also Published As
| Publication number | Publication date |
|---|---|
| DE10325738B3 (en) | 2004-12-02 |
| CA2521642A1 (en) | 2004-12-16 |
| US7446765B2 (en) | 2008-11-04 |
| US20070024623A1 (en) | 2007-02-01 |
| IL171184A (en) | 2013-10-31 |
| CA2521642C (en) | 2009-01-20 |
| NO334710B1 (en) | 2014-05-12 |
| AU2004246071B2 (en) | 2009-10-08 |
| NO20056023L (en) | 2005-12-19 |
| MY137460A (en) | 2009-01-30 |
| WO2004109604A1 (en) | 2004-12-16 |
| AU2004246071A1 (en) | 2004-12-16 |
| EP1631938A1 (en) | 2006-03-08 |
Similar Documents
| Publication | Publication Date | Title |
|---|---|---|
| EP1631938B1 (en) | Method for generating a three-dimensional terrain model | |
| EP0780800A2 (en) | Method and apparatus for imaging space related data | |
| DE3881416T2 (en) | Method for displaying a perspective image of an area and system for carrying out the method. | |
| DE69301308T2 (en) | IMAGE TEXTURING SYSTEM WITH THEME CELLS. | |
| DE19544921C2 (en) | Device and method for navigating a mobile body using a road map displayed from a bird's eye view | |
| DE102013222023A1 (en) | Multiple viewing area analysis | |
| CH648656A5 (en) | PHOTOGRAMMETRIC METHOD AND PHOTOGRAMMETRIC DEVICE FOR AIRCRAFT AND SPACING BODY. | |
| DE102012106932A1 (en) | Method for displaying a vehicle environment with position points | |
| DE102015003666A1 (en) | Method for processing acquired measured data of a sensor | |
| DE2337880C2 (en) | Method for generating a simulated radar image | |
| DE69522207T2 (en) | DEVICE FOR CARRYING OUT A VISIBILITY CALCULATION | |
| DE102015120999A1 (en) | A method of generating and displaying a computer-generated real-environment simulation environment | |
| DE102010022726B4 (en) | Device for displaying terrain on a display device of a missile | |
| WO2013149616A1 (en) | Method for synchronous representation of a virtual reality in a distributed simulation device | |
| DE102012214307A1 (en) | Method and device for modeling an environment | |
| EP0634628B1 (en) | Method for earth observation | |
| DE102021133975A1 (en) | Computer-implemented method for creating a three-dimensional simulation environment | |
| DE102012213336A1 (en) | Method for addition of digital card around spot heights pre-designated on geographical positions of vehicle, involves assigning geodetic projection height, for representing size to geographical position in digital card | |
| WO2017144033A1 (en) | Method for identifying and displaying changes in a real environment comprising a real terrain and real objects situated therein | |
| WO2013057192A1 (en) | Method for surveying and visually displaying the physical circumstances of a production plant | |
| DE102023102618A1 (en) | Computer-implemented method for assigning an attribute to a selection of uniquely identifiable grid elements of a global reference grid determined by means of a vector object | |
| DE4209936C2 (en) | Terrain image simulator | |
| EP1486920A2 (en) | Method of remote sensing | |
| DE102009001311B4 (en) | Procedure for providing a card | |
| EP4675523B1 (en) | Computer-implemented method for determining a collision probability of avians with an anthropogenic structure |
Legal Events
| Date | Code | Title | Description |
|---|---|---|---|
| PUAI | Public reference made under article 153(3) epc to a published international application that has entered the european phase |
Free format text: ORIGINAL CODE: 0009012 |
|
| 17P | Request for examination filed |
Effective date: 20050907 |
|
| AK | Designated contracting states |
Kind code of ref document: A1 Designated state(s): AT BE BG CH CY CZ DE DK EE ES FI FR GB GR HU IE IT LI LU MC NL PL PT RO SE SI SK TR |
|
| DAX | Request for extension of the european patent (deleted) | ||
| REG | Reference to a national code |
Ref country code: DE Ref legal event code: R079 Ref document number: 502004015715 Country of ref document: DE Free format text: PREVIOUS MAIN CLASS: G06T0017500000 Ipc: G06T0017050000 |
|
| GRAP | Despatch of communication of intention to grant a patent |
Free format text: ORIGINAL CODE: EPIDOSNIGR1 |
|
| STAA | Information on the status of an ep patent application or granted ep patent |
Free format text: STATUS: GRANT OF PATENT IS INTENDED |
|
| RIC1 | Information provided on ipc code assigned before grant |
Ipc: G06T 17/05 20110101AFI20180507BHEP Ipc: G06F 17/17 20060101ALI20180507BHEP |
|
| INTG | Intention to grant announced |
Effective date: 20180523 |
|
| GRAS | Grant fee paid |
Free format text: ORIGINAL CODE: EPIDOSNIGR3 |
|
| GRAA | (expected) grant |
Free format text: ORIGINAL CODE: 0009210 |
|
| STAA | Information on the status of an ep patent application or granted ep patent |
Free format text: STATUS: THE PATENT HAS BEEN GRANTED |
|
| RAP1 | Party data changed (applicant data changed or rights of an application transferred) |
Owner name: ATLAS ELEKTRONIK GMBH |
|
| AK | Designated contracting states |
Kind code of ref document: B1 Designated state(s): AT BE BG CH CY CZ DE DK EE ES FI FR GB GR HU IE IT LI LU MC NL PL PT RO SE SI SK TR |
|
| REG | Reference to a national code |
Ref country code: GB Ref legal event code: FG4D Free format text: NOT ENGLISH |
|
| REG | Reference to a national code |
Ref country code: CH Ref legal event code: EP |
|
| REG | Reference to a national code |
Ref country code: AT Ref legal event code: REF Ref document number: 1038730 Country of ref document: AT Kind code of ref document: T Effective date: 20180915 |
|
| REG | Reference to a national code |
Ref country code: IE Ref legal event code: FG4D Free format text: LANGUAGE OF EP DOCUMENT: GERMAN |
|
| REG | Reference to a national code |
Ref country code: DE Ref legal event code: R096 Ref document number: 502004015715 Country of ref document: DE |
|
| REG | Reference to a national code |
Ref country code: NL Ref legal event code: MP Effective date: 20180905 |
|
| PG25 | Lapsed in a contracting state [announced via postgrant information from national office to epo] |
Ref country code: FI Free format text: LAPSE BECAUSE OF FAILURE TO SUBMIT A TRANSLATION OF THE DESCRIPTION OR TO PAY THE FEE WITHIN THE PRESCRIBED TIME-LIMIT Effective date: 20180905 Ref country code: BG Free format text: LAPSE BECAUSE OF FAILURE TO SUBMIT A TRANSLATION OF THE DESCRIPTION OR TO PAY THE FEE WITHIN THE PRESCRIBED TIME-LIMIT Effective date: 20181205 Ref country code: GR Free format text: LAPSE BECAUSE OF FAILURE TO SUBMIT A TRANSLATION OF THE DESCRIPTION OR TO PAY THE FEE WITHIN THE PRESCRIBED TIME-LIMIT Effective date: 20181206 Ref country code: SE Free format text: LAPSE BECAUSE OF FAILURE TO SUBMIT A TRANSLATION OF THE DESCRIPTION OR TO PAY THE FEE WITHIN THE PRESCRIBED TIME-LIMIT Effective date: 20180905 |
|
| PG25 | Lapsed in a contracting state [announced via postgrant information from national office to epo] |
Ref country code: ES Free format text: LAPSE BECAUSE OF FAILURE TO SUBMIT A TRANSLATION OF THE DESCRIPTION OR TO PAY THE FEE WITHIN THE PRESCRIBED TIME-LIMIT Effective date: 20180905 |
|
| PG25 | Lapsed in a contracting state [announced via postgrant information from national office to epo] |
Ref country code: EE Free format text: LAPSE BECAUSE OF FAILURE TO SUBMIT A TRANSLATION OF THE DESCRIPTION OR TO PAY THE FEE WITHIN THE PRESCRIBED TIME-LIMIT Effective date: 20180905 Ref country code: PL Free format text: LAPSE BECAUSE OF FAILURE TO SUBMIT A TRANSLATION OF THE DESCRIPTION OR TO PAY THE FEE WITHIN THE PRESCRIBED TIME-LIMIT Effective date: 20180905 Ref country code: RO Free format text: LAPSE BECAUSE OF FAILURE TO SUBMIT A TRANSLATION OF THE DESCRIPTION OR TO PAY THE FEE WITHIN THE PRESCRIBED TIME-LIMIT Effective date: 20180905 Ref country code: IT Free format text: LAPSE BECAUSE OF FAILURE TO SUBMIT A TRANSLATION OF THE DESCRIPTION OR TO PAY THE FEE WITHIN THE PRESCRIBED TIME-LIMIT Effective date: 20180905 Ref country code: CZ Free format text: LAPSE BECAUSE OF FAILURE TO SUBMIT A TRANSLATION OF THE DESCRIPTION OR TO PAY THE FEE WITHIN THE PRESCRIBED TIME-LIMIT Effective date: 20180905 Ref country code: NL Free format text: LAPSE BECAUSE OF FAILURE TO SUBMIT A TRANSLATION OF THE DESCRIPTION OR TO PAY THE FEE WITHIN THE PRESCRIBED TIME-LIMIT Effective date: 20180905 |
|
| PG25 | Lapsed in a contracting state [announced via postgrant information from national office to epo] |
Ref country code: PT Free format text: LAPSE BECAUSE OF FAILURE TO SUBMIT A TRANSLATION OF THE DESCRIPTION OR TO PAY THE FEE WITHIN THE PRESCRIBED TIME-LIMIT Effective date: 20190105 Ref country code: SK Free format text: LAPSE BECAUSE OF FAILURE TO SUBMIT A TRANSLATION OF THE DESCRIPTION OR TO PAY THE FEE WITHIN THE PRESCRIBED TIME-LIMIT Effective date: 20180905 |
|
| REG | Reference to a national code |
Ref country code: DE Ref legal event code: R097 Ref document number: 502004015715 Country of ref document: DE |
|
| PLBE | No opposition filed within time limit |
Free format text: ORIGINAL CODE: 0009261 |
|
| STAA | Information on the status of an ep patent application or granted ep patent |
Free format text: STATUS: NO OPPOSITION FILED WITHIN TIME LIMIT |
|
| PG25 | Lapsed in a contracting state [announced via postgrant information from national office to epo] |
Ref country code: DK Free format text: LAPSE BECAUSE OF FAILURE TO SUBMIT A TRANSLATION OF THE DESCRIPTION OR TO PAY THE FEE WITHIN THE PRESCRIBED TIME-LIMIT Effective date: 20180905 |
|
| 26N | No opposition filed |
Effective date: 20190606 |
|
| PG25 | Lapsed in a contracting state [announced via postgrant information from national office to epo] |
Ref country code: SI Free format text: LAPSE BECAUSE OF FAILURE TO SUBMIT A TRANSLATION OF THE DESCRIPTION OR TO PAY THE FEE WITHIN THE PRESCRIBED TIME-LIMIT Effective date: 20180905 |
|
| REG | Reference to a national code |
Ref country code: CH Ref legal event code: PL |
|
| PG25 | Lapsed in a contracting state [announced via postgrant information from national office to epo] |
Ref country code: CH Free format text: LAPSE BECAUSE OF NON-PAYMENT OF DUE FEES Effective date: 20190531 Ref country code: MC Free format text: LAPSE BECAUSE OF FAILURE TO SUBMIT A TRANSLATION OF THE DESCRIPTION OR TO PAY THE FEE WITHIN THE PRESCRIBED TIME-LIMIT Effective date: 20180905 Ref country code: LI Free format text: LAPSE BECAUSE OF NON-PAYMENT OF DUE FEES Effective date: 20190531 |
|
| REG | Reference to a national code |
Ref country code: BE Ref legal event code: MM Effective date: 20190531 |
|
| PG25 | Lapsed in a contracting state [announced via postgrant information from national office to epo] |
Ref country code: LU Free format text: LAPSE BECAUSE OF NON-PAYMENT OF DUE FEES Effective date: 20190521 |
|
| PG25 | Lapsed in a contracting state [announced via postgrant information from national office to epo] |
Ref country code: TR Free format text: LAPSE BECAUSE OF FAILURE TO SUBMIT A TRANSLATION OF THE DESCRIPTION OR TO PAY THE FEE WITHIN THE PRESCRIBED TIME-LIMIT Effective date: 20180905 |
|
| PG25 | Lapsed in a contracting state [announced via postgrant information from national office to epo] |
Ref country code: IE Free format text: LAPSE BECAUSE OF NON-PAYMENT OF DUE FEES Effective date: 20190521 |
|
| PG25 | Lapsed in a contracting state [announced via postgrant information from national office to epo] |
Ref country code: BE Free format text: LAPSE BECAUSE OF NON-PAYMENT OF DUE FEES Effective date: 20190531 |
|
| PGFP | Annual fee paid to national office [announced via postgrant information from national office to epo] |
Ref country code: DE Payment date: 20200520 Year of fee payment: 17 Ref country code: FR Payment date: 20200522 Year of fee payment: 17 |
|
| REG | Reference to a national code |
Ref country code: AT Ref legal event code: MM01 Ref document number: 1038730 Country of ref document: AT Kind code of ref document: T Effective date: 20190521 |
|
| PGFP | Annual fee paid to national office [announced via postgrant information from national office to epo] |
Ref country code: GB Payment date: 20200527 Year of fee payment: 17 |
|
| PG25 | Lapsed in a contracting state [announced via postgrant information from national office to epo] |
Ref country code: AT Free format text: LAPSE BECAUSE OF NON-PAYMENT OF DUE FEES Effective date: 20190521 |
|
| PG25 | Lapsed in a contracting state [announced via postgrant information from national office to epo] |
Ref country code: CY Free format text: LAPSE BECAUSE OF FAILURE TO SUBMIT A TRANSLATION OF THE DESCRIPTION OR TO PAY THE FEE WITHIN THE PRESCRIBED TIME-LIMIT Effective date: 20180905 |
|
| PG25 | Lapsed in a contracting state [announced via postgrant information from national office to epo] |
Ref country code: HU Free format text: LAPSE BECAUSE OF FAILURE TO SUBMIT A TRANSLATION OF THE DESCRIPTION OR TO PAY THE FEE WITHIN THE PRESCRIBED TIME-LIMIT; INVALID AB INITIO Effective date: 20040521 |
|
| REG | Reference to a national code |
Ref country code: DE Ref legal event code: R119 Ref document number: 502004015715 Country of ref document: DE |
|
| GBPC | Gb: european patent ceased through non-payment of renewal fee |
Effective date: 20210521 |
|
| PG25 | Lapsed in a contracting state [announced via postgrant information from national office to epo] |
Ref country code: GB Free format text: LAPSE BECAUSE OF NON-PAYMENT OF DUE FEES Effective date: 20210521 Ref country code: DE Free format text: LAPSE BECAUSE OF NON-PAYMENT OF DUE FEES Effective date: 20211201 |
|
| PG25 | Lapsed in a contracting state [announced via postgrant information from national office to epo] |
Ref country code: FR Free format text: LAPSE BECAUSE OF NON-PAYMENT OF DUE FEES Effective date: 20210531 |