EP1519294B1 - Characterisation of disease progression - Google Patents
Characterisation of disease progression Download PDFInfo
- Publication number
- EP1519294B1 EP1519294B1 EP04253908.0A EP04253908A EP1519294B1 EP 1519294 B1 EP1519294 B1 EP 1519294B1 EP 04253908 A EP04253908 A EP 04253908A EP 1519294 B1 EP1519294 B1 EP 1519294B1
- Authority
- EP
- European Patent Office
- Prior art keywords
- progression
- disease
- uptake
- trajectory
- parkinson
- Prior art date
- Legal status (The legal status is an assumption and is not a legal conclusion. Google has not performed a legal analysis and makes no representation as to the accuracy of the status listed.)
- Expired - Lifetime
Links
Images



Classifications
-
- G—PHYSICS
- G06—COMPUTING OR CALCULATING; COUNTING
- G06T—IMAGE DATA PROCESSING OR GENERATION, IN GENERAL
- G06T7/00—Image analysis
- G06T7/0002—Inspection of images, e.g. flaw detection
- G06T7/0012—Biomedical image inspection
-
- G—PHYSICS
- G06—COMPUTING OR CALCULATING; COUNTING
- G06V—IMAGE OR VIDEO RECOGNITION OR UNDERSTANDING
- G06V10/00—Arrangements for image or video recognition or understanding
- G06V10/20—Image preprocessing
- G06V10/24—Aligning, centring, orientation detection or correction of the image
- G06V10/243—Aligning, centring, orientation detection or correction of the image by compensating for image skew or non-uniform image deformations
-
- G—PHYSICS
- G06—COMPUTING OR CALCULATING; COUNTING
- G06V—IMAGE OR VIDEO RECOGNITION OR UNDERSTANDING
- G06V10/00—Arrangements for image or video recognition or understanding
- G06V10/20—Image preprocessing
- G06V10/25—Determination of region of interest [ROI] or a volume of interest [VOI]
-
- G—PHYSICS
- G06—COMPUTING OR CALCULATING; COUNTING
- G06V—IMAGE OR VIDEO RECOGNITION OR UNDERSTANDING
- G06V10/00—Arrangements for image or video recognition or understanding
- G06V10/40—Extraction of image or video features
- G06V10/50—Extraction of image or video features by performing operations within image blocks; by using histograms, e.g. histogram of oriented gradients [HoG]; by summing image-intensity values; Projection analysis
- G06V10/507—Summing image-intensity values; Histogram projection analysis
-
- G—PHYSICS
- G06—COMPUTING OR CALCULATING; COUNTING
- G06V—IMAGE OR VIDEO RECOGNITION OR UNDERSTANDING
- G06V10/00—Arrangements for image or video recognition or understanding
- G06V10/40—Extraction of image or video features
- G06V10/56—Extraction of image or video features relating to colour
-
- G—PHYSICS
- G06—COMPUTING OR CALCULATING; COUNTING
- G06V—IMAGE OR VIDEO RECOGNITION OR UNDERSTANDING
- G06V2201/00—Indexing scheme relating to image or video recognition or understanding
- G06V2201/03—Recognition of patterns in medical or anatomical images
- G06V2201/031—Recognition of patterns in medical or anatomical images of internal organs
Definitions
- the present invention relates to the characterisation, i.e. monitoring and/or measurement of progressive dysfunction of a system. More particularly the invention relates to a method, which may be embodied in software for a software-controlled machine, for characterising such progressive dysfunction.
- Parkinson's disease is a disorder of the central nervous system that affects between one and one-and-a-half million US citizens. Parkinson's disease can appear at any age, but it is uncommon in people younger than 30, and the risk of developing it increases with age. It occurs in all parts of the world, and men are affected slightly more often than women. Patients with the disease suffer severe motor-neuro symptoms, including shaking, rigidity, slowness of movement and poor balance.
- Parkinson's disease can be monitored by nuclear medical imaging of the two striata of the brain (left and right).
- a characteristic of Parkinson's disease is the lack of dopamine in the striatum of the brain, caused by the loss of neurons in the substantia nigra.
- the amount of dopamine in the striatum can be measured by injecting a radioligand (for example ioflupane (FP-CIT/DaTSCAN) or iodobenzamide (IBZM)); after the radioactive labeled molecules arrive at the dopaminergic terminals in the striatum, they bind to pre-synaptic dopamine transporters molecules which enables imaging of functional dopaminergic neurons using Single Photon Emission Computed Tomography (SPECT).
- SPECT Single Photon Emission Computed Tomography
- the SPECT image of a normal person shows high uptake in the left and right striatum, as shown in Figures 1(a) and (b) of the accompanying drawings. These images are SPECT images with 123 I tracer (here DaTSCAN) showing the striatum as "hotspots".
- Figure 1(a) is a close-up of one of the striata in Figure 1(b) .
- the number of dopamine transporters in the striatum is substantially reduced.
- the SPECT image of a typical Parkinson's disease patient shows reduced uptake in the striatum, and in some patients there is asymmetry in the level of uptake between the left and right striatum. Such an image is shown in Figure 1(c) of the accompanying drawings.
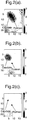
- Figures 2(a), (b) and (c) show typical disease progression for a single striatum. As the disease progresses, the tail of the striatum, the putamen, dies off first, followed finally by the upper region, the caudate.
- Figure 2(a) shows a healthy striatum, progressing in Figure 2(b) to a moderately degenerated one where the putamen tail has very reduced uptake, and finally in Figure 2(c) an extremely degenerated striatum with little uptake at all in either putamen or caudate.
- the present invention accordingly provides computer program and apparatus as defined in the appended claims.
- this embodiment consists of the following three steps:-
- a health measure is first computed for each striatum.
- the values of the health measure range from 1 to 0 where 1 indicates a healthy striatum and 0 indicates the most severe reduction in the level of uptake of the contrast agent. Although 1 and 0 are chosen in this example, obviously the range can be normalised between other values.
- These health measures, for the left and right striata, are then used to describe the disease progression. As Parkinson's disease progresses these two values will decrease in a characteristic way. This allows the calculation of the disease percentage.
- the first aim is to characterise the level of uptake of the contrast agent at different points in the striatum.
- a conventional 3-D SPECT data set (which may, for example, consist of 128 axial slices)
- the slices which include the striatum are found.
- the striatum is found in the 10 slices between slices 10 and 20.
- the slices including the striatum can be found manually by a clinician inspecting the slices, or alternatively can be found automatically by finding the brightest part of the SPECT scans (which is located in the striatum) and taking a predefined number of slices above and below that slice.
- the search area can be reduced, for example, by detecting the head outline and concentrating the search in the quadrant of the head where the striatum is known to be located.
- a single 2-D analysis slab is created by summing the layers together and normalising all the intensity values within the slab by dividing each pixel by an average background intensity value. This defines a very thick SPECT slice which includes all (or most) of the striatum. Normalisation is effective to ensure that factors such as variations in the amount of contrast agent given to the patient, total scan time or time between administering the contrast agent and performing the scan do not affect the overall brightness of the scan, thus confusing the analysis.
- a Region of Interest is positioned over the striatum such that the centre line of this ROI lies close to the central part of the striatum.
- ROI Region of Interest
- Figure 3(a) a rectangular ROI is used, though ROIs of other shape, for exampled based on the expected shape of the striatum, can be used.
- the Region of Interest is positioned by locating a short edge of the rectangle at the brightest part of the striatum (this may be located by positioning a larger search area over the striatum and searching for the brightest region within it) and orienting the long axis of the rectangle along the striatum.
- the ROI may be positioned differently as long as the position can be consistently found in the image).
- each point in the region of interest is projected onto a line defined through the region of interest (for example the centre line of the rectangle) by summing the intensity values (representing uptake of the contrast agent) over the width of the region of interest.
- This summed uptake value is graphed along the length of the striatum and Figures 4(a) to (c) illustrate three examples of regions of interest over SPECT scans with Figures 4(d) to (f) illustrating the corresponding summed values of intensity.
- the graphs begin at the short edge of the ROI which is positioned on the brightest point of the striatum and extend along the striatum towards the end of the putamen.
- Figure 4(a) shows a SPECT scan for a healthy striatum and Figure 4(d) the corresponding graphed intensity along the length of the striatum.
- Figures 4(b) and (e) show corresponding values for a striatum with a moderate to severe degeneration
- Figures 4(c) and (f) show values for a striatum with extreme degeneration. It can be seen that the values decrease into the putamen which is believed to be a characteristic of Parkinson's disease - the putamen dies off more quickly than the caudate.
- a collection of test scans is taken which show different stages in the progression of the disease from healthy to extreme degeneration.
- Each scan includes two striata (the left and right) and each of the striata can be classified into one of five stages:-
- test scans comprise the training set for the algorithm. Classifying each striatum into one of the stages is used to teach the algorithm the different stages in progression of the disease. Thus the algorithm can compute an optimal model to describe the reduction in uptake in the striatum as the disease progresses. For acceptable results a training set containing more than 100 scans should be used.
- the training of the algorithm involves taking the graphs which have been classified into the five stages above, and for each of the five stages computing an average graph to typify each stage.
- a set of five graphs for a typical training set is shown in Figure 5(a) .
- Stages 2 and 3 each show a progressive decrease in uptake along the putamen.
- Stage 4 Severe degeneration shows deterioration in the putamen and also some deterioration in the caudate.
- Stage 5 Extreme degeneration displays a marked drop in uptake in the caudate.
- a health measure between 0 and 1 is to be computed, indicating where the striatum lies on the continuum between Stage 1: Healthy and Stage 5: Extreme degeneration.
- This is done by embedding the five graphs in a 3-dimensional space, where the third dimension is the health measure.
- a confidence value for the health measure can also be obtained from the error between the uptake graph for the particular striatum under consideration and the most similar graph in the continuum of graphs defined by the surface in Figure 5(b) .
- a small error implies a high confidence in the measure.
- this confidence value can be used to warn the clinician when an accurate measurement is not possible, for example due to artefacts in the imaging process.
- a value between 0 and 1 for a health measure for each of the left and right striata can be obtained.
- This measure is useful because it is quantitative, and also it is consistent in that it is judged by a reference to the progression in many other data sets forming the training set. Thus it gives a consistent and quantitative measurement of the state of the striata for that patient.
- the left and right striata do not necessarily degenerate at the same rate and the asymmetry can be indicative of the degree of progression of the disease.
- the health measures for the left and right striata are plotted as a single point on a graph as is illustrated in Figure 6 , where the horizontal co-ordinate is given by the less active (sicker) striatum and the vertical co-ordinate is given by the more active (healthier) striatum, as illustrated below.
- a point in the top right-hand comer of this graph (1, 1) indicates that both striata are healthy.
- a point in the bottom left-hand comer (0, 0) indicates that both striata are extremely degenerated.
- a value of (0.3, 0.7) indicates severe degeneration in one striatum and mild degeneration in the other.
- PDF probability density function
- this disease progression percentage is a single score which indicates the progression of the bilateral disease (in this case Parkinson's disease) and is associated with a confidence measure.
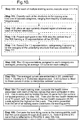
- Figure 9 illustrates in summary how a given scan is analysed to produce the two health measures and then the disease progression percentage and associated confidence values once the algorithm has already been set up with training data to compute the spline surface (shown in Figure 5(b) ) and best-fit curve on the progression graph (shown in Figure 8 ).
- Step 101 involves a series of steps in which the structures in a set of training scans are classified in step 111 into one of the categories mentioned above, and then in steps 112, 113 and 114 the one dimensional representations (such as shown in Figures 4 (d), (e) and (f) ) are calculated for each of the scans, and categorised according to the classification of step 111, thus linking the qualitative and quantitative assessments.
- step 102 the one dimensional representations are averaged in each category and in step 103 these are embedded in 3D positioned in the third dimension from 1: Healthy to 0: Extremely Degenerated and a hyper-surface is fitted to the curves to interpolate between them as shown in Figure 5(b) .
- step 104 the best fit of each individual training scan to the surface is found and the health measure between 0 and 1 is read off.
- the two health measures are then plotted against each other (as shown in Figure 7 ) and in step 105 the best fitting curve is found which passes through (0,0) and (1,1). This curve is then used for assessing disease progression as in steps 105-106 of Figure 9 .
Landscapes
- Engineering & Computer Science (AREA)
- Physics & Mathematics (AREA)
- General Physics & Mathematics (AREA)
- Theoretical Computer Science (AREA)
- Multimedia (AREA)
- General Health & Medical Sciences (AREA)
- Health & Medical Sciences (AREA)
- Medical Informatics (AREA)
- Nuclear Medicine, Radiotherapy & Molecular Imaging (AREA)
- Radiology & Medical Imaging (AREA)
- Quality & Reliability (AREA)
- Computer Vision & Pattern Recognition (AREA)
- Measuring And Recording Apparatus For Diagnosis (AREA)
- Measurement Of The Respiration, Hearing Ability, Form, And Blood Characteristics Of Living Organisms (AREA)
Description
- The present invention relates to the characterisation, i.e. monitoring and/or measurement of progressive dysfunction of a system. More particularly the invention relates to a method, which may be embodied in software for a software-controlled machine, for characterising such progressive dysfunction.
- There are many fields in which systems are subject to progressive, or gradually changing (usually increasing), dysfunction. In the medical or veterinary field, for example, the human or animal body, or more particularly certain parts of it, may be subject to gradual deterioration as a result of disease or aging. Non-biological systems, such as mechanical, electrical or electronic systems, are also usually subject to gradual deterioration, again through aging or wear or the gradually changing (usually increasing) accumulation of faults. It is desirable to be able to monitor and quantify such progressive dysfunction. However, it can be difficult to do this in a consistent and quantitative way. This is particularly true in the case of multilateral dysfunction, i.e. dysfunction which arises in several different parts of the system. Techniques are available for detecting such multilateral dysfunction, but the consistent and quantitative characterisation of such dysfunction is problematic.
- A medical example can be used to demonstrate the problems. Parkinson's disease is a disorder of the central nervous system that affects between one and one-and-a-half million US citizens. Parkinson's disease can appear at any age, but it is uncommon in people younger than 30, and the risk of developing it increases with age. It occurs in all parts of the world, and men are affected slightly more often than women. Patients with the disease suffer severe motor-neuro symptoms, including shaking, rigidity, slowness of movement and poor balance.
- The progression of Parkinson's disease can be monitored by nuclear medical imaging of the two striata of the brain (left and right). A characteristic of Parkinson's disease is the lack of dopamine in the striatum of the brain, caused by the loss of neurons in the substantia nigra. The amount of dopamine in the striatum can be measured by injecting a radioligand (for example ioflupane (FP-CIT/DaTSCAN) or iodobenzamide (IBZM)); after the radioactive labeled molecules arrive at the dopaminergic terminals in the striatum, they bind to pre-synaptic dopamine transporters molecules which enables imaging of functional dopaminergic neurons using Single Photon Emission Computed Tomography (SPECT).
- The SPECT image of a normal person shows high uptake in the left and right striatum, as shown in
Figures 1(a) and (b) of the accompanying drawings. These images are SPECT images with 123I tracer (here DaTSCAN) showing the striatum as "hotspots".Figure 1(a) is a close-up of one of the striata inFigure 1(b) . In the case of Parkinson's disease, the number of dopamine transporters in the striatum is substantially reduced. The SPECT image of a typical Parkinson's disease patient shows reduced uptake in the striatum, and in some patients there is asymmetry in the level of uptake between the left and right striatum. Such an image is shown inFigure 1(c) of the accompanying drawings. -
Figures 2(a), (b) and (c) show typical disease progression for a single striatum. As the disease progresses, the tail of the striatum, the putamen, dies off first, followed finally by the upper region, the caudate.Figure 2(a) shows a healthy striatum, progressing inFigure 2(b) to a moderately degenerated one where the putamen tail has very reduced uptake, and finally inFigure 2(c) an extremely degenerated striatum with little uptake at all in either putamen or caudate. - Existing techniques for analysing these SPECT images involve independent measures of the amount of uptake in the left and right striata, with a possible additional calculation to indicate the degree of asymmetry. For example, one way of measuring the degree of dysfunction has been proposed in which a standard fixed-size rectangle is placed over each striatum in the image, and uptake in each rectangle computed by summing intensities. Uptake ratios are computed for the left and right striatum, and a measure of asymmetry is produced.
- A. Lokkegaard, L. M. Werdelin and L. Friberg proposed a similar technique in "Clinical Impact of Diagnostic SPECT Investigations with a Dopamine Re-Uptake Ligand", European J. Nuclear Medicine, Vol. 29, No. 12, December 2002. In this proposal a standard fixed-size shape is used to divide the striatum into two parts, the caudate and putamen. Uptake in each part is computed separately by summing intensities of pixels within each region. These quantities are then used to compute uptake ratios.
- However in both of these techniques it is difficult to relate the result to the state of progression of the disease and it is difficult to know what level of confidence there is in the result. Furthermore, the summing of intensities over the whole or a large part of the striatum, while a deliberate simplification, loses the information in the distribution of the uptake across the striatum.
- The paper "Measuring the Rate of Progression and estimating the preclinical period of Parkinson's Disease with (18F) dopa PET" by P.K. Morrish et al. in Biosciences Information Service, Philadelphia, PA, US 1998 discloses estimating the mean rate of progression of Parkinson's disease using mean putamen and caudate uptakes.
- Other conventional arrangements in similar fields are described in the following documents:
- ITO K ET AL, "Statistical parametric mapping with 18F-dopa PET shows bilaterally reduced striatal and nigral dopaminergic function in early Parkinson's disease", BIOSIS, BIOSCIENCES INFORMATION SERVICE, PHILADELPHIA, PA, US, (199906), Database accession no. PREV199900294950, XP002312920 [A]
- DHAWAN VIJAY ET AL, "Comparative analysis of striatal FDOPA uptake in Parkinson's disease: Ratio method versus graphical approach.", BIOSIS, BIOSCIENCES INFORMATION SERVICE, PHILADELPHIA, PA, US, (200210), Database accession no. PREV200300002816, XP002312921
- RAKSHI J S ET AL, "Frontal, midbrain and striatal dopaminergic function in early and advanced Parkinson's disease A 3D [(18)F]dopa-PET study.", MEDLINE, US NATIONAL LIBRARY OF MEDICINE (NLM), BETHESDA, MD, US, (199909), Database accession no. NLM10468504, XP002312922 [A]
- International Patent Application
WO1994/010903A - The present invention accordingly provides computer program and apparatus as defined in the appended claims.
- The invention will be further described by way of example with reference to the accompanying drawings in which:-
-
Figures 1(a), (b) and (c) are SPECT images showing the striatum of a human brain in the normal state and with Parkinson's disease; -
Figure 2 (a), (b) and (c) are enlarged SPECT images showing the disease progression of Parkinson's disease in a human brain; -
Figure 3 illustrates steps in an embodiment of the invention with reference to a SPECT scan of the human brain; -
Figures 4 (a) to (f) illustrate further steps in an embodiment of the invention, again with respect to SPECT scans of the human brain; -
Figures 5(a) and (b) illustrate further steps in the embodiment of the invention in which the disease progression is categorised and a surface is fitted to an average to the members of each category; -
Figure 6 illustrates a further step in an embodiment of the invention in which the health measures of left and right striata are plotted against each other; -
Figure 7 is a graph illustrating the health scores from sixteen scans of the striata; -
Figure 8 illustrates the fitting of a curve to the data sets ofFigure 7 ; -
Figure 9 is a flow chart illustrating the calculation of the health measures and disease progression in an embodiment of the invention; and -
Figure 10 is a flow chart illustrating the use of a training set to calculate the hyper-surface and disease progression curve used inFigure 9 . - An example of the invention will now be described with reference to characterising the progression of Parkinson's disease from SPECT scans of the striata as described above.
- In broad terms this embodiment consists of the following three steps:-
- 1) Compute a single score, for example a number between 0 and 1, indicating the health of each individual structure (the Health Measure) of, in this example, the left and right striata.
- 2) Use the two health measures to compute a further score, for example a percentage, representing the progression of the disease, where 0% is healthy and 100% is extremely degenerated (this may be termed the Disease Progression Percentage).
- 3) Compute confidence intervals indicating how confident the algorithm is in the estimation.
- Thus in the case of charactering Parkinson's disease a health measure is first computed for each striatum. The values of the health measure range from 1 to 0 where 1 indicates a healthy striatum and 0 indicates the most severe reduction in the level of uptake of the contrast agent. Although 1 and 0 are chosen in this example, obviously the range can be normalised between other values. These health measures, for the left and right striata, are then used to describe the disease progression. As Parkinson's disease progresses these two values will decrease in a characteristic way. This allows the calculation of the disease percentage.
- Turning first to the computation of the health measure for each striatum, the first aim is to characterise the level of uptake of the contrast agent at different points in the striatum. Given a conventional 3-D SPECT data set (which may, for example, consist of 128 axial slices), first the slices which include the striatum are found. In a typical data set the striatum is found in the 10 slices between
slices - Having selected a number of layers including the striatum, a single 2-D analysis slab is created by summing the layers together and normalising all the intensity values within the slab by dividing each pixel by an average background intensity value. This defines a very thick SPECT slice which includes all (or most) of the striatum. Normalisation is effective to ensure that factors such as variations in the amount of contrast agent given to the patient, total scan time or time between administering the contrast agent and performing the scan do not affect the overall brightness of the scan, thus confusing the analysis.
- Having normalised the intensity values in the thick slice, a Region of Interest (ROI) is positioned over the striatum such that the centre line of this ROI lies close to the central part of the striatum. This is shown in
Figure 3(a) . InFigure 3(a) a rectangular ROI is used, though ROIs of other shape, for exampled based on the expected shape of the striatum, can be used. In this example the Region of Interest is positioned by locating a short edge of the rectangle at the brightest part of the striatum (this may be located by positioning a larger search area over the striatum and searching for the brightest region within it) and orienting the long axis of the rectangle along the striatum. (The ROI may be positioned differently as long as the position can be consistently found in the image). - Next, as illustrated schematically in
Figure 3(b) , each point in the region of interest is projected onto a line defined through the region of interest (for example the centre line of the rectangle) by summing the intensity values (representing uptake of the contrast agent) over the width of the region of interest. This reduces noise and provides a one-dimensional representation of the uptake along the long axis of the striatum. This summed uptake value is graphed along the length of the striatum andFigures 4(a) to (c) illustrate three examples of regions of interest over SPECT scans withFigures 4(d) to (f) illustrating the corresponding summed values of intensity. The graphs begin at the short edge of the ROI which is positioned on the brightest point of the striatum and extend along the striatum towards the end of the putamen.Figure 4(a) shows a SPECT scan for a healthy striatum andFigure 4(d) the corresponding graphed intensity along the length of the striatum.Figures 4(b) and (e) show corresponding values for a striatum with a moderate to severe degeneration, andFigures 4(c) and (f) show values for a striatum with extreme degeneration. It can be seen that the values decrease into the putamen which is believed to be a characteristic of Parkinson's disease - the putamen dies off more quickly than the caudate. As the disease progresses the graph for a particular striatum gradually changes from a healthy graph inFigure 4(d) through the graph inFigure 4(e) to the extreme degeneration ofFigure 4(f) . Thus the position of a graph along this progression fromFigure 4(d) to Figure 4(f) is indicative of the health of the striatum and can be used to calculate a health measure. This is achieved in a quantitative way as described below. - A collection of test scans is taken which show different stages in the progression of the disease from healthy to extreme degeneration. Each scan includes two striata (the left and right) and each of the striata can be classified into one of five stages:-
- Stage 1: Healthy
- Stage 2: Mild degeneration
- Stage 3: Moderate degeneration
- Stage 4: Severe degeneration
- Stage 5: Extreme degeneration
- The choice of these five stages is not critical, more or fewer stages can be chosen according to the particular application. These test scans comprise the training set for the algorithm. Classifying each striatum into one of the stages is used to teach the algorithm the different stages in progression of the disease. Thus the algorithm can compute an optimal model to describe the reduction in uptake in the striatum as the disease progresses. For acceptable results a training set containing more than 100 scans should be used.
- The training of the algorithm involves taking the graphs which have been classified into the five stages above, and for each of the five stages computing an average graph to typify each stage. A set of five graphs for a typical training set is shown in
Figure 5(a) . The solid graph of Stage1: Healthy shows a gradual decrease in uptake along the striatum.Stages - It is important to note that the aim of this embodiment is not simply to classify a new striatum into one of these five stages. To accurately quantify progression, a health measure between 0 and 1 is to be computed, indicating where the striatum lies on the continuum between Stage 1: Healthy and Stage 5: Extreme degeneration. This is done by embedding the five graphs in a 3-dimensional space, where the third dimension is the health measure. The graphs are positioned between health measures of 0 and 1 on the basis of experience of what degree of progression a given category represents. One such positioning would be to position Stage 1: Healthy = health measure 1.0,
Stage 2 = health measure 0.75,Stage 3 = 0.5, Stage 4 = 0.25 and Stage 5: Extreme degeneration = 0.0. The embedding of the five graphs into a 3-dimensional space is shown inFigure 5(b) and then a surface, for example a cubic spline surface is fitted over the graphs. This fills in the gaps to provide an effectively continuous representation of the progression from healthy to extremely degenerated. - Having formed this representation, it is possible then to compare a given new scan requiring assessment to this representation by computing the uptake graph for the striatum and finding its best fit to the surface in
Figure 5(b) . For example the position having the smallest least-squares error can be selected, though different error measures can also be used. The appropriate health measure between 0 and 1 can then be read off. - A confidence value for the health measure can also be obtained from the error between the uptake graph for the particular striatum under consideration and the most similar graph in the continuum of graphs defined by the surface in
Figure 5(b) . A small error implies a high confidence in the measure. Thus this confidence value can be used to warn the clinician when an accurate measurement is not possible, for example due to artefacts in the imaging process. - Thus by using the steps above, for a given patient a value between 0 and 1 for a health measure for each of the left and right striata can be obtained. This measure is useful because it is quantitative, and also it is consistent in that it is judged by a reference to the progression in many other data sets forming the training set. Thus it gives a consistent and quantitative measurement of the state of the striata for that patient.
- These health measures can be used as described below to assess the level of disease progression for the patient. As indicated in the introduction, the left and right striata do not necessarily degenerate at the same rate and the asymmetry can be indicative of the degree of progression of the disease. To obtain a quantitative and consistent assessment of the state of progression of the disease, in this embodiment the health measures for the left and right striata are plotted as a single point on a graph as is illustrated in
Figure 6 , where the horizontal co-ordinate is given by the less active (sicker) striatum and the vertical co-ordinate is given by the more active (healthier) striatum, as illustrated below. A point in the top right-hand comer of this graph (1, 1) indicates that both striata are healthy. A point in the bottom left-hand comer (0, 0) indicates that both striata are extremely degenerated. A value of (0.3, 0.7) indicates severe degeneration in one striatum and mild degeneration in the other. - In order to obtain a curve representing an expected trajectory through this 2-D space, a database of test-cases covering all stages of the disease is taken. In
Figure 7 the health measure for both striata is plotted using a database of 16 cases, with the more active striatum being plotted against the less active striatum. Note that since the more active structure is plotted on the y-axis, no points will lie below the line y=x. - The distribution of points is clearly clustered along a curve. To estimate this curve, a quadratic is fitted to this data, minimising the sum of the normal distances from the data to the curve, as shown below in
Figure 8 . This curve indicates the path of disease progression. Note that the choice of using a quadratic fit was determined to be best for the particular application of Parkinson's disease, but any curve could be used instead as appropriate. Also other criteria for fitting the curve could be used, for example least-squares, modified least-squares or weighted least-squares etc. By projecting a given point corresponding to the health measures for the striata of a scan being analysed onto the curve (such a projection may be linear or non-linear) and measuring its parametric distance along the curve, the disease progression is quantified. This can be termed the disease progression percentage, where 0% corresponds to (1, 1), Healthy, and 100% corresponds to (0, 0), Extreme degeneration. - The perpendicular distance between the curve and any point gives a second confidence measure of how well the model fits this particular data - for large-distances, the algorithm is less confident of the disease progression.
- Given sufficient quantities of data, a probability density function (PDF) can be estimated, and from this PDF the distance can be computed between a point and the corresponding point on the curve. The likelihood assigned to a particular point can be used to calculate a confidence measure associated with the point.
- Thus this disease progression percentage is a single score which indicates the progression of the bilateral disease (in this case Parkinson's disease) and is associated with a confidence measure.
-
Figure 9 illustrates in summary how a given scan is analysed to produce the two health measures and then the disease progression percentage and associated confidence values once the algorithm has already been set up with training data to compute the spline surface (shown inFigure 5(b) ) and best-fit curve on the progression graph (shown inFigure 8 ). - Firstly, the health measures of the two regions must be computed:
-
Step 101. Place an appropriately shaped region of interest over each of the two structures. -
Step 102. Project each point in the ROI onto the central line of the ROI forming a 1D representation of the 2D ROI. -
Step 103. Compute the best-fit curve for each of these 1D lines from the previously computed spline surface, giving the health measure and a confidence measure of each match. - Once this is done, the disease progression is computed:
- Step 104. Plot the lowest of the two health measures on the x-axis against the highest on the y-axis of a 2D graph (the point must therefore lie above the line y = x).
- Step 105. Project the point perpendicularly onto the previously computed best-fit curve, giving a confidence measure of the error in the fit.
-
Step 106. Calculate the parametric distance of the projected point from the top-right point of the curve, giving the disease progression percentage. -
Figure 10 illustrates the training process mentioned above. Step 101 involves a series of steps in which the structures in a set of training scans are classified instep 111 into one of the categories mentioned above, and then insteps Figures 4 (d), (e) and (f) ) are calculated for each of the scans, and categorised according to the classification ofstep 111, thus linking the qualitative and quantitative assessments. Instep 102 the one dimensional representations are averaged in each category and instep 103 these are embedded in 3D positioned in the third dimension from 1: Healthy to 0: Extremely Degenerated and a hyper-surface is fitted to the curves to interpolate between them as shown inFigure 5(b) . In step 104 the best fit of each individual training scan to the surface is found and the health measure between 0 and 1 is read off. The two health measures are then plotted against each other (as shown inFigure 7 ) and in step 105 the best fitting curve is found which passes through (0,0) and (1,1). This curve is then used for assessing disease progression as in steps 105-106 ofFigure 9 .
Claims (32)
- A computer program comprising program code means for executing on a computer system a method of measuring the progression of Parkinson's disease, comprising- measuring uptake of imaging agent in respective striata of a brain;- determining respective health measure within a normalised range for each of the striata using measured uptake values;- defining a two-dimensional space representation with each dimension corresponding to one of the health measures;- predefining, in the two-dimensional space representation, a trajectory using health measures from a database of test cases covering all stages of Parkinson's disease, and points of the trajectory corresponding to certain stages of disease progression;- defining a point in the two-dimensional space representation representing the values of the health measures;- defining a projected point by projecting the defined point onto the predefined trajectory in the two-dimensional space representation; and- determining the measure of Parkinson's disease in the brain as the parametric distance of the projected point along the trajectory, wherein the parametric distance of the projected point is calculated from a first end of the trajectory representing a healthy brain, both striata being healthy.
- A computer program according to claim 1 wherein the defined point is projected normally onto the predefined trajectory.
- A computer program according to claim 1 or 2 wherein a level of confidence in the measure of the progression of Parkinson's disease is calculated from the distance of the defined point from the predefined trajectory.
- A computer program according to claim 1, 2 or 3 wherein the predefined trajectory is based on the measured progression of Parkinson's disease of a plurality of brains.
- A computer program according to claim 4 wherein the predefined trajectory is obtained by statistical analysis of the measured progression of Parkinson's disease of the database of test cases which thereby form a training set for the analysis.
- A computer program according to any one of the preceding claims wherein the position of the point compared to the predefined trajectory is expressed as a percentage of the distance along the trajectory from the first end of the trajectory representing a healthy brain to a second end of the trajectory representing completely progressed Parkinson's disease.
- A computer program according to any one of the preceding claims wherein the dimensions of the two-dimensional space representation are assigned to the different health measures in a defined order based on the relative values of the respective health measures.
- A computer program according to claim 7 wherein the defined order is from that representing the healthiest striatum to that representing the sickest striatum.
- A computer program according to claim 1 wherein the health measures are obtained by measuring the value of the uptake which progressively changes with time;
and wherein the method comprises the steps of:comparing the measured value of the uptake with a set of values comprising a plurality of values of the uptake derived from measurements displaying different degrees of progression of Parkinson's disease; andcalculating as said health measure the degree of progression represented by said measured value. - A computer program according to claim 9 wherein the set of values is obtained by a method comprising:categorising the measurements displaying different degrees of progression into a plurality of different categories of degree of progression;calculating a typical value for each category from the members of that category; andwherein the measured value is compared with said typical values.
- A computer program according to claim 10 wherein the method of obtaining the set of values further comprises:
interpolating the obtained typical values to obtain an effectively continuous representation of the progression with which the measured value is compared. - A computer program according to claim 11 wherein the step of interpolating the typical values comprises fitting a hyper-surface to said typical values represented in a parameter space, said hyper-surface constituting said effectively continuous representation, and said step of comparing the measured value of the uptake comprises finding the best fit of said measured value to said hyper-surface.
- A computer program according to any one of claims 9 to 12 wherein the health measure is expressed as a distance along a path from an initial state of said uptake to a final state of said uptake.
- A computer program according to any one of claims 9 to 13 wherein the measured value of the uptake is at least one of the temporal and spatial variation of the uptake in the human or animal body.
- A computer program according to any one of claims 9 to 14 wherein the uptake is represented by an image attribute in a medical image.
- A computer program according to claim 14 or 15 wherein dimensionality of said measured value is reduced by projecting and summation into a space with reduced dimensions.
- An apparatus adapted to execute a method of measuring the progression of Parkinson's disease, comprising- measuring uptake of imaging agent in respective striata of a brain;- determining respective health measure within a normalised range for each of the striata using measured uptake values;- defining a two-dimensional space representation with each dimension corresponding to one of the health measures;- predefining, in the two-dimensional space representation, a trajectory using health measures from a database of test cases covering all stages of Parkinson's disease, and points of the trajectory corresponding to certain stages of disease progression;- defining a point in the two-dimensional space representation representing the values of the health measures;- defining a projected point by projecting the defined point onto the predefined trajectory in the two-dimensional space representation; and- determining the measure of Parkinson's disease in the brain as the parametric distance of the projected point along the trajectory, wherein the parametric distance of the projected point is calculated from a first end of the trajectory representing a healthy brain, both striata being healthy.
- Apparatus according to claim 17 wherein the defined point is projected normally onto the predefined trajectory.
- Apparatus according to claim 17 or 18 wherein a level of confidence in the measure of the progression of Parkinson's disease is calculated from the distance of the defined point from the predefined trajectory.
- Apparatus according to claim 17, 18 or 19 wherein the predefined trajectory is based on the measured progression of Parkinson's disease of a plurality of brains.
- Apparatus according to claim 20 wherein the predefined trajectory is obtained by statistical analysis of the measured progression of Parkinson's disease of the database of test cases which thereby form a training set for the analysis.
- Apparatus according to any of claims 17-21 wherein the position of the point compared to the predefined trajectory is expressed as a percentage of the distance along the trajectory from the first end of the trajectory to a second end of the trajectory representing completely progressed Parkinson's disease.
- Apparatus according to any of claims 17-22 wherein the dimensions of the two-dimensional space representation are assigned to the different health measures in a defined order based on the relative values of the respective heath measures.
- Apparatus according to any of claims 17-23 wherein the defined order is from that representing the healthiest striatum to that representing the sickest striatum.
- Apparatus according to claim 17 wherein the health measures are obtained by measuring the value of uptake which progressively changes with time;
and wherein the method comprises the steps of:comparing the measured value of the uptake with a set of values comprising a plurality of values of the uptake derived from measurements displaying different degrees of progression of Parkinson's disease; andcalculating as said health measure the degree of progression represented by said measured value. - Apparatus according to claim 25 wherein the set of values is obtained by a method comprising:categorising the measurements displaying different degrees of progression into a plurality of different categories of degree of progression;calculating a typical value for each category from the members of that category; andwherein the measured value is compared with said typical values.
- Apparatus according to claim 26 wherein the method of obtaining the set of values further comprises:
interpolating the obtained typical values to obtain an effectively continuous representation of the progression with which the measured value is compared. - Apparatus according to claim 27 wherein the step of interpolating the typical values comprises fitting a hyper-surface to said typical values represented in a parameter space, said hyper-surface constituting said effectively continuous representation, and said step of comparing the measured value of the uptake comprises finding the best fit of said measured value to said hyper-surface.
- Apparatus according to any one of claims 25 to 28 wherein the health measure is expressed as a distance along a path from an initial state of said uptake to a final state of said uptake.
- Apparatus according to any one of claims 25 to 29 wherein the measured value of the property is at least one of the temporal and spatial variation of the property in the human or animal body.
- Apparatus according to any one of claims 25 to 29 wherein the uptake is represented by an image attribute in a medical image.
- Apparatus according to claim 31 wherein dimensionality of said measured value is reduced by projecting and summation into a space with reduced dimensions.
Applications Claiming Priority (2)
| Application Number | Priority Date | Filing Date | Title |
|---|---|---|---|
| GB0321901 | 2003-09-18 | ||
| GBGB0321901.1A GB0321901D0 (en) | 2003-09-18 | 2003-09-18 | Characterisation of progressive system dysfunction |
Publications (3)
| Publication Number | Publication Date |
|---|---|
| EP1519294A2 EP1519294A2 (en) | 2005-03-30 |
| EP1519294A3 EP1519294A3 (en) | 2005-04-06 |
| EP1519294B1 true EP1519294B1 (en) | 2021-08-25 |
Family
ID=29266240
Family Applications (1)
| Application Number | Title | Priority Date | Filing Date |
|---|---|---|---|
| EP04253908.0A Expired - Lifetime EP1519294B1 (en) | 2003-09-18 | 2004-06-29 | Characterisation of disease progression |
Country Status (3)
| Country | Link |
|---|---|
| US (1) | US7558680B2 (en) |
| EP (1) | EP1519294B1 (en) |
| GB (1) | GB0321901D0 (en) |
Families Citing this family (4)
| Publication number | Priority date | Publication date | Assignee | Title |
|---|---|---|---|---|
| GB0813372D0 (en) * | 2008-07-22 | 2008-08-27 | Siemens Medical Solutions | A confidence measure for comparing SUV between PET studies |
| US8687839B2 (en) * | 2009-05-21 | 2014-04-01 | Digimarc Corporation | Robust signatures derived from local nonlinear filters |
| JP6995642B2 (en) * | 2018-01-19 | 2022-01-14 | 日本メジフィジックス株式会社 | Image processing equipment, image processing methods and programs |
| US11966822B2 (en) | 2020-09-29 | 2024-04-23 | International Business Machines Corporation | Feature processing for machine learning |
Citations (1)
| Publication number | Priority date | Publication date | Assignee | Title |
|---|---|---|---|---|
| WO1994010903A1 (en) * | 1992-11-18 | 1994-05-26 | Kunig Horst E | Measuring myocardial impairment, dysfunctions, and sufficiency/insufficiency |
Family Cites Families (6)
| Publication number | Priority date | Publication date | Assignee | Title |
|---|---|---|---|---|
| US5191895A (en) | 1988-04-08 | 1993-03-09 | Koeltringer Peter | Method and apparatus for the diagnosis of polyneuropathy syndromes |
| US5406502A (en) | 1993-06-29 | 1995-04-11 | Elbit Ltd. | System and method for measuring the operation of a device |
| US5810011A (en) | 1996-02-27 | 1998-09-22 | Kunig; Sabine Vivian | Method and apparatus for measuring myocardial impairment and dysfunctions from efficiency and performance diagrams |
| US7031843B1 (en) * | 1997-09-23 | 2006-04-18 | Gene Logic Inc. | Computer methods and systems for displaying information relating to gene expression data |
| US6560354B1 (en) * | 1999-02-16 | 2003-05-06 | University Of Rochester | Apparatus and method for registration of images to physical space using a weighted combination of points and surfaces |
| US6402707B1 (en) * | 2000-06-28 | 2002-06-11 | Denupp Corporation Bvi | Method and system for real time intra-orally acquiring and registering three-dimensional measurements and images of intra-oral objects and features |
-
2003
- 2003-09-18 GB GBGB0321901.1A patent/GB0321901D0/en not_active Ceased
-
2004
- 2004-06-29 EP EP04253908.0A patent/EP1519294B1/en not_active Expired - Lifetime
- 2004-08-19 US US10/921,473 patent/US7558680B2/en active Active
Patent Citations (1)
| Publication number | Priority date | Publication date | Assignee | Title |
|---|---|---|---|---|
| WO1994010903A1 (en) * | 1992-11-18 | 1994-05-26 | Kunig Horst E | Measuring myocardial impairment, dysfunctions, and sufficiency/insufficiency |
Also Published As
| Publication number | Publication date |
|---|---|
| GB0321901D0 (en) | 2003-10-22 |
| EP1519294A3 (en) | 2005-04-06 |
| US7558680B2 (en) | 2009-07-07 |
| EP1519294A2 (en) | 2005-03-30 |
| US20050065734A1 (en) | 2005-03-24 |
Similar Documents
| Publication | Publication Date | Title |
|---|---|---|
| US11443433B2 (en) | Quantification and staging of body-wide tissue composition and of abnormal states on medical images via automatic anatomy recognition | |
| KR101503940B1 (en) | Tools for aiding in the diagnosis of neurodegenerative diseases | |
| Chang et al. | Performance measure characterization for evaluating neuroimage segmentation algorithms | |
| NL1024869C2 (en) | Method and system for measuring tissue changes relevant to disease. | |
| EP2661734B1 (en) | Automatic quantification of asymmetry | |
| US20090136107A1 (en) | Automatic Segmentation of the Heart and Aorta in Medical 3-D Scans Without Contrast Media Injections | |
| US20080069446A1 (en) | ROI-based assessment of abnormality using transformation invariant features | |
| US20110160546A1 (en) | System and method for volumetric analysis of medical images | |
| US20130251231A1 (en) | Medical image processing device | |
| WO2012151579A2 (en) | Systems and methods for analyzing in vivo tissue volumes using medical imaging data | |
| US20130156280A1 (en) | Processing system for medical scan images | |
| US8050734B2 (en) | Method and system for performing patient specific analysis of disease relevant changes of a disease in an anatomical structure | |
| EP4270305A1 (en) | Learning device, method, and program, and medical image processing device | |
| KR101162599B1 (en) | An automatic detection method of Cardiac Cardiomegaly through chest radiograph analyses and the recording medium thereof | |
| Moser et al. | Automated fetal brain extraction from clinical ultrasound volumes using 3D convolutional neural networks | |
| US8077937B2 (en) | Reproducible objective quantification method to segment white matter structures | |
| US7684602B2 (en) | Method and system for local visualization for tubular structures | |
| CN1399763A (en) | 3-D shape measurements using statistical curvature analysis | |
| US7558680B2 (en) | Characterisation of progressive system dysfunction | |
| CN120299735A (en) | A system and method for predicting radiation pneumonia after chest tumor radiotherapy | |
| Dovganich et al. | Automatic quality control in lung X-ray imaging with deep learning | |
| Sato et al. | Consideration of the method of image diagnosis with respect to frontal lobe atrophy | |
| CN119151967A (en) | Medical image analysis method and system based on flat scanning CT data | |
| US20220067928A1 (en) | Method for locating and characterizing bifurcations of a cerebral vascular tree, associated methods and devices | |
| Alonso et al. | Composite index for the quantitative evaluation of image segmentation results |
Legal Events
| Date | Code | Title | Description |
|---|---|---|---|
| PUAI | Public reference made under article 153(3) epc to a published international application that has entered the european phase |
Free format text: ORIGINAL CODE: 0009012 |
|
| PUAL | Search report despatched |
Free format text: ORIGINAL CODE: 0009013 |
|
| 17P | Request for examination filed |
Effective date: 20040712 |
|
| AK | Designated contracting states |
Kind code of ref document: A2 Designated state(s): AT BE BG CH CY CZ DE DK EE ES FI FR GB GR HU IE IT LI LU MC NL PL PT RO SE SI SK TR |
|
| AX | Request for extension of the european patent |
Extension state: AL HR LT LV MK |
|
| AK | Designated contracting states |
Kind code of ref document: A3 Designated state(s): AT BE BG CH CY CZ DE DK EE ES FI FR GB GR HU IE IT LI LU MC NL PL PT RO SE SI SK TR |
|
| AX | Request for extension of the european patent |
Extension state: AL HR LT LV MK |
|
| AKX | Designation fees paid |
Designated state(s): DE FR GB |
|
| 17Q | First examination report despatched |
Effective date: 20060928 |
|
| RAP1 | Party data changed (applicant data changed or rights of an application transferred) |
Owner name: SIEMENS MEDICAL SOLUTIONS USA, INC. |
|
| STAA | Information on the status of an ep patent application or granted ep patent |
Free format text: STATUS: EXAMINATION IS IN PROGRESS |
|
| RAP1 | Party data changed (applicant data changed or rights of an application transferred) |
Owner name: SIEMENS MEDICAL SOLUTIONS USA, INC. |
|
| REG | Reference to a national code |
Ref country code: DE Ref legal event code: R079 Ref document number: 602004055013 Country of ref document: DE Free format text: PREVIOUS MAIN CLASS: G06F0019000000 Ipc: G06K0009460000 |
|
| GRAP | Despatch of communication of intention to grant a patent |
Free format text: ORIGINAL CODE: EPIDOSNIGR1 |
|
| STAA | Information on the status of an ep patent application or granted ep patent |
Free format text: STATUS: GRANT OF PATENT IS INTENDED |
|
| RIC1 | Information provided on ipc code assigned before grant |
Ipc: G06K 9/46 20060101AFI20201207BHEP Ipc: G06K 9/32 20060101ALI20201207BHEP Ipc: G06T 7/00 20170101ALI20201207BHEP |
|
| INTG | Intention to grant announced |
Effective date: 20210112 |
|
| GRAJ | Information related to disapproval of communication of intention to grant by the applicant or resumption of examination proceedings by the epo deleted |
Free format text: ORIGINAL CODE: EPIDOSDIGR1 |
|
| STAA | Information on the status of an ep patent application or granted ep patent |
Free format text: STATUS: EXAMINATION IS IN PROGRESS |
|
| INTC | Intention to grant announced (deleted) | ||
| GRAP | Despatch of communication of intention to grant a patent |
Free format text: ORIGINAL CODE: EPIDOSNIGR1 |
|
| STAA | Information on the status of an ep patent application or granted ep patent |
Free format text: STATUS: GRANT OF PATENT IS INTENDED |
|
| INTG | Intention to grant announced |
Effective date: 20210423 |
|
| GRAS | Grant fee paid |
Free format text: ORIGINAL CODE: EPIDOSNIGR3 |
|
| GRAA | (expected) grant |
Free format text: ORIGINAL CODE: 0009210 |
|
| STAA | Information on the status of an ep patent application or granted ep patent |
Free format text: STATUS: THE PATENT HAS BEEN GRANTED |
|
| REG | Reference to a national code |
Ref country code: DE Ref legal event code: R081 Ref document number: 602004055013 Country of ref document: DE Owner name: SIEMENS MEDICAL SOLUTIONS USA, INC., MALVERN, US Free format text: FORMER OWNER: MIRADA SOLUTIONS LTD., OXFORD, OXFORDSHIRE, GB |
|
| AK | Designated contracting states |
Kind code of ref document: B1 Designated state(s): DE FR GB |
|
| REG | Reference to a national code |
Ref country code: GB Ref legal event code: FG4D |
|
| REG | Reference to a national code |
Ref country code: DE Ref legal event code: R096 Ref document number: 602004055013 Country of ref document: DE |
|
| REG | Reference to a national code |
Ref country code: DE Ref legal event code: R079 Ref document number: 602004055013 Country of ref document: DE Free format text: PREVIOUS MAIN CLASS: G06K0009460000 Ipc: G06V0030180000 |
|
| REG | Reference to a national code |
Ref country code: DE Ref legal event code: R097 Ref document number: 602004055013 Country of ref document: DE |
|
| PLBE | No opposition filed within time limit |
Free format text: ORIGINAL CODE: 0009261 |
|
| STAA | Information on the status of an ep patent application or granted ep patent |
Free format text: STATUS: NO OPPOSITION FILED WITHIN TIME LIMIT |
|
| 26N | No opposition filed |
Effective date: 20220527 |
|
| PGFP | Annual fee paid to national office [announced via postgrant information from national office to epo] |
Ref country code: FR Payment date: 20230619 Year of fee payment: 20 Ref country code: DE Payment date: 20220630 Year of fee payment: 20 |
|
| PGFP | Annual fee paid to national office [announced via postgrant information from national office to epo] |
Ref country code: GB Payment date: 20230710 Year of fee payment: 20 |
|
| REG | Reference to a national code |
Ref country code: DE Ref legal event code: R071 Ref document number: 602004055013 Country of ref document: DE |
|
| PG25 | Lapsed in a contracting state [announced via postgrant information from national office to epo] |
Ref country code: GB Free format text: LAPSE BECAUSE OF EXPIRATION OF PROTECTION Effective date: 20240628 |
|
| REG | Reference to a national code |
Ref country code: GB Ref legal event code: PE20 Expiry date: 20240628 |
|
| PG25 | Lapsed in a contracting state [announced via postgrant information from national office to epo] |
Ref country code: GB Free format text: LAPSE BECAUSE OF EXPIRATION OF PROTECTION Effective date: 20240628 |