EP1494453A2 - Halftone screen frequency and magnitude estimation for digital decscreening of documents - Google Patents
Halftone screen frequency and magnitude estimation for digital decscreening of documents Download PDFInfo
- Publication number
- EP1494453A2 EP1494453A2 EP04015497A EP04015497A EP1494453A2 EP 1494453 A2 EP1494453 A2 EP 1494453A2 EP 04015497 A EP04015497 A EP 04015497A EP 04015497 A EP04015497 A EP 04015497A EP 1494453 A2 EP1494453 A2 EP 1494453A2
- Authority
- EP
- European Patent Office
- Prior art keywords
- frequency
- magnitude
- screen
- estimation
- channels
- Prior art date
- Legal status (The legal status is an assumption and is not a legal conclusion. Google has not performed a legal analysis and makes no representation as to the accuracy of the status listed.)
- Withdrawn
Links
Images




Classifications
-
- G—PHYSICS
- G06—COMPUTING OR CALCULATING; COUNTING
- G06T—IMAGE DATA PROCESSING OR GENERATION, IN GENERAL
- G06T5/00—Image enhancement or restoration
- G06T5/20—Image enhancement or restoration using local operators
-
- H—ELECTRICITY
- H04—ELECTRIC COMMUNICATION TECHNIQUE
- H04N—PICTORIAL COMMUNICATION, e.g. TELEVISION
- H04N1/00—Scanning, transmission or reproduction of documents or the like, e.g. facsimile transmission; Details thereof
- H04N1/40—Picture signal circuits
- H04N1/40075—Descreening, i.e. converting a halftone signal into a corresponding continuous-tone signal; Rescreening, i.e. combined descreening and halftoning
Definitions
- the present invention relates generally to methods and systems for image processing, and more particularly to methods and systems for de-screening digitally scanned documents.
- halftone screens Almost all printed matter, except silver-halide photography, is printed using halftone screens.
- the need to estimate the halftone frequency and magnitude stems from the fact that almost all printed matter, with the exception of a few devices like dye-sublimation or silver-halide photography, is printed out using halftone screens.
- These halftones are very specific to the printing device and when scanned and re-halftoned may cause visible artifacts and/or unacceptable Moiré patterns if not properly removed.
- the suppression of halftones is especially important for color documents, since these are typically printed with four or more color separations containing slightly different screens at different angles and or frequencies, and these may interact with each other to cause undesirable spatial artifacts.
- the method and system utilizes one or more independent channels with different sensitivities (e.g., Max, High, and Low) to provide high quality frequency and magnitude estimation.
- the most sensitive channel (Max) derives the frequency estimate, and the remaining channels (e.g., High and Low) are combined to create the screen magnitude.
- the Max channel is the most sensitive and will usually report the existence of frequencies even when the screen is very weak. Therefore, the screen frequency must be additionally qualified by the screen magnitude.
- the screen magnitude can be interpreted as the level of confidence that the local neighborhood represents half-toned data.
- operation (a) comprises the operation of processing the contrast signal, the frequency estimate signal and the frequency estimate magnitude signal via at least one piecewise linear function block included in the pixel control module to produce the first control signal which includes information regarding which of the filter output signals are to be blended and the proportion of blending.
- operation (a) comprises the operation of processing the frequency estimate signal, the frequency estimate magnitude signal and a lowpass filtered version of the image signal, via a neutral logic block included in the pixel control module to produce a third control signal for controlling the neutrality of a current pixel.
- a channel exhibiting highest sensitivity derives the frequency estimate.
- the operation of detecting extrema is performed by using a structure pattern within a window, the structure pattern having two distinct sets of pixels arranged such that, for any line segment crossing the structure pattern, each of the two sets of pixels does not lie entirely on one side of the line segment.
- operation (a) further comprises the operation of searching for a maximum value within a window in the output of each of the special filters via a module included in each of the frequency detection modules.
- operation (a) further comprises the operations of sub-sampling and interpolating.
- operation (a) further comprises the operations of sub-sampling and dual interpolation having a maximum unit and a contrast unit and further interpolation and filtering for one or more of frequency channels.
- operation (a) comprises the operations of combining the outputs of one or more frequency detection modules and producing the frequency magnitude estimate signal, via a magnitude estimate module included in the screen estimate module.
- the estimator further comprises:
- FIG. 1 a block diagram of the method and system of the present invention is represented by a Screen Estimator Module SEM.
- the Screen Estimator Module is responsible for estimating the instantaneous halftone frequency and magnitude (strength) at the current pixel of interest.
- the Screen Estimator Module operates on an 8-bit source image Src 28 , and produces an 8-bit halftone frequency estimate Scf 70 , and an 8-bit halftone magnitude estimate Scm 72 .
- a De-Screen Module as described in Applicant's co-pending application, Docket D/A3010, relies on the information that is produced by the Screen Estimator Module in order to eliminate (filter out) the original halftone patterns from the original scanned image.
- the suppression of halftones is especially important for color documents, since these are typically printed with four or more color separations containing slightly different screens at different angles and or frequencies, and these may interact with each other to cause undesirable spatial artifacts.
- the Screen Estimator Module is comprised of one or more frequency estimation (e.g., Mx, Hi and Lo) working in parallel.
- the first Mx channel 30 is used for estimating the screen frequency Scf 70 .
- the remaining channels e.g., Hi 40 and Lo 50 , respectively
- the screen magnitude signal Scm 72 For high quality estimation of small point color-halftoned text, it may necessary to use two or more channels for the screen magnitude estimate in order to cover the desired frequency range of interest.
- the Screen Estimator Module SEM may use up to three frequency channels at different levels of sensitivities.
- the upper Mx channel 30 in FIG. 1 is tuned for maximum frequency sensitivity at the full source resolution and therefore is used for deriving the screen frequency estimate signal Scf 70.
- this channel is very sensitive and will usually report the existence of frequencies even when the screen is very weak. Therefore the screen frequency must be additionally qualified by the screen magnitude Scm 72 .
- the Hi channel 40 in FIG. 1 is tuned for moderate frequency sensitivity that is less sensitive than the Mx Channel 30 .
- the two Channels Mx 30 and Hi 40 operate at the full source resolution.
- the Lo channel 50 is also tuned for moderate sensitivity. However, in contrast to the Mx 30 and Hi 40 Channels, the Lo 50 Channel is operating on a sub-sampled signal, outputted from the triangular Lo Channel filter F3/2 56 at half the source resolution in each direction.
- the screen magnitude signal Scm 72 is derived from the analysis of one or more the frequency estimates that are produced by Hi 40 and Lo 50 Channels.
- Each frequency channel is made up of a plurality of Min-Max texture detectors MM3 31, 32 and 33 to be described below, followed by averaging filters 41, 42 and 52 respectively.
- the Mx 30 and Hi 40 Channel MM3 32 units operate on the single channel 8 bit incoming source signal Src 28 , while the Lo Channel MM3 32 operates on a sub-sampled signal at half the resolution.
- the Lo Channel F3/2 filter 56 is responsible for filtering and sub-sampling the source signal Src 28 by a factor of 2x in each direction and driving the Lo Channel MM3 unit 32 .
- the three MM3 Min-Max modules 31, 32 and 33 are used for finding peaks and valleys in the 2D input signal. Since the Mx 30 and Hi 40 Channels share the same Src input signal 28 , they duplicate the first stage calculations of a MM3 unit 32 . However, different thresholds are applied in the second stages of the two units producing the two independent results.
- the dotted line 27 in FIG. 1 is intended to serve as a reminder that the front-end portions of the two MM3 units 32 may be computed once and then shared.
- Min-Max detector units are basically examining the content of a 3x3 window centered on the current pixel of interest and analyzing, using adaptive thresholding, if the center pixel is significantly larger or smaller relative to its eight surrounding neighbors. If so, the center pixel is regarded to be a peak (if larger) or valley (if smaller) respectively. By counting the number of peaks and valleys per unit area, a measure of the local frequency is obtained.
- Each MM3 unit outputs 31, 32 and 33 have only 1 bit of precision, but each is scaled by a configuration factor DotGain prior to the first subsequent stage of filtering.
- Each unit operates one or more color channel of the input signal. However, in this embodiment only 1 channel, the luminance channel is used.
- the DotGain factor for the Lo channel 50 is divided by some factor, such as 4. Note this scaling can be postponed to the normalization step of the first subsequent filter by adjusting that stage's normalization factor.
- the outputs from the MM3 Min-Max detectors 31, 32 and 33 are passed through different averaging and sub-sampling filters.
- the spatial filter span in each case is twice the sub-sampling ratio minus one.
- the Mx Channel 30 uses a triangular 2D F63/32 filter 32 that reduces the bandwidth by a factor of 32x in each direction (approx. one-thousandth of the source bandwidth).
- the Hi Channel 40 MM3 output is applied to a cascade of two triangular 2D subsampling filters - the F31/16 filter 42 and F3/2 filter 46 .
- the output from the cascaded filtering units is also sub-sampled by a factor of 32x in each direction (16x in the first filter and 2x in the second), and therefore the output is at the same data rate as for the Mx Channel 30 .
- the Lo Channel 50 uses a cascade of two triangular 2D filters F15/8 52 and F3/2 46 .
- the output from the second filtering unit is also sub-sampled by a factor of 32x in each direction (2x first by F3/2 followed by 8x and 2x).
- the higher bandwidth data paths are noted in FIG. 1 using wide black lines for the source bandwidth, lighter lines for 1/16 the bandwidth, and thin black lines for 1/32 nd the bandwidth.
- the reduction factor is also specifically noted by the numbers.
- the magnitude estimates Hi 40 and Lo 50 Channels contain an additional smoothing/averaging F5 64 stage to further reduce spatial noise.
- the F5 units 64 are 5x5 triangular weight (non-subsampling) filters.
- the filtered outputs from these units are sent to inputs of their respective Dual Bilinear Interpolation units DBI 54 .
- the outputs are also are passed through the C3 contrast units 48 which search for the maximum difference in a 3x3 window centered on the current pixel.
- the C3 outputs become the c inputs to the DBI units 48, respectively.
- the Mx Channel 30 averaged at 1/32 resolution is sent to a bilinear interpolation unit SCF 36 .
- the 3 signals produced by each of the Hi 40 and Lo 50 Channels are sent to their respective DBI units 54 . These units perform dual bilinear interpolation to bring the sub-sampled input resolution back to the original source resolution.
- the a and c DBI inputs are at 1/32 resolution and the b inputs are at 1/16 resolution.
- the output bandwidth from the interpolation units is substantially higher than the input. For example, with the factor of 32x above, the interpolation units produce 1024 output pixels for each input pixel.
- the interpolated output of the Mx Channel 30 interpolation unit SCF 36 is the 8-bit estimated screen frequency Scf 70 .
- the outputs of the other channels such as Hi 40 and Lo 50 Channels Dual Interpolation units (Hi and Lo) are combined together in the Magnitude Estimate Module SCM 61 . Its output is the 8-bit estimated screen magnitude signal Scm 72 .
- the estimated screen frequency and magnitude signals Scf 70 and Scm 72 are exported to the De-Screen Module DSC and (Scm only) to the Segmentation Module SEG (both not shown). A more detailed description of the various elements of the Screen Estimator Module is provided below.
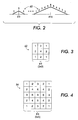
- FIG. 2 illustrates one-dimensional filter responses of various filter units and FIGS. 3-5 illustrates two-dimensional filter responses of various units.
- These Filtering Units are used for the purpose of smoothing or averaging the input signals to remove high frequencies.
- Each filter unit implements a square, separable and symmetric 2D FIR (Finite impulse response) filter.
- the filter response is identical in the horizontal and vertical directions. If the input to the filter is a color signal, the same filter response is independently applied on each one of the color components.
- the 1D filter 60 response has a symmetric triangular shape with integer coefficients as illustrated in FIG. 2 .
- the particular filter shape (but any other filter shapes are covered) was chosen for ease of implementation.
- the general filter form is referred to as an Fn/k filter, where n is the filter size (overall span in either x or y) and k is the amount of sub-sampling that is applied to the filtered output in each direction.
- FIGS. 1 and 2 Examples for the 1D and 2D filter response are illustrated in FIGS. 1 and 2 .
- FIG. 2 shows the non-normalized 1D filter 60 response for F3 and F11
- FIGS. 3 through 5 shows the resulting non-normalized 2-D coefficients for F3 62 , F5 64 , and F7 66 , respectively.
- the 2D filter response can be implemented by cascading two 1D filters in the horizontal and vertical directions.
- the filters are all operating at the full input data rate, but the output may be sub-sampled by a factor of k in each direction.
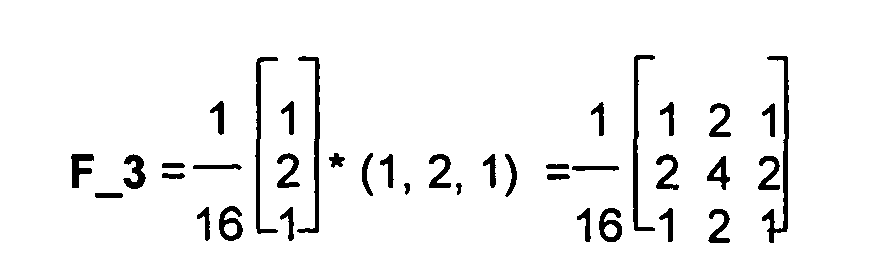
- the overall 2-D response of the smallest 3x3 filter, F3 62 is:
- the subsampling filters F3/2 F15/8 F31/16 and F63/32 all have power of 2 1D weights: 4,64,256 and 1024 respectively. So normalization is just a rounding right shift.
- the MX3 Max units 32 used in the Hi 40 and Lo 50 Channels search for the maximum value in a 3x3 window centered on the current pixel 74 of interest.
- the input is an 8-bit signal.
- the search for the max value is performed over the 9 pixels of the 3x3 window.
- This gray dilation module produces an 8-bit output that is made up of the largest pixel value 76 found within the boundaries of the search window.
- the MX3 max algorithm is illustrated in FIG. 6B.
- these C3 Contrast modules 48 are designed for measuring the amount of local contrast at the input.
- the contrast is defined as the difference between the largest and smallest pixel values within a window centered on the current pixel 74 of interest.
- the C3 Contrast units 48 utilize a window size of 3x3, centered on the current pixel 74 of interest.
- the input to the contrast units is an 8-bit signal.
- the contrast module produces an 8-bit monochrome output (single channel) 84.
- the operation of the C3 Contrast Units 48 is illustrated in FIG. 7B. The operation is as following: for each pixel location, the content of a 3x3 window is independently searched for the minimum and maximum pixel values.
- the three Min-Max Detection modules 31 , 32 and 33 are used for finding peaks and valleys in the input signal. By counting the number of peaks and valleys per unit area, a measure of the local frequency is obtained.
- Each one of the Mx 30 , Hi 50 and Lo 40 Channels uses a similar MM3 unit 31 , 32 and 33 . The one difference between the three units is that each unit uses a different set of thresholds to adjust the frequency sensitivity of the corresponding channel and the Lo Channel MM3 32 is operating at 1 ⁇ 4 the speed of the other two.
- All 3 units 31 , 32 and 33 operate on a one component gray source. Each unit utilizes 3x3 window to indicate when the center pixel is at an extreme value (either peak or valley) relative to its 8 neighbors, following the logic below.
- the output from each Min-Max Detection units 31 , 32 and 33 is a 1-bit signal indicating that the corresponding Src pixel is in an extreme value state (can be extended to other color channels as well).
- the MM3 Min-Max Detection structure is depicted in FIG. 8 .
- the outer ring of 8 pixels surrounding it (the current pixel of interest) is first analyzed.
- the 8 outer pixels are further divided into two sets of 4 pixels each as shown in FIG. 8.
- the partitioning of the outer ring into two sets is useful for reducing the likelihood of false alarms in detecting straight-line segments as halftones (since most commonly encountered halftones are likely to be clustered dots).
- the center pixel 74 value X is defined to be at a peak if it is [significantly] larger than the maximum pixel value of either set: If [( A max + Noise ⁇ X) AND ( B max ⁇ X )] return(1) Similarly, the center pixel 74 value X is defined to be at a valley if it is [significantly] smaller than the minimum pixel value from either set: If [( A min > X + Noise ) AND ( B min ⁇ X )] return(1)
- the above equations determine the two conditions where the output from the 3x3 detection window are set to 1; in all other cases the output will be set to 0.
- the Screen Frequency and Magnitude Module SEM makes use of one Bilinear Interpolation Unit SCF 36 and two Dual Bilinear Interpolation Units DBI 54.
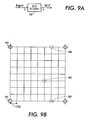
- the Single Interpolation Unit SCF 36 is applied to the high sensitivity frequency estimation Mx Channel 30 , as shown in FIG. 9A , to generate the screen frequency signal SCF 70 .
- the Hi 40 and Lo 50 Channel DBI Dual Interpolation Units 54 are used prior to combining them together to form the screen magnitude SCM 72 .
- the three interpolation modules interpolate (up-sample) the signal back to the source resolution.
- the input signals are up-sampled by a factor of 32 in each direction to restore it to the original resolution.
- the step size of the bilinear interpolation is 1/32 nd of the original pixel grid.
- the Single Interpolation Unit SCF 36 is applied on the sub-sampled output of the screen frequency estimator Mx Channel 30 .
- the purpose is to restore the Mx Channel 30 output to the full source resolution of the input to the Screen Estimator Module SEM.
- the Interpolation technique is based on a 2D bi-linear interpolation by a factor of 32x in each direction. After interpolation, the instantaneous screen frequency estimate signal SCF is forwarded to the De-Screen Module DSC.
- FIGS. 9A and 9B The block diagram of the Single Interpolation Unit SCF is shown FIGS. 9A and 9B.
- the thick lines in FIG. 9A note the higher output bandwidth.
- Both the input and output are 8-bit monochrome signals.
- the output is the 8-bit screen frequency estimate signal Scf 70 .
- FIG. 9B The operation of the Single Interpolation Units SCF 36 is illustrated at the FIG. 9B .
- the circled locations 88 and 90 indicate the location of the input pixels.
- the output pixels are located at the grid intersection points. Note that for simplicity, FIG. 9B only shows an interpolation factor of 8x in each direction, although the actual unit is required to support a factor of 32x in each direction.
- the step size for the bilinear interpolation is 1/32 nd of the original pixel grid. The details of implementation are straightforward.
- the Hi and Lo Channel DPI Dual Interpolation Units are similar to the Single Interpolation Unit SCF, except that there are two interpolation stages with an additional blending operation in the middle.
- the Structure of one of the Dual Interpolation Units is shown in FIG. 10 .
- the Dual Interpolation Units operate on 3 signals 94 , 96 and 98 generated in each of the Hi and Lo magnitude estimate channels.
- each Dual Interpolation Unit is composed of two interpolation stages 100 and 102, respectively.
- the first stage includes the interpolation 100 of the A 5 94 and C 5 98 inputs by 2x in each direction.
- the interpolation 100 uses a simple bi-linear interpolation technique.
- the A 5 input 94 corresponds to the output of the F5 filter 64 units.
- Note the subscripts in FIG. 10 correspond to the level of subsampling.
- the subscript 5 indicates that the signal has been subsampled 5 times by a factor of 1/2 (1/32 total).
- the C 5 input 98 corresponds to the output of the 3x3 contrast units. As indicated in FIG. 1, both of these inputs have been previously sub-sampled by a factor of 32x in each direction.
- the MagFineBIenVsCon function 106 above is a programmable function.
- the equations below incorporate this typical configuration value of MagFineBlenVsCon 106.
- BmA 4 B 4 - A 4
- BmAxC 4 (BmA 4 * MFB 4 ) >> 8
- the purpose of this arrangement is to refine the magnitude estimate in places where it is subject to change.
- the frequency magnitude estimate in one of the channels appears to be stable and constant, its value is used as the blended output. This happens due to the C 4 signal from the contrast measuring unit being close to zero, thereby selecting the A input.
- the C 4 signal increases, and the content of B 4 begins to influence the blended output.
- C 4 is proportional to the contrast, which is proportional to the magnitude of the derivative of the change. Therefore the resulting magnitude estimate is biased towards the direction of change once a certain level of change is detected.
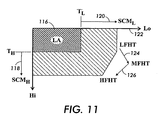
- FIG. 11 is a diagram illustrating the above equations and the clipping effect of the additional logic which limits the value of HTW to the allowed range.
- the region denoted as "LA" 116 represents the line-art region.
- one particular color screen pattern can change from the location indicated as LFHT to MFHT 124 to HFHT 126 as its frequency is changed from high to medium to low. Since the curve illustrated by the loci on the 2D plot is convex, it is not possible to distinguish the screen frequency by observing either LO or HI alone.
Landscapes
- Engineering & Computer Science (AREA)
- Multimedia (AREA)
- Signal Processing (AREA)
- Physics & Mathematics (AREA)
- General Physics & Mathematics (AREA)
- Theoretical Computer Science (AREA)
- Image Processing (AREA)
- Facsimile Image Signal Circuits (AREA)
- Image Analysis (AREA)
Abstract
Description
filtering the respective detected signals via respective cascades of averaging filters and outputting respective filtered detected signals.
For each set, the pixel values are compared among the members 78 and 86 of the set to determine the minimum and maximum values within each set independently:
Claims (10)
- A method for determining a screen frequency and magnitude estimation of an image signal, the method comprising the operations of:(a) estimating in one or more channels each exhibiting different sensitivities for providing high quality frequency and magnitude estimation;(b) combining one or more frequency estimation from independent channels to create frequency magnitude estimation.
- The method of Claim 1 wherein a channel exhibiting highest sensitivity derives the frequency estimate.
- The method of Claim 1 wherein operation (a) comprises the steps of:detecting extrema in an image signal and a second filter output signal via a min-max texture detector included in each of frequency detection modules, and outputting respective detected signals; andfiltering the respective detected signals via respective cascades of averaging filters and outputting respective filtered detected signals.
- The method of Claim 3 wherein the operation of detecting extrema is performed by using a structure pattern within a window, the structure pattern having two distinct sets of pixels arranged such that, for any line segment crossing the structure pattern, each of the two sets of pixels does not lie entirely on one side of the line segment.
- The method of Claim 4 wherein operation (a) further comprises the operation of searching for a maximum value within a window in the output of each of the special filters via a module included in each of the frequency detection modules.
- The method of Claim 5 wherein operation (a) further comprises the operations of sub-sampling and interpolating.
- The method of Claim 1 wherein operation (a) further comprises the operations of sub-sampling and dual interpolation having a maximum unit and a contrast unit and further filtering.
- The method of Claim 1 wherein operation (a) comprises the operations of combining the outputs of one or more frequency detection modules and producing the frequency magnitude estimate signal, via a magnitude estimate module included in the screen estimate module.
- A screen frequency and magnitude estimator comprising:(a) means for estimating in one or more channels each exhibiting different sensitivities for providing high quality frequency and magnitude estimation;(b) means for combining one or more frequency estimation from independent channels to create frequency magnitude estimation.
- A screen frequency and magnitude estimator comprising:(a) means for estimating in one or more channels each exhibiting different sensitivities for providing high quality frequency and magnitude estimation;(b) means for combining one or more frequency estimation from independent channels to create frequency magnitude estimation wherein a channel exhibiting highest sensitivity derives the frequency estimate.
Applications Claiming Priority (2)
| Application Number | Priority Date | Filing Date | Title |
|---|---|---|---|
| US612084 | 2003-07-01 | ||
| US10/612,084 US7375856B2 (en) | 2002-07-01 | 2003-07-01 | Halftone screen frequency and magnitude estimation for digital descreening of documents |
Publications (2)
| Publication Number | Publication Date |
|---|---|
| EP1494453A2 true EP1494453A2 (en) | 2005-01-05 |
| EP1494453A3 EP1494453A3 (en) | 2007-09-05 |
Family
ID=33435449
Family Applications (1)
| Application Number | Title | Priority Date | Filing Date |
|---|---|---|---|
| EP04015497A Withdrawn EP1494453A3 (en) | 2003-07-01 | 2004-07-01 | Halftone screen frequency and magnitude estimation for digital decscreening of documents |
Country Status (3)
| Country | Link |
|---|---|
| US (1) | US7375856B2 (en) |
| EP (1) | EP1494453A3 (en) |
| TW (1) | TWI329448B (en) |
Families Citing this family (15)
| Publication number | Priority date | Publication date | Assignee | Title |
|---|---|---|---|---|
| US7375856B2 (en) * | 2002-07-01 | 2008-05-20 | Xerox Corporation | Halftone screen frequency and magnitude estimation for digital descreening of documents |
| US7532363B2 (en) * | 2003-07-01 | 2009-05-12 | Xerox Corporation | Apparatus and methods for de-screening scanned documents |
| EP1531614B1 (en) * | 2003-11-14 | 2013-07-10 | STMicroelectronics S.A. | Image processing method for displaying an image with a reduced number of colours |
| US7636489B2 (en) * | 2004-04-16 | 2009-12-22 | Apple Inc. | Blur computation algorithm |
| US20060001597A1 (en) * | 2004-06-30 | 2006-01-05 | Sokbom Han | Image processing apparatus, systems and associated methods |
| US7542164B2 (en) * | 2004-07-14 | 2009-06-02 | Xerox Corporation | Common exchange format architecture for color printing in a multi-function system |
| US20060027657A1 (en) * | 2004-08-04 | 2006-02-09 | Laurens Ninnink | Method and apparatus for high resolution decoding of encoded symbols |
| US7840477B2 (en) * | 2005-06-07 | 2010-11-23 | Bgc Partners, Inc. | System and method for routing a trading order based upon quantity |
| US20070146794A1 (en) * | 2005-12-23 | 2007-06-28 | Lexmark International, Inc. | Descreening and detail enhancement for scanned documents |
| US7656556B2 (en) * | 2007-02-28 | 2010-02-02 | Xerox Corporation | Detection of a differential gloss region in a cluster-screen halftone image using filters each having a different polarization |
| US7826676B2 (en) * | 2007-03-08 | 2010-11-02 | Mitsubishi Electric Research Laboraties, Inc. | Method for filtering data with arbitrary kernel filters |
| US8111918B2 (en) * | 2008-10-20 | 2012-02-07 | Xerox Corporation | Segmentation for three-layer mixed raster content images |
| US8565531B2 (en) * | 2009-10-09 | 2013-10-22 | Xerox Corporation | Edge detection for mixed raster content (MRC) images for improved compression and image quality |
| US9147262B1 (en) * | 2014-08-25 | 2015-09-29 | Xerox Corporation | Methods and systems for image processing |
| US9288364B1 (en) | 2015-02-26 | 2016-03-15 | Xerox Corporation | Methods and systems for estimating half-tone frequency of an image |
Family Cites Families (23)
| Publication number | Priority date | Publication date | Assignee | Title |
|---|---|---|---|---|
| US4849914A (en) * | 1987-09-22 | 1989-07-18 | Opti-Copy, Inc. | Method and apparatus for registering color separation film |
| US5515452A (en) * | 1992-12-31 | 1996-05-07 | Electroglas, Inc. | Optical character recognition illumination method and system |
| US5638134A (en) * | 1994-06-29 | 1997-06-10 | Sony Corporation | Digital filter for picture data and digital filter system |
| US5583659A (en) | 1994-11-10 | 1996-12-10 | Eastman Kodak Company | Multi-windowing technique for thresholding an image using local image properties |
| US5745596A (en) * | 1995-05-01 | 1998-04-28 | Xerox Corporation | Method and apparatus for performing text/image segmentation |
| US5822451A (en) * | 1996-06-05 | 1998-10-13 | Eastman Kodak Company | Method for halftoning a multi-channel digital color image |
| US5900953A (en) * | 1997-06-17 | 1999-05-04 | At&T Corp | Method and apparatus for extracting a foreground image and a background image from a color document image |
| US6058214A (en) * | 1998-01-20 | 2000-05-02 | At&T Corp. | Compression of partially masked still images |
| US6549658B1 (en) * | 1998-01-21 | 2003-04-15 | Xerox Corporation | Method and system for classifying and processing of pixels of image data |
| US6400844B1 (en) * | 1998-12-02 | 2002-06-04 | Xerox Corporation | Method and apparatus for segmenting data to create mixed raster content planes |
| US6324305B1 (en) * | 1998-12-22 | 2001-11-27 | Xerox Corporation | Method and apparatus for segmenting a composite image into mixed raster content planes |
| US6734991B1 (en) * | 1999-09-24 | 2004-05-11 | Xerox Corporation | Method and apparatus for determining halftone line frequency estimates using MIN/MAX detection |
| US6633670B1 (en) * | 2000-03-31 | 2003-10-14 | Sharp Laboratories Of America, Inc. | Mask generation for multi-layer image decomposition |
| US20030197878A1 (en) * | 2002-04-17 | 2003-10-23 | Eric Metois | Data encoding and workpiece authentication using halftone information |
| US7031518B2 (en) * | 2002-07-01 | 2006-04-18 | Xerox Corporation | Segmentation method and system for Multiple Raster Content (MRC) representation of documents |
| US7200263B2 (en) * | 2002-07-01 | 2007-04-03 | Xerox Corporation | Background suppression and color adjustment method |
| US6983076B2 (en) * | 2002-07-01 | 2006-01-03 | Xerox Corporation | Control system for digital de-screening of documents |
| US6859204B2 (en) * | 2002-07-01 | 2005-02-22 | Xerox Corporation | Dynamic threshold system for multiple raster content (MRC) representation of documents |
| US6987882B2 (en) * | 2002-07-01 | 2006-01-17 | Xerox Corporation | Separation system for Multiple Raster Content (MRC) representation of documents |
| US7218418B2 (en) * | 2002-07-01 | 2007-05-15 | Xerox Corporation | Digital de-screening of documents |
| US7375856B2 (en) * | 2002-07-01 | 2008-05-20 | Xerox Corporation | Halftone screen frequency and magnitude estimation for digital descreening of documents |
| US7532363B2 (en) * | 2003-07-01 | 2009-05-12 | Xerox Corporation | Apparatus and methods for de-screening scanned documents |
| US7365882B2 (en) * | 2004-02-12 | 2008-04-29 | Xerox Corporation | Halftone screen frequency and magnitude estimation for digital descreening of documents |
-
2003
- 2003-07-01 US US10/612,084 patent/US7375856B2/en not_active Expired - Lifetime
-
2004
- 2004-01-02 TW TW093100008A patent/TWI329448B/en not_active IP Right Cessation
- 2004-07-01 EP EP04015497A patent/EP1494453A3/en not_active Withdrawn
Also Published As
| Publication number | Publication date |
|---|---|
| TWI329448B (en) | 2010-08-21 |
| US7375856B2 (en) | 2008-05-20 |
| EP1494453A3 (en) | 2007-09-05 |
| TW200507622A (en) | 2005-02-16 |
| US20040051909A1 (en) | 2004-03-18 |
Similar Documents
| Publication | Publication Date | Title |
|---|---|---|
| US7218418B2 (en) | Digital de-screening of documents | |
| US7375856B2 (en) | Halftone screen frequency and magnitude estimation for digital descreening of documents | |
| US7936941B2 (en) | Apparatus for clearing an image and method thereof | |
| US7391933B2 (en) | Method and apparatus for image interpolation based on adaptive polyphase filters | |
| US6983076B2 (en) | Control system for digital de-screening of documents | |
| Kite et al. | A fast, high-quality inverse halftoning algorithm for error diffused halftones | |
| EP0641508B1 (en) | Method and apparatus for enhancing sharpness of a sequence of images subject to continuous zoom | |
| US6689060B2 (en) | System and method for re-orderable nonlinear echo processing | |
| JP4662696B2 (en) | Method and system for separating an image signal into a set of image planes | |
| US7110044B2 (en) | Image detail enhancement system | |
| KR100206319B1 (en) | Method and apparatus for improving local contrast of video signal | |
| US6185336B1 (en) | Method and system for classifying a halftone pixel based on noise injected halftone frequency estimation | |
| EP1564984A2 (en) | Halftone screen frequency and magnitude estimation for digital descreening of documents | |
| KR100565065B1 (en) | Method and apparatus for image detail enhancement using filter bank | |
| US7433084B2 (en) | Digital de-screening technique for scanned documents | |
| EP1564983A1 (en) | Apparatus and methods for de-screening scanned documents | |
| Rieder et al. | New concepts on denoising and sharpening of video signals | |
| JP2005198219A (en) | Estimation of frequency and amplitude of halftone screen for digital screening cancel of document | |
| TWI353166B (en) | Digital de-screening of documents | |
| Okamoto et al. | Super-resolution of digital images with data-dependent biasing | |
| JPH10248016A (en) | Restoration image generation filtering method | |
| Arce | Nonlinear Filtering for Image | |
| WO2006120585A2 (en) | Image enhancement | |
| JPH048089A (en) | Interpolation device for offset sampling signal |
Legal Events
| Date | Code | Title | Description |
|---|---|---|---|
| PUAI | Public reference made under article 153(3) epc to a published international application that has entered the european phase |
Free format text: ORIGINAL CODE: 0009012 |
|
| AK | Designated contracting states |
Kind code of ref document: A2 Designated state(s): AT BE BG CH CY CZ DE DK EE ES FI FR GB GR HU IE IT LI LU MC NL PL PT RO SE SI SK TR |
|
| AX | Request for extension of the european patent |
Extension state: AL HR LT LV MK |
|
| PUAL | Search report despatched |
Free format text: ORIGINAL CODE: 0009013 |
|
| AK | Designated contracting states |
Kind code of ref document: A3 Designated state(s): AT BE BG CH CY CZ DE DK EE ES FI FR GB GR HU IE IT LI LU MC NL PL PT RO SE SI SK TR |
|
| AX | Request for extension of the european patent |
Extension state: AL HR LT LV MK |
|
| 17P | Request for examination filed |
Effective date: 20080305 |
|
| 17Q | First examination report despatched |
Effective date: 20080411 |
|
| AKX | Designation fees paid |
Designated state(s): DE FR GB |
|
| STAA | Information on the status of an ep patent application or granted ep patent |
Free format text: STATUS: THE APPLICATION IS DEEMED TO BE WITHDRAWN |
|
| 18D | Application deemed to be withdrawn |
Effective date: 20081022 |