BACKGROUND OF THE INVENTION
1. Field of the Invention
-
This invention relates generally to a system and method for
detecting constituents in a sample and, more particularly, to a system and
method for detecting certain chemical or biological constituents in a sample,
where the background in the field-of-view of a spectrometer in the system is cold
or hot relative to the temperature of the sample.
2. Discussion of the Related Art
-
It is known in the art to detect certain constituents in a sample, such
as a chemical cloud in the air, by spectral analysis of the molecules in the
sample. This type of detection has many applications, including detecting natural
gas leaks from underground pipes, chemical clouds from chemical spills, volatile
organic vapor from chemical processes, pollution from smoke stacks, military
chemical warfare agents, biological aerosols and bacteria, explosives or illegal
drugs, and other chemical or biological materials of interest. Some of these
applications require detection sensitivity in the sub-ppb (parts per billion) level.
-
Sometimes this type of spectral analysis of a sample is performed
remotely, such as up to several km away, because the constituents in the sample
may be toxic, and thus a threat to health, or it may not be possible to directly
detect the sample. The distance the detecting instrument has to be from the
sample for remote passive sensing depends on the particular application, and
different systems exist for different applications.
-
To perform this type of detection and analysis, a spectrometer,
such as a Fourier transform infrared (FTIR) spectrometer, is directed towards the
sample containing the possible material of interest, so that it passively receives
emissions therefrom. Generally, the spectrometer detects emissions in the
infrared wavelengths, 5-25 µm. If the sample is warmer than the background,
such as sky, mountains or other terrain, along the field-of-view of the
spectrometer, target molecules in the sample will exhibit emissions having an
energy greater than the background emissions. If the sample is colder than the
background, target molecules in the sample will exhibit absorptions having an
energy less than the background emissions. If the sample is the same
temperature as the background, the target molecules within the sample are
absorbing photons at the same rate that they are emitting photons, so there is no
discernable net emission from the sample. As the thermal contrast between the
sample and the background increases, more net emissions are available to be
received by the spectrometer.
-
A spectral display generated by the spectrometer from the
emissions provides emission bands at certain wavelengths that is indicative of
the molecules in the sample. Because each material has its own spectral
"fingerprint" representative of its molecules, the detected spectral display can be
compared to a known spectral fingerprint of a particular chemical or biological
material of interest to determine if that material exists in the sample, and if so, at
what level.
-
A problem exists with the known passive remote sensing
techniques that are currently being used in the art because the thermal contrast
between the sample and the background is often very small. For example, the
temperature of a suspected chemical or biological cloud is generally only about
2-3°C warmer than the temperature of the background. Because there is such a
small temperature difference, the detectable emissions from the cloud are
typically very weak. This results in a poor signal-to-noise ratio, and thus, poor
detection sensitivity and possibly a high false alarm rate.
-
U.S. Patent 6,531,701, titled Remote Trace Gas Detection and
Analysis, assigned to the Assignee of this application and herein incorporated by
reference, addresses this problem. In the '701 patent, the system employs a
radiation beam to radiate a sample, such as a chemical cloud, to increase its
temperature relative to the background. The wavelength of the radiation beam is
selected to be in resonance with a particular target molecule in the cloud, or in a
resonance with water vapor or oxygen atoms commonly present in air. The
resonance causes the target molecules, water vapor or oxygen molecules to
rotate or vibrate, which causes their energy to increase. The radiation energy is
thermalized due to collision energy transfer causing inter-molecular relaxation.
These factors increase the temperature of the cloud relative to the surrounding
background that causes the emission intensity of the molecules in the cloud to
increase resulting in improved detection. The emissions are collected and
analyzed by a spectrometer.
-
An absorption technique is commonly used in the art for the
analysis of samples, such as vapor samples, liquid samples, solid samples, etc.,
in the laboratory. Radiation from a high-temperature source is transmitted
through the sample, and the transmitted radiation is spectrally resolved by a
spectrometer. The absorption by the sample as the difference between the
transmitted radiation and the incident radiation is measured.
-
In an absorption technique, the sensitivity to detect certain
constituents in the sample is limited by the systems ability to resolve the
difference between the incident radiation and the transmitted radiation at the
frequency fingerprint of the constituent. In other words, the detection sensitivity
is determined by the systems ability to resolve a small absorption signal from a
large incident radiation signal. Also, solid samples need to be ground into fine
powders and mixed with a suitable index-matching liquid medium or potassium
bromide powder. Further, the sample needs to be provided with a uniform
thickness in a sample cell without voids across the sample. If voids are present,
light that leaks through the sample can introduce errors in the measurement.
Thus, extensive sample preparation is required in the known absorption
methods.
-
An absorption technique is also known in the art to measure the
effluence of a high performance liquid chromatograph (HPLC), a common
analytical instrument for the analysis of a liquid sample. In many known systems,
the detection sensitivity is marginal because the amount of the effluence from an
HPLC is often very small.
-
Currently, there is no suitable technique for the spectral analysis of
particulate aerosols, bio-aerosols or liquid aerosols in situ in the air. An infrared
absorption method cannot be readily used because of the overwhelming
interference from the light scattered by the aerosols.
SUMMARY OF THE INVENTION
-
In accordance with the teachings of one embodiment of the present
invention, a system for detecting and analyzing constituents in a sample is
disclosed. The system includes a spectrometer for passively receiving emissions
from the sample to detect the constituents therein. A telescope or other optical
device can be used to define the field-of-view of the spectrometer. A cold device,
such as a cold dewar or an electrically powered cooler, is positioned within the
field-of-view of the spectrometer at an opposite side of the sample from the
spectrometer. The cold device provides a low temperature background relative
to the temperature of the sample so as to increase the thermal contrast, and
thereby increasing the emissions from the sample. Furthermore, the background
emission, as received by a spectrometer, is very low because of the presence of
the cold device. Hence, the emission from the constituents in a sample can be
precisely resolved by the spectrometer in the low or near absence of the
background emission. Optical elements can be provided to focus the field-of-view
of the spectrometer to a small area, so that a relatively small cold target is
adequate for the application.
-
According to another embodiment of the present invention, another
system for detecting and analyzing constituents in a sample is disclosed. The
system includes a spectrometer and an electromagnetic radiation source. A
telescope or other optical device can be employed to define the filed-of-view of
the spectrometer. The electromagnetic radiation source can be a laser or a
microwave source. The radiation source is used to irradiate a background target
behind the sample along the field-of-view of the spectrometer. The irradiation
heats the background target, thereby raising the temperature of the background
target relative to the sample. The spectrometer is used to resolve the absorption
spectrum as the emissions from the warmer background target passing through
the sample.
-
Additional advantages and features of the present invention will
become apparent from the following description and appended claims, taken in
conjunction with the accompanying drawings.
BRIEF DESCRIPTION OF THE DRAWINGS
-
Figure 1 is a plan view of a detection and analysis system for
detecting constituents in a sample of a chemical or biological material confined in
a sample chamber, where the system includes a cold device for providing a cold
background, according to an embodiment of the present invention;
-
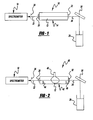
Figure 2 is a plan view of a detection and analysis system for
detecting constituents in a sample of a chemical or biological material by
aerosolizing the sample in a sample chamber, where the system includes a cold
device for providing a cold background, according to another embodiment of the
present invention;
-
Figure 3 is a plan view of a detection and analysis system for
standoff detecting vapor and aerosols of chemical or biological materials in the
air, where the system includes a cold device for providing a cold background,
according to another embodiment of the present invention;
-
Figure 4 is a plan view of a detection and analysis system for
detecting fine powders and liquids of chemical and biological materials on a
transmission window, where the system includes a cold device for providing a
cold background, according to another embodiment of the present invention;
-
Figure 5 is a graph with intensity on the vertical axis and
wavelength on the horizontal axis showing the emission spectrum for an ambient
background and a cold background;
-
Figure 6 is a graph with radiance on the vertical axis and
wavelength on the horizontal axis showing the emission spectrum for theoretical
blackbody radiation emissions from a 23°C ambient background, a thermal
electric cooler at 133 K and liquid nitrogen at 77 K;
-
Figure 7 is a graph with intensity on the vertical axis and
wavelength on a horizontal axis showing the emission spectrum of SF6 at 0.015
Torr and the background emission spectrum;
-
Figure 8 is a graph with percent of emissions or absorption on the
vertical axis and pressure on the horizontal axis showing a comparison of
emission and absorption measurements as functions of SF6 vapor pressure at
10.58 µm;
-
Figure 9 is a graph with percent of emissions above background on
the vertical axis and wavelength on the horizontal axis showing the emission
spectrum of SF6 in SF6/N2 mixtures with a liquid-nitrogen cold background for
several quantities of SF6 at a pressure of 700 Torr;
-
Figure 10 is a graph with percent of emissions above background
on the vertical axis and wavelength on the horizontal axis showing the emission
spectrum of dimethyl-methylphosphonate (DMMP) with a liquid nitrogen
background at several pressures;
-
Figure 11 is a graph with percent of emissions or absorption on the
vertical axis and DMMP vapor pressure on the horizontal axis showing a
comparison of emission and absorption measurements as functions of DMMP
vapor pressure at 9.512 µm;
-
Figure 12 is a graph with radiance on the vertical axis and
wavelength on the horizontal axis showing the emission spectrum of several fine
powders;
-
Figure 13 is a graph with radiance relative to soot on the vertical
axis and wavelength on the horizontal axis showing the emission spectrum of
several fine powders ratioed to soot;
-
Figure 14 is a graph with radiance on the vertical axis and wave
number on the horizontal axis showing the emission spectrum of a fine powder of
fluorescein;
-
Figure 15 is a graph with the radiance on the vertical axis and
wavelength on the horizontal axis showing the emission spectrum of a BG
aerosol and BG collected on a window;
-
Figure 16 is a graph with radiance on the vertical axis and
wavelength on the horizontal axis showing the emission spectrums of liquid
DMMP and liquid methyl salicylate;
-
Figure 17 is a graph with radiance on the vertical axis and
wavelength on the horizontal axis showing the emission spectrum of liquid
aerosols of tributal phosphate and silicone oil; and
-
Figure 18 is a plan view of a detection and analysis system for
detecting chemical or biological material constituents in a cloud, where system
includes a laser source to heat a background target.
DETAILED DESCRIPTION OF THE INVENTION
-
The following discussion of the invention directed to a system for
detecting constituents of a sample against a cold background or a heated
background is merely exemplary in nature, and is in no way intended to limit the
invention or its application or uses.
-
Figure 1 is plan view of a detection and analysis system 10 for
detecting the constituents in a sample 12 confined within a sample chamber 14.
As will be discussed herein, the sample 12 can be of chemical and biological
materials in the form of vapor or aerosol. The system 10 detects and analyzes
the chemical vapors, liquid aerosols or biological aerosols in the air by sampling
and following the air through the sample chamber 14. In one embodiment, the
chamber 14 is a glass chamber, but can be any chamber suitable for the
purposes discussed herein. A spectrometer 18 is positioned relative to the
chamber 14 so that passive emissions 22 from the sample 12 emitted through a
window 20 in the chamber 14 are received by the spectrometer 18. In one
embodiment, the emissions 22 are infrared emissions in the range of 5-25 µm.
As discussed above, the spectrometer 18 separates the emissions 22 into its
constituent wavelengths in a spectral display to identify the fingerprint of
particular constituents therein.
-
The spectrometer 18 can be any spectrometer suitable for the
purposes discussed herein. For example, the spectrometer 18 can be an FTIR
spectrometer, a grating tuned spectrometer, an opto-acoustic spectrometer, a
circular variable filter spectrometer, a linear variable spectrometer, a MEMS
spectrometer, etc. Alternatively, a spectral imager can be used instead of the
spectrometer 18 to resolve not only the emission spectrum of the emissions 22,
but also the spatial distribution of the emissions 22 to aid in resolving the
emissions 22 from a background scene.
-
The field-of-view 24 of the spectrometer 18 is confined by an
aperture 26. According to the invention, a cold device, here a liquid-nitrogen
dewar 28, is placed in the field-of-view 24 of the spectrometer 18 at an opposite
side of the chamber 14 from the spectrometer 18, as shown. Liquid-nitrogen
dewars typically have a temperature of about 77K. The cold device can be any
cold device suitable for the purposes described herein, such as liquid nitrogen,
an electrically powered cooler, such as a thermal electric cooler, a cryogenic
cooler, etc. A mirror 30 is used to direct the field-of-view 24 of the spectrometer
18 downward into the dewar 28, as shown.
-
A window 32 is provided on an opposite side of the chamber 14
from the window 20 to allow the dewar 28 to be in the background of the field-of-view
of the spectrometer 18. The windows 20 and 32 should have a high
transmission and low reflectance for the passive emissions in the wavelength
range of interest, for example, 5-25 µm. This is desirable so that passive
emissions from the windows 20 and 32 themselves do not adversely affect the
spectral display of the sample 12. Further, the windows 20 and 32 should be
made of a material that has a low scattering of ambient light. Examples of
suitable windows include polished salt windows, such as potassium bromide,
potassium iodine or sodium chloride, anti-reflective (AR) coated zinc selenide
(ZnSe) windows, etc. For some samples, the windows 20 and 32 can be
removed, where the ends of the chamber 14 are open so that passive emissions
from the windows 20 and 32 do not affect the measurements.
-
The cold background target in the field-of-view 24 of the
spectrometer 18 provides the temperature differential between the background
and the sample 12 that increases the emissions 22 from the sample 12 in the
manner as discussed above. Further, there is a low or near absence of
emissions from the cold background. Therefore, instead of heating the sample
as was done in the '701 patent, one embodiment of the present invention
proposes cooling the background relative to the temperature of the sample 12 to
achieve the same type of effect.
-
Measurement procedures are employed for the system 10.
Particularly, a background emission spectrum without the sample 12 in the
chamber 14 is measured by the spectrometer 18. A sample emission spectrum
is then measured by the system 10 with the sample 12 in the chamber 14. An
emission spectrum is then obtained by subtracting the sample spectrum from the
background spectrum. The emission spectrum can further be calibrated into an
absolute concentration unit by the radiation output from a blackbody source at a
known temperature. Measurement times of the constituents in the sample 12,
according to the invention, are on the order of 20 ms to about 1 minute.
-
Figure 2 is a plan view of a detection and analysis system 40,
according to another embodiment of the present invention, similar to the system
10, where like elements are identified by the same reference numeral. In this
embodiment, the chamber 14 is a sample chamber 42 that includes fans 44 and
46 to agitate the sample 12. This embodiment has particular application for
detecting the constituents of a powder sample by aerosolizing the powder
sample. In one embodiment, a fine powder, such as Bacillus Globigii (BG)
spores, Cab-O-Sil (SiO2), etc., is the sample 12 placed in the chamber 42. The
fans 44 and 46 blow the fine powder into an aerosol that circulates inside the
chamber 42. Alternatively, a nebulizer 48 can be used to generate liquid
aerosols from liquid samples within the chamber 42.
-
Figure 3 is a plan view of a detection and analysis system 52
similar to the systems 10 and 40 above, where like elements are represented by
the same reference number, according to another embodiment of the invention.
In this embodiment, the system 52 is detecting a chemical or biological
containing cloud 56 in the air remotely from the spectrometer 18. The sample
cloud 56 can be any chemical vapor, air-borne powder, chemical aerosols or bio-aerosols,
etc. that may be present in the air. A telescope 58 collects emissions
60 from the cloud 56, and focuses the emissions 60 onto an entrance aperture of
the spectrometer 18. In this embodiment, the telescope 58 is a cassegrain type
telescope including a parabolic mirror 62 and a center reflector 64. However,
other types of telescopes, such as Newtonian telescopes, can also be used.
-
The telescope 58 also acts as a collimator to focus and direct the
field-of-view 24 of the spectrometer 18 relative to a cold device 68. As above,
the cold device 68 can be any cold device suitable for a particular application. A
parabolic mirror 70, or other suitable collimator, is employed to focus the field-of-view
24 of the spectrometer 18 onto the cold device 68. The mirror 70 allows a
relatively wide field-of-view 24 of the spectrometer 18 to be focused onto a
relatively small surface. Thus, the distance between the spectrometer 18 and the
cold device 68 can be relatively long to provide standoff detection of the sample
cloud 56.
-
Figure 4 is a plan view of a detection and analysis system 76
similar to the system 10, where like elements are represented by the same
reference number, according to another embodiment of the present invention. In
this embodiment, the chamber 14 has been replaced with a transmission sample
window 78. The transmission window 78 can be made of any suitable
transmissive material that has a low reflection characteristic, such as a ZnSe
window with an anti-reflecting (AR) coating, that would provide maximum
transmission in the wavelength range of 5-25 µm. A sample 80 is placed on a
top surface of the sample window 78. The sample 80 can be a fine powder or a
liquid sample. As above, the mirror 30 is used to direct the field-of-view of the
spectrometer 18 into the dewar 28. In an alternate embodiment, the mirror 30
can be replaced with a focusing mirror, such as a parabolic mirror, so that a wide
field-of-view can be focused onto a small cold surface.
-
If the sample 80 is a liquid sample, a thin layer of the liquid is
placed on the window 78 so that light is able to be transmitted therethrough. The
sample 80 does not need to be additionally prepared. In one embodiment, the
thickness of the liquid sample, or the diameter of liquid sample droplets, should
be smaller than the absorption length of the sample.
-
If a powder sample is not in the form of a fine powder, the sample is
ground into a fine powder before it is placed on the sample window 78. The size
of the particles in the powder should be less than the wavelengths of interest,
and/or less than the absorption length of the particles, such as less than about 5
µm. Because the cold background provides a significant temperature differential
between the sample 12 and the background, the light scattering caused by the
powder sample does not significantly affect the ability of the system 76 to detect
the constituent of interest. Therefore, the powder sample does not need to be
mixed with other materials to get a suitable measurement. Thus, the preparation
time of the sample 12 can be significantly reduced over those times currently
required in the art.
-
It is believed that the cold background emission technique of the
invention provides the first ever that allows the observation of the infrared
emission spectrum of biological aerosols, liquid aerosols, and fine powders of
biological, organic, and inorganic materials. High sensitivity levels in the ppb
(parts per billion) levels for chemical vapors and less than 1,000 particles of
biological aerosols per liter of air can be achieved by the emission technique of
the invention.
-
Figure 5 is a graph with relative intensity on the vertical axis and
wavelength on the horizontal axis showing a comparison of ambient background
emissions with and without a cold background target. Particularly, graph line 90
shows the ambient background emissions without a cold background target.
Graph line 96 shows the emissions with a cold background.
-
Figure 6 is a graph with radiance on the vertical axis and
wavelength on the horizontal axis where graph line 100 shows the theoretical
black body radiation calculated by the Planck function for an ambient
temperature of about 23°C. Graph line 102 shows the emissions calculated by a
Planck function for a cold background of 133 K provided by a thermal electrical
cooler. Graph line 104 shows the theoretical background emissions calculated
by a Planck function for a cold background of 77 K provided by liquid nitrogen.
-
In theory, the emissions for a surface cooled by liquid-nitrogen
should be negligible, as shown in figure 6. However, the background emissions
with cold background targets are relatively high, as shown in figure 5. It is
speculated that the self emissions or reflections of the optical components in the
spectrometer 18 may be responsible for the non-negligible background
emissions when using a liquid-nitrogen dewar. It is predicted that minimizing the
reflection and self emissions of the optical components in the spectrometer 18
will lead to further reducing the background emissions and thereby improve the
detection sensitivity. The thermal electric cooler appears to yield sufficiently low
background emissions in the spectral range of interest.
-
Figure 7 is a graph with relative intensity on the vertical axis and
wavelength on the horizontal axis showing the emission spectrum of an SF6
sample, graph line 110, using the system 10. The emission band at 10.58 µm is
clearly resolved compared to a background emission spectrum, graph line 112.
-
Figure 8 is a graph with percent emission or absorption on the
vertical axis and pressure on the horizontal axis showing the peak emission
intensity of SF6, normalized to the background emission spectrum, as functions
of pressure. The near linearity between the emission intensity, graph line 114,
and SF6 pressure illustrates the utility of the emission method of the invention for
quantification analysis. Graph line 116 shows the absorption of SF6 for
comparison. The absorption data is measured by using a hot source at 500°C.
The comparison clearly indicates that the emission method of the invention is
much more sensitive than a conventional absorption method. The minimum
detectable level of the emission method is found to be about 50 times lower than
that of an absorption method using a near identical configuration, i.e. the same
pathlength.
-
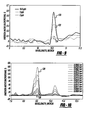
Figure 9 is a graph with percent emission above background on the
vertical axis and wavelength on the horizontal axis illustrating the emission
spectrum of SF6 in SF6/N2 mixture samples with liquid-nitrogen as a cold
background and a pressure of 700 Torr. Graph line 120 represents 10.8 ppb of
SF6 in the mixture, graph line 122 represents 5 ppb of SF6 in the mixture and
graph line 124 represents 2 ppb of SF6 in the mixture. For this experiment, the
path length of the chamber 14 was about 50 cm, and the signal-to-noise ratio
was about 1-2 at the 2 ppb level. Hence, the limit in the minimum detectable
density is estimated to be about 1 ppb under the current configuration.
-
In one configuration of the invention, the FTIR spectrometer has a
relatively small cross section viewing area of about 0.25 cm, with a pathlength of
about 50 cm. The emission method can be more sensitive than that determined
here by simply increasing the detection volume, for example, through use of a
relatively large telescope over an extended sample, as shown in Figure 3. On
other hand, the sensitivity of an absorption technique can be improved only by
increasing the pathlength. Hence, the emission method can be much more
sensitive than an absorption method, and its minimum detectable density can
reach much below the ppb level, as reported here.
-
Figure 10 is a graph with percent emissions above background on
the vertical axis and wavelength on the horizontal axis showing the emission
spectrum of DMMP with a liquid-nitrogen background at several pressures
measured using the system 10. DMMP is often used as a stimulant for chemical
agents, since its physical properties and absorption spectrum closely resemble
that of phosphonate-based chemical agents, including GA, GB, GD and VX. A
top graph line 126 represents the emission spectrum at 0.0996 Torr and a bottom
graph line 128 shows the emission spectrum at 0.0006 Torr with other emission
spectrums at pressures therebetween.
-
Figure 11 is a graph with percent emissions and absorption on the
vertical axis and DMMP vapor pressure on the horizontal axis showing a
comparison of emission and absorption measurements as a function of DMMP
vapor pressure at 9.512 µm. Graph line 132 represents the emission spectrum,
and illustrates a near linear relation between the emission peak at 9.512 µm with
the DMMP pressure. Graph line 134 represents the absorption spectrum using a
hot source at 500°C. The comparison illustrates that the emission method of the
invention is much more sensitive than the absorption method of the prior art.
These results illustrate that the invention can be used to detect chemical agents
in the air at extremely low levels, even below the threshold of toxicity.
-
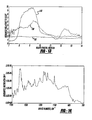
Figure 12 is a graph with radiance on the vertical axis and
wavelength on the horizontal axis showing the emission spectrum of several fine
powder samples measured by the system 76. Particularly, graph line 142
represents the emission spectrum of BG spores, graph line 140 represents the
emissions spectrum of Cab-O-Sil, graph line 144 represents the emission
spectrum of ovalbumin and graph line 146 represents the emission spectrum of
soot. Cab-O-Sil is a trade name for fine powders of SiO2, which is usually
produced by the combustion of SiH4 and oxygen. BG spores are often used as
stimulants for biological agents. BG spores, Cab-O-Sil and soot can be analyzed
in their normal configuration, however, ovalbumin samples need to be ground
down. The averaged particle sizes are measured to be about 1.5, 3.8, 0.78 and
8.6 µm for BG spores, Cab-O-Sil, soot and ovalbumin, respectively. The
emission spectrums have been calibrated into an absolute radiance unit using a
blackbody source.
-
The emission spectrum of soot should exhibit a profile resembling a
blackbody curve at ambient temperature. However, the soot emission spectrum
shown in figure 12 deviates from that of a blackbody. The deviations are
probably a result of the spectral response of the spectrometer 18.
-
In order to remove this variation caused by the spectrometer 18,
the emission spectrum of these fine powders is ratioed to soot. Figure 13 is a
graph with radiance relative to soot on the vertical axis and wavelength on the
horizontal axis showing the emission spectrum of these fine powders ratioed to
soot. Particularly, graph line 150 is the radiance relative to soot emission
spectrum for BG spores, graph line 148 is the radiance relative to soot emission
spectrum for Cab-O-Sil and graph line 152 is the radiance relative to soot
emission spectrum for ovalbumin.
-
The ratioed emission spectrums of Cab-O-Sil and BG spores agree
with their known absorption spectra. This favorable comparison suggests that
the emission method of the invention can be used to measure the characteristic
IR emissions of fine powders. The emission spectrum of ovalbumin, on the other
hand, exhibits a spectrum closely resembling that of soot. It is speculated that
the particle size may play a role. The average particle size for ovalbumin was
found to be about 8.6 µm as compared to 1.5 and 3.8 µm for BG spores and
Cab-O-Sil, respectively. As the particle size becomes large compared to the
absorption length of the particle, the emissions may exhibit a blackbody like
emission spectrum. Further experiments with ovalbumin with a smaller particle
size may show a clearer fingerprint spectrum.
-
Figure 14 is a graph with radiance on the vertical axis and wave
number on the horizontal axis showing the emission spectrum of fluorescein
measured by the system 76. The emission spectrum of fluorescein exhibits fine
molecular vibrational bands. The band positions agree with that of the known
absorption spectrum of fluorescein. The particle size of the fluorescein sample
was measured to be about 0.8 µm.
-
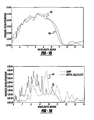
Figure 15 is a graph with radiance on the vertical axis and
wavelength on the horizontal axis showing the detected emission spectrum of a
BG aerosol in the chamber 42, graph line 156, and BG formed on the windows
20 and 32, graph line 158. Emission measurements of BG aerosols were
performed in the presence of the windows 20 and 32 in the chamber 40. The
emissions spectrum is found to be a contribution from both the aerosol and the
particles collected on the windows 20 and 32. The two contributions can be
separated since the contribution from the windows 20 and 32 persist after the
fans 44 and 46 were turned off. The emission spectrum shown in figure 15 of the
BG aerosol is nearly identical to that of the fine particles that were collected on
the windows 20 and 32. This may be a first observation of an emission spectrum
from a bacteria aerosol.
-
Figure 16 is a graph with radiance on the vertical axis and
wavelength on the horizontal axis showing the emission spectrum for liquid
DMMP, graph line 160, and liquid methyl salicylate, graph line 162, using the
system 76. The methyl salicylate and DMMP were sparsely spread over the
window 78 as a liquid sample 80. Typically, such sparsely spread liquids cannot
be readily measured by the known absorption methods because of the leakage
of light through the sample 80. However, the emission technique of the invention
is able to provide the emission spectrum with light leaking through the sample 80
and without extensive sample preparation.
-
Figure 17 is a graph with radiance on the vertical axis and
wavelength on the horizontal axis showing the emission spectrum of liquid
aerosols of tributyl phosphate, graph line 166, and silicon oil, graph line 168,
using the system 40. The samples where nebulized by the nebulizer 48. Liquids
having very little vapor pressures were selected to avoid any interference by the
emissions from the vapor.
-
Figure 18 is plan view of a detection and analysis system 176 for
remotely detecting a chemical or biological containing cloud 178 in the air,
according another embodiment of the invention. In this embodiment, an
electromagnetic radiation source 182 is employed to remotely irradiate a
background target 184, such as a hill, terrain, tree or building, which is behind the
cloud 178. The system 176 includes a spectrometer 180, where the cloud 178
and the background target 184 are along the line of sight of the spectrometer
180. The radiation source 182 emits a beam of radiation 186 that is expanded by
a beam expanding telescope 188 to be directed towards the background target
184. The radiation 186 heats the background target 184 and causes its
temperature to rise relative to the cloud 178. Emissions 190 from the warmer
background target 184 will exhibit a fingerprint absorption spectrum of the
constituents in the cloud 178 as it passes through the cloud 178.
-
The spectrometer 180 is positioned relative to the cloud 178 to
resolve the absorption spectrum, and thereby identifying the constituents therein.
The spectrometer 180 can be any spectrometer suitable for the purposes
discussed herein, such as an FTIR spectrometer, a grating tuned spectrometer,
an opto-acoustic spectrometer, a circular variable filter spectrometer, a linear
variable spectrometer, a MEMS spectrometer, etc. Alternatively, a spectral
imager can be used instead of the spectrometer 180 to resolve not only the
spectrum of the emissions, but also the spatial distribution of the emissions to aid
in resolving the emission from a background scene. A receiving telescope 192
receives the emissions 190 from the background target 184 through the cloud
178, and focus the emissions 190 onto the spectrometer 180. Therefore, instead
of using a prepared cold background as discussed above or heating the sample
as was done in '701 patent, this embodiment of the invention proposes heating
the background target 184 remotely relative to the temperature of the cloud 178
to achieve the same type of effect.
-
The source 182 can be a microwave source or a laser beam
source, such as a CO2 laser, HF laser, DF laser, solid-state laser or fiber laser.
The '701 patent discloses that the wavelength of the radiation is to be in
resonance with a chemical constituent of the cloud or the atmosphere molecules.
For this embodiment of the invention, there is no restriction on the selection of
the wavelength for the electromagnetic radiation 186, since any wavelength can
be effective in heating a background target. However the electromagnetic
radiation 186 should have sufficient power, preferable in the range of several
tens of watts to tens of kilowatts in order to raise the temperature of the
background target 184 sufficiently with respect to the cloud 178.
-
The foregoing discussion discloses and describes merely
exemplary embodiments of the present invention. One skilled in the art will
readily recognize from such discussion and from the accompanying drawings
and claims that various changes, modifications and variations can be made
therein without departing from the spirit and scope of the invention as defined in
the following claims.