EP1443396A2 - Systems and methods for providing visualizations of network diagrams - Google Patents
Systems and methods for providing visualizations of network diagrams Download PDFInfo
- Publication number
- EP1443396A2 EP1443396A2 EP04250138A EP04250138A EP1443396A2 EP 1443396 A2 EP1443396 A2 EP 1443396A2 EP 04250138 A EP04250138 A EP 04250138A EP 04250138 A EP04250138 A EP 04250138A EP 1443396 A2 EP1443396 A2 EP 1443396A2
- Authority
- EP
- European Patent Office
- Prior art keywords
- nodes
- brightness
- node
- size
- displayed
- Prior art date
- Legal status (The legal status is an assumption and is not a legal conclusion. Google has not performed a legal analysis and makes no representation as to the accuracy of the status listed.)
- Withdrawn
Links
Images




Classifications
-
- G—PHYSICS
- G06—COMPUTING OR CALCULATING; COUNTING
- G06F—ELECTRIC DIGITAL DATA PROCESSING
- G06F3/00—Input arrangements for transferring data to be processed into a form capable of being handled by the computer; Output arrangements for transferring data from processing unit to output unit, e.g. interface arrangements
- G06F3/01—Input arrangements or combined input and output arrangements for interaction between user and computer
- G06F3/048—Interaction techniques based on graphical user interfaces [GUI]
- G06F3/0481—Interaction techniques based on graphical user interfaces [GUI] based on specific properties of the displayed interaction object or a metaphor-based environment, e.g. interaction with desktop elements like windows or icons, or assisted by a cursor's changing behaviour or appearance
-
- G—PHYSICS
- G16—INFORMATION AND COMMUNICATION TECHNOLOGY [ICT] SPECIALLY ADAPTED FOR SPECIFIC APPLICATION FIELDS
- G16B—BIOINFORMATICS, i.e. INFORMATION AND COMMUNICATION TECHNOLOGY [ICT] SPECIALLY ADAPTED FOR GENETIC OR PROTEIN-RELATED DATA PROCESSING IN COMPUTATIONAL MOLECULAR BIOLOGY
- G16B45/00—ICT specially adapted for bioinformatics-related data visualisation, e.g. displaying of maps or networks
Definitions
- the present invention relates to systems for visualizing data, and more particularly to displaying visualizations of network diagrams.
- Network diagrams have wide scope of applications in almost all domains of science. Any data set that can be modeled as a collection of linked nodes can be represented as a network diagram.
- a network diagram can be used as a pathway diagram, protein interaction diagram, signal transduction process, workflow process, and other similar processes.
- Network diagrams may be used to provide computer-based visualization of computer networks, communications networks, and many other technical systems.
- Computer-based visualization of network diagrams involves contributions from many disciplines such as: graph theory, information visualization technology, visual perception, cognitive science, as well as others, to arrive at an efficient representation that exploits human visual processing to reduce the cognitive load of many tasks that require understanding of global or local structures.
- network diagrams may convey necessary information, many times they become more confusing than necessary. For example, in the case of biological diagrams, if a diagram is utilized to illustrate a pathway or interaction diagram, the amount of graphics displayed on the screen may be overwhelming to the user. Further still, by restraining the connecting lines to two dimensions, this may limit the ability of the program to display all connections in a logical or easily perceivable manner.
- network diagrams may be useful to display an amount of data in a more simplified graphical nature, there are still shortcomings when it is desirable to display more than one set of data at a time.
- gene expression it may be desirable to display multiple tests on a single screen using a network diagram so that the user can determine if any data collected in each test differs in any manner, or to attempt to observe connections among the data.
- data values are encoded and the encodings are used to render the network nodes and links, see, e.g., co-owned and currently pending Application Serial No.
- Star Tree Viewer provides a technique whereby an entire tree can be kept within the confines of a circular area on a conventional display screen.
- the Star Tree Viewer renders a tree data structure onto a hyperbolic surface, with the higher level nodes displayed at the center of the display and "branches" of the tree extending radially outwardly therefrom toward the periphery to display lower level nodes, resulting in an appearance of the form shown in Fig. 9.
- Star Tree Viewer provides an interesting view of a hierarchical structure, it is only applicable to tree structures and not to network diagrams or graphs in general.
- the present invention provides a system, methods and tools for displaying network diagrams in ways that are much easier for a user to visually interpret. Focus and context of information contained within one or more network diagrams may be displayed on a single display.
- nodes of interest either selected explicitly by the user or implicitly by an algorithm, pop up, become bigger and/or brighter, and hence appear "closer" to the user than other nodes. This provides a way to distinguish these nodes from the rest of the network, and achieves a focus-and-context view, meaning the node of interested (the focus) is displayed in the backdrop of the rest of the network diagram (the context).
- the contrast between the focus and the context can be further sharpened by either pushing the nodes in the context farther away, by displaying them smaller and dimmer, or by "fading" them, by displaying them in semi-transparent mode.
- Another interesting aspect of this feature is that the focus is not singular, and not of a single degree. More than one node can be in focus, and nodes can be in various degrees of focus.
- nodes that are connected directly to this node may be automatically set in a lower degree of focus, and nodes that are connected to these nodes are in turn set in focus of even lower degree, and so on.
- nodes are set in varying degrees of focus which correlate to the degree of their connection to the primary focus.
- a two-dimensional (“2D”) visualization is a flat, planar visualization, taking into account only planar geometry (x and y axes).
- a three- dimensional (“3D”) visualization takes into account full 3-dimensional geometry, with continuous values on x, y, and z axes, and would be represented in terms of a solid object hologram, for example.
- a 2.5D visualization is a "layered" geometry.
- the third dimension is not continuous, but is made up of a number of discrete "layers", such as the example given above of a larger object layer being laid over a smaller object layer.
- the partial blockage between objects produced by the overlapping (superimposing) gives the visual effect of "depth” making the visualization appear almost as a three dimensional image, and may be a visual clue as to the topology of the connectivity.
- the present invention provides a system that allows users to graphically display at least one data set showing connections and relations between the data of the data set.
- the present invention is also capable of providing visualization of network diagrams wherein one set of data may be overlaid over one or more additional data sets for direct comparison of data.
- Applications for visualizing the comparisons may be employed which allows a user to select a data point or node to be displayed, wherein visual aspects of related data will be altered in response to the user's selection.
- data may be contained within predefined network diagrams in databases accessible by the present invention, while additional sources of information may be accessed to provide overlays of annotations, or other related data to the network diagrams.
- additional information may be inputted from pre-sorted tables, text from articles, books or other publications, databases accessible through the internet or other databases, including proprietary databases, etc.
- the user may manually enter data using an input device, such as a keyboard, mouse, scanner, data storage means such as a floppy disk, cd-rom and the like.
- the present invention also provides various methods of overlaying data from one or more data sets onto data from another data set, or vice versa.
- the overlay may be visualized to compare the data from the two or more sources. Further, a visual indicator may be provided on the data upon which the overlay is produced, to further facilitate the comparison of data.
- Automatic comparison of the overlaid relevant data with the relevant data upon which it is overlaid may also be provided. Additionally, the user may be alerted when the means for automatically comparing determines there is a discrepancy found by the comparison.
- Fig. 1A shows an example of a visualization of a network diagram.
- Fig. 2 shows an example of a visualization of the same network diagram displayed in Fig. 1A, as modified according to an aspect of the present invention.
- Fig. 4 shows an exemplary screen shot of a network diagram display in accordance with the present invention.
- Fig. 6 shows the results of an ineffective effort to overlay gene expression data from two different experiments onto a pathway or interaction diagram.
- Fig. 7 shows the results of an example of an approach according to the present invention, of preparing a visualization similar to that shown in Fig. 6, but in which three experiments have been overlaid, in a manner which is more easily interpreted.
- Fig. 9 shows a screen display of a prior art technique for visualizing tree diagrams.
- Fig. 10 shows a screen display of a prior art Web browser that aids navigation by providing an enhanced thumbnail overview of Web pages.
- Interpretations/hypotheses which are developed in story or textual form or diagrammatic form may be dependent upon many different cellular processes, genes, and various expressions of genes with resultant variations in protein abundance. Correlation and testing of data against these hypotheses is becoming increasingly more tedious and lengthy with the increased automation of the ways in which gene and other data is generated (e.g. microarrays, mass spectroscopy, etc.). when viewed in the form of network diagrams or node-link graphs, the sheer abundance of this information can become overwhelming to the viewer, to the point where it is difficult to perceive useful data because of overcrowded displays, overlapping data, too much information displayed at a time, or other complications due to the complexity of the information that is being displayed.
- the present invention provides systems, tools and methods for visualizing data in network diagram (e.g., node-link) form, in manners that facilitate the visual interpretation by the user, wherein useful data may be more easily and readily distinguished.
- the present invention facilitates visualization and comparison of data to validate/invalidate data and hypotheses, as well as develop new hypotheses/refine existing hypotheses, discover correlations, etc.
- the present invention may also very useful to correlate experimental data with other representations of biological data, for example, correlating gene expression data with genes on a network diagram view, correlating sets of data pertaining to the same genes and relationships (or other nodes and links), correlating protein abundance data with proteins in a pathway diagram, etc.
- the present invention addresses the ability of displaying information on a display device in a manner that a user perceives to be three-dimensional.
- Human beings live in a three-dimensional world though human vision is primarily two dimensional in nature.
- the human retina can only register two-dimensional images, though through the use of both eyes, humans are able to utilize depth perception to process three-dimensional information.
- the distance between the eyes is so short that depth perception is limited, therefore it is difficult to distinguish the distances between various objects and the observer by depth perception alone. Since humans need to survive in a three-dimensional world, they have evolved highly efficient skills in using a number of visual cues to help us determine the third dimension.
- Network diagram 5 includes a plurality of nodes 60, each of these nodes 60 configured to represent data, in this case biological data, such as gene-related data.
- Each node 60 is displayed on the display device 50 in the visualization of Fig. 1A, such that each node has the same or similar size, shape, and contrast, as is standard in network diagrams as they are currently produced.
- Each node 60 may include at least one line or link 61 extending therefrom and connecting to another node 60.
- Fig. 2 shows four levels of modified node sizes and brightnesses. That is, any node 60 which is interlinked with one or more nodes 64 is displayed larger and brighter than nodes 60 as a node 63, which is not as large or bright as node 64. Also, any node 60 which is linked to one or more nodes 63 is displayed larger and brighter than nodes 60 as a node 62, which is not as large or bright as node 63. The remainder of the nodes 60 are maintained as is, with a size and intensity the same as displayed in Fig. 1A.
- the increase of size and brightness of the selected node, as well as the increased size and brightness of the related nodes creates a visual effect, wherein the selected node and the related node(s) appear to float above or be projected above the remaining nodes.
- the selected node and the related nodes will appear to be displayed three dimensionally.
- tertiary nodes are identified by those nodes which are directly linked to the secondary nodes and which are not linked directly to a node of interest.
- the third largest size (and intensity) are then assigned to the tertiary nodes at step S20 and optionally, the second thickest and brightest properties are assigned to secondary links, which connect secondary nodes with tertiary nodes.
- nodes of interest which are either selected explicitly by the user or implicitly by an algorithm, will “pop up”, become bigger and brighter, and hence appear “closer” to the user than other nodes.
- This provides a way to distinguish these nodes from the rest of the network, and achieves a focus-and-context view, meaning that the node or nodes of interested (the focus) is displayed relative to the backdrop of the rest of the diagram (the context).
- the contrast between the focus and the context can be further sharpened by either pushing the nodes in the context farther away, by displaying them smaller and dimmer, or by "fading" them, by displaying them in semi-transparent mode.
- Another interesting aspect of this feature is that the focus is not singular, and not of a single degree. More than one node can be in focus, and nodes can be in various degrees of focus.
- nodes may be set in various degree of focus correlating to the degree of their connection to the primary focus (selected node or nodes). This scheme provides an excellent way to highlight the connectivity of a node or a cluster of nodes, and allows the user to interactively traverse the network by clicking one node following another.
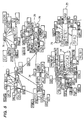
- Fig. 6 shows an effort to overlay gene expression data from two different experiments onto a pathway or interaction diagram.
- the gene expression data is color-coded according to a color scheme commonly used in heat map representations of expression data, i.e., wherein various shades of red coloring indicate varying degrees of up-regulation and various shades of green coloring represent various degrees of down-regulation.
- various shades of red coloring indicate varying degrees of up-regulation
- various shades of green coloring represent various degrees of down-regulation.
- node 81 (“Frizzled) is displayed as some mixture of green 81 g and red 81r. Many other nodes suffer the same confusing appearance, making it difficult to draw any definitive conclusions from the display.
- the classic way to resolve the confusion created by such a visualization would be to create two separate graphs, each corresponding to a single experiment. However, this approach reduces the user's ability to compare trends within individual molecules as the user is forced to refer back and forth to two different graphs, which are not superimposed.
- the process of enlarging and brightening the selected node(s) and the related nodes is similar to that described above.
- the related nodes may be displayed to produce a layering effect, wherein the selected nodes are largest and brightest, the most directly connected nodes are slightly smaller and less bright, the next level of relationship (those nodes that are connected to directly connected nodes) are slightly smaller and less bright, and so forth.
- the size and brightness of the nodes may be changed to pre-determined values, or the user may be prompted to enter desired values.
- the color and/or the geometric shape of the nodes may be changed to further distinguish the selected and/or related nodes from the remaining nodes, wherein the color and shape may be a pre-determined value or a value chosen through additional user input.
Landscapes
- Engineering & Computer Science (AREA)
- Theoretical Computer Science (AREA)
- Physics & Mathematics (AREA)
- General Engineering & Computer Science (AREA)
- Life Sciences & Earth Sciences (AREA)
- Bioinformatics & Cheminformatics (AREA)
- General Health & Medical Sciences (AREA)
- Biophysics (AREA)
- Data Mining & Analysis (AREA)
- Health & Medical Sciences (AREA)
- Human Computer Interaction (AREA)
- Bioinformatics & Computational Biology (AREA)
- Biotechnology (AREA)
- Evolutionary Biology (AREA)
- General Physics & Mathematics (AREA)
- Medical Informatics (AREA)
- Spectroscopy & Molecular Physics (AREA)
- User Interface Of Digital Computer (AREA)
- Apparatus For Radiation Diagnosis (AREA)
- Measuring And Recording Apparatus For Diagnosis (AREA)
- Digital Computer Display Output (AREA)
- Controls And Circuits For Display Device (AREA)
Abstract
Description
Claims (45)
- A method of displaying network diagram visualizations (5, 105) for intuitive interpretation by a user, said method comprising the steps of:displaying a network diagram (5) having nodes (60) interconnected with links (61) on a display device (50), wherein the nodes are displayed having a default size and brightness and the links are displayed having a default thickness and brightness;accepting a selection of at least one node of interest to be viewed;increasing at least one of the size and brightness of the at least one node of interest; anddisplaying the at least one node of interest (65, 70A, 70B, 70C) with at least one of the increased size and brightness.
- The method of claim 1, further comprising the steps of:identifying secondary nodes which are directly linked to said at least one node of interest (65, 70A, 70B, 70C);increasing at least one of the size and brightness of the secondary nodes to a secondary size or brightness greater than the default size or brightness, but less than the increases size or brightness of the at least one node of interest; anddisplaying the secondary nodes (64, 71) with the at least one of increased size and brightness.
- The method of claim 2, further comprising the steps of:identifying tertiary nodes which are directly linked to at least one secondary node (64, 71), but not directly linked to a node of interest (65, 70A, 70B, 70C);increasing at least one of the size and brightness of the tertiary nodes to a tertiary size or brightness greater than the default size or brightness, but less than the secondary size or brightness; anddisplaying the tertiary nodes (63) with at least one of tertiary size and tertiary brightness.
- The method of claim 3, further comprising the steps of:identifying quaternary nodes which are directly linked to at least one tertiary node (63), but not directly linked to a secondary node (64, 71);increasing at least one of the size and brightness of the quaternary nodes to a quaternary size or brightness greater than the default size or brightness, but less than the tertiary size or brightness; anddisplaying the quaternary nodes (62) with at least one of quaternary size and quaternary brightness.
- The method of claim 1, wherein said at least one node of interest (65, 70A, 70B, 70C) is displayed on top of any other node, link or portion of a node or link where overlap occurs in the resulting display.
- The method of claim 2, wherein any overlapping that occurs in the display is rendered such that the largest sized nodes are displayed on top of the visualization (5) with concurrent layers of the visualization (5) descending according to size assignments of the nodes displayed, such that the default size is displayed as the bottom layer.
- The method of claim 3, wherein any overlapping that occurs in the display is rendered such that the largest sized nodes are displayed on top of the visualization with concurrent layers of the visualization descending according to size assignments of the nodes displayed, such that the default size (60) is displayed as the bottom layer.
- The method of claim 4, wherein any overlapping that occurs in the display is rendered such that the largest sized nodes are displayed on top of the visualization with concurrent layers of the visualization descending according to size assignments of the nodes displayed, such that the default size (60) is displayed as the bottom layer.
- The method of claim 2, further comprising identifying primary links interconnecting said at least one node of interest (65, 70A, 70B, 70C) and said secondary nodes (64, 71);
increasing at least one of the thickness and brightness of the primary links; and
displaying the primary links (66) with at least one of the increased thickness and brightness. - The method of claim 9, further comprising the steps of:identifying secondary links which are connected to secondary nodes (64, 71), but not to said at least one node of interest (65, 70A, 70B, 70C);increasing at least one of the thickness and brightness of the secondary links to a secondary link thickness or brightness greater than the default thickness or brightness, but less than the increased thickness or brightness of the primary links; anddisplaying the secondary links (67) with the at least one of secondary link thickness and secondary link brightness.
- The method of claim 10, further comprising the steps of:identifying tertiary links which are connected to said tertiary nodes (63), but not to said secondary nodes (64, 71);increasing at least one of the thickness and brightness of the tertiary links to a tertiary link thickness or brightness greater than the default thickness or brightness, but less than the increased thickness or brightness of the secondary links; anddisplaying the tertiary links (68) with the at least one of tertiary link thickness and tertiary link brightness.
- The method of claim 1, further comprising modifying the display of at least one node (76) which has not been selected to appear less prominently.
- The method of claim 12, wherein said modifying comprises displaying said at least one non-selected node (76) transparently.
- The method of claim 12, wherein said modifying comprises decreasing at least one of the size and brightness of said at least one non-selected node (76) and displaying said at least one non-selected node with at least one of said decreased size and brightness.
- The method of claim 12, wherein said modifying comprises blurring said at least one non-selected node and displaying said at least one blurred non-selected node.
- The method of claim 1, wherein said nodes are colored, said method further comprising changing the color of said at least one node of interest (74) and displaying said at least one node of interest in the changed color.
- The method of claim 2, wherein said nodes are colored, said method further comprising changing the color of said at least one node of interest (74); changing the color of said secondary nodes (75); and displaying said at least one node of interest (74) and said secondary nodes (75) in the changed colors.
- The method of claim 4, wherein said nodes are colored, said method further comprising changing the color of at least one of at least one node of interest (65, 74), secondary nodes (64, 75), tertiary nodes (63) and quaternary nodes (62); and displaying the nodes according to colors as a result of said changing.
- The method of claim 18, wherein the colors of each of the nodes changed are the same.
- The method of claim 18, wherein at least two of the at least one node of interest (65, 74), secondary nodes (64, 75), tertiary nodes (63) and quaternary nodes (62) are changed to colors different from one another.
- A method of overlaying network diagram visualizations for visual interpretation by a user, said method comprising the steps of:displaying a first network diagram (105, 100) having nodes interconnected with links on a display device;overlaying at least one additional network diagram (105, 120, 130) having nodes and links positioned in a corresponding manner to at least a portion of the nodes and links of the first diagram network (105, 100);displaying only one of the first network diagram (105, 100, 120, 130) and at least one additional network diagrams (105, 100, 120, 130) in sharp definition; andblurring the remaining network diagrams and displaying said remaining network diagrams in a blurred state (105, 100, 120, 130).
- The method of claim 21, wherein at least said nodes (101, 121, 131) of each said network diagram are color-coded, and wherein said nodes in said remaining network diagrams (101, 121, 131) are displayed in color even after blurring.
- The method of claim 21, further comprising decreasing the brightness of said remaining networks (105, 100, 120, 130) displayed in a blurred state, relative to a brightness of said network displayed in focus (105, 100, 120, 130).
- The method of claim 21, further comprising:selecting one of the network diagrams (105, 100, 120, 130) that are blurred;displaying the selected network diagram in sharp definition, and overlaying all other diagrams; andblurring the network diagram having been previously displayed in sharp definition.
- The method of claim 21, further comprising skewing positions of said nodes (101, 121, 131) of the remaining diagrams so that they do not exactly correspond to positions of the corresponding nodes (101, 121, 131) in said network diagram in sharp definition, but under lap said nodes.
- A method of visualizing a network diagram (105) for facilitating visual interpretation by a user, said method comprising the steps of:displaying a network diagram having nodes interconnected with links on a display device;accepting a selection of a portion of the network diagram that defines interconnected nodes of interest;displaying the interconnected nodes of interest in sharp definition; andblurring the nodes in the remainder of the network diagram and displaying in a blurred state.
- The method of claim 26, further comprising displaying in sharp definition links that interconnect said nodes of interest.
- A method of visualizing network diagrams (5, 105) for facilitating visual interpretation by a user, said method comprising the steps of:displaying at least one network diagram having nodes interconnected with links on a display device;displaying nodes having a relatively low error statistic in sharp definition and node having a relatively higher error statistic as blurred.
- A method of visualizing network diagrams (5, 105) for facilitating visual interpretation by a user, said method comprising the steps of:displaying at least one network diagram having nodes interconnected with links on a display device;correlating error statistics of said nodes with a degree of sharpness scale to be applied to display of said nodes; anddisplaying said nodes in degrees of sharpness relative to said error statistics, wherein nodes having the lowest relative error statistics are displayed in sharp definition and nodes having the highest relative error statistics are displayed blurriest, with nodes having intermittent relative error statistics having varying degrees of blurriness relative to the error statistics.
- A system for displaying network diagram visualizations for intuitive interpretation by a user comprisingmeans for displaying a network diagram having nodes interconnected with links on a display device, wherein the nodes are displayed having a default size (60) and brightness and the links (61) are displayed having a default thickness and brightness;means for selecting at least one node of interest (65, 74) to be viewed;means for increasing at least one of the size and brightness of the at least one node of interest (65, 74); andmeans for displaying the at least one node of interest with at least one of the increased size and brightness.
- The system of claim 30, further comprising:means for identifying secondary nodes (64, 75) which are directly linked to said at least one node of interest (65, 74); andmeans for increasing at least one of the size and brightness of the secondary nodes to a secondary size or brightness greater than the default size or brightness, but less than the increases size or brightness of the at least one node of interest, wherein said secondary nodes are displayed by said displaying means with the at least one of increased size and brightness.
- The system of claim 31, further comprising:means for identifying tertiary nodes (63) which are directly linked to at least one secondary node, but not directly linked to a node of interest; andmeans for increasing at least one of the size and brightness of the tertiary nodes to a tertiary size or brightness greater than the default size or brightness, but less than the secondary size or brightness; wherein the tertiary nodes are displayed with at least one of tertiary size and tertiary brightness.
- The system of claim 32, further comprising:means for identifying quaternary nodes (62) which are directly linked to at least one tertiary node, but not directly linked to a secondary node; andmeans for increasing at least one of the size and brightness of the quaternary nodes to a quaternary size or brightness greater than the default size or brightness, but less than the tertiary size or brightness, wherein the quaternary nodes are displayed with at least one of quaternary size and quaternary brightness.
- The system of claim 30, further comprising means for overlaying at least a portion of said at least one node of interest when said at least a portion is positioned on the same portion of the display as another node or link of the network diagram.
- The system of claim 33, further comprising means for overlaying the visualization of said nodes, wherein any overlapping that occurs in the display is rendered such that the largest sized nodes are displayed on top of the visualization with concurrent layers of the visualization descending according to size assignments of the nodes displayed, such that the default size is displayed as the bottom layer.
- The system of claim 30, further comprising means for modifying the display of at least one node which has not been selected to appear less prominently.
- The system of claim 30, further comprises means for coloring the displayed nodes and means for changing the color of said at least one node of interest and displaying said at least one node of interest in the changed color.
- A system for overlaying network diagram visualizations for visual interpretation by a user, comprising:means for displaying a first network diagram (105, 100, 120, 130) having nodes interconnected with links on a display device;means for overlaying at least one additional network diagram (105, 100, 120, 130) having nodes and links positioned in a corresponding manner to at least a portion of the nodes and links of the first diagram network;means for displaying only one of the first network diagram (105, 100, 120, 130) and at least one additional network diagrams (105, 100, 120, 130) in sharp definition; andmeans for blurring the remaining network diagrams (105, 100, 120, 130) and displaying said remaining network diagrams (105, 100, 120, 130) in a blurred state.
- The system of claim 38, wherein at least said nodes of each said network diagram are color-coded, and wherein said nodes in said remaining network diagrams are displayed in color even after blurring.
- The system of claim 38, further comprising means for decreasing the brightness of said remaining networks displayed in a blurred state, relative to a brightness of said network displayed in sharp definition.
- The system of claim 38, further comprising:means for selecting one of the network diagrams that are blurred;means for displaying the selected network diagram in sharp definition, and overlaying all other diagrams; andmeans for blurring the network diagram having been previously displayed in sharp definition.
- The system of claim 38, further comprising means for skewing positions of said nodes of the remaining diagrams so that they do not exactly correspond to positions of the corresponding nodes in said network diagram displayed in sharp definition, but under lap said nodes.
- The system of claim 38, further comprising:means for selecting a portion of the network diagram (105) displayed in sharp definition that defines interconnected nodes of interest; andmeans for blurring the nodes in the remainder of the sharp definition network diagram and displaying the remainder in a blurred state.
- A computer program comprising computer program code means for performing al of the steps of any of claims 1 to 29 when said program is run on a computer.
- A computer program as claimed in claim 44 embodied on a computer readable medium.
Applications Claiming Priority (2)
| Application Number | Priority Date | Filing Date | Title |
|---|---|---|---|
| US356122 | 2003-01-30 | ||
| US10/356,122 US7224362B2 (en) | 2003-01-30 | 2003-01-30 | Systems and methods for providing visualization and network diagrams |
Publications (2)
| Publication Number | Publication Date |
|---|---|
| EP1443396A2 true EP1443396A2 (en) | 2004-08-04 |
| EP1443396A3 EP1443396A3 (en) | 2006-10-18 |
Family
ID=32655598
Family Applications (1)
| Application Number | Title | Priority Date | Filing Date |
|---|---|---|---|
| EP04250138A Withdrawn EP1443396A3 (en) | 2003-01-30 | 2004-01-13 | Systems and methods for providing visualizations of network diagrams |
Country Status (3)
| Country | Link |
|---|---|
| US (1) | US7224362B2 (en) |
| EP (1) | EP1443396A3 (en) |
| JP (1) | JP2004234654A (en) |
Cited By (3)
| Publication number | Priority date | Publication date | Assignee | Title |
|---|---|---|---|---|
| WO2008110962A1 (en) * | 2007-03-09 | 2008-09-18 | Koninklijke Philips Electronics N.V. | Visualization of parametric maps |
| WO2009007754A1 (en) * | 2007-07-11 | 2009-01-15 | Integra Sp Limited | Graphical user interface tool |
| CN104090957A (en) * | 2014-03-10 | 2014-10-08 | 中国科学院软件研究所 | Heterogeneous network interactive visualization method |
Families Citing this family (94)
| Publication number | Priority date | Publication date | Assignee | Title |
|---|---|---|---|---|
| AU2003227558A1 (en) * | 2002-04-05 | 2003-10-20 | Hyperwave Software Forschungs- Und Entwicklungs Gmbh | Data visualization system |
| US20040168119A1 (en) * | 2003-02-24 | 2004-08-26 | David Liu | method and apparatus for creating a report |
| EP1510938B1 (en) * | 2003-08-29 | 2014-06-18 | Sap Ag | A method of providing a visualisation graph on a computer and a computer for providing a visualisation graph |
| EP1510940A1 (en) | 2003-08-29 | 2005-03-02 | Sap Ag | A method of providing a visualisation graph on a computer and a computer for providing a visualisation graph |
| EP1510941A1 (en) * | 2003-08-29 | 2005-03-02 | Sap Ag | A method of providing a visualisation graph on a computer and a computer for providing a visualisation graph |
| US7392482B2 (en) * | 2003-12-18 | 2008-06-24 | International Business Machines Corporation | Selection accelerator in topology views |
| US7421665B2 (en) * | 2004-08-31 | 2008-09-02 | Oracle International Corporation | Node scrollers |
| JP4695864B2 (en) * | 2004-10-18 | 2011-06-08 | クラリオン株式会社 | Navigation device, map data distribution device, map data distribution system |
| US8302016B2 (en) | 2005-01-28 | 2012-10-30 | Kyocera Corporation | Display apparatus |
| US7882464B1 (en) | 2005-02-14 | 2011-02-01 | Cadence Design Systems, Inc. | Method and system for power distribution analysis |
| JP4660264B2 (en) * | 2005-04-22 | 2011-03-30 | 株式会社東芝 | Information processing apparatus and program |
| JP2007052766A (en) * | 2005-07-22 | 2007-03-01 | Mathematical Systems Inc | Pathway display method, information processing apparatus, and pathway display program |
| US8914726B2 (en) * | 2005-08-20 | 2014-12-16 | Riverbed Technology, Inc. | Visualizing a complex network based on a set of objects of interest |
| US7492716B1 (en) * | 2005-10-26 | 2009-02-17 | Sanmina-Sci | Method for efficiently retrieving topology-specific data for point-to-point networks |
| US7742432B2 (en) * | 2006-01-05 | 2010-06-22 | International Busniness Machines Corporation | Topology comparison |
| JP4566928B2 (en) * | 2006-03-01 | 2010-10-20 | 三菱電機株式会社 | Graph graphic arrangement method, program and apparatus |
| JP4972966B2 (en) * | 2006-03-16 | 2012-07-11 | 日本電気株式会社 | Relationship display method and apparatus, and program thereof |
| US7792868B2 (en) * | 2006-11-10 | 2010-09-07 | Microsoft Corporation | Data object linking and browsing tool |
| JP4933967B2 (en) * | 2007-07-02 | 2012-05-16 | 株式会社Gct研究所 | Information display device, information display method, and information display program |
| US8441484B2 (en) * | 2007-09-04 | 2013-05-14 | Cisco Technology, Inc. | Network trouble-tickets displayed as dynamic multi-dimensional graph |
| US20090158178A1 (en) * | 2007-12-17 | 2009-06-18 | Dorian Birsan | Graphically navigating tree structures |
| US8332782B1 (en) * | 2008-02-22 | 2012-12-11 | Adobe Systems Incorporated | Network visualization and navigation |
| US9087296B2 (en) | 2008-02-22 | 2015-07-21 | Adobe Systems Incorporated | Navigable semantic network that processes a specification to and uses a set of declaritive statements to produce a semantic network model |
| US8446412B2 (en) * | 2008-06-26 | 2013-05-21 | Microsoft Corporation | Static visualization of multiple-dimension data trends |
| JP2010039848A (en) * | 2008-08-06 | 2010-02-18 | Toshiba Corp | Electronic equipment |
| US20100169137A1 (en) * | 2008-12-31 | 2010-07-01 | Ebay Inc. | Methods and systems to analyze data using a graph |
| US8954893B2 (en) * | 2009-11-06 | 2015-02-10 | Hewlett-Packard Development Company, L.P. | Visually representing a hierarchy of category nodes |
| US20110227947A1 (en) * | 2010-03-16 | 2011-09-22 | Microsoft Corporation | Multi-Touch User Interface Interaction |
| US9026529B1 (en) | 2010-04-22 | 2015-05-05 | NetBase Solutions, Inc. | Method and apparatus for determining search result demographics |
| JP2010170583A (en) * | 2010-04-26 | 2010-08-05 | Kyocera Corp | Display |
| US20110271230A1 (en) * | 2010-04-30 | 2011-11-03 | Talkwheel.com, Inc. | Visualization and navigation system for complex data and discussion platform |
| US9280574B2 (en) | 2010-09-03 | 2016-03-08 | Robert Lewis Jackson, JR. | Relative classification of data objects |
| US9489279B2 (en) * | 2011-01-18 | 2016-11-08 | Cisco Technology, Inc. | Visualization of performance data over a network path |
| US10643355B1 (en) * | 2011-07-05 | 2020-05-05 | NetBase Solutions, Inc. | Graphical representation of frame instances and co-occurrences |
| DE102011108079A1 (en) * | 2011-07-21 | 2013-01-24 | Peter Strzygowski | Computer implemented method for arrangement of categorizable contents of data in e.g. project planning, involves outputting arranged categories and content elements completely, shortly or in form of symbol |
| US9417754B2 (en) | 2011-08-05 | 2016-08-16 | P4tents1, LLC | User interface system, method, and computer program product |
| US10872082B1 (en) | 2011-10-24 | 2020-12-22 | NetBase Solutions, Inc. | Methods and apparatuses for clustered storage of information |
| US9721039B2 (en) * | 2011-12-16 | 2017-08-01 | Palo Alto Research Center Incorporated | Generating a relationship visualization for nonhomogeneous entities |
| CN102707944A (en) * | 2012-04-13 | 2012-10-03 | 华为技术有限公司 | User interface generation display method and user interface equipment |
| US20130278623A1 (en) * | 2012-04-19 | 2013-10-24 | Ming C. Hao | Providing a correlation ring for indicating correlation between attributes |
| WO2013169845A1 (en) | 2012-05-09 | 2013-11-14 | Yknots Industries Llc | Device, method, and graphical user interface for scrolling nested regions |
| WO2013169875A2 (en) | 2012-05-09 | 2013-11-14 | Yknots Industries Llc | Device, method, and graphical user interface for displaying content associated with a corresponding affordance |
| WO2013169843A1 (en) | 2012-05-09 | 2013-11-14 | Yknots Industries Llc | Device, method, and graphical user interface for manipulating framed graphical objects |
| WO2013169865A2 (en) | 2012-05-09 | 2013-11-14 | Yknots Industries Llc | Device, method, and graphical user interface for moving a user interface object based on an intensity of a press input |
| AU2013259614B2 (en) | 2012-05-09 | 2016-08-25 | Apple Inc. | Device, method, and graphical user interface for providing feedback for changing activation states of a user interface object |
| WO2013169849A2 (en) | 2012-05-09 | 2013-11-14 | Industries Llc Yknots | Device, method, and graphical user interface for displaying user interface objects corresponding to an application |
| WO2013169877A2 (en) | 2012-05-09 | 2013-11-14 | Yknots Industries Llc | Device, method, and graphical user interface for selecting user interface objects |
| EP3401773A1 (en) | 2012-05-09 | 2018-11-14 | Apple Inc. | Device, method, and graphical user interface for displaying additional information in response to a user contact |
| KR101823288B1 (en) | 2012-05-09 | 2018-01-29 | 애플 인크. | Device, method, and graphical user interface for transitioning between display states in response to gesture |
| WO2013169851A2 (en) | 2012-05-09 | 2013-11-14 | Yknots Industries Llc | Device, method, and graphical user interface for facilitating user interaction with controls in a user interface |
| WO2013169853A1 (en) | 2012-05-09 | 2013-11-14 | Industries Llc Yknots | Device, method, and graphical user interface for providing tactile feedback for operations performed in a user interface |
| EP3264252B1 (en) | 2012-05-09 | 2019-11-27 | Apple Inc. | Device, method, and graphical user interface for performing an operation in accordance with a selected mode of operation |
| WO2013169842A2 (en) | 2012-05-09 | 2013-11-14 | Yknots Industries Llc | Device, method, and graphical user interface for selecting object within a group of objects |
| US8949263B1 (en) | 2012-05-14 | 2015-02-03 | NetBase Solutions, Inc. | Methods and apparatus for sentiment analysis |
| AU2013368441B2 (en) | 2012-12-29 | 2016-04-14 | Apple Inc. | Device, method, and graphical user interface for forgoing generation of tactile output for a multi-contact gesture |
| KR101958582B1 (en) | 2012-12-29 | 2019-07-04 | 애플 인크. | Device, method, and graphical user interface for transitioning between touch input to display output relationships |
| WO2014105279A1 (en) | 2012-12-29 | 2014-07-03 | Yknots Industries Llc | Device, method, and graphical user interface for switching between user interfaces |
| WO2014105277A2 (en) | 2012-12-29 | 2014-07-03 | Yknots Industries Llc | Device, method, and graphical user interface for moving a cursor according to a change in an appearance of a control icon with simulated three-dimensional characteristics |
| KR102301592B1 (en) | 2012-12-29 | 2021-09-10 | 애플 인크. | Device, method, and graphical user interface for navigating user interface hierachies |
| AU2013368445B8 (en) | 2012-12-29 | 2017-02-09 | Apple Inc. | Device, method, and graphical user interface for determining whether to scroll or select contents |
| US9135243B1 (en) | 2013-03-15 | 2015-09-15 | NetBase Solutions, Inc. | Methods and apparatus for identification and analysis of temporally differing corpora |
| US10411966B2 (en) | 2015-02-26 | 2019-09-10 | Red Hat, Inc. | Host network analyzer |
| US9645732B2 (en) | 2015-03-08 | 2017-05-09 | Apple Inc. | Devices, methods, and graphical user interfaces for displaying and using menus |
| US10048757B2 (en) | 2015-03-08 | 2018-08-14 | Apple Inc. | Devices and methods for controlling media presentation |
| US9632664B2 (en) | 2015-03-08 | 2017-04-25 | Apple Inc. | Devices, methods, and graphical user interfaces for manipulating user interface objects with visual and/or haptic feedback |
| US9990107B2 (en) | 2015-03-08 | 2018-06-05 | Apple Inc. | Devices, methods, and graphical user interfaces for displaying and using menus |
| US10095396B2 (en) | 2015-03-08 | 2018-10-09 | Apple Inc. | Devices, methods, and graphical user interfaces for interacting with a control object while dragging another object |
| US9639184B2 (en) | 2015-03-19 | 2017-05-02 | Apple Inc. | Touch input cursor manipulation |
| US9785305B2 (en) | 2015-03-19 | 2017-10-10 | Apple Inc. | Touch input cursor manipulation |
| US10152208B2 (en) | 2015-04-01 | 2018-12-11 | Apple Inc. | Devices and methods for processing touch inputs based on their intensities |
| US20170045981A1 (en) | 2015-08-10 | 2017-02-16 | Apple Inc. | Devices and Methods for Processing Touch Inputs Based on Their Intensities |
| US9830048B2 (en) | 2015-06-07 | 2017-11-28 | Apple Inc. | Devices and methods for processing touch inputs with instructions in a web page |
| US10346030B2 (en) | 2015-06-07 | 2019-07-09 | Apple Inc. | Devices and methods for navigating between user interfaces |
| US9891811B2 (en) | 2015-06-07 | 2018-02-13 | Apple Inc. | Devices and methods for navigating between user interfaces |
| US10200598B2 (en) | 2015-06-07 | 2019-02-05 | Apple Inc. | Devices and methods for capturing and interacting with enhanced digital images |
| US9860451B2 (en) | 2015-06-07 | 2018-01-02 | Apple Inc. | Devices and methods for capturing and interacting with enhanced digital images |
| US9674426B2 (en) | 2015-06-07 | 2017-06-06 | Apple Inc. | Devices and methods for capturing and interacting with enhanced digital images |
| US10416800B2 (en) | 2015-08-10 | 2019-09-17 | Apple Inc. | Devices, methods, and graphical user interfaces for adjusting user interface objects |
| US9880735B2 (en) | 2015-08-10 | 2018-01-30 | Apple Inc. | Devices, methods, and graphical user interfaces for manipulating user interface objects with visual and/or haptic feedback |
| US10235035B2 (en) | 2015-08-10 | 2019-03-19 | Apple Inc. | Devices, methods, and graphical user interfaces for content navigation and manipulation |
| US10248308B2 (en) | 2015-08-10 | 2019-04-02 | Apple Inc. | Devices, methods, and graphical user interfaces for manipulating user interfaces with physical gestures |
| US10491705B2 (en) | 2015-09-08 | 2019-11-26 | At&T Intellectual Property I, L.P. | Visualization for network virtualization platform |
| US10942922B2 (en) | 2015-09-28 | 2021-03-09 | Microsoft Technology Licensing, Llc | Generation of data flow from syntax tree |
| US10168884B2 (en) * | 2015-11-10 | 2019-01-01 | International Business Machines Corporation | Generating user interface configuration pages to configure a computing resource comprised of component computing resources |
| US10156841B2 (en) | 2015-12-31 | 2018-12-18 | General Electric Company | Identity management and device enrollment in a cloud service |
| JP2017146734A (en) * | 2016-02-16 | 2017-08-24 | 株式会社日立製作所 | Method for simplifying network chart |
| US10290130B2 (en) | 2016-08-31 | 2019-05-14 | International Business Machines Corporation | Visualization of connected data |
| US10652280B2 (en) * | 2017-04-24 | 2020-05-12 | Unisys Corporation | User interface features for enterprise security management |
| US10409832B2 (en) | 2017-06-12 | 2019-09-10 | Sap Se | Probing linear and non-linear relationships between entities in a network |
| JP7379052B2 (en) * | 2019-09-30 | 2023-11-14 | キヤノン株式会社 | Display control device, method and program |
| JP2022044893A (en) * | 2020-09-08 | 2022-03-18 | 日本電気株式会社 | Communication management system, communication system, communication management method, and communication management program |
| US11374824B2 (en) | 2020-11-27 | 2022-06-28 | At&T Intellectual Property I, L.P. | Time-based visualization for network virtualization platform |
| US11604515B2 (en) | 2020-11-27 | 2023-03-14 | At&T Intellectual Property I, L.P. | Network virtualization platforms enhanced with non-visual sensory interactivity |
| US20240159785A1 (en) * | 2021-07-02 | 2024-05-16 | Invitae Corporation | Techniques for diagnosing sources of error in a sample processing workflow |
Family Cites Families (14)
| Publication number | Priority date | Publication date | Assignee | Title |
|---|---|---|---|---|
| CA2017969C (en) * | 1989-08-07 | 1999-04-20 | Richard Alan Becker | Dynamic graphics arrangement for displaying spatial-time-series data |
| US6154212A (en) * | 1997-11-06 | 2000-11-28 | Lucent Technologies Inc. | Method and apparatus for constructing network interfaces |
| US6188405B1 (en) | 1998-09-14 | 2001-02-13 | Microsoft Corporation | Methods, apparatus and data structures for providing a user interface, which exploits spatial memory, to objects |
| US6154220A (en) * | 1998-10-19 | 2000-11-28 | Microsoft Corporation | Rectilinear layout |
| US6486898B1 (en) | 1999-03-31 | 2002-11-26 | Koninklijke Philips Electronics N.V. | Device and method for a lattice display |
| US6714936B1 (en) * | 1999-05-25 | 2004-03-30 | Nevin, Iii Rocky Harry W. | Method and apparatus for displaying data stored in linked nodes |
| US6792400B2 (en) * | 2000-12-18 | 2004-09-14 | General Motors Corporation | Visualization of complex system interactions |
| US6646652B2 (en) * | 2000-12-21 | 2003-11-11 | Xerox Corporation | System and method for browsing node-link structures based on an estimated degree of interest |
| US6900822B2 (en) * | 2001-03-14 | 2005-05-31 | Bmc Software, Inc. | Performance and flow analysis method for communication networks |
| US7187389B2 (en) * | 2001-04-12 | 2007-03-06 | International Business Machines Corporation | System and method for simultaneous display of multiple object categories |
| US20020178184A1 (en) * | 2001-05-22 | 2002-11-28 | Allan Kuchinsky | Software system for biological storytelling |
| JP3747404B2 (en) * | 2001-06-19 | 2006-02-22 | インターナショナル・ビジネス・マシーンズ・コーポレーション | Graphics image creating apparatus, method and program thereof |
| US6983283B2 (en) * | 2001-10-03 | 2006-01-03 | Sun Microsystems, Inc. | Managing scene graph memory using data staging |
| US7146030B2 (en) * | 2002-05-22 | 2006-12-05 | Agilent Technologies, Inc. | System and methods for extracting semantics from images |
-
2003
- 2003-01-30 US US10/356,122 patent/US7224362B2/en not_active Expired - Fee Related
-
2004
- 2004-01-13 EP EP04250138A patent/EP1443396A3/en not_active Withdrawn
- 2004-01-26 JP JP2004016620A patent/JP2004234654A/en active Pending
Cited By (3)
| Publication number | Priority date | Publication date | Assignee | Title |
|---|---|---|---|---|
| WO2008110962A1 (en) * | 2007-03-09 | 2008-09-18 | Koninklijke Philips Electronics N.V. | Visualization of parametric maps |
| WO2009007754A1 (en) * | 2007-07-11 | 2009-01-15 | Integra Sp Limited | Graphical user interface tool |
| CN104090957A (en) * | 2014-03-10 | 2014-10-08 | 中国科学院软件研究所 | Heterogeneous network interactive visualization method |
Also Published As
| Publication number | Publication date |
|---|---|
| EP1443396A3 (en) | 2006-10-18 |
| US20040150644A1 (en) | 2004-08-05 |
| JP2004234654A (en) | 2004-08-19 |
| US7224362B2 (en) | 2007-05-29 |
Similar Documents
| Publication | Publication Date | Title |
|---|---|---|
| US7224362B2 (en) | Systems and methods for providing visualization and network diagrams | |
| Bertini et al. | Quality metrics in high-dimensional data visualization: An overview and systematization | |
| JP3671009B2 (en) | Customer self-service subsystem for response set ordering and annotation | |
| Healey | Perception in visualization | |
| US7719534B2 (en) | Object association in a computer generated drawing environment | |
| US20190394103A1 (en) | Visualization of network data as a three-dimensional hierarchical data structure in a mixed reality environment | |
| US20070130113A1 (en) | Method and system for navigation and visualization of data in relational and/or multidimensional databases | |
| Lekschas et al. | Pattern-driven navigation in 2D multiscale visualizations with scalable insets | |
| WO2008122830A1 (en) | Method and system for navigation and visualization of data in relational and/or multidimensional databases | |
| WO2019140446A1 (en) | Visualization of network data as a three-dimensional hierarchical data structure in a mixed reality environment | |
| Fröhler et al. | GEMSe: Visualization‐guided exploration of multi‐channel segmentation algorithms | |
| Windhager et al. | Many views are not enough: Designing for synoptic insights in cultural collections | |
| Künzel et al. | Visual explainable artificial intelligence for graph-based visual question answering and scene graph curation | |
| Chang et al. | Exploring entities in text with descriptive non-photorealistic rendering | |
| Barrera-Leon et al. | Systematic variation of preattentive attributes to highlight relevant data in information visualization | |
| Brath | Effective information visualization, guidelines and metrics for 3D interactive representations of business data | |
| Röhlig et al. | Visibility widgets: Managing occlusion of quantitative data in 3d terrain visualization | |
| Zappala | Using visualization and search to locate genealogy holes | |
| Bäuerle et al. | Net2Vis–A Visual Grammar for Automatically Generating Publication-Ready CNN Architecture Visualizations | |
| Aigner et al. | Crafting Visualizations of Time-Oriented Data | |
| 복진욱 | Supporting Scalable Interaction and Analysis in Data Visualization using Colors | |
| Zhao | The Perceptually Accurate Visual Display of Quantitative Quantum Physics Data | |
| Spínola | Adaptive information visualization framework | |
| Novotný | Similarity brushing for exploring multidimensional relations | |
| Lorenzini | Designing an interactive visualization tool for electronic health records |
Legal Events
| Date | Code | Title | Description |
|---|---|---|---|
| PUAI | Public reference made under article 153(3) epc to a published international application that has entered the european phase |
Free format text: ORIGINAL CODE: 0009012 |
|
| AK | Designated contracting states |
Kind code of ref document: A2 Designated state(s): AT BE BG CH CY CZ DE DK EE ES FI FR GB GR HU IE IT LI LU MC NL PT RO SE SI SK TR |
|
| AX | Request for extension of the european patent |
Extension state: AL LT LV MK |
|
| RIC1 | Information provided on ipc code assigned before grant |
Ipc: G06F 3/033 20060101ALI20060612BHEP Ipc: G06F 9/44 20060101AFI20040608BHEP |
|
| PUAL | Search report despatched |
Free format text: ORIGINAL CODE: 0009013 |
|
| AK | Designated contracting states |
Kind code of ref document: A3 Designated state(s): AT BE BG CH CY CZ DE DK EE ES FI FR GB GR HU IE IT LI LU MC NL PT RO SE SI SK TR |
|
| AX | Request for extension of the european patent |
Extension state: AL LT LV MK |
|
| RAP1 | Party data changed (applicant data changed or rights of an application transferred) |
Owner name: AGILENT TECHNOLOGIES, INC. |
|
| 17P | Request for examination filed |
Effective date: 20070418 |
|
| AKX | Designation fees paid |
Designated state(s): CH DE FR GB LI |
|
| 17Q | First examination report despatched |
Effective date: 20070720 |
|
| STAA | Information on the status of an ep patent application or granted ep patent |
Free format text: STATUS: THE APPLICATION IS DEEMED TO BE WITHDRAWN |
|
| 18D | Application deemed to be withdrawn |
Effective date: 20080801 |