-
Method GEDAP (Genotyping Based on Diagnostic Amplification Products) for
detecting and/or preventing genotyping errors on the basis of the amplification products of
a polymorphic locus.
-
A method for genotyping polymorphic loci by analysing the products generated
from the amplification of alleles contained in diploid or polyploid samples. More
specifically, it is a method for detecting and/or preventing genotyping errors due to total or
partial non-amplifications of alleles, produced during the amplification procedure. It also
pertains to genetic applications and systems which can effectively use genotyping
information of this type, such as disease diagnosis, preimplantational genetic diagnosis,
paternity testing, forensic analyses, genetic therapy, tissue and organ transplantation,
pharmacogenetics, population genetics, genome mapping and genetic epidemiology.
-
Genotyping is the mandatory starting point for most genetic analyses, both basic and
applied, and has contributed decisively to the development of genetics and its applications.
The genotyping of polymorphic DNA loci has recently been facilitated by two fundamental
advances: the invention of the Polymerase Chain Reaction (PCR) (Saiki et al., 1985; Mullis
et al., 1986) and the discovery of a fairly even spread of polymorphic DNA sequences
throughout genomes (mainly DNA markers composed of tandem arrays of motifs one or
more base pairs long) (Dib et al., 1996; Tóth et al., 2000). Both advances have contributed
decisively towards understanding of the structure and function of genomes of living
organisms, and towards the development of population genetics, genetic epidemiology,
genome mapping, genetic therapy, disease diagnosis, preimplantational genetic diagnosis,
forensic analysis, tissue and organ transplantation, pharmacogenetics, paternity testing, etc.
-
The conventional methods used for genotyping polymorphic DNA loci are based on
the following strategy: (a) amplifying the locus alleles present in a sample (generally by
means of PCR); (b) identifying the amplified alleles (generally by means of
electrophoresis); and (c) determining the sample genotype from the amplified alleles.
-
This genotyping strategy should guarantee that the genotype determined from
amplification products is in fact the actual sample genotype. In practice, however,
conventional genotyping methods carry associated a percentage of error, which is
dependent on the experimental conditions used.
-
Genotyping errors have very negative consequences in genetic analyses and in the
applications derived from such analyses. Obviously, genotyping errors may have serious
consequences if they lead to the erroneous identification of human individuals (e.g. in
criminal analyses, in paternity testing, etc.). Likewise, genotyping errors may lead to wrong
medical diagnoses which may be especially pernicious in disease diagnosis,
preimplantational diagnosis, tissue and organ transplantation, etc. On the other hand, it is
known that genotyping errors negatively influence the accuracy of genetic analyses, leading
to serious drawbacks such as loss of power in gene-mapping studies, significant distortion
of map distances and false exclusion of the true location of a disease-predisposing gene
(Buetow, 1991; Goldstein et al., 1997; Göring and Terwilliger, 2000). The negative effects
of genotyping errors may be even greater in gametic disequilibrium analyses (Zapata et al.,
2001a; Zapata et al., 2001b), because a single genotyping error can destroy evidence of past
non-recombinant meioses (Terwilliger et al., 1997; de La Chapelle and Wright, 1998;
Göring et al., 1997; Göring and Terwilliger, 2000; Akey et al., 2001).
-
An important source of genotyping errors is the occurrence of problems during
amplification that lead to the total or partial absence of the amplification product of, at
least, one of the alleles originally present in the sample. The partial absence of the
amplification product of an allele, or partial non-amplification, is also known as preferential
amplification (Walsh et al., 1992). The total absence of the amplification product of an
allele, or total non-amplification, is known as allele dropout (Findlay et al., 1995; Gagneux
et al., 1997) or null allele (Pemberton et al., 1995).
-
The occurrence of this type of problem during the amplification procedure has
serious consequences. In the case of heterozygous diploid samples, total non-amplifications
and some partial non-amplifications lead to the incorrect genotyping of the sample as
homozygous (Demers et al., 1995; Findlay et al., 1995; Pemberton et al., 1995; Fishback et
al., 1999; Anderson et al., 2000).
-
In view of the serious consequences of genotyping errors in genetic analyses and in
genetic applications, considerable efforts have been made:
- 1.- to identify the causes of total and partial non-amplifications;
- 2.- to detect and/or prevent genotyping errors due to total and partial non-amplifications.
-
1. Causes of total and partial non-amplifications
-
Recent analyses have revealed the common causes of total and partial non-amplification.
The partial non-amplification of one allele in diploid samples can result from
several factors such as: (a) significant GC% differences between alleles from a
heterozygous sample (these differences can allow the denaturation of one allele but not the
other, phenomenon known as differential denaturation) (Walsh et al., 1992); (b) between-allele
length differences, resulting in the preferential amplification of the shorter allelic
product (probably favoured when Taq polymerase is limiting) (Walsh et al., 1992); (c)
stochastic fluctuations in the number of copies of each allele (Walsh et al., 1992); (d)
mismatches between the primers and one allele (which may result from mutations in the
priming region) (Walsh et al., 1992); (e) damage to the DNA template (by ultraviolet
irradiation or by monovalent salts such as sodium chloride, sodium acetate or ammonium
acetate) (Mutter and Boynton, 1995); (f) low-stringency primer annealing (which may
result from the coamplification either of the locus and an internal control for sizing the
amplified alleles, or of more than one polymorphic sequence) (Weissensteiner and
Lanchbury, 1996).
-
It has been suggested that total non-amplification may result from extreme partial
non-amplification (Findlay et al., 1995; Ronai et al., 2000). Therefore, mechanisms that
lead to partial non-amplification can also lead to total non-amplification. In addition, other
evidence shows that the total non-amplification rate is especially high when template
concentration in the sample is low (Gagneux et al., 1997; Lissens and Sermon, 1997). This
is the case when the genotyping is done either from a single cell (for instance, in
preimplantational genetic diagnosis), or from biological remains that are degraded and/or
retain little DNA (as may occur in several forensic analyses). In these cases, total non-amplitication
is favoured by factors such as (a) chromosomal mosaicism, and more
specifically the presence of haploid cells in an otherwise diploid embryo (Harper et al.,
1995); (b) the method used for lysing the cell before PCR (Lissens and Sermon, 1997, and
references therein); (c) the denaturation temperature at the start of the first PCR cycle (Ray
and Handyside, 1996); (d) DNA breaks produced by endogenous endonucleases (Lissens
and Sermon, 1997); (e) suboptimal PCR conditions (Handyside and Delhanty, 1997); and
(f) rapid degradation of the target DNA during thermocycling (Handyside and Delhanty,
1997).
2. Detection and/or prevention of genotyping errors due to total or partial non-amplifications
-
Several improvements of conventional genotyping methods have been proposed for
detecting and/or preventing genotyping errors due to total and partial non-amplifications.
Basically, these may be divided into two categories: (2.1) direct methods and (2.2) indirect
methods.
2. 1. Direct methods
-
Direct methods are based on (a) improvement of amplification conditions for
preventing the occurrence of total or partial non-amplifications and (b) improvement of the
system for the detection of amplified alleles.
- (a) Improvement of amplification conditions
Several optimizations of amplification conditions have been suggested for trying to
prevent the occurrence of partial non-amplifications, including: (a) not using either a DNA
template concentration higher than 200 ng or an extension time longer than 2 min (Deka et
al., 1992); (b) substitution of dGTP either for 7-deaza-2'-dGTP (Mutter and Boynton,
1995) or for 2'-desoxyinosine-5'-triphosphate (dITP) (Ronai et al., 2000); (c) using PNA
(Peptide Nucleic Acid) during the amplification procedure (Demers et al., 1995); (d) using
double-strand-destabilizing cosolutes such as betaine and glycerol (Weissensteiner and
Lanchbury, 1996); (e) increasing the KCl concentration (Fishback et al., 1999).Optimizations of amplification conditions that have been suggested for reducing the
occurrence of partial non-amplifications include: (a) increasing the denaturation
temperature (Lissens and Sermon, 1997); (b) carrying out whole-genome amplification by
primer extension pre-amplification (PEP) followed by nested PCR (Handyside and
Delhanty, 1997); (c) approaches for increasing the DNA-template amount, such as biopsy
of more than one embryo cell (Harper et al., 1996), or increase in the number of fetal cells
isolated from maternal fluids (Garvin et al., 1998), etc.
- (b) Improvement of the system for the detection of amplified alleles
Similarly, improvements in the system for the detection of amplified alleles have
been suggested for the detection of genotyping errors due to total and partial non-amplifications.
For instance, Findlay et al. (1995) have demonstrated that fluorescent PCR
decreases the genotyping error rate due to total and partial non-amplifications. This is
because fluorescent PCR, which is much more sensitive than conventional PCR, allows
detection of samples which are classified by conventional PCR as homozygotes but which
are in fact heterozygous with extreme partial non-amplification.In this connection, it has been pointed out that the definitive method for high-resolution
genotyping is the detection of polymorphisms through fluorescent-automatic-sequencing
by the use of automated sequencers based on capillary electrophoresis, such as
the ABI PRISM 310 or the ABI PRISM 3100 (Applied Biosystems, 2001). This approach
could potentially detect genotyping errors due to partial non-amplifications. Nevertheless,
the genotyping problem associated with total non-amplification remains unresolved when
automated sequencers such as the ABI PRISM 310 are used (Garvin et al., 1998). In fact,
several authors have recently indicated that genotyping errors are inevitable (Douglas et al.,
2000; Göring and Terwilliger, 2000) and more difficult or impossible to detect when
Mendelian information is unavailable (Weeks et al., 2000).Consequently, the suggested improvements of amplification conditions or of the
detection system do not eliminate all partial or total non-amplifications, and do not ensure
detection of all genotyping errors due to these PCR errors.
-
2. 2. Indirect methods
-
An alternative for detecting genotyping errors due to total or partial non-amplification
is to resort to indirect methods such as: (a) replicating the amplification a
sufficient number of times to obtain a reliable genotype, and (b) Mendelian analysis.
- (a) Amplification replicates
It has been suggested that three replicates of one sample (i.e., repeating the
amplification and detection of amplified alleles three times) should detect 95% of
genotyping errors due to total or partial non-amplifications (Gagneux et al., 1997). Taberlet
et al. (1996) have suggested that this percentage may be increased to 99% when seven
replicates are performed, although this remains controversial (Weissensteiner, 1997;
Taberlet, 1997).Nevertheless, this strategy has two main limitations. First, it does not allow a priori
identification of the samples with total or partial non-amplification. Therefore, it is
necessary to carry out several PCR replicates of all apparent homozygotes, given that
conventional genotyping methods do not distinguish between homozygous samples and
heterozygous samples with total non-amplification. Obviously, this approach is hardly
applicable in studies in which a large number of individuals are analyzed (e.g. in genome
scans and in many population and epidemiological analyses). Second, the applicability of
this strategy is seriously limited by DNA availability, because the amount of DNA is often
very reduced (for instance, in preimplantational genetic analyses, in forensic studies in
which samples are degraded or contain very little DNA, as in the case of hairs, etc.).
- (b) Mendelian analysis
Another indirect method valuable for detecting a broad range of genotyping errors is
Mendelian analysis (Ewen et al., 2000). However, this procedure is not always applicable,
because samples biologically related with the sample of interest are not always available.
Moreover, genotyping errors may not always be readily detectable as inconsistencies in
Mendelian inheritance, especially in studies of small families (Weeks et al., 2000).
-
-
In view of the above, it is evident that conventional methods, based on genotyping
from amplified alleles, are not effective for detecting and/or preventing genotyping errors
due to total or partial non-amplification. Notably, such errors occur even after the use of
direct and indirect methods for detecting and/or preventing them specifically. There is thus
a clear need for new genotyping methods that are effective for detecting and/or preventing
genotyping errors due to total or partial non-amplifications.
-
Recent evidence suggests that several products generated by PCR during allele
amplification (particularly heteroduplexes) may be used as an additional source of
information in the identification of heterozygous samples (Wilkin et al., 1993; Neilan et al.,
1994; Ardren et al., 1999) and in the detection of homoplasy (Szibor et al., 1996; Haddad
et al., 1997; Ardren et al., 1999). As far as we know, however, these reports have not
considered the possibility that additional products other than the amplified alleles
themselves may be of value in the detection and/or prevention of genotyping errors
originating from total or partial non-amplifications.
-
The present invention is a genotyping method, called Genotyping Based on
Diagnostic Amplification Products (GEDAP), which enables the detection and/or
prevention of genotyping errors due to total or partial non-amplification. The method is
reproducible, reliable and accurate. It is based on a genotyping strategy different to that
used in conventional methods. The GEDAP method consists of inducing the formation of
homoduplexes of amplified alleles and other Diagnostic Additional Products (DAPs), and
analyzing them jointly to determine the genotype of a locus from a diploid or polyploid
sample. Most notably, it promotes the formation of genotype-specific DAPs and allele-specific
DAPs. The joint analysis of these two types of DAP together with the
homoduplexes of the amplified alleles is used in the GEDAP method to reveal whether a
total or a partial non-amplification of at least one allele has been produced, or not, during
the amplification of the polymorphis locus of interest.
-
Thus, in one aspect, GEDAP allows the detection of genotyping errors due to total
or partial non-amplifications, on the basis of the detection of anomalous combinations of
homoduplexes and DAP. In other aspect, it also allows the prevention of genotyping errors
due to total or partial non-amplifications, on the basis of the detection of expected
combinations of homoduplexes and DAP genotype-specifics.
-
The GEDAP method to a great extent resolves the limitations of conventional
methods. Thus, it allows the precise identification of amplification products associated with
total or partial non-amplifications, considerably reducing the number of PCR replicates
needed to detect genotyping errors associated with these problems. On the other hand, the
GEDAP method provides an internal control of PCR quality, so that it is unnecessary to
resort to indirect methods for detecting and/or preventing genotyping errors. In addition, it
may be partially or totally automated, for what it may be used to optimize high throughput
genotyping.
-
The GEDAP method is applicable to all diploid or polyploid organisms, including
animals and plants. It is equally applicable for genotyping transgenic and cloned organisms.
In practice, the method is likely to be used mainly in medical contexts and for
commercially profitable applications.
-
By way of illustration, we demonstrate that the GEDAP method allows the effective
detection and/or prevention of genotyping errors due to total or partial non-amplifications
produced during the amplification of dinucleotide-repeat microsatellites. It is therefore
useful for applications derived of the use of these DNA markers. In the biotechnological
industry it may be applied, for instance, in disease diagnosis, preimplantational genetic
diagnosis, genetic therapy, tissue and organ transplantation, pharmacogenetics, paternity
testing, forensic analyses, and in the elaboration or improvement of genotyping software. In
basic science, it may be applied, for instance, in population genetics and in genome
mapping.
-
These and other objects, features and advantages of the new genotyping method will
be clear to a person of ordinary skill in the art upon reading the following detailed
description in light of the append drawings.
Brief description of the drawings:
-
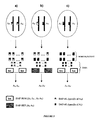
- Figure 1 provides a schematic illustration of the genotyping of a polymorphic locus
(A) having two different alleles (AX, AY) from diploid samples.
- Figure 2 provides a schematic illustration of the basis of conventional genotyping
methods.
- Figure 3 provides a schematic illustration of the basis of the GEDAP method.
- Figure 4 provides a schematic illustration of those types of genotyping error due to
total or partial non-amplification which are neither detected nor prevented by conventional
genotyping methods.
- Figure 5 provides a schematic illustration of the detection and prevention by the
GEDAP method of genotyping errors due to total and partial non-amplifications.
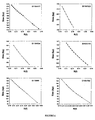
- Figure 6 shows electrophoretic-system resolution and precision, on the basis of R(f)
values for the alleles of six dinucleotide-repeat microsatellites.
- Figure 7 shows two gels which illustrate how non-denaturing electrophoretic
conditions favour the presence of DAPs, compared with denaturing electrophoretic
conditions.
- Figure 8 provides a schematic illustration of bands corresponding to homoduplexes
(homoduplex bands), to DAP-ALs (diagnostic shadow bands and stutter bands), to DAP-HOMs
(faint bands) and to DAP-HETs (heteroduplex bands).
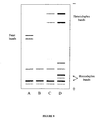
- Figure 9 provides a schematic illustration of the detection of genotyping errors by
the GEDAP method, through the identification of anomalous band patterns (B and C),
compared with normal band patterns (A and D).
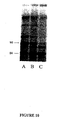
- Figure 10 shows a gel which illustrates the prevention of errors in the genotyping of
heterozygous samples by the GEDAP method, through the joint analysis of homoduplex
bands, diagnostic shadow bands, stutter bands, faint bands and heteroduplex bands.
- Figure 11 shows a gel which suggests an apparent parentage exclusion detected by
the D11S1760 dinucleotide repeat.
- Figure 12 shows a gel which illustrates how the GEDAP method reveals that the
apparent parentage exclusion of Figure 11 is in fact a genotyping error due to a total non-amplification.
-
WAY OF FULFILMENT
-
In this section, we describe in detail how to apply the GEDAP method. Firstly, we
describe how to generate and identify the homoduplexes and the Diagnostic Additional
Products (DAPs). Secondly, we describe how genotyping errors may be detected and/or
prevented, and the advantages of GEDAP with regard to conventional methods. Thirdly, we
evaluate the efficacy of the method. Finally, we show two examples for elucidating some of
the applications of the present invention.
A) GENERATION AND IDENTIFICATION OF HOMODUPLEXES AND DAP
-
The GEDAP method can genotype any locus comprising a nucleic acid sequence
with at least two different alleles. In the preferred embodiment, the locus is any DNA
marker with tandem repetitions of one or more nucleotides.
-
The genotyping begins with the obtention of any sample containing, or suspected of
containing, at least two alleles from the locus of interest. In the preferred embodiment, the
samples are blood samples from human individuals.
-
The locus alleles are then amplified under homoduplex- and DAP-inducing
conditions. The amplification can be carried out from the nucleic acids contained in the
sample, without isolating them from the remaining sample components (e.g. Yue et al.,
2001). Another possibility is to purify the nucleic acids prior to amplification. In the
preferred embodiment, the DNA is isolated prior to allele amplification. There are
numerous standard methods to isolate DNA from whole blood, other tissues, hair, faeces,
saliva, etc. In the preferred embodiment, the DNA is isolated using a commercial kit for
extracting DNA from whole blood samples (QIAamp blood kit, QIAGEN).
-
A suitable technique for amplifying the locus alleles under conditions favouring
homoduplexes and DAP formation, is the Polymerase Chain Reaction (PCR), although
other DNA or RNA amplification procedures such as Nucleic Acid Sequence Based
Amplification (NASBA), the Transcription-based Amplification System (TAS), Self-sustained
Sequence Replication (3SR), Q-beta replicase, Ligation Amplification Reaction
(LAR) and the Ligase Chain Reaction (LCR) (Dr bek, 2001) can be used. PCR allows the
in vitro amplification of one or more specific sequences of DNA present in a nucleic acid,
or mixture of nucleic acids, using primers and agents for polymerization. The extension
product of one primer, when hybridized to the other, becomes a template for the production
of the desired specific nucleic acid sequence, and viceversa. This process is repeated as
often as is necessary to produce the desired amount of the sequence. The following method
for PCR amplification is standard, and can be readily applied to amplify every
microsatellite DNA marker with tandem repetitions of one or more nucleotides.
-
In the preferred embodiment to carry out the PCR amplification, the nucleic acid of
the sample is mixed with the other components of the PCR reaction. These other
components include, but are not limited to, the standard PCR buffer (containing Tris pH
8.0, 50 mM KCl, 2.5 mM magnesium chloride), the triphosphate deoxynucleotides (dTTP,
dCTP, dATP, dGTP), and the thermostable polymerase (e.g. Taq polymerase). The total
amount of each mixture component is determined by the final volume of each PCR reaction
and the number of reactions.
-
The primer sequences and the specific conditions suitable for amplifying each
marker can be obtained from available databases (for instance, Genome Database, GDB:
http://www.gdb.org or Généthon: http://www.genethon.fr). The primers for amplifying
each marker can either be synthesized (see, for instance, Beacauge et al., 1981; Caruthers et
al., 1988; Haralambidis et al., 1990) or purchased from commercial vendors. Primers may
also be derivatized to facilitate their detection (for instance: with fluorochromes,
radioisotopes, ligands for chemiluminescent detection, ligands such as digoxigenin for
immunochemical detection, etc.).
-
The PCR reactions are performed by heating and cooling the reaction mixture to
specific locus-dependent temperatures that are given by the known PCR conditions.
Typically, the thermocycling protocol consists of:
- a) An initial denaturation step (e.g. 94°C for 3 minutes)
- b) Repeat from 20 to 40 times:
- b1.- a denaturation step (e.g. 94°C for 30 seconds)
- b2.- an annealing step (e.g. 55°C for 30 seconds)
- b3.- an elongation step (e.g. 72°C for 30 seconds)
- c) A final elongation step (e.g. 72°C for 2 minutes).
-
-
The experimental conditions used in PCR favour the generation of homoduplexes of
the amplified alleles and the generation of other additional products, including DAP. The
denaturation of nucleic acids present in the reaction mixture used during the PCR, and their
subsequent renaturation, is a particularly important source of homoduplexes and other
additional products. The number of homoduplexes and additional products generated in
PCR depends, firstly, on whether the nucleic acids resulting from the amplification have a
different sequence or not. Thus, in reaction mixtures of homozygous samples (in which
locus alleles have the same sequence), the consecutive cycles of denaturation and
renaturation will generate a single type of homoduplex. On the contrary, in reaction
mixtures of heterozygous samples (in which at least two locus alleles have a different
sequence), such cycles will generate a number of homoduplexes equal to the number of
different sequences present in these reaction mixtures. In addition, in heterozygous
samples, the subsequent denaturation-renaturation cycles also will induce heteroduplexes
resulting from the hybridization of two strands of nucleic acids with different sequences.
-
In addition to the aforementioned homoduplexes and heteroduplexes, PCR also
induces the formation of other types of additional products. For instance, when Taq
polymerase carries out the elongation procedure, it may make mistakes that lead to the
synthesis of nucleic acids with a sequence different to the sequence of the DNA template.
One such mistake produced by the mechanism known as DNA slippage, occurs with
relative frequency in the amplification of microsatellite markers with tandem repetitions of
one or more nucleotides. Thus, in the case of dinucleotide-repeat microsatellite markers, the
slippage gives rise to the formation of nucleic acids with a gain or a loss of one repeat unit
(2 nucleotides) in relation to the original DNA template (although the probability of losing
a repeat unit is much greater than that of gaining one; Miller and Yuan, 1997). The
subsequent denaturation-renaturation cycles will thus induce double-stranded nucleic acids,
different to the homoduplexes, resulting from the hybridization of two complementary
strands generated by slippage. In the same way, new heteroduplexes resulting from the
hybridization between the strands generated by slippage and the allele strands can also be
formed.
-
It has been reported that some oligonucleotides can bind to double-stranded DNA,
forming stable intermolecular triplexes (Durland et al., 1991; for review see Frank-Kamenetskii
and Mirkin, 1995). Another possible source of additional products in PCR is
therefore the generation of triplexes through the binding of at least one of the primers used
in the amplification and one or more of the double-stranded nucleic acids present in the
reaction mixture. Other components of the reaction mixture used in the amplification may
also induce the formation of intermolecular triplexes. Thus, it has been reported that the
DNA analog Peptide Nucleic Acid (PNA), used in PCR for enhancing DNA amplification
and reducing the occurrence of preferential amplification (Demers et al., 1995), also
induces triplex formation (for review see Frank-Kamenetskii and Mirkin, 1995).
-
Once the PCR has finished, additional products may still be generated. Among the
potential causes of the generation of such additional products are the formation of
complexes among the reaction mixture components, and the occurrence of conformational
changes in the nucleic acids generated by PCR. For instance, it is known that DNA
fragments with tandem repetitions of the CA dinucleotide associate spontaneously with
each other in vitro, forming stable four-stranded structures that can be detected by gel
electrophoresis and electron microscopy (Gaillard and Strauss, 1994). In the same way, the
GA motif confers remarkable conformational polymorphism on DNA, with possible
conformations including tetraplexes (Lee, 1990), single-stranded acid fold (Dolinnaya and
Fresco, 1992; Dolinnaya et al., 1993; Ortiz-Lombardía et al., 1995), parallel-stranded
duplex (Lee, 1990), antiparallel-stranded duplex (Huertas et al., 1993; Casasnovas et al.,
1993), zinc-specific duplex (Ortiz-Lombardía et al., 1995) and tetraplex composed of two
hairpins (Shiber et al., 1996; Mukerji et al., 1996). Other motifs, such as the AT motif,
likewise confer conformational polymorphism on DNA (see Vorlícková et al., 1998 and
references therein).
-
The formation of such additional products once the PCR has finished may be
spontaneous. The generation of these additional products can also be deliberately induced
by specific experimental conditions. One approach is to first denature the amplification
products by use of some physical, chemical or biological procedure (such as thermal
denaturation, electrochemical denaturation by application of voltage, the use of denaturing
agents like formamide, urea or EDTA, or enzymes), then to renature the products again.
Other approaches for inducing the formation of additional products include subjecting the
amplification products to changes in temperature, salt concentration, pH or the
concentration of bivalent ions (see, for instance, Dolinnaya and Fresco, 1992; Noonberg et
al., 1995; Ortiz-Lombardía et al., 1995; Vorlícková et al., 1998; for review see Frank-Kamenetskii
and Mirkin, 1995).
-
Once the homoduplexes and the additional products have been generated, the
analyst can proceed to identify the amplification products needed for genotyping the
sample, i.e., the homoduplexes and the DAPs. For identifying them, one can use any-nucleic
acid identification system which maintains at least some of the homoduplexes and
DAPs generated previously. For optimal application of the claimed method, however, it is
more useful to use a system which not only maintains the existing homoduplexes and DAPs
but also offers the capability to generate new DAPs.
-
DNA electrophoresis under non-denaturing conditions is a suitable system both for
maintaining homoduplexes and DAPs, and for generating new DAPs. It is well known that
non-denaturing electrophoresis is a very sensitive means of separating and identifying of a
wide variety of DNA conformations. Thus, it is known that triplexes remain intact during
electrophoresis in magnesium-containing polyacrylamide gels (Durland et al., 1991).
Similarly, non-denaturing electrophoresis is one of the systems used for detecting the
presence of tetraplexes (Lee, 1990), single-stranded acid fold (Dolinnaya and Fresco, 1992;
Dolinnaya et al., 1993; Ortiz-Lombardía et al., 1995), parallel-stranded duplexes (Lee,
1990), antiparallel-stranded duplexes (Huertas et al., 1993; Casasnovas et al., 1993), zinc-specific
duplexes (Ortiz-Lombardía et al., 1995), tetraplexes composed of two hairpins
(Shiber et al., 1996; Mukerji et al., 1996), etc. Therefore, non-denaturing electrophoresis
allows maintenance not only of homoduplexes but also of additional products generated
during or after amplification.
-
It is also known that non-denaturing electrophoresis can promote the formation of
additional products, such as intermolecular triplexes. For instance, non-denaturing
electrophoresis generates triplexes when a faster migrating single strand overtakes a slower
migrating band containing a duplex of appropriate sequence ("capture in the gel";
Belotserkovskii and Johnston, 1996). In addition, the formation of double-hairpin tetraplex
has been reported to occur when a high ionic strength is used during non-denaturing
electrophoresis (Shiber et al., 1996). Similarly, it is known that non-denaturing
electrophoresis generates bands different to allele bands in analyses of some microsatellite
markers. These new bands probably originate from alterations of the double helix curvature
(Lareu et al., 1998) or by hairpin loop formation in AT-rich sequences (Prinz et al., 1996).
-
Besides maintaining existing homoduplexes and DAPs, and generating new DAPs,
DNA electrophoresis under non-denaturing conditions allows the identification of
homoduplexes and DAPs on the basis of their physical separation through the effects of the
electrical field. Once the electrophoresis has finished, one can proceed to observe the
generated bands by any means that allows the detection of DNA, such as silver staining,
ethidium bromide staining, etc.
-
It should be stressed that non-denaturing electrophoresis is the preferred technique
of identification, but that the present claim extends to any appropriate technique.
Specifically, any technique allowing the identification of homoduplexes and DAPs can be
used, such as mass spectrometry, chromatography, differential hybridization, sequencing by
hybridization, etc.
-
Once the homoduplexes and the DAPs have been identified, one can proceed to
infer the sample genotype by the GEDAP method.
B) BASIS AND ADVANTAGES OF THE GEDAP METHOD
-
The basis and the advantages of the proposed method will become apparent in the
following comparison of conventional genotyping methods and the GEDAP method. This
comparison is established taking as an example the genotyping of a polymorphic locus with
two alleles from diploid samples (figure 1).
-
The outstanding difference between the GEDAP method and conventional
genotyping methods is in the additional products generated during or after the
amplification. Thus, conventional methods are based on the genotyping of a polymorphic
locus taking into account only the alleles amplified from the sample (figure 2). Any other
additional product is considered artefactual, and as such something that should ideally be
minimized or eliminated (see for instance Perlin et al. 1994, Schlötterer, 1998). Therefore,
under optimal conditions, homozygous samples will give only one amplified allele (figure
2, a and c), while heterozygous samples will give two different amplified alleles (figure 2,
b).
-
On the contrary, the GEDAP method is based on the genotyping of a polymorphic
locus from the joint analysis of the identified homoduplexes and DAPs (figure 3). The
DAPs are considered to provide additional information useful for corroborating the sample
genotype, and these components are thus deliberately induced. The DAPs useful for
genotyping can be divided into two different types: additional genotype-diagnostic products
(DAP-HOM and DAP-HET) and additional allele-diagnostic products (DAP-AL). The
presence of such DAP types emphasizes the differences existing between homozygous and
heterozygous samples. Thus, under optimal conditions, homozygous samples will give only
one homoduplex, with at least one DAP-HOM and at least one DAP-AL specific for that
homoduplex (figure 3, a and c). On the contrary, heterozygous samples will give two
homoduplexes, with at least one DAP-HET and at least one DAP-AL specific for each
homoduplex (figure 3, b).
-
The different approaches used in conventional genotyping methods and in the
GEDAP method result in a different capability for detecting and/or preventing genotyping
errors due to total and partial non-amplifications. Thus, conventional methods do not allow
distinction between heterozygous samples with total non-amplification (figure 4, b1) and
genuinely homozygous samples (figure 4, a), because both give only one amplified allele.
On the other hand, heterozygous samples with partial non-amplification (figure 4, b2) may
be mistaken for homozygous samples (figure 4, a), especially if the amount of
hypoamplified allele is below the threshold detection level. Conventional methods are
therefore ineffective in both circumstances, both for detecting and for preventing
genotyping errors.
-
By contrast, the GEDAP method enables effective detection and/or prevention of
genotyping errors in both cases. On the one hand, the GEDAP method enables
discrimination between heterozygous samples with total non-amplification and genuinely
homozygous samples. This is due to the fact that, although both types of samples give a
single homoduplex, there are differences between them as regards the DAPs. Thus,
heterozygous samples with total non-amplification do not give DAP-HOMs (figure 5, b1),
while genuinely homozygous samples do give DAPs of this type (figure 5, a). On the other
hand, the GEDAP method also eliminates the confusion between heterozygous samples
with partial non-amplification and genuinely homozygous samples. This is due to the fact
that heterozygous samples with partial non-amplification may be identified by the presence
of DAP-ALs specific for the two homoduplexes and/or by the presence of DAP-HETs
(figure 5, b2), both types of DAPs being absent in genuinely homozygous samples (figure
5, a).
-
In short, the GEDAP method allows the detection of genotyping errors by the
identification of anomalous combinations of homoduplexes and DAP; it also ensures the
prevention of genotyping errors by the identification of expected combinations of
genotype-specific homoduplexes and DAPs. In both cases, the consideration of DAP-HOMs,
DAP-HETs and DAP-ALs is a fundamental level of control for determining
whether a sample genotype is homozygous or heterozygous.
C) EFFICACY OF THE GEDAP METHOD
-
The efficacy of the GEDAP method can be estimated statistically. Specifically, one
can test whether the genotype frequencies observed in a population sample deviate
significantly from the genotype proportions expected under Hardy-Weinberg (HWP).
Analyses that concentrate departures from HWP in a single degree of freedom (Gomes et
al., 1999), together with large sample sizes, greatly increase power in the detection of such
departures. This type of statistical analysis is a very powerful means for detecting
genotyping errors (Chakraborty et al., 1992; Gomes et al., 1999). Most importantly, non-amplifications
of one of the alleles present in heterozygous samples lead to a heterozygote
deficiency relative to HWP. Therefore, if one genotypes a large populational sample and
detects no significant departure from HWP, one can conclude that the GEDAP method is
effective for detecting and/or preventing genotyping errors.
D) APPLICATIONS OF THE GEDAP METHOD
-
In this section, we list some of the applications of the GEDAP method, in two
representative contexts: the genotyping of dinucleotide-repeat microsatellites, and paternity
testing. These examples are only illustrative embodiments of the present invention, and
their description below is not intended to limit either its scope or its applications. In other
words, the claim extends to other applications and procedures that embody the spirit of the
present invention.
EXAMPLE 1: DETECTION AND/OR PREVENTION OF ERRORS IN THE
GENOTYPING OF DINUCLEOTIDE REPEAT MICROSATELITES
-
The following example illustrates in detail how to use the GEDAP method for
detecting and/or preventing errors in dinucleotide repeat typing from human samples.
1. SAMPLES, DNA EXTRACTION AND MARKERS
-
405 unrelated individuals living in Galicia (NW Spain) were analysed. DNA was
extracted from whole blood samples using a commercial kit (QIAamp blood kit, QIAGEN).
All individuals were genotyped for 6 dinucleotide repeats located on human chromosome
11: D11S4177, D11S1323, D11S4124, D11S1318, D11S909 and D11S1760 (Dib et al.,
1996).
2. AMPLIFICATION
-
The alleles of each marker present in each sample were amplified by the Polymerase
Chain Reaction (PCR). The specific primer sequences for amplifying each locus were taken
from the Généthon database (http://www.genethon.fr). Amplifications were performed in a
final volume of 25 µl, containing 120 ng genomic DNA, 10 mM Tris-HCl (pH 9.0), 10%
glycerol (v/v), 50 mM KCl, 0.1% Triton X-100, 1.5 mM MgCl2, 50 pmol of each primer,
200 µM dNTP mix, and 1 U Taq DNA polymerase. Amplifications were carried out in
GeneAmp PCR System 2400 thermocyclers (Perkin-Elmer, Norwalk, CT, USA), and
consisted of 35 cycles of denaturation (94°C, 40 s) and annealing (55°C, 30 s). After the
last cycle, an additional extension step (72°C, 2 min) completed the process.
3. GENERATION OF HOMODUPLEXES AND DAPs
-
Thermal conditions used during amplification favoured the generation of
homoduplexes and DAPs. In addition, the electrophoretic system used for detecting
homoduplexes and DAP maintained at least some of the homoduplexes and DAP already
formed and induced the formation of new DAPs (see section 5).
4. DETECTION OF HOMODUPLEXES AND DAPs
-
The homoduplexes and DAPs generated from the amplification products of each
sample were resolved by non-denaturing ultrathin-layer polyacrylamide gel electrophoresis
using a discontinuous borate/formate buffer system.
-
Polyacrylamide gel thickness was 0.4 mm. Gel dimensions were 13.5 cm width by
20 cm length for loci D11S1760 and D11S909, and 13.5 cm width by 24 cm length for the
remaining microsatellites analysed. The holder used for gel polymerization was a 2-mm-thick
plain-glass plate treated with Bind Silane (Pharmacia 17-1330-01). Polyacrylamide
pore size was 7.7% T 6.3% C for loci D11S1760 and D11S909, and 6.7% T 7.1% C for the
remaining microsatellites analysed. The total monomer concentration (%T) and the total
concentration of the crosslinker monomer (%C) were defined as %T = [(a + b) / VT] 100
%T = [a / (a + b)] 100; a and b denote grams of acrylamide and piperazine diacrylamide
(PDA), respectively, and TV the total volume of gel solution. The gel buffer was 0.33 M
Tris, 110 mM formate, 24 mM borate, and 6% glycerol (v/v) (pH 9.0). 2.5 mM ammonium
persulfate and 1.6 µl of TEMED (Merck 1.10732) per mililitre of gel solution were added
for polymerization. Next, gels were keept in darkness at 37°C during 20 minutes, prior to
electrophoresis.
-
The electrode buffer was applied to the gel by two blotting pads of 1 cm in width
(
Blotting Paper, Sigma P-7176) dipped in 1 M Tris containing 0.28 M borate (pH 9.0).
Pads were positioned at both ends of the gel and electrodes over the pads. The effective
interelectrode distance in gels of 24 and 20 cm in length was 22 and 18 cm, respectively.
Application tabs of fiberglass (
IEF sample appl. piece, Pharmacia Biotech 80-1129-46), 3.3
x 2.5 mm, were used for sample application, at 0.5 cm from the cathode. Each tab
contained 3 µl of each solution. The voltage and the running time used for each marker
varied from 600 V to 700 V and from 2h 30 min to 4 h, respectively (see the attached
table). Intensity and power were kept constant at 25 mA and 20 W, respectively.
Electrophoresis was performed at a constant temperature of 15°C in the Multiphor II
system (LKB Pharmacia), using Bromophenol Blue as migration marker.
| Electrophoretic conditions used to resolve each microsatellite. |
| Locus | D11S4177 | D11S1323 | D11S4124 | D11S1318 | D11S909 | D11S1760 |
| Voltage | 700 V | 700 V | 700 V | 600 V | 600 V | 600 V |
| Time | 4 h | 3h 40 min | 3h 15 min | 3h 15 min | 2h 45 min | 2h 30 min |
-
After each electrophoresis had finished, homoduplexes and DAP were visualized by
silver staining as described by Budowle et al. (1991).
Features of the electrophoretic system:
-
The electrophoretic system used for detecting the homoduplexes and the DAPs has
several key features for reducing the chance of genotyping errors. On the one hand it
ensures maintenance of homoduplexes and DAPs generated during the PCR, and at the
same time induces the formation of new DAPs, so that it is useful for detecting and/or
preventing genotyping errors by the GEDAP method. On the other hand, the system also
allows resolution of amplification products from dinucleotide-repeat microsatellites with
single base resolution and high precision in allele sizing. It is thus useful for reducing the
likelihood of genotyping errors due both to the absence of single-base resolution (Smith et
al., 1995; Schlötterer, 1998; Wenz et al., 1998), and to anomalous electrophoretic
migrations among the alleles within a locus (Kimpton et al., 1995; Prinz et al., 1996).
-
The resolution and precision of the electrophoretic system become apparent when
the homoduplex band sizes are plotted against their relative mobilities, R(f), calculated as
the migration distance from the anodal edge of the sample tab to the homoduplex band,
divided by the distance from the anodal edge of the tab to the boundary. Figure 6 shows the
resolution and the precision of the electrophoretic system, under the conditions used for
resolution of the alleles of the six microsatellites analysed. The observed R(f) differences
among homoduplex bands that vary in size by two base pairs, are large enough to
discriminate differences of a single base pair. Indeed, single-base differences among
homoduplex bands from the dinucleotide-repeat microsatellite locus D11S1759, analysed
in our laboratory, are clearly detectable using this electrophoretic system (data not shown).
-
Figure 6 also shows that this electrophoretic system offers a high level of precision
for sizing the homoduplex bands of dinucleotide-repeat microsatellites. It should be
remembered that electrophoretic anomalies leading to inaccuracies in allele sizing are
typically mobility shifts, band compression or among-allele differences in relative
mobilities (Prinz et al., 1996). In figure 6, however, it can be seen that there is no evidence
of this type of anomaly among the homoduplex bands of the loci analysed.
-
In addition, the characteristics of this electrophoretic system (non-denaturing
conditions, high ionic strength, suitable temperature, etc.) allow maintenance of existing
and induction of new homoduplexes and DAPs (figure 7, a). It is important to stress that the
electrophoretic conditions decisively affect the detection of DAPs. Figure 7, b shows how
the use of both denaturing conditions and a running temperature of 50°C lead to the
detection of allele bands only. This is readily understood in view of the fact that DAPs
result from the formation of complexes and/or from conformational changes of
amplification products, and that the use of both denaturing conditions and a high
temperature prevents the hybridization of nucleic acid strands. It must be remembered that
this is the approach followed by conventional genotyping methods, and that the present
invention is based on the contrary approach: that is, on the deliberate induction of DAP-generating
complex formation and DAP-generating conformational changes.
5. IDENTIFICATION OF HOMODUPLEXES, DAP-ALs, DAP-HOMs, AND DAP-HETs
-
Homoduplexes and DAPs were identified from the band patterns observed in gels
(figure 8).
5.1. IDENTIFICATION OF HOMODUPLEXES AND DAP-ALs
-
On the one hand, this electrophoretic system allows the identification of
homoduplexes and DAP-ALs from the observation of three types of bands: homoduplex
bands, Diagnostic Shadow Bands (DSBs) and stutter bands (figure 8). All these types of
band are useful for determining which allele or alleles have been amplified from each of the
samples analysed.
-
Each homoduplex band arises from one of the homoduplexes generated from the
amplified alleles, each homoduplex giving rise to a single homoduplex band. Homoduplex
bands may be differentiated from the remaining bands because they generally have one
associated DSB and at least one associated stutter band.
-
Stutter bands arise from DAP-ALs generated due to mistakes in allele amplification
(particularly due to Taq polymerase slippage). In this electrophoretic system these bands
were generally observed as single bands with a migration rate two bp higher than that of the
corresponding homoduplex band. When stutter bands were revealed by silver staining, they
showed lower intensity than the corresponding homoduplex band.
-
Each DSB arises from one DAP-AL resulting in turn from a conformational change
in one homoduplex. DSBs are easily distinguishable from the remaining bands because
they have a lower migration rate than the corresponding homoduplex band. In addition,
[homoduplex band]-DSB distance is almost constant within each locus. It should also be
noted that [homoduplex band]-DSB distance varies among loci (about 4 base pairs in
D11S1760; 6 bp in D11S909; 8 bp in D11S4177, D11S4124, and D11S1318; and 14 bp in
D11S1323).
5.2. IDENTIFICATION OF DAP-HOMs AND DAP-HETs
-
This electrophoretic system also allowed the identification of DAP-HOMs and
DAP-HETs, from the observation of two types of bands: faint bands and heteroduplex
bands (figure 8). Both types of band are useful for determining whether the analysed
sample is homozygous or heterozygous for a dinucleotide-repeat microsatellite.
-
Heteroduplex bands arise from DAP-HETs. Heteroduplex bands are easily
distinguishable from the remaining bands because [homoduplex band]-[heteroduplex band]
distance is higher than [homoduplex band]-[DSB distance].
-
Faint bands arise from DAP-HOMs. Faint bands are easily distinguishable from the
remainder bands because [homoduplex band]-[faint band distance] is higher than
[homoduplex band]-[DSB distance]. In addition, [homoduplex band]-[faint band] distance
is generally lower than [homoduplex band]-[heteroduplex band] distance.
6. DETECTION AND/OR PREVENTION OF GENOTYPING ERRORS
-
The GEDAP method allowed us to detect and/or prevent a relatively large number
of genotyping errors due to total or partial non-amplifications. To this end, two strategies
were adopted: one for detecting errors and one for preventing errors. Both strategies are
based on the joint analysis of the bands described in the previous section. In what follows,
we show how the two strategies were applied for genotyping the six dinucleotide-repeat
microsatellites. The efficacy of the method will be evaluated subsequently (see Section 7).
6.1- DETECTION OF GENOTYPING ERRORS
-
The GEDAP method allowed us to detect genotyping errors due to total or partial
non-amplifications. Genotyping errors were detected from samples with anomalous band
patterns, as follows:
- (a) Patterns with a single homoduplex band and without any faint band (figure 9, B);
compare with the specific band pattern expected for a homozygous genotype
(figure 9, A).
- (b) Patterns with a single homoduplex band and at least one heteroduplex band
(figure 9, C); compare with the specific band pattern expected for a heterozygous
genotype (figure 9, D).
-
-
In order to detect genotyping errors, we analysed the band patterns of 405 unrelated
individuals (a sample size large enough for detecting the possible occurrence of genotyping
errors) and performed replicate analyses of all apparently homozygous samples without
faint bands or with at least one heteroduplex band in their corresponding band patterns. The
repeat analyses were performed until faint bands, or the presence of a band pattern
corresponding to a heterozygote, were observed.
-
The results obtained confirmed that a high proportion of apparently homozygous
samples without faint bands were in fact heterozygous samples in which there has been
total non-amplification of one of the two alleles. The GEDAP method is thus useful for
detecting genotyping errors due to total non-amplifications. The frequency of the
genotyping errors detected by this approach ranged from 0% (loci D11S1323 and
D11S1760) to 2% (locus D11S909) of individuals. Different individuals showed
genotyping errors at different loci: individuals 37, 39, 57, 62, 263, 351 and 398 at
D11S4177; individuals 104, 311 and 400 at D11S4124; individual 134 at D11S1318; and
individuals 48, 80, 216, 281 and 289 at D11S909. When all six (AC)n repeats are
considered, the error rate was 5% (19/405). It is important to note that the rate of
misidentification of multilocus genotypes might be substantially increased in studies in
which a large number of loci are analysed, as in the case of genome scans.
-
In addition, the results obtained of the repeat analyses also confirmed that the
apparently homozygous samples showing at least one heteroduplex band in their band
patterns were in fact heterozygous samples in which there has been a total or partial non-amplification
of one of the two alleles. The GEDAP method is thus also useful for
detecting genotyping errors due to partial non-amplifications.
6.2- PREVENTION OF GENOTYPING ERRORS
-
The GEDAP method also allows prevention of genotyping errors. To this end, two
approaches were adopted: one for preventing errors in the genotyping of heterozygous
samples, the other for preventing errors in the genotyping of homozygous samples.
6.2.1. Prevention of errors in the genotyping of heterozygous samples
-
The approach used for preventing errors in the genotyping of heterozygous samples
consisted of genotyping a sample as heterozygous only when the electrophoretic system
generated a band pattern including two homoduplex bands and:
- (a) at least one heteroduplex band; and/or
- (b) at least one DSB associated with each of the homoduplex bands and/or
- (c) at least one stutter band associated with each of the homoduplex bands.
-
-
The reproduction of heterozygous band patterns by mixing homozygous DNAs prior
to PCR, and the population analysis of 405 unrelated individuals, confirmed that this
criterion set is sufficient for correct identification of heterozygous samples. In addition, the
use of this approach allowed us to prevent a considerable number of genotyping errors due
to partial non-amplifications. The experimental data supporting these assertions are now
described.
-
Figure 10 show how errors in the genotyping of heterozygous samples due to total
and partial non-amplifications may be prevented on the basis of the joint analysis of the
bands generated by the electrophoretic system. The figure shows the specific band pattern
for a heterozygous genotype ( alleles 90 and 84 in D11S1760) in the absence (figure 10, B)
and in the presence (figure 10, A and C) of partial non-amplification. The band pattern of
this genotype was reproduced by conditions inducing partial non-amplification (figure 10,
A and C): specifically, the DNAs from two homozygous individuals were mixed in unequal
proportions and amplification was performed from the mixed DNAs.
-
The results obtained after inducing partial non-amplification of one of the two alleles
of the heterozygous genotype revealed a marked difference in the intensity of the
homoduplex bands generated from the two alleles (figure 10, A and C). If only band
intensities are taken into account (as in conventional genotyping methods), then the
intensity difference between the two bands may lead to a genotyping error. The GEDAP
method, however, prevents such errors. This is due to the fact that both the specific
heteroduplex bands of genotype 90/84 and the stutter bands associated with the
homoduplex bands generated from alleles 90 and 84 are present in band patterns obtained
after inducing the partial non-amplification of each of the alleles of this genotype. These
bands are thus useful for preventing errors in the genotyping of heterozygous samples due
to partial non-amplifications.
-
The use of this approach in the analysis of 405 unrelated individuals prevented
genotyping errors due to the partial non-amplification of one allele in a relatively large
number of heterozygous samples. For example, in D11S4177 heterozygotes with the 183-bp
allele and a larger allele, the 183-bp allele showed partial non-amplification more
frequently than the other alleles. Similarly, this approach allowed us to prevent genotyping
errors due to partial non-amplifications in heterozygotes for alleles with small differences
in size, at all six loci analysed. The GEDAP method is therefore useful for preventing
genotyping errors due to partial non-amplifications.
-
Nevertheless, it is important to note that the approach used in the GEDAP method for
genotyping heterozygous samples may not be used for genotyping homozygous samples.
That is, the absence of heteroduplex bands and/or the two stutter bands and/or the two
DSBs corresponding to the two homoduplex bands is not sufficient to identify a sample
genotype as homozygous. Indeed, genotyping dinucleotide-repeat microsatellites taking
into account only the homozygous-sample genotyping strategy may increase the rate of
genotyping errors, as we have previously demonstrated, because the amplification products
of heterozygous samples lack heteroduplex bands when total non-amplification occurs. An
alternative strategy for preventing errors in the genotyping of homozygous samples is thus
needed.
6.2.2. Prevention of errors in the genotyping of homozygous samples
-
The approach used in the GEDAP method for preventing errors in the genotyping of
homozygous samples consists of genotyping a sample as homozygous only when the
electrophoretic system generates a band pattern in which one homoduplex band and at least
one faint band are detected.
-
The results obtained from the analysis of 405 unrelated individuals showed that
faint bands are always present in band patterns in which only one homoduplex band is
detected, except for band patterns of heterozygous samples with total non-amplification of
one of their alleles (see Section 6.1). Faint bands thus constitute an additional level of
control for preventing genotyping errors that lead to misidentification of heterozygotes as
homozygotes.
7. EFFICACY OF THE GEDAP METHOD
-
Efficacy was evaluated statistically by testing whether the genotype frequencies
observed in the sample of 405 unrelated individuals deviate significantly from the genotype
proportions expected under Hardy-Weinberg (HWP).
-
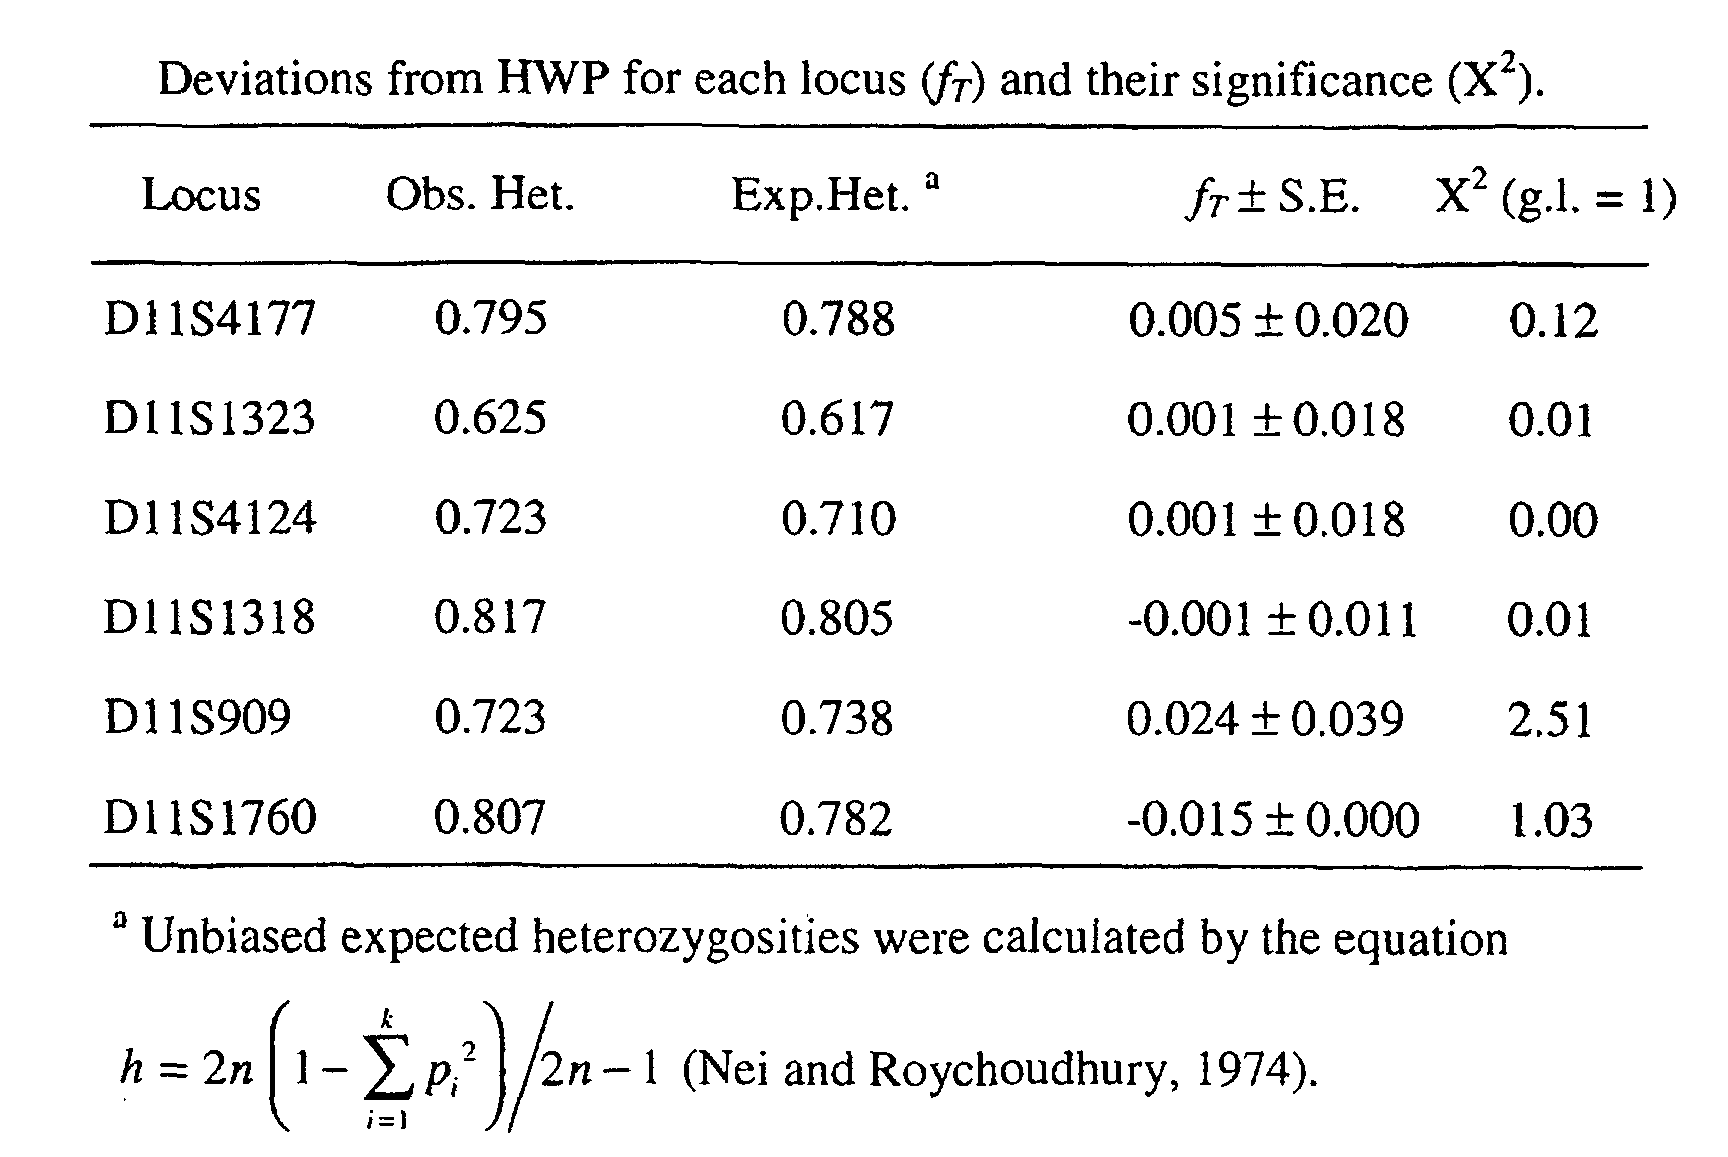
Deviations from HWP for each locus and each allele, and their statistical
significance, were estimated following the procedure described by Robertson and Hill
(1984). The attached table shows that the observed and expected genotype frequencies are
in good agreement at all loci, with no statistically significant deviations from HWP.
-
On the other hand, only one of the 68 alleles deviated significantly from HWP (data
not shown). However, this significant deviation can be attributed to type I error, so that the
observed genotype frequencies for each allele can in fact be considered consistent with
HWP. In addition, the departures from HWP detected by the f-statistic were small and non-systematic.
Taken together, we did not find any evidence for a significant presence of non-amplifications
that lead to misidentification of heterozygotes as homozygotes. The results
obtained by this analysis thus confirm that the GEDAP method is effective for detecting
and/or preventing genotyping errors due to total or partial non-amplifications.
EXAMPLE 2: PATERNITY TESTING
-
The following example illustrates the usefulness of the GEDAP method for
identifying human individuals accurately. In particular, we show how the method prevents
false exclusion of parentage.
-
This application is here demonstrated by the genotyping, in biologically related
Caucasian individuals, of all the six dinucleotide-repeat microsatelites used in example 1.
-
DNA extraction, amplification of markers, and generation, detection and
identification of homoduplexes and DAP were carried out according to sections 1, 2, 3, 4
and 5 from Example 1.
-
Figure 11 shows one non-Mendelian result for D11S1760. On the basis of
conventional genotyping methods (i.e., taking into account only the homoduplex bands
generated from the alleles for each individual), one could conclude that two offspring of
individual A (individuals B and C), are in fact not children of that individual. In particular,
individual A only shows one homoduplex band (generated from allele 84) and the
corresponding associated bands: one DSB and one stutter band. Conventional genotyping
methods would therefore identify this individual as homozygous 84/84. If this were the real
genotype of individual A, she should necessarily pass one allele 84 to each of her children.
Individuals B and C, however, did not show in their band patterns any homoduplex band
generated from allele 84. On the contrary, both showed the band pattern typical of genotype
94/90: that is, two homoduplex bands (generated from alleles 94 and 90, respectively), the
corresponding DSBs and stutter bands associated with the two homoduplex bands, and
three heteroduplex bands typical of genotype 94/90.
-
The GEDAP method, however, detected this false parentage-exclusion and
demonstrated that the apparent non-Mendelian result was actually due to total non-amplification
of one allele in individual A. In particular, the analysis of the band pattern of
individual A by the GEDAP method makes evident that this is an anomalous band pattern
in which only one homoduplex band and no faint bands are detected (figure 11, A: compare
with the band patterns of samples D and 54, which presented the faint bands specific for
genotype 84/84). As was demonstrated in Example 1, the presence of this anomalous band
pattern is strongly indicative of total non-amplification. To investigate this possibility, we
performed three repeat PCR analyses of each of the members of this family (figure 12). The
three replicates confirmed that the apparent parentage problem initially detected was in fact
an error in the genotyping of individual A, due to the total non-amplification of allele 90.
The analysis of the remaining five markers confirmed this observation.
-
The GEDAP method is therefore effective for detecting and preventing false
parentage-exclusions. Indeed, the GEDAP method also allowed us to rule out a new
apparent parentage-exclusion suggested by two of the individual-B replicates (B2 and B3,
figure 12). In both replicates, the band patterns generated for this individual only showed
the homoduplex corresponding to allele 94 (absent in the mother). However, both patterns
were again anomalous (because faint bands were undetected), so that, as in the previous
instance, the GEDAP method revealed that these apparent parentage-exclusions are in fact
the result of the total non-amplification of allele 90.
REFERENCES
-
- Akey, J. M., Zhang, K., Xiong, M., Doris, P. et al. (2001) Am. J. Hum. Genet. 68: 1447-1456.
- Anderson, T. J. C., Paul, R. E. L., Donelly, C. A., Day, K. P. (2000) Genet. Res. 75: 285-296.
- Applied Biosystems. (2001) Biosystems Solutions 1: 10.
- Ardren, W. R., Borer, S., Thrower, F., Joyce, J. E. et al. (1999) J. Hered. 90: 529-536.
- Beacauge et al. (1981) Tethrahedron Letters 22: 1859-1862.
- Belotserkovskii, B. P., Johnston, B. H. (1996) Electrophoresis 17: 1528-1534.
- Budowle, B., Chakraborty, R., Giusti, A. M., Eisenberg, A. J. et al. (1991) Am. J. Hum.
Genet. 48: 137-144.
- Buetow, K. H. (1991) Am. J. Hum. Genet. 49: 985-994.
- Caruthers, M. H., Barone, A. D., Beacauge, S. L., Dodds, D. R. et al. (1988) Methods
Enzymol. 154: 287-314.
- Casasnovas, J. M., Huertas, D., Ortiz-Lombardía, M., Kypr, J. et al. (1993) J. Mol. Biol.
233: 671-681.
- Chakraborty, R., de Andrade, M., Daiger, S. P., Budowle, B. (1992) Ann. Hum. Genet. 56:
45-57.
- de La Chapelle, A., Wright, F. A. (1998) Proc. Natl. Acad. Sci. USA 95: 12416-12423.
- Deka, R., de Croo, S., Yu, L. M., Ferrell, R. E. (1992) Hum. Genet. 90: 86-90.
- Demers, D. B., Curry, E. T., Egholm, M., Sozer, A. C. (1995) Nucleic Acids Res. 23: 3050-3055.
- Dib, C., Fauré, S., Fizames, C., Samson, D. et al. (1996) Nature 380: 152-154.
- Dolinnaya, N. G., Braswell, E. H., Fossella, J. A., Klump, H. et al. (1993) Biochemistry 32:
10263-10270.
- Dolinnaya, N. G., Fresco, J. R. (1992) Proc. Natl. Acad. Sci. USA 89: 9242-9246.
- Douglas, J. A., Boehnke, M., Lange, K. (2000) Am. J. Hum. Genet. 66: 1287-1297.
- Dr bek, J, (2001) Electrophopesis 22: 1024-1045.
- Durland, R. H., Kessler, D. J., Gunell, S., Duvic, M. et al. (1991) Biochemistry 30: 9246-9255.
- Ewen, K. R., Bahlo, M., Treloar, S. A., Levinson, D. F. et al. (2000) Am. J. Hum. Genet.
67: 727-736.
- Findlay, I., Ray, P., Quirke, P., Rutherford, A. et al. (1995) Hum. Reprod. 10: 1609-1618.
- Fishback, A. G., Danzmann, R. G., Sakamoto, T., Ferguson, M. M. (1999) Aquaculture
172: 247-254.
- Frank-Kamenetskii, M. D., Mirkin, S. M. (1995) Annu. Rev. Biochem. 64: 65-95.
- Gagneux, P., Boesch, C., Woodruff, D. (1997) Mol. Ecol. 6: 861-868.
- Gaillard, C., Strauss, F. (1994) Science 264: 433-436.
- Garvin, A. M., Holzgreve, W., Hahn, S. (1998) Nucleic Acids Res. 26: 3468-3472.
- Goldstein, D. R., Zhao, H., Speed, T. P. (1997). Hum Hered. 47: 86-100.
- Gomes, I., Collins, A., Lonjou, C., Thomas, N. S. et al. (1999) Ann. Hum. Genet. 63: 535-538.
- Göring, H. H. H., Terwilliger J. D., Ott, J. (1997) Am. J. Hum. Genet. 61: 1614.
- Göring, H. H. H., Terwilliger, J. D. (2000) Am. J. Hum. Genet. 66: 1107-1118.
- Haddad, L. A., Fuzikawa, A. K., Pena, S. D. J. (1997) Hum. Genet. 99: 796-800.
- Handyside, A. H., Delhanty, J. D. A. (1997) Trends Genet. 13: 270-275.
- Haralambidis, J., Duncan, L., Angus, K., Treagear, G. W. (1990) Nucleic Acids Res. 18:
1055-1067.
- Harper, J. C., Coonen, E., Handyside, A. H. et al. (1995) Prenat. Diagn. 15: 41-49.
- Huertas, D., Bellsolell, L., Casasnovas, J. M., Coll, M. et al. (1993) EMBO J. 12: 4029-4038.
- Kimpton, C. P., Gill, P., d'Aloja, E., Andersen, J. F. et al. (1995) Forensic Sci. Int. 71: 137-152.
- Lareu, V., Pestoni, C., Phillips, C., Barros, F. et al. (1998) Electrophoresis 19: 1566-1572.
- Lee, J. S. (1990) Nucleic Acids Res. 18: 6057-6060.
- Lissens, W., Sermon, K. (1997) Hum. Reprod. 12: 1756-1761.
- Miller, M. J., Yuan, B. Z. (1997) Anal. Biochem. 251: 50-56.
- Mukerji, I., Shiber, M. C., Fresco, J. R., Spiro, T. G. (1996) Nucleic Acids Res. 24: 5013-5020.
- Mullis, K., Faloona, F., Scharf, S., Saiki, R. et al. (1986) Cold Spring Harb. Symp. Quant.
Biol. 51 Pt 1: 263-273.
- Mutter, G. L., Boynton, K. A. (1995) Nucleic Acids Res. 23: 1411-1418.
- Nei, M., Rychoudhury, A. K. (1974) Genetics 76: 379-390.
- Neilan, B. A., Leigh, D. A., Rapley, E., McDonald, B. L. (1994) BioTechniques 17: 708,
710,712.
- Noonberg, S. B., François, J. C., Garestier, T., Hélène, C. (1995) Nucleic Acids Res. 23:
1956-1963.
- Ortiz-Lombardía, M., Eritja, R., Azorín, F., Kypr, J. et al. (1995) Biochemistry 34: 14408-14415.
- Pemberton, J. M., Slate, J., Bancroft, D. R., Barrett, J. A. (1995) Mol. Ecol. 4: 249-252.
- Perlin, M. W., Burks, M. B., Hoop, R. C. Hoffman, E. P. (1994) Am. J. Hum. Genet. 55:
777-787.
- Prinz, M., Schmitt, C., Staak, M., Baum, H. (1996) Electrophoresis 17: 1190-1193.
- Ray, P. F., Handyside, A. H. (1996) Mol. Hum. Reprod. 2: 213-218.
- Robertson, A., Hill, W. G. (1984) Genetics 107: 703-718.
- Ronai, Z., Guttman, A., Nemoda, Z., Staub, M. et al. (2000) Electrophoresis 21: 2058-2061.
- Saiki, R. K., Scharf, S., Faloona, F., Mullis, K. B. et al. (1985) Science 230: 1350-1354.
- Schlotterer, C. (1998) Microsatellites, pp. 237-261. In: A.R. Hoelzel (Ed.), Oxford
University Press.
- Shiber, M. C., Braswell, E. H., Klump, H., Fresco, J. R. (1996) Nucleic Acids Res. 24:
5004-5012.
- Smith, J. R., Carpten, J. D., Brownstein, M. J., Ghosh, S. et al. (1995) Genome Res. 5: 312-317.
- Szibor, R., Plate, I., Krause, D. (1996) Adv. Forensic Haemogenet. 6: 346-348.
- Taberlet, P. (1997) Nucleic Acids Res. 25: 967.
- Taberlet, P., Griffin, S., Goossens, B., Questiau, S. et al. (1996) Nucleic Acids Res. 24:
3189-3194.
- Terwilliger, J. D., Shannon, W. D., Lathrop, G. M., Nolan, J. P. et al. (1997) Am. J. Hum.
Genet. 61: 430-438.
- Tóth, G., Gáspári, Z., Jurka, J. (2000) Genome Res. 10: 967-981.
- Vorlícková, M., Kejnovská, I., Kovanda, J., Kypr, J. (1998) Nucleic Acids Res. 26: 1509-1514.
- Walsh, P. S., Erlich, H. A., Higuchi, R. (1992) PCR Methods Appl. 1: 241-250.
- Weeks, D. E., Conley, Y. P., Mah, T. S., Otis Paul, T. et al. (2000) Hum. Mol. Genet. 9:
1329-1349.
- Weissensteiner, T. (1997) Nucleic Acids Res. 25: 966.
- Weissensteiner, T., Lanchbury, J. S. (1996) BioTechniques 21: 1102-1108.
- Wenz, H., Robertson, J. M., Menchen, S., Oaks, F. et al. (1998) Genome Res. 8: 69-80.
- Wilkin, D. J., Koprivnikar, K. E., Cohn, D. H. (1993) Genomics 15: 372-375.
- Yue, P. K., Kricka, L. J., Fortina, P., Panaro, N. J. et al. (2001) Genome Res. 11: 405-412.
- Zapata, C., Rodríguez, S., Visedo, G., Sacristán, F. (2001a) Genetics 158: 1235-1251.
- Zapata, C., Carollo, C., Rodríguez, S. (2001b) Ann. Hum. Genet. 65: 395-406.
-