EP1393136B1 - Procede de surveillance et de detection de defaillance d'un capteur dans un systeme de production de petrole et de gaz - Google Patents
Procede de surveillance et de detection de defaillance d'un capteur dans un systeme de production de petrole et de gaz Download PDFInfo
- Publication number
- EP1393136B1 EP1393136B1 EP02717225A EP02717225A EP1393136B1 EP 1393136 B1 EP1393136 B1 EP 1393136B1 EP 02717225 A EP02717225 A EP 02717225A EP 02717225 A EP02717225 A EP 02717225A EP 1393136 B1 EP1393136 B1 EP 1393136B1
- Authority
- EP
- European Patent Office
- Prior art keywords
- sensor
- sensors
- value
- oil
- production system
- Prior art date
- Legal status (The legal status is an assumption and is not a legal conclusion. Google has not performed a legal analysis and makes no representation as to the accuracy of the status listed.)
- Expired - Lifetime
Links
Images


Classifications
-
- G—PHYSICS
- G01—MEASURING; TESTING
- G01D—MEASURING NOT SPECIALLY ADAPTED FOR A SPECIFIC VARIABLE; ARRANGEMENTS FOR MEASURING TWO OR MORE VARIABLES NOT COVERED IN A SINGLE OTHER SUBCLASS; TARIFF METERING APPARATUS; MEASURING OR TESTING NOT OTHERWISE PROVIDED FOR
- G01D3/00—Indicating or recording apparatus with provision for the special purposes referred to in the subgroups
- G01D3/08—Indicating or recording apparatus with provision for the special purposes referred to in the subgroups with provision for safeguarding the apparatus, e.g. against abnormal operation, against breakdown
-
- G—PHYSICS
- G01—MEASURING; TESTING
- G01N—INVESTIGATING OR ANALYSING MATERIALS BY DETERMINING THEIR CHEMICAL OR PHYSICAL PROPERTIES
- G01N33/00—Investigating or analysing materials by specific methods not covered by groups G01N1/00 - G01N31/00
- G01N33/0004—Gaseous mixtures, e.g. polluted air
- G01N33/0009—General constructional details of gas analysers, e.g. portable test equipment
- G01N33/007—Arrangements to check the analyser
-
- G—PHYSICS
- G05—CONTROLLING; REGULATING
- G05B—CONTROL OR REGULATING SYSTEMS IN GENERAL; FUNCTIONAL ELEMENTS OF SUCH SYSTEMS; MONITORING OR TESTING ARRANGEMENTS FOR SUCH SYSTEMS OR ELEMENTS
- G05B9/00—Safety arrangements
- G05B9/02—Safety arrangements electric
-
- G—PHYSICS
- G01—MEASURING; TESTING
- G01F—MEASURING VOLUME, VOLUME FLOW, MASS FLOW OR LIQUID LEVEL; METERING BY VOLUME
- G01F1/00—Measuring the volume flow or mass flow of fluid or fluent solid material wherein the fluid passes through a meter in a continuous flow
- G01F1/74—Devices for measuring flow of a fluid or flow of a fluent solid material in suspension in another fluid
Definitions
- the present invention relates to production systems for the production of oil and gas, and in particular to the validation of sensors installed in such systems for measuring physical properties of the flow through the production system.
- Oil and gas production systems typically contain sensors for measuring physical properties of the flow. Sensor measurements in the production system are for instance used as input (initial values) for simulations of the reservoir.
- a well-known problem in the oil industry is that sensors in the production system become inaccurate, or even fail completely, after some time in operation.
- the problems are mainly due to the harsh conditions under which such equipment is operated, such as the high pressure, the high temperature, or the corrosive environment present in the production system.
- venturi down-hole flow meter such as disclosed in WO 01/22041 .
- a venturi down-hole flow meter is a sensor that in itself comprises several sensors such as pressure sensors. It is getting more and more common to install venturi down-hole flow meters in new wells. Venturi down-hole flow meters feed other parts of the production system with essential information: the values from venturi down-hole flow meters are essential for critical functions such as well allocation.
- An example of a flow meter based on a process model of an oil well implemented in a data processing system is the software product WellocateTM (currently known as OptimizeIT Well Monitoring System) supplied by ABB AS of Billingstad, Norway, the assignee of the present application.
- WellocateTM Currently known as OptimizeIT Well Monitoring System supplied by ABB AS of Billingstad, Norway, the assignee of the present application.
- a paper, " Oil Well Allocation: the Ultimate Interpolation Problem" L.T. Biegler, A. Bramilla, C. Scali, G. Marchetti (editors), Advanced Control of Chemical Processes 2000, Elsevier, 2001 ) describes how WellocateTM identifies the flow rate in an oil well by checking the consistency of an assumed flow rate with the observed pressure and temperature drop over the tubing and the production choke in an oil well.
- the sensors in the production system constitute an integral part of the operating philosophy of the oil field and the work routines of the oil field operator. Therefore, it would be beneficial to be able to detect whether a sensor is trustworthy or whether it fails.
- a common approach to this has been to define a set of allowable values for a particular sensor.
- Such an allowable set of values may be constant over time, e.g., the operator may specify a minimal and a maximal value.
- the allowable set may also depend on historical measurement data, e.g., the operator may specify a maximal rate of change.
- the set must have a limit that is small enough or sensitive enough to discriminate between correct and incorrect readings of a particular sensor other than those indicating complete failure of the equipment.
- the allowable set must have a range large enough to accommodate for a wide variety of possible operating conditions of the system, which can be considerable in number and extent.
- WO 02/46848 (as published on 13 June 2002 ) describes an example of such an approach, relating to tracking systems for detecting errors in sensor outputs of a wide range of machines, such as gas turbine engines.
- US-A-5 764 509 relates to a system for monitoring an industrial process, and in particular a system for monitoring the function of sensors supplying information on the process.
- the system estimates "learned" values for a sensor within a limited ranged of time correlated data, and compares these values with actual sensor values. If a sensor is faulty, its output is substituted with a "learned” value.
- the "learned" values are taken from a previous training session of normal training data in a normally operated system, i.e. the "learned” values are solely based on historical data.
- This general system is applicable to a lot of different applications, such as petro-chemical (refineries), power generation, automotive, manufacturing, medical, aeronautical, financial, etc., and thus requires historical data that in addition is only taken over a certain period of time on a normally operated system to establish a set of modelled data.
- the modelled data is generated and processed to identify a pattern for the data.
- the system does not use a current or an actual model of the system and does not rely on analytical modelling by itself.
- WO 99/57417 discloses a system for remote actuation of downhole tools employing chemical taggants, and a method for detecting inflatable tool failure. When a tool has failed, the inflatable tool releases a chemical taggant, indicating the failure. By choosing separate taggants for separate tools there is a way to identify which tool that has failed. The identification of the tool may initiate actions.
- the chemical sensors may be employed singly, in groups of different chemical sensors or in groups with sensors for other types of parameters such as pressure, temperature and flow rate.
- WO 99/34187 A1 relates to a particular method for monitoring a pressure sensor in a fuel supply system, such as in fuel injection systems for internal combustion engines which operate with very high injection pressures.
- the method determines a pressure in a pressure accumulator regulated by a pressure actuator and includes the steps of calculating an expected pressure value in the pressure accumulator for a given point in time based on a holding pressure preset by the pressure actuator and based on a detected rate of change in a mass balance of a medium contained in the pressure accumulator.
- a pressure value in the pressure accumulator is determined with the pressure sensor at the given point in time.
- the expected pressure value is compared with the determined pressure value and a fault in the pressure sensor is detected if the pressure values deviate from each other beyond a predetermined value, wherein the faulty sensor is physically substituted.
- US-A-4 249 238 relates to a gas turbine engine control system, which maintains a selected level of engine performance despite the failure or abnormal operation of one or more engine parameter sensors.
- the control system employs a continuously updated engine model which simulates engine performance and generates signals representing real time estimates of the engine parameter sensor signals.
- the estimate signals are transmitted to a control computational unit which utilizes them instead of the actual engine parameter sensor signals to control the operation of the engine.
- the estimate signals are also compared with the corresponding actual engine parameter sensor signals and the resulting difference signals are utilized to update the engine model. If a particular difference signal exceeds specific tolerance limits, the difference signal is inhibited from updating the model and a sensor failure indication is provided to the engine operator.
- JP 06 229 791 A relates to an abnormality diagnostic method which can determine an abnormal machine or sensor in a plant or machinery.
- a machine model and an actuator model calculate a first prediction data similar to the dectection data of a selected sensor based on detection data from three other sensors.
- Another machine model and another actuator model calculate a second prediction data of the selected sensor based on the detection data of two of the other three sensors.
- a diagnostic section then compares the detection data of the selected sensor, the first prediction data, and the second prediction data with each other and combine the comparison results to diagnose abnormality in all of the sensors.
- JP 59 005 913 A relates to a method for facilitating the detection of abnormality by judging the output value of sensors as abnormal when the difference between the value of least squares which are estimated by a specific determinant equation and the output value of the sensors is a specified value or more in an unspecified process.
- WO 97/07439 describes a statistical method for detecting a faulty sensor within a process control system having a set of sensors, each of which produces an associated sensor output signal.
- the method produce a set of sensor estimate signals from the sensor output signals using principal component analysis and then determine a validity index for each of the sensors as a ratio of two residuals, wherein each of the residuals represents a different measure of the difference between the sensor output signals and the sensor estimate signals.
- the determined validity indexes are then used to detect a failure of one of the sensors and/or to identify which one of the sensors has failed.
- EP-A-0 362 011 relates to a method of analyzing a multi-phase fluid flowing along a hydrocarbon well in order to determine, at each depth, the average static proportion of one of the phases by means of a local measurement performed by one or more sensors.
- Another problem related to failing sensors is that, unfortunately, it is often prohibitively expensive to replace such sensors by new ones. This is particularly true when the sensors are installed in remote locations in the production system, such as down in a well or on the bottom of the sea or other body of water. Therefore, it would also be beneficial to have a back-up value or reading available instead of the sensor itself for monitoring purposes when the sensor fails.
- a possible solution to this problem is to install multiple sensors of the same kind close to each other in the production system in order to obtain redundancy. In case any one of the sensors fails, one of the other sensors may be used to supply the data. This approach is costly and inefficient, since multiple sensors are involved to do the work of one. Another drawback of this approach is that such sensors of the same kind may be subject to the same errors due to the same well conditions.
- An object of the present invention is to provide a method that solves the above-mentioned problems.
- This object is achieved by the present invention by a method for detecting sensor failure in an oil and gas production system according to claim 1.
- the present invention provides a method performed in a data processing system for detecting sensor failure in an oil and gas production system.
- the method is performed under control of a set of computer-readable instructions contained in a computer program storage device.
- an expected value for a measurement from a sensor in the production system is generated.
- the expected value is compared against an actual measurement. If the expected value is within some acceptable specified limit of the actual measurement, the validity of the actual measurement is confirmed. If such is not the case, a failure of the sensor is indicated.
- the invention provides a model-based method for generating an expected, or back up, value for a measurement from a specific sensor. This expected value is the value that is most consistent with the measurements from the other sensors in the system.
- the model used in the invention comprises descriptions of subsystems of the entire production system.
- the method includes one or several of the following steps:
- the present invention also provides a computer program product directly loadable into the internal memory of a computer, comprising computer readable instructions for causing a data processing system to monitor for sensor failure in an oil and gas production system, computer program product comprising software for performing the steps of the appended claim 1.
- FIG. 1 an example oil and gas production system S is shown in Figure 1 .
- the system S contains the typical components of a production system for the production of oil and gas, such as wells, flowlines, manifolds, risers, and topside facilities, as well as systems for gas-lift and systems for the injection of chemicals.
- These elements comprise basic components for guiding, controlling, and observing the flow such as pipes, joints, bends, chokes, valves, pumps, separator tanks, heat exchangers, pressure gauges, temperature gauges, (multi-phase) flow meters, densitometers, and water cut meters.
- the system S includes a production platform M in a body of water 12 connected to a set of wells, as shown schematically at 13 and 14 beneath a subsurface floor 15 in the body of water 12.
- the wells 13 and 14 are connected together through a set of flowlines 16, manifolds 18 and risers 19.
- the production system further contains a vessel 10 for the injection of chemicals.
- a number of sensors 22 are located in the production system S. Such sensors include pressure gauges, temperature gauges, multi-phase flow meters, densitometers, and water cut meters. These sensors are connected to a subsea control system or computer 17, which in its turn is connected to a topside control system or computer P.
- the sensors 22 send readings or measurements as indicated schematically to a process control system or computer P operating under control of an operator station O and exchanging sensor readings and results as indicated schematically at 26 and 28.
- a well monitoring data processing system W in communication with the operator station O also exchanges instructions as indicated at 30 and receives sensor readings as indicated at 32 from the process control system O.
- the well monitoring system W and process control system P may be, for example, the WellocateTM system of the type available from ABB, the assignee of the present application.
- a computer program product C operating under a sequence of instructions described below causes the well monitoring data processing system W to monitor for failure of sensors 22.
- Flow models in oil and gas production systems of the conventional type operate based on measurements obtained from the sensors 22. It is well known that the flow rate in an oil well may be found by measuring the pressure drop and/or the temperature drop over certain parts of the well and by identifying the flow rate that is most consistent with the measured pressure and/or temperature drop according to a model of the flow.
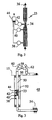
- An example of a sensor 22 in Figure 1 may be a downhole model-based flow meter 23 shown schematically in Figure 2 .
- the flow meter 23 is available, for example, from the Expro International Group, PLC in the UK under the name SUREFLO down-hole flow meter.
- the flow meter 23 includes a contracting tube (a Venturi tube) 34 inside tubing 36 in the production system S, and a down-hole pressure gauge 38. Pressure and temperature gauges 40 and 42 are located on both ends of tube 34.
- the down-hole flow meter 23 in Figure 2 operates according to a model of the pressure drop over the Venturi tube 34 as a function of the flow rate (the Venturi equation). Further, such a down-hole flow meter 23 in Figure 2 has an embedded computer 44 in order to facilitate certain calculations.
- Such a flow meter in Figure 2 measures the pressure drop over the tube 34 and determines the flow rate by identifying the rate that is most consistent with the observed pressure drop according to the Venturi equation.
- the present invention a simulation is used to calculate previously unknown flow rates.
- the method of the present invention further uses those calculated flow rates to validate sensor measurements and further replace measurements from failed sensors in an oil and gas production system S.
- a well 48 of the type in the production system S is shown in Figure 3 including a tubing 50 contained in an annulus 52. Production enters the well 50 through the perforations in the inflow 54. On the wellhead 56 on the seabed 15 the production is contained by a production choke 58.
- the well is equipped with a down-hole venturi flow meter 23 as in Figure 2 , a wellhead pressure and temperature gauge 60 and a downstream pressure and temperature gauge 62.
- the down-hole flow meter is according to Figure 2 , including pressure/temperature gauges 38, 40, and 42 and a flow computer 44 for calculating the flow rate of oil and water.
- the present invention involves the following three phases as indicated schematically in Fig. 6 .
- Phase 1 Configuration: In the configuration phase 70 a user of the method of the present invention chooses and identifies which portion of the system S is to be monitored according to the present invention.
- Phase 2 Simulation/Operation: In the simulation or operation phase 72 a number of steps are performed to obtain a simulated solution to the problem that the user has configured in configuration phase 70.
- Phase 3 Analysis/Presentation: In the analysis or presentation phase 74 the results of the simulation or operation phase 72 are analyzed and presented to the user. It is in this phase that the system creates the most benefit for the user.
- Phase 1 Configuration Phase:
- Configuration phase 70 the user of the invention sets up the problem that is to be solved.
- Configuration phase 70 according to the present invention involves choosing the following items in a group of steps:
- the relevant part of the production system S must be a connected subsystem of the production system S.
- subsystems are a single oil well, a cluster with a number of wells, or the entire production system.
- the present example is about the solution of a single problem in a single part of the production system S, it will be appreciated that the process of one or more instances of the present invention may be made concurrently in order to tackle various problems at the same time. Such multiple use of the invention may be seen as the repeated use of a single instance of the invention for a single problem as described in this example.
- a preferred embodiment of the invention is embedded in an oil and gas production administrative system W, such as shown according to Figure 1 , which allows for the specification of a comprehensive production system from which connected subsystems may be selected for processing by the invention.
- the surrounding administrative system W also allows for repeated and parallel execution of multiple versions of the present invention.
- At least one fluid of interest in the system S is customary in the oil industry to distinguish at least one oil (e.g., oil from a certain appraisal zone in the reservoir), possibly one or more gases (e.g., gas associated with the oil, free gas from a gas cap, injected lift gas), and possibly one water (e.g., an aquifer), from every well in an oil field.
- oil e.g., oil from a certain appraisal zone in the reservoir
- gases e.g., gas associated with the oil, free gas from a gas cap, injected lift gas
- water e.g., an aquifer
- a user defines a number of sources, that is, a number of points where fluids enter the production system S.
- Each of these sources allows for the specification of at most three distinguishable fluids, at most one oil, at most one gas, and at most one water.
- the compositional fluid model is used to describe the fluids of interest in the production system.
- the model by Peng and Robinson R.C. Reid, J.M. Prausnitz, B.E. Poling, The Properties of Gases & Liquids, McGraw-Hill Book Co, 1988 ) is used to calculate such flow properties.
- a user is in principle free to choose which flow rates are unknown variables to be determined by the invention in operation or simulation phase 72 and which flow rates are known variables or functions of other variables.
- the rate of oil from a well is either an unknown variable, or a function of the difference in pressure between the reservoir and the down-hole pressure in the well bore, and, as such, a function of an other variable in the system, the down-hole pressure.
- the rate of gas in an oil well without a gas cap is a constant fraction of the rate of oil.
- the measurements assumed a priori to be trustworthy are the known reference points for the simulation in phase 2. It is important that there are enough of such reference points.
- Phase 2 Simulation/Operation Phase
- the operation phase 72 is composed of three steps:
- Simulating the flow in the production system S is in effect knowing the value of all the relevant properties of the flow through the system. Without loss of generality, it suffices to know a set of characterizing properties of the flow, that is, a set of basic properties of the flow from which all other properties may be derived by means of models.
- track is kept of the pressure, the temperature, the flow rate, and the composition of the flow. It should be noted that this is merely one possible set of characterizing properties: another characterizing set would be the pressure, the enthalpy, the flow rate, and the composition of the flow.
- the simulation phase estimates the characterizing flow properties at the inlet and at the outlet of every subsystem of the production system identified during the configuration phase 70.
- the production system is represented as a directed graph, where the edges represent the basic flow containing components, where the direction of the edges represents the designated direction of flow, and where the vertices represent the components where the flow containing components are linked together, as well as the locations of the sensors in the system.
- the locations where flow enters the system or where it flows out of the system, known as sources and sinks in graph theory, are also represented as vertices.
- the relevant part of the production system is represented as a directed graph for the purpose of the simulation portion of phase 72.
- the following elements in the relevant part of the production system S are represented in a directed graph:
- Figure 5 shows a directed graph G representing an oil and gas production system.
- the main structure of a directed graph such as shown in Figure 5 includes leaves 80, nodes 82, branches 84, and a root 86.
- the leaves 80 in directed graph tree of Figure 5 represent the sources in the oil and gas production system S, that is, points where oil and gas enters the production system S.
- a source may be an inflow, that is, a hole in the tubing down in a reservoir through which oil/gas enters the production network. It may be an inlet into a pipeline with a given pressure and/or flow rate.
- a source may also be a gas injection point in a gas-lifted well, as well as other locations of inflow into various types of wells.
- the word source must be read in the designed direction of flow, since there are circumstances where production flows back from the production facilities into a source.
- the direction of flow of the oil and gas from the sources to a separator is represented by the direction in the tree from the leaves to the root.
- Nodes 82 in the directed graph tree of Figure 5 may represent reference points and further represent what are known as manifolds in the oil industry.
- a manifold is a blending point where the flow from a number of inlet flow lines comes together and continues its way through a single outlet flow line.
- a reference point is a point where some piece of information is available, such as a measured value of the pressure, the temperature, or the flow rate, or some constant value, such as the pressure in a separator.
- a branch 84 in directed graph G represents the flow lines that comprise a sequence of pipes and chokes.
- the root 86 is the most downstream node in the network, in the sense that all production eventually arrives to the root.
- the root in a directed graph that describes an entire oil and gas production system typically represents an inlet to a separator.
- edges in the directed graph G of Figure 5 represent the basic flow containing components in between these vertices and the direction of the edges indicates the designated direction of flow.
- the production system S is modeled as a linked list of components that is derived from a directed graph. Each component is modeled as a list of parameters of the component. Such sets of parameters refer to elementary models of such components that are available to the system in the form of a library of models. There are many ways to model flow in elementary flow containing components such as pipes and chokes.
- the preferred embodiment of the invention contains common models such as:
- the present invention tries and solves a system of equations in order to find previously unknown properties of the flow on the basis of previously known properties of the flow.
- a system of equations There are many ways to solve such a system of equations. The following is a description of the preferred embodiment of the invention.
- the variables in the system are the pressure, the temperature, the flow rate, and the composition of the flow in all the vertices of the directed graph that represents the production system.
- the equations that need to be observed are the physical models for pressure and temperature drop over the edges of the graph as described above.
- constitutional relations in the graph there are a large number of what is known as constitutional relations in the graph:
- the computation of the calculated values is based on a system of ordinary differential equations (ODEs) describing the behavior of the pressure and the temperature along a pipe with a multi-component, multi-phase fluid.
- ODEs ordinary differential equations
- models for the change in pressure and temperature across other equipment such as venturi down-hole flow meters and chokes are evaluated.
- the ODEs are non-linear and they are based on conservation of energy, mass, and momentum along the pipe.
- Evaluation of the derivatives defining the ODEs involves thermodynamic equilibrium calculations for each fluid component at each integration point along the pipe. Integration of the ODEs along the pipes, together with evaluation of the models for the rest of the equipment, gives the pressure, the temperature, and other physical quantities like velocities, densities, and viscosities at all points of interest in a fluid transport pipe network.
- the preferred embodiment of the invention uses a state-of-the-art solution technique for a system of nonlinear equations.
- a state of the art method for the solution of nonlinear least-squares problems is for example the Levenberg-Marquardt method. Techniques of this type are described, for example, in the following literature:
- Phase 3 Analysis/Presentation Phase
- the Presentation or Analysis Phase 74 includes in general several actions.
- the mismatch is registered between the simulated and the measured value of the property of the flow.
- the simulated value is registered in order to replace the unavailable measured value of the property of the flow.
- the simulated flow properties obtained during operation phase 72 are compared with the measured flow properties selected in configuration phase 70. This is done in order to check the consistency of these measured flow properties.
- a method according to the present invention also supplies estimated flow properties. Those flow properties are results of simulations made in phase 72 as a replacement of the results from the failed sensors indicated in configuration phase 70.
- Figure 8 shows an example of a graph representing probability distribution of a sensor, such as the devices described above in the production system S.
- a sensor such as the devices described above in the production system S.
- Such devices measure any of the following properties of a fluid inside a pipe or any other pressure containing equipment: absolute pressure, differential pressure (e.g. used in venturi tubes), temperature, density (e.g. nucleonic densitometers), phase fractions (e.g. fluid dielectricity, capacitance and impedance meters), molecular compositions, salinity (e.g. with conductivity meters and or nucleonic densitometers), velocity and momentum.
- absolute pressure e.g. used in venturi tubes
- temperature e.g. nucleonic densitometers
- phase fractions e.g. fluid dielectricity, capacitance and impedance meters
- molecular compositions e.g. with conductivity meters and or nucleonic densitometers
- salinity e.g. with conductivity meters and
- the detection of sensor error according to the present invention is based on a comparison of the probability distribution of the value for the calculated sensor value (calculated during the simulation phase 72 with the probability distribution of the measured sensor value. This is illustrated in Figure 8 , which is an example with normal distributions for both.
- the wider probability distribution indicated at 90 is the calculated sensor value during the simulation phase 72, while the more narrow distribution indicated at 92 is the probability distribution for the sensor to be validated.
- the probability distribution 90 of the calculated sensor value is found with the present invention by performing multiple simulations with the process simulation model for the sensors other than the test sensor to be validated, which is not used for the simulation.
- the process simulation model measured sensor values with a probability distribution (error) added to each sensor and using model parameters with errors added to each of the main model parameters.
- the probability distribution 92 of the measured value for each sensor is defined or may be obtained from the data available from the vendor of the particular sensor.
- the present invention also defines and presents the expected error distribution for a back-up value of a sensor based on a calculated error distribution. This is done by what can be termed validating a sensor model parameter.
- Every sensor and every model parameter has a known variance. Then the variance of the simulated value or soft sensor value can be estimated. Once these variances are known any sensor may be validated.
- y u - m , where u is the simulated value and m is the measured value from the sensor which is to be tested.
- a further assumption is that both the simulated value and the measured value are distributed according to a Gauss probability function. In that case one may perform the following validation test:
- P 0 be the probability that the values are as above or more extreme (
- ), given that the expected value of y is zero (in which case the expected value for u and m is the same), P 0 P
- E ( y ) 0 .
- u be the simulated or back-up value obtained with the model parameters and sensor values ⁇ 1 .,..., ⁇ n . All these values have known accuracies, given by their variance.
- the variance (which is the square of the standard deviation) of sensor (or model parameter) ⁇ i is denoted by Var( ⁇ i ) .
- the back-up value can be sent to the control system to be used for control purposes or optimization.
- the relevant part of the production system S is subdivided into the following subsystems; a lower tubing from the down-hole sensor 38 to the inlet of the venturi 40 in Figure 3 ; a venturi inlet tube from the gauge 40 to the gauge 42 in Figure 3 ; a venturi outlet tube from the gauge 42 to the top of the venturi downhole flow meter 23 in Figure 3 ; and an upper tubing from the top of the venturi downhole flow meter 23 to the gauge 60 in Figure 3 in the well consisting of a number of pipe segments with different properties.
- the measured flow properties in the relevant part of the production system are the measured flow properties in the relevant part of the production system.
- the flow rate of oil (e) is subject to a consistency check by the invention. This means that we use the invention to calculate (simulate) the flow rate of oil and then check whether the measured flow rate of oil (e) is consistent with the calculated flow rate of oil.
- Figure 4 shows a comparison between the measured downhole pressure 65 and the calculated downhole pressure 66 according to an embodiment of the invention. It is obvious that the sensor is severely flawed since measurements are only available at some point in time. The results show that the estimated pressure is very close to the measured pressure at times when the measured pressure is available. The estimated pressure provides a reliable back-up value for the down-hole pressure measurement at times when the sensor is not available.
Landscapes
- General Physics & Mathematics (AREA)
- Engineering & Computer Science (AREA)
- Physics & Mathematics (AREA)
- Chemical & Material Sciences (AREA)
- Health & Medical Sciences (AREA)
- Life Sciences & Earth Sciences (AREA)
- Analytical Chemistry (AREA)
- Food Science & Technology (AREA)
- Medicinal Chemistry (AREA)
- Automation & Control Theory (AREA)
- Biochemistry (AREA)
- General Health & Medical Sciences (AREA)
- Immunology (AREA)
- Pathology (AREA)
- Combustion & Propulsion (AREA)
- Testing Or Calibration Of Command Recording Devices (AREA)
- Investigating Or Analyzing Materials By The Use Of Electric Means (AREA)
- Sampling And Sample Adjustment (AREA)
- Investigating Or Analyzing Materials By The Use Of Fluid Adsorption Or Reactions (AREA)
- Emergency Alarm Devices (AREA)
- Measuring Volume Flow (AREA)
- Testing Electric Properties And Detecting Electric Faults (AREA)
- Testing And Monitoring For Control Systems (AREA)
Claims (8)
- Procédé pour surveiller et détecter une panne de capteur dans un système industriel (S) comprenant un nombre de capteurs (22), ledit procédé comprenant les étapes, exécutées dans un système de traitement de données (W), consistant à :- générer une valeur de sortie attendue pour un premier desdits capteurs,- comparer la valeur de sortie attendue à une mesure réelle obtenue au moyen du premier capteur,- confirmer la validité de la mesure réelle obtenue si la valeur de sortie attendue se trouve dans des limites spécifiées acceptables de la mesure réelle, et- indiquer la panne du capteur, et remplacer la valeur de la mesure réelle par la valeur attendue, si la valeur attendue ne se trouve pas dans les limites spécifiées acceptables de la mesure réelle,caractérisé en ce que
la valeur de sortie attendue pour le premier desdits capteurs est générée d'après un modèle de simulation de processus d'un système de production de pétrole et de gaz (S), ledit système de production de pétrole et de gaz (S) étant un réseau de conduites de production, dans lequel la valeur de sortie attendue est la valeur qui est le plus en accord avec les mesures provenant d'au moins l'un des autres capteurs du système,
en ce que lesdits capteurs (22) sont adaptés pour mesurer les propriétés physiques d'un écoulement polyphasique (16) dans le réseau de conduites de production, et
en ce que ledit modèle de simulation de processus utilisé est un modèle dudit écoulement polyphasique dans le réseau de conduites de production. - Procédé selon la revendication 1, dans lequel ladite valeur attendue est générée au moyen d'une ou plusieurs valeurs de sauvegarde générées, les valeurs de sauvegarde étant essentiellement générées au moyen du modèle de simulation de processus.
- Procédé selon la revendication 1 ou 2, dans lequel l'étape de génération d'une valeur attendue pour une mesure de capteur comprend l'étape consistant à obtenir une répartition de probabilités (90) de valeurs attendues pour la mesure de capteur.
- Procédé selon la revendication 3, dans lequel l'étape d'obtention d'une répartition de probabilités (90) de valeurs attendues comprend l'étape consistant à effectuer plusieurs simulations du système de production de pétrole et de gaz (S) en utilisant les autres capteurs du système de production que le premier capteur sur une plage de lectures de capteurs possibles à partir des autres capteurs.
- Procédé selon la revendication 4, dans lequel l'étape d'obtention d'une répartition de probabilités (90) de valeurs attendues comprend l'étape consistant à effectuer plusieurs simulations du système de production de pétrole et de gaz en utilisant une gamme de paramètres de modèle pour le système de production.
- Procédé selon la revendication 4 ou 5, dans lequel une répartition de probabilités (92) de valeurs de capteur mesurées est disponible et l'étape de comparaison comprend l'étape consistant à obtenir une répartition de probabilités de la différence entre la valeur attendue (90) et la mesure réelle (92) obtenue au moyen du capteur.
- Procédé selon la revendication 6, dans lequel l'étape de comparaison comprend l'étape consistant à obtenir les limites spécifiées acceptables pour la différence entre la valeur attendue et la mesure réelle au moyen de ladite répartition de probabilités de la différence entre la valeur attendue (90) et la mesure réelle (92).
- Produit de programme informatique (C) pouvant être chargé directement dans la mémoire interne d'un ordinateur, comprenant des instructions lisibles par ordinateur pour faire surveiller par un système de traitement de données (W) les pannes de capteur dans un système de production de pétrole et de gaz, le produit de programme informatique comprenant un logiciel pour exécuter les étapes de la revendication 1 quand il est exécuté dans l'ordinateur.
Applications Claiming Priority (3)
| Application Number | Priority Date | Filing Date | Title |
|---|---|---|---|
| US28660001P | 2001-04-26 | 2001-04-26 | |
| US286600P | 2001-04-26 | ||
| PCT/NO2002/000160 WO2002088850A1 (fr) | 2001-04-26 | 2002-04-26 | Procede de detection et de correction de defaillance d'un capteur dans un systeme de production de petrole et de gaz |
Publications (2)
| Publication Number | Publication Date |
|---|---|
| EP1393136A1 EP1393136A1 (fr) | 2004-03-03 |
| EP1393136B1 true EP1393136B1 (fr) | 2009-02-18 |
Family
ID=23099325
Family Applications (1)
| Application Number | Title | Priority Date | Filing Date |
|---|---|---|---|
| EP02717225A Expired - Lifetime EP1393136B1 (fr) | 2001-04-26 | 2002-04-26 | Procede de surveillance et de detection de defaillance d'un capteur dans un systeme de production de petrole et de gaz |
Country Status (9)
| Country | Link |
|---|---|
| US (1) | US6772082B2 (fr) |
| EP (1) | EP1393136B1 (fr) |
| CN (1) | CN1316324C (fr) |
| AT (1) | ATE423339T1 (fr) |
| DE (1) | DE60231203D1 (fr) |
| DK (1) | DK1393136T3 (fr) |
| EA (1) | EA005278B1 (fr) |
| NO (1) | NO329197B1 (fr) |
| WO (1) | WO2002088850A1 (fr) |
Cited By (2)
| Publication number | Priority date | Publication date | Assignee | Title |
|---|---|---|---|---|
| CN111855898A (zh) * | 2020-03-16 | 2020-10-30 | 同济大学 | 一种空间分布式空气质量走航传感器平行性检定方法 |
| WO2024054442A1 (fr) * | 2022-09-06 | 2024-03-14 | Saudi Arabian Oil Company | Mesure de flux multiphasiques provenant de puits |
Families Citing this family (48)
| Publication number | Priority date | Publication date | Assignee | Title |
|---|---|---|---|---|
| US7107176B2 (en) * | 2001-06-25 | 2006-09-12 | Invensys Systems, Inc. | Sensor fusion using self evaluating process sensors |
| DE10239610B3 (de) * | 2002-08-29 | 2004-06-24 | Endress + Hauser Conducta Gesellschaft für Mess- und Regeltechnik mbH + Co. KG | Verfahren zur Funktionsüberwachung von Sensoren |
| EP1664743A1 (fr) * | 2003-08-11 | 2006-06-07 | Senseair AB | Procede destine a compenser une erreur de mesure et dispositif electronique utilise a cette fin |
| US7108069B2 (en) * | 2004-04-23 | 2006-09-19 | Offshore Systems, Inc. | Online thermal and watercut management |
| DE102004038835A1 (de) * | 2004-08-10 | 2006-02-23 | Siemens Ag | Verfahren zur Detektion von Störquellen oder von fehlerhaften Messsensoren durch Gutfall-Modellierung und teilweises Ausblenden von Gleichungen |
| US7373285B2 (en) * | 2004-12-01 | 2008-05-13 | Bp Corporation North America Inc. | Application of phase behavior models in production allocation systems |
| US7383102B2 (en) * | 2004-12-03 | 2008-06-03 | Honeywell International Inc. | Slug flow protection system |
| WO2006129235A1 (fr) * | 2005-06-01 | 2006-12-07 | Koninklijke Philips Electronics N.V. | Procede et dispositif pour verifier des donnees detectees |
| US7716480B2 (en) * | 2005-07-15 | 2010-05-11 | Honeywell International Inc. | Property-based data authentication mechanism |
| GB0515715D0 (en) | 2005-07-30 | 2005-09-07 | Rolls Royce Plc | Sensor measurement error |
| WO2008032201A2 (fr) * | 2006-09-15 | 2008-03-20 | Abb As | Procédé d'optimisation de production dans un système de production de pétrole et de gaz |
| CN101523307B (zh) * | 2006-09-28 | 2011-06-15 | 三菱电机株式会社 | 故障检测装置以及故障检测方法 |
| US8170801B2 (en) | 2007-02-26 | 2012-05-01 | Bp Exploration Operating Company Limited | Determining fluid rate and phase information for a hydrocarbon well using predictive models |
| US7539593B2 (en) | 2007-04-27 | 2009-05-26 | Invensys Systems, Inc. | Self-validated measurement systems |
| US7696866B2 (en) * | 2007-06-28 | 2010-04-13 | Microsoft Corporation | Learning and reasoning about the context-sensitive reliability of sensors |
| EP2063228A1 (fr) * | 2007-11-21 | 2009-05-27 | Siemens Aktiengesellschaft | Procédé et dispositif destinés à la détermination de la qualité de résultats de mesure d'un processus d'une installation à l'échelon industriel |
| NO327870B1 (no) * | 2007-12-19 | 2009-10-12 | Norsk Hydro As | Metode og utstyr for bestemmelse av grensesjikt mellom to eller flere fluidfaser |
| FR2932881B1 (fr) | 2008-06-19 | 2010-10-15 | Eurocopter France | Procede de detection de defaillance d'un capteur analogique et dispositif de detection pour mettre en oeuvre ledit procede |
| US9304220B2 (en) * | 2008-12-23 | 2016-04-05 | Westerngeco L.L.C. | Handling equipment failure in a subterranean survey data acquisition network |
| MY148164A (en) * | 2009-12-31 | 2013-03-15 | Petroliam Nasional Berhad Petronas | Method and apparatus for monitoring performance and anticipate failures of plant instrumentation |
| US8330537B1 (en) | 2010-07-23 | 2012-12-11 | National Semiconductor Corporation | Low noise, high CMRR and PSRR input buffer |
| NO332570B1 (no) * | 2011-04-06 | 2012-11-05 | Bjorge Solberg & Andersen As | Instrumenteringssystem for bestemmelse av risikofaktorer |
| US10851621B2 (en) * | 2011-04-06 | 2020-12-01 | MRC Solberg & Andersen AS | Instrumentation system for determining risk factors |
| US9394783B2 (en) | 2011-08-26 | 2016-07-19 | Schlumberger Technology Corporation | Methods for evaluating inflow and outflow in a subterranean wellbore |
| US20130049983A1 (en) | 2011-08-26 | 2013-02-28 | John Rasmus | Method for calibrating a hydraulic model |
| US8706458B2 (en) * | 2011-10-05 | 2014-04-22 | International Business Machines Corporation | Traffic sensor management |
| WO2014015096A2 (fr) | 2012-07-19 | 2014-01-23 | Saudi Arabian Oil Company | Système et procédé pour la surveillance des performances effectives d'une usine de séparation du gaz et du pétrole (gosp) |
| US9720393B2 (en) | 2012-08-31 | 2017-08-01 | P.C. Automax Inc. | Automation system and method of manufacturing product using automated equipment |
| US20140067352A1 (en) * | 2012-09-06 | 2014-03-06 | Intellicess Inc. | Presenting attributes of interest in a physical system using process maps based modeling |
| US9092313B2 (en) * | 2013-01-25 | 2015-07-28 | Honeywell International Inc. | System and method for three input voting |
| US9310288B2 (en) * | 2013-01-28 | 2016-04-12 | Fisher-Rosemount Systems, Inc. | Systems and methods to monitor operating processes |
| US9703901B2 (en) * | 2013-08-15 | 2017-07-11 | Schneider Electric Software, Llc | Iterative system and process with non-linear correction factors |
| US20160033317A1 (en) * | 2014-08-04 | 2016-02-04 | TaKaDu Ltd. | System and method for assessing sensors' reliability |
| CN106468789A (zh) * | 2015-08-21 | 2017-03-01 | 中国石油化工股份有限公司 | 一种传感器性能定量评价系统 |
| US10101194B2 (en) | 2015-12-31 | 2018-10-16 | General Electric Company | System and method for identifying and recovering from a temporary sensor failure |
| CA3021337A1 (fr) * | 2016-04-30 | 2017-11-02 | Scientific Drilling International, Inc. | Procede de detection de defaillance d'instrument de sondage de puits de forage |
| US10963540B2 (en) | 2016-06-02 | 2021-03-30 | Brown University | Physics informed learning machine |
| US11248463B2 (en) | 2016-07-07 | 2022-02-15 | Baker Hughes, A Ge Company, Llc | Evaluation of sensors based on contextual information |
| US10401207B2 (en) * | 2016-09-14 | 2019-09-03 | GE Oil & Gas UK, Ltd. | Method for assessing and managing sensor uncertainties in a virtual flow meter |
| US11940318B2 (en) | 2016-09-27 | 2024-03-26 | Baker Hughes Energy Technology UK Limited | Method for detection and isolation of faulty sensors |
| US10571446B2 (en) * | 2017-04-27 | 2020-02-25 | International Business Machines Corporation | Data quality control using a correlated sensor group |
| US10591313B2 (en) * | 2017-09-29 | 2020-03-17 | Intel Corporation | Detecting mobile device sensor malfunctions |
| EP3915082A4 (fr) * | 2018-10-03 | 2022-06-15 | Services Pétroliers Schlumberger | Système de champ pétrolifère |
| US11078773B2 (en) * | 2018-12-03 | 2021-08-03 | Saudi Arabian Oil Company | Performing continuous daily production allocation |
| CN109723970B (zh) * | 2019-01-04 | 2019-11-08 | 中山大学 | 天然气水合物浆体输运的监测与管理系统及方法 |
| CN110398571A (zh) * | 2019-07-19 | 2019-11-01 | 精英数智科技股份有限公司 | 检测设备的巡检方法及系统 |
| EP4230965A1 (fr) * | 2022-02-21 | 2023-08-23 | Siemens Aktiengesellschaft | Commande d'un système de capteur |
| CN115773797B (zh) | 2023-02-10 | 2023-04-25 | 成都秦川物联网科技股份有限公司 | 智慧燃气流量修正方法、物联网系统、装置以及介质 |
Family Cites Families (20)
| Publication number | Priority date | Publication date | Assignee | Title |
|---|---|---|---|---|
| US4249238A (en) * | 1978-05-24 | 1981-02-03 | The United States Of America As Represented By The Administrator Of The National Aeronautics And Space Administration | Apparatus for sensor failure detection and correction in a gas turbine engine control system |
| JPS595913A (ja) | 1982-07-02 | 1984-01-12 | Toshiba Corp | 出力値異常センサの検知方法 |
| US4576043A (en) | 1984-05-17 | 1986-03-18 | Chevron Research Company | Methods for metering two-phase flow |
| US4604902A (en) | 1984-10-24 | 1986-08-12 | Geoscience Ltd | Means and techniques useful in mass flowmeters for multiphase flows |
| GB2186809B (en) | 1986-02-21 | 1990-04-11 | Prad Res & Dev Nv | Homogenising and metering the flow of a multiphase mixture of fluids |
| NO163578C (no) | 1987-10-23 | 1990-06-20 | Saga Petroleum | Fremgangsmaate og innretning for overfoering av maaledata fra en oljebroenn til overflaten. |
| FR2637089B1 (fr) | 1988-09-29 | 1990-11-30 | Schlumberger Prospection | Procede et dispositif pour l'analyse d'un ecoulement a plusieurs phases dans un puits d'hydrocarbures |
| FR2678022B1 (fr) | 1991-06-18 | 1993-11-26 | Schlumberger Services Petroliers | Procede d'analyse d'un ecoulement diphasique dans un puits d'hydrocarbures. |
| EP0541326A3 (en) * | 1991-11-04 | 1993-06-09 | General Electric Company | Determination of control system status |
| JP2721778B2 (ja) | 1993-01-29 | 1998-03-04 | 三菱重工業株式会社 | 異常診断方法 |
| JP3221184B2 (ja) * | 1993-10-13 | 2001-10-22 | 株式会社日立製作所 | 故障診断装置および方法 |
| US5597042A (en) | 1995-02-09 | 1997-01-28 | Baker Hughes Incorporated | Method for controlling production wells having permanent downhole formation evaluation sensors |
| US5771178A (en) * | 1995-06-12 | 1998-06-23 | Scully Signal Company | Fail-safe fluid transfer controller |
| US5680409A (en) | 1995-08-11 | 1997-10-21 | Fisher-Rosemount Systems, Inc. | Method and apparatus for detecting and identifying faulty sensors in a process |
| US5764509A (en) * | 1996-06-19 | 1998-06-09 | The University Of Chicago | Industrial process surveillance system |
| DE19757655C2 (de) * | 1997-12-23 | 2002-09-26 | Siemens Ag | Verfahren und Vorrichtung zur Funktionsüberwachung eines Drucksensors |
| GB2342940B (en) * | 1998-05-05 | 2002-12-31 | Baker Hughes Inc | Actuation system for a downhole tool or gas lift system and an automatic modification system |
| US6510397B1 (en) * | 1999-03-13 | 2003-01-21 | Textron Systems Corporation | Method and apparatus for self-diagnosis of a sensor |
| WO2001022041A1 (fr) | 1999-09-22 | 2001-03-29 | Bechtel Bwxt Idaho, Llc | Technique et systeme ameliores de mesure d"un debit multi-phase au moyen de differentiels de pression multiples |
| US6453279B1 (en) * | 1999-11-05 | 2002-09-17 | The Foxboro Company | Statistical trend generator for predictive instrument maintenance |
-
2002
- 2002-04-26 DE DE60231203T patent/DE60231203D1/de not_active Expired - Fee Related
- 2002-04-26 US US10/133,783 patent/US6772082B2/en not_active Expired - Lifetime
- 2002-04-26 AT AT02717225T patent/ATE423339T1/de not_active IP Right Cessation
- 2002-04-26 DK DK02717225T patent/DK1393136T3/da active
- 2002-04-26 CN CNB028129105A patent/CN1316324C/zh not_active Expired - Fee Related
- 2002-04-26 EA EA200301162A patent/EA005278B1/ru not_active IP Right Cessation
- 2002-04-26 WO PCT/NO2002/000160 patent/WO2002088850A1/fr not_active Application Discontinuation
- 2002-04-26 EP EP02717225A patent/EP1393136B1/fr not_active Expired - Lifetime
-
2003
- 2003-10-23 NO NO20034744A patent/NO329197B1/no not_active IP Right Cessation
Cited By (3)
| Publication number | Priority date | Publication date | Assignee | Title |
|---|---|---|---|---|
| CN111855898A (zh) * | 2020-03-16 | 2020-10-30 | 同济大学 | 一种空间分布式空气质量走航传感器平行性检定方法 |
| CN111855898B (zh) * | 2020-03-16 | 2021-12-31 | 同济大学 | 一种空间分布式空气质量走航传感器平行性检定方法 |
| WO2024054442A1 (fr) * | 2022-09-06 | 2024-03-14 | Saudi Arabian Oil Company | Mesure de flux multiphasiques provenant de puits |
Also Published As
| Publication number | Publication date |
|---|---|
| CN1316324C (zh) | 2007-05-16 |
| NO329197B1 (no) | 2010-09-13 |
| US6772082B2 (en) | 2004-08-03 |
| EA005278B1 (ru) | 2004-12-30 |
| DE60231203D1 (de) | 2009-04-02 |
| DK1393136T3 (da) | 2009-05-11 |
| EA200301162A1 (ru) | 2004-04-29 |
| US20030005747A1 (en) | 2003-01-09 |
| EP1393136A1 (fr) | 2004-03-03 |
| CN1520536A (zh) | 2004-08-11 |
| WO2002088850A1 (fr) | 2002-11-07 |
| NO20034744D0 (no) | 2003-10-23 |
| ATE423339T1 (de) | 2009-03-15 |
| NO20034744L (no) | 2003-12-29 |
Similar Documents
| Publication | Publication Date | Title |
|---|---|---|
| EP1393136B1 (fr) | Procede de surveillance et de detection de defaillance d'un capteur dans un systeme de production de petrole et de gaz | |
| US11340604B2 (en) | Detecting and correcting for discrepancy events in fluid pipelines | |
| CN111684238B (zh) | 用于实时发现和解决湿气文丘里流量计问题的系统和方法 | |
| Henry et al. | The self-validating sensor: rationale, definitions and examples | |
| US20100324873A1 (en) | Method and system for estimating three phase fluid flow for individual wells | |
| EP3580623B1 (fr) | Méthode de détection et d'isolement de capteurs défaillants | |
| US11543283B2 (en) | Flow metering system condition-based monitoring and failure to predictive mode | |
| CN112236651A (zh) | 用于基于云的集中式气流监测和控制的系统和方法 | |
| Dal Vernon et al. | Work domain analysis and sensors I: principles and simple example | |
| Patel et al. | Model based multiphase metering and production allocation | |
| Maheshwari et al. | Production Optimization and Reservoir Monitoring Through Virtual Flow Metering | |
| Duzinkiewicz et al. | Leakage detection and localisation in drinking water distribution networks by multiregional PCA | |
| Bringedal et al. | Application of Virtual Flow Metering as a Backup or Alternative to Multiphase Flow Measuring Devices | |
| van der Bent et al. | The Application of Data Validation and Reconciliation to Upstream Production Measurement Integration and Surveillance–Field Study | |
| Bagajewicz | Data reconciliation and instrumentation upgrade. Overview and challenges | |
| Sjulstad et al. | Flow Fusion, Exploiting Measurement Redundancy for Smarter Allocation | |
| Salmatanis et al. | The api 1149 update, model-based leak detection uncertainty assessment | |
| Skibeli | Automatic detection of poorly calibrated models in state estimation applied to oil and gas production systems | |
| Gustavsen | Parallel calibration of multiphase flow meters (MPFM) based on measurements of phase streams in separators | |
| Rubio et al. | Overcoming Challenges of Testing Gas Lifted Wells Via Multiphase Flowmeters with a Novel Work-Process Approach Embedded in a Digital Outlook to Enhance Well Test Data Quality. Lesson Learned from a Smart Field in Abu Dhabi | |
| Andfossen et al. | IDUN Multiphase Metering Software Program Field Experience | |
| Couput et al. | Field and installation monitoring using on line data validation and reconciliation—Application to offshore fields in middle east and west Africa | |
| Hall et al. | Paper 3.3 Deepwater Measurement Verification–A DeepStar-RPSEA Mandate | |
| Bagajewicz | Planning instrumentation upgrades | |
| Bybee | Transforming Production Data Into Knowledge |
Legal Events
| Date | Code | Title | Description |
|---|---|---|---|
| PUAI | Public reference made under article 153(3) epc to a published international application that has entered the european phase |
Free format text: ORIGINAL CODE: 0009012 |
|
| 17P | Request for examination filed |
Effective date: 20031119 |
|
| AK | Designated contracting states |
Kind code of ref document: A1 Designated state(s): AT BE CH CY DE DK ES FI FR GB GR IE IT LI LU MC NL PT SE TR |
|
| AX | Request for extension of the european patent |
Extension state: AL LT LV MK RO SI |
|
| RIN1 | Information on inventor provided before grant (corrected) |
Inventor name: VAN DER GEEST, ROBERT, ANTON, BERNARD Inventor name: ALLEN, ROBERT Inventor name: BRINGEDAL, BJ RN, YVIND Inventor name: MORUD, SVEIN, ARNE |
|
| R17C | First examination report despatched (corrected) |
Effective date: 20050707 |
|
| RTI1 | Title (correction) |
Free format text: METHOD FOR MONITORING AND DETECTING SENSOR FAILURE IN OIL AND GAS PRODUCTION SYSTEM |
|
| GRAP | Despatch of communication of intention to grant a patent |
Free format text: ORIGINAL CODE: EPIDOSNIGR1 |
|
| GRAS | Grant fee paid |
Free format text: ORIGINAL CODE: EPIDOSNIGR3 |
|
| RIN1 | Information on inventor provided before grant (corrected) |
Inventor name: BRINGEDAL, BJORN, OYVIND Inventor name: MORUD, SVEIN, ARNE Inventor name: ALLEN, ROBERT Inventor name: VAN DER GEEST, ROBERT, ANTON, BERNARD |
|
| RAP1 | Party data changed (applicant data changed or rights of an application transferred) |
Owner name: ABB AS |
|
| GRAA | (expected) grant |
Free format text: ORIGINAL CODE: 0009210 |
|
| AK | Designated contracting states |
Kind code of ref document: B1 Designated state(s): AT BE CH CY DE DK ES FI FR GB GR IE IT LI LU MC NL PT SE TR |
|
| REG | Reference to a national code |
Ref country code: GB Ref legal event code: FG4D |
|
| REG | Reference to a national code |
Ref country code: CH Ref legal event code: EP |
|
| REG | Reference to a national code |
Ref country code: IE Ref legal event code: FG4D |
|
| REF | Corresponds to: |
Ref document number: 60231203 Country of ref document: DE Date of ref document: 20090402 Kind code of ref document: P |
|
| REG | Reference to a national code |
Ref country code: DK Ref legal event code: T3 |
|
| PG25 | Lapsed in a contracting state [announced via postgrant information from national office to epo] |
Ref country code: FI Free format text: LAPSE BECAUSE OF FAILURE TO SUBMIT A TRANSLATION OF THE DESCRIPTION OR TO PAY THE FEE WITHIN THE PRESCRIBED TIME-LIMIT Effective date: 20090218 Ref country code: ES Free format text: LAPSE BECAUSE OF FAILURE TO SUBMIT A TRANSLATION OF THE DESCRIPTION OR TO PAY THE FEE WITHIN THE PRESCRIBED TIME-LIMIT Effective date: 20090529 |
|
| PG25 | Lapsed in a contracting state [announced via postgrant information from national office to epo] |
Ref country code: AT Free format text: LAPSE BECAUSE OF FAILURE TO SUBMIT A TRANSLATION OF THE DESCRIPTION OR TO PAY THE FEE WITHIN THE PRESCRIBED TIME-LIMIT Effective date: 20090218 Ref country code: SE Free format text: LAPSE BECAUSE OF FAILURE TO SUBMIT A TRANSLATION OF THE DESCRIPTION OR TO PAY THE FEE WITHIN THE PRESCRIBED TIME-LIMIT Effective date: 20090518 |
|
| PG25 | Lapsed in a contracting state [announced via postgrant information from national office to epo] |
Ref country code: BE Free format text: LAPSE BECAUSE OF FAILURE TO SUBMIT A TRANSLATION OF THE DESCRIPTION OR TO PAY THE FEE WITHIN THE PRESCRIBED TIME-LIMIT Effective date: 20090218 |
|
| PG25 | Lapsed in a contracting state [announced via postgrant information from national office to epo] |
Ref country code: PT Free format text: LAPSE BECAUSE OF FAILURE TO SUBMIT A TRANSLATION OF THE DESCRIPTION OR TO PAY THE FEE WITHIN THE PRESCRIBED TIME-LIMIT Effective date: 20090727 |
|
| REG | Reference to a national code |
Ref country code: CH Ref legal event code: PL |
|
| PLBE | No opposition filed within time limit |
Free format text: ORIGINAL CODE: 0009261 |
|
| STAA | Information on the status of an ep patent application or granted ep patent |
Free format text: STATUS: NO OPPOSITION FILED WITHIN TIME LIMIT |
|
| 26N | No opposition filed |
Effective date: 20091119 |
|
| PG25 | Lapsed in a contracting state [announced via postgrant information from national office to epo] |
Ref country code: LI Free format text: LAPSE BECAUSE OF NON-PAYMENT OF DUE FEES Effective date: 20090430 Ref country code: DE Free format text: LAPSE BECAUSE OF NON-PAYMENT OF DUE FEES Effective date: 20091103 Ref country code: CH Free format text: LAPSE BECAUSE OF NON-PAYMENT OF DUE FEES Effective date: 20090430 |
|
| REG | Reference to a national code |
Ref country code: IE Ref legal event code: MM4A |
|
| PG25 | Lapsed in a contracting state [announced via postgrant information from national office to epo] |
Ref country code: IE Free format text: LAPSE BECAUSE OF NON-PAYMENT OF DUE FEES Effective date: 20090426 Ref country code: MC Free format text: LAPSE BECAUSE OF NON-PAYMENT OF DUE FEES Effective date: 20090430 |
|
| PG25 | Lapsed in a contracting state [announced via postgrant information from national office to epo] |
Ref country code: GR Free format text: LAPSE BECAUSE OF FAILURE TO SUBMIT A TRANSLATION OF THE DESCRIPTION OR TO PAY THE FEE WITHIN THE PRESCRIBED TIME-LIMIT Effective date: 20090519 |
|
| PG25 | Lapsed in a contracting state [announced via postgrant information from national office to epo] |
Ref country code: LU Free format text: LAPSE BECAUSE OF NON-PAYMENT OF DUE FEES Effective date: 20090426 |
|
| PG25 | Lapsed in a contracting state [announced via postgrant information from national office to epo] |
Ref country code: TR Free format text: LAPSE BECAUSE OF FAILURE TO SUBMIT A TRANSLATION OF THE DESCRIPTION OR TO PAY THE FEE WITHIN THE PRESCRIBED TIME-LIMIT Effective date: 20090218 |
|
| PG25 | Lapsed in a contracting state [announced via postgrant information from national office to epo] |
Ref country code: CY Free format text: LAPSE BECAUSE OF FAILURE TO SUBMIT A TRANSLATION OF THE DESCRIPTION OR TO PAY THE FEE WITHIN THE PRESCRIBED TIME-LIMIT Effective date: 20090218 |
|
| REG | Reference to a national code |
Ref country code: FR Ref legal event code: PLFP Year of fee payment: 14 |
|
| PGFP | Annual fee paid to national office [announced via postgrant information from national office to epo] |
Ref country code: NL Payment date: 20150420 Year of fee payment: 14 |
|
| PGFP | Annual fee paid to national office [announced via postgrant information from national office to epo] |
Ref country code: GB Payment date: 20150420 Year of fee payment: 14 Ref country code: DK Payment date: 20150420 Year of fee payment: 14 |
|
| PGFP | Annual fee paid to national office [announced via postgrant information from national office to epo] |
Ref country code: FR Payment date: 20150421 Year of fee payment: 14 Ref country code: IT Payment date: 20150428 Year of fee payment: 14 |
|
| REG | Reference to a national code |
Ref country code: DK Ref legal event code: EBP Effective date: 20160430 |
|
| REG | Reference to a national code |
Ref country code: NL Ref legal event code: MM Effective date: 20160501 |
|
| GBPC | Gb: european patent ceased through non-payment of renewal fee |
Effective date: 20160426 |
|
| REG | Reference to a national code |
Ref country code: FR Ref legal event code: ST Effective date: 20161230 |
|
| PG25 | Lapsed in a contracting state [announced via postgrant information from national office to epo] |
Ref country code: GB Free format text: LAPSE BECAUSE OF NON-PAYMENT OF DUE FEES Effective date: 20160426 Ref country code: NL Free format text: LAPSE BECAUSE OF NON-PAYMENT OF DUE FEES Effective date: 20160501 Ref country code: FR Free format text: LAPSE BECAUSE OF NON-PAYMENT OF DUE FEES Effective date: 20160502 |
|
| PG25 | Lapsed in a contracting state [announced via postgrant information from national office to epo] |
Ref country code: IT Free format text: LAPSE BECAUSE OF NON-PAYMENT OF DUE FEES Effective date: 20160426 |
|
| PG25 | Lapsed in a contracting state [announced via postgrant information from national office to epo] |
Ref country code: DK Free format text: LAPSE BECAUSE OF NON-PAYMENT OF DUE FEES Effective date: 20160430 |