EP1391727A2 - Diesel engine lubricating oil contaminant sensor method - Google Patents
Diesel engine lubricating oil contaminant sensor method Download PDFInfo
- Publication number
- EP1391727A2 EP1391727A2 EP03077385A EP03077385A EP1391727A2 EP 1391727 A2 EP1391727 A2 EP 1391727A2 EP 03077385 A EP03077385 A EP 03077385A EP 03077385 A EP03077385 A EP 03077385A EP 1391727 A2 EP1391727 A2 EP 1391727A2
- Authority
- EP
- European Patent Office
- Prior art keywords
- oil
- condition
- conductivity
- diesel engine
- mhz
- Prior art date
- Legal status (The legal status is an assumption and is not a legal conclusion. Google has not performed a legal analysis and makes no representation as to the accuracy of the status listed.)
- Withdrawn
Links
- 238000000034 method Methods 0.000 title claims abstract description 55
- 239000000356 contaminant Substances 0.000 title claims abstract description 11
- 239000010687 lubricating oil Substances 0.000 title claims description 11
- 239000003921 oil Substances 0.000 claims abstract description 172
- 239000004071 soot Substances 0.000 claims abstract description 76
- XLYOFNOQVPJJNP-UHFFFAOYSA-N water Substances O XLYOFNOQVPJJNP-UHFFFAOYSA-N 0.000 claims abstract description 13
- 230000002528 anti-freeze Effects 0.000 claims description 19
- 239000010705 motor oil Substances 0.000 claims description 14
- 239000010710 diesel engine oil Substances 0.000 abstract description 33
- 238000005259 measurement Methods 0.000 abstract description 17
- 239000002283 diesel fuel Substances 0.000 abstract description 14
- 239000003990 capacitor Substances 0.000 description 12
- 239000002253 acid Substances 0.000 description 11
- 239000002184 metal Substances 0.000 description 10
- 230000008859 change Effects 0.000 description 9
- 239000010913 used oil Substances 0.000 description 9
- 230000000694 effects Effects 0.000 description 8
- 150000002500 ions Chemical class 0.000 description 7
- 239000002245 particle Substances 0.000 description 5
- 238000002411 thermogravimetry Methods 0.000 description 5
- 239000000654 additive Substances 0.000 description 4
- QTBSBXVTEAMEQO-UHFFFAOYSA-N Acetic acid Chemical compound CC(O)=O QTBSBXVTEAMEQO-UHFFFAOYSA-N 0.000 description 3
- 238000002485 combustion reaction Methods 0.000 description 3
- 230000002378 acidificating effect Effects 0.000 description 2
- 230000032683 aging Effects 0.000 description 2
- 238000012417 linear regression Methods 0.000 description 2
- 230000001050 lubricating effect Effects 0.000 description 2
- 230000004048 modification Effects 0.000 description 2
- 238000012986 modification Methods 0.000 description 2
- 230000008569 process Effects 0.000 description 2
- 239000000047 product Substances 0.000 description 2
- 230000035945 sensitivity Effects 0.000 description 2
- 150000007513 acids Chemical class 0.000 description 1
- 238000007792 addition Methods 0.000 description 1
- -1 antifreeze Substances 0.000 description 1
- 150000001875 compounds Chemical class 0.000 description 1
- 238000010276 construction Methods 0.000 description 1
- 230000002596 correlated effect Effects 0.000 description 1
- 230000007423 decrease Effects 0.000 description 1
- 238000013461 design Methods 0.000 description 1
- 238000001514 detection method Methods 0.000 description 1
- 238000003487 electrochemical reaction Methods 0.000 description 1
- 238000002474 experimental method Methods 0.000 description 1
- 238000009472 formulation Methods 0.000 description 1
- 239000010711 gasoline engine oil Substances 0.000 description 1
- 230000001939 inductive effect Effects 0.000 description 1
- 230000000977 initiatory effect Effects 0.000 description 1
- 238000005461 lubrication Methods 0.000 description 1
- 230000007246 mechanism Effects 0.000 description 1
- 239000000203 mixture Substances 0.000 description 1
- 230000003071 parasitic effect Effects 0.000 description 1
- 230000000750 progressive effect Effects 0.000 description 1
- 239000013589 supplement Substances 0.000 description 1
- 230000009897 systematic effect Effects 0.000 description 1
Images






Classifications
-
- G—PHYSICS
- G01—MEASURING; TESTING
- G01N—INVESTIGATING OR ANALYSING MATERIALS BY DETERMINING THEIR CHEMICAL OR PHYSICAL PROPERTIES
- G01N27/00—Investigating or analysing materials by the use of electric, electrochemical, or magnetic means
- G01N27/02—Investigating or analysing materials by the use of electric, electrochemical, or magnetic means by investigating impedance
- G01N27/04—Investigating or analysing materials by the use of electric, electrochemical, or magnetic means by investigating impedance by investigating resistance
- G01N27/06—Investigating or analysing materials by the use of electric, electrochemical, or magnetic means by investigating impedance by investigating resistance of a liquid
-
- G—PHYSICS
- G01—MEASURING; TESTING
- G01N—INVESTIGATING OR ANALYSING MATERIALS BY DETERMINING THEIR CHEMICAL OR PHYSICAL PROPERTIES
- G01N33/00—Investigating or analysing materials by specific methods not covered by groups G01N1/00 - G01N31/00
- G01N33/26—Oils; Viscous liquids; Paints; Inks
- G01N33/28—Oils, i.e. hydrocarbon liquids
- G01N33/2888—Lubricating oil characteristics, e.g. deterioration
Definitions
- the present invention relates generally to Diesel engine oil contaminant sensors and more specifically to a method that measures the electrical conductivity of the lubricating oil to determine the amount of at least one of soot, water and antifreeze therein.
- Lubricating oil used in gasoline engines for lubrication of moving components deteriorates by the depletion of the additives and the increase in the acidity of the oil, as measured by a quantity called the total acid number (TAN).
- Oil in Diesel engines is degraded by the same mechanisms as in gasoline engines, but with the additional presence of soot particles, which increases as the oil ages.
- the crankcase oil gradually builds up soot which is a combustion product in the combustion chamber of the engine and which is transferred in small amounts to the crankcase oil.
- the soot builds up to an unacceptable amount, say about four percent by mass or weight of the oil, the lubricating quality of the oil is inhibited.
- soot in Diesel engine oil Many different methods or techniques have been proposed for the measurement of soot in Diesel engine oil. In order to make the soot measurement on operating vehicles, it is necessary to provide a measuring system which is sufficiently inexpensive to incorporate on automotive vehicles made in large numbers and sufficiently rugged to withstand the Diesel engine operating environment. Moreover, a method of measuring soot in crankcase oil must be valid for many types of oil, both natural and synthetic, and containing many different types of additives.
- the prior art describes a number of techniques that measure the dielectric constant with a sensor built like a capacitor.
- the capacitor like sensor includes two metal electrodes with the lubricating oil acting as the dielectric between the electrodes.
- the two metal electrodes take the form of two parallel plates or two concentric cylinders. Most of these sensors determine the permittivity of the oil through a measurement of the capacitance between the metal electrodes.
- Delphi Automotive Systems also possesses a design for a gasoline engine oil contaminant sensor that measures the electrical conductivity of the oil using D.C. or a low frequency (below 1 kHz).
- the sensor consists of two metal electrodes, which can be parallel plates or concentric cylinders or rings.
- the conductivity is determined through a measurement of the electrical resistance between the electrodes.
- This sensor mainly detects the changes in the concentration of ions in the oil.
- fresh oil is slightly basic.
- the combustion products create acidic ions in the oil. At first, the acids neutralize the bases and the conductivity decreases. As the oil ages further, the increase in acidic ions makes the conductivity rise again. This makes for a very good oil quality sensor in gasoline engines.
- the soot in Diesel engine oils masks the ion density changes and renders this type of sensor useless.
- the present invention is a method by which soot content in Diesel engine oil is determined using electrical conductivity measurements of the Diesel oil at a high frequency, or using the ratio of electrical conductivity measurements of the Diesel oil at a high frequency to the electrical conductivity measurements of the Diesel oil at a low frequency which is independent of the brand of oil and immune to the effects of adding fresh oil with different dielectric or electrical properties than the original oil.
- High frequency is defined to be above 2 MHz (for example, up to about 10 GHz) whereas low frequency is defined to be D.C. to about 1 kHz.
- the ratio of the electrical conductivity of Diesel engine oil at the high frequency to the electrical conductivity of Diesel engine oil at the low frequency is referred to as the conductivity ratio.
- Figures 1A through 2C and 27 and 28 depict an example of apparatus to carryout the Diesel engine oil contaminant sensor method according to the present invention
- Figures 3 through 26 depict various graphical plots which support carrying out the various steps of the Diesel engine oil contaminant sensor method according to the present invention.
- FIG 1A depicts an environment of placement and operation of an oil sensor 10 at the bottom of an oil pan 12 of a Diesel engine 14.
- the oil sensor 10 has a cylindrical shell 16 having apertures 18 and an open top end 20.
- a pair of concentrically arranged and mutually separated cylindrical capacitor plates 22, 24 which collectively form a capacitor 25, each of which being connected to a respective portion of wiring. W.
- a thermometric sensor 26 is placed within the shell and also connected to a respective portion of the wiring W.
- oil in the oil pan is sloshed and enters into the space separating the plates 22, 24, causing the capacitance C and the resistance R (see Figure 2) of the space between the plates to change as the condition of the oil changes with hours of operation of the Diesel engine.
- Figures 2A, and 2B are examples of electrical circuits to measure the conductivity of the Diesel oil at high frequencies whereas Figure 2C is an example of an electrical circuit to measure the conductivity of Diesel oil at D.C. or low frequencies (i.e. 20 Hz). The operation of the circuits will be described hereinbelow after a description of the method hereof has been detailed.
- Figure 3 is a plot 100 of conductivity versus frequency of a first brand of fresh oil variously mixed with the same brand of used oil.
- Fresh Rotella 15W40 Diesel engine oil was mixed with the same brand used in a Diesel engine in different ratios to simulate the condition of partially used oil.
- the used oil from the Diesel engine was analyzed to have a total acid number (TAN) of 5.1 mg KOH/ mg sample and a soot concentration of 3.9% as measured by thermogravimetric analysis (TGA).
- TAN total acid number
- TGA thermogravimetric analysis
- Figure 4 is a plot 102 of conductivity versus frequency of a second brand of aged oil while Figure 5 is a plot 104 of conductivity versus frequency of a third brand of aged oil.
- Table 1 is a summary of the two oils used in Figures 4 and 5 and the aging they underwent. The oils were analyzed for total acid number (TAN), total base number (TBN), viscosity, and soot content as measured by thermogravimetric analysis (TGA).
- TAN total acid number
- TBN total base number
- TGA thermogravimetric analysis
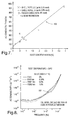
- Figure 6 shows plots 106, 106' of two conductivity ratios versus soot concentration of the oils of Figure 3 at room temperature, wherein the conductivity ratios are, for plot 106, the conductivity measured at 2 MHz divided by the conductivity measured at 20 Hz, and for plot 106', the conductivity measured at 1 MHz divided by the conductivity measured at 20 Hz.
- Plots 106, 106' show the linearity of the method and the increased sensitivity for the ratio using the higher frequency.
- Figure 7 is a plot 108 of conductivity ratio versus soot concentration of the oils of Figures 3, 4, and 5 at room temperature wherein the conductivity ratio is the conductivity measured at 2 MHz divided by the conductivity measured at 20 Hz.
- Figure 7 underscores that the conductivity ratio can be used to determine the soot content and that this method is brand independent thereby eliminating the need to reset the Diesel engine oil sensor after an oil change since the sensor would not need a memory of the initial properties of a particular brand of fresh oil.
- Figure 8 is a plot 110 of conductivity versus frequency of oil aged in a first vehicle while Figure 9 is a plot 112 of conductivity versus frequency of another oil aged in a second vehicle.
- These plots 110, 112 were obtained from oil aged in actual Diesel engines and represent a true oil aging process to supplement the data obtained by mixing used and fresh oil.
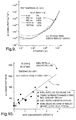
- Figure 10 is a plot 114 of conductivity ratio versus soot concentration at a temperature of 20EC of the oils of Figures 8 and 9 as well as mixed oils while Figure 11 is a plot 116 of conductivity ratio versus soot concentration at a temperature of 40EC of the oils of Figures 8 and 9 as well as mixed oils.
- Figures 10 and 11 demonstrate that the method is brand independent and is correlated to soot content as well as showing that mixed oils have the same correlation as the oils of Figures 8 and 9.
- Figures 10 and 11 show that there is a temperature dependence to the ratio method.
- Figure 12 is a plot 118 of conductivity versus frequency of the fresh first brand of oil at various temperatures from 100 degrees C for plot 118a through decrements of 10 degrees C to 0 degrees C at plot 118b; while Figure 13 is a plot 120 of conductivity versus frequency of used oil of Figure 12 at various temperatures from 100 degrees C for plot 120a through decrements of 10 degrees C to 0 degrees C at plot 120b.
- Figures 12 and 13 show that the conductivity has a large variation with temperature at low frequencies but has little or no variation with temperature at high frequencies.
- Figure 14 is a plot 122 of conductivity ratio versus temperature of the oils of Figures 12 and 13 showing a non linear dependence due to the temperature dependence of the conductivity at the low frequency (20 Hz).
- Figure 15 is a plot 124 of conductivity ratio versus soot concentration at 20 degrees C for various brands of oil
- Figure 16 is a plot 124' of conductivity ratio versus soot concentration at 30 degrees C for various brands of oil
- Figure 17 is a plot 124" of conductivity ratio versus soot concentration at 40 degrees C for various brands of oil.
- Figures 15, 16, and 17 show the need to execute the conductivity ratio method at one selected temperature due to the temperature dependence of the conductivity at low frequencies and also shows that the lower the temperature the better the method.
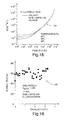
- Figure 18 is a plot 128 of conductivity versus frequency of oil with soot to which acetic acid has been added whereas
- Figure 19 is a plot 130 of conductivity ratio versus the resulting total acid number (TAN) of the oil with acid of Figure 18 showing that there is no systematic effect of TAN on the conductivity ratio.
- soot concentration and TAN were related, for instance if the soot particles were to absorb acid ions, then their combination would still be an indication of the condition of the Diesel engine oil and the conductivity ratio is still a good indicator of that condition.
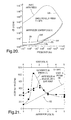
- Figure 20 shows plots 126, 126' of conductivity versus frequency for pure antifreeze (plot 126) and of fresh Shell Rotella oil to which various amounts of antifreeze have been added (Plot 126');
- Figure 21 is a plot 132 of conductivity ratio at 30 degrees C versus percent antifreeze in fresh and used oil with soot;
- Figure 22 is a plot 134 of conductivity ratio versus percent water in oil with soot and antifreeze showing about the same sensitivity of the conductivity ratio to soot, antifreeze, and water. Whether the contaminant is soot, water or antifreeze, all three of these are indicative of oil condition. Since the conductivity ratio has a variance substantially similar for all three of these contaminants (antifreeze up to about 2% by volume) the conductivity ratio is a good indicator of oil condition.
- Figure 23 is a plot 136 of conductivity versus soot concentration at a low frequency for various brands of oil
- Figure 24 is a plot 138 of conductivity versus soot concentration at a high frequency for various brands of oil. While Figure 24 shows a poor and non-linear correlation between soot concentration and low frequency conductivity, Figure 24 is linear showing that the conductivity at a high frequency may be used to determine the soot concentration of Diesel engine oil.
- Figure 25 is a plot 140 of the electrical conductance of the oil sensor 10 versus frequency for Diesel engine oil with various soot concentrations
- Figure 26 is a plot 142 of conductance versus soot concentration at 10 MHz for various brands of Diesel engine oil. Since conductivity is directly proportional to conductance, Figures 25 and 26 show that the linearity of conductivity of Diesel engine oil at high frequencies versus soot concentration is brand independent, correlates with soot concentration, and, as previously mentioned, is temperature independent as well.
- Various electrical means or circuits may be designed or utilized to measure the conductivity of oil at low and high frequencies, such as, homodyne detection, utilizing a lock-in amplifier, Shering bridge methods, double RC bridge methods, phase-locked loops, resonant RLC circuits, and others, as are well known in the art.
- the Diesel oil sensor 10 is modeled as a capacitor 25 (see Figure 1B) having capacitance C with a resistor R in parallel with the capacitor where 1/R represents the conductance of the physical configuration of the metal plates of the oil sensor 10 filled with Diesel engine oil to be measured, and C represents the capacitance of the physical configuration of the metal plates of the oil sensor 10 filled with the Diesel engine oil.
- the inductor L is chosen in accordance with the dimensions of the sensor 10 to provide circuit resonance at a frequency between, for example, 2 MHz and 3 MHz.
- Circuit element 52 is an analog to digital voltage (A/D) converter providing voltage V R as one input to microprocessor 56 while circuit element 54 is an (A/D) converter providing voltage V S as another input to the microprocessor.
- Circuit element 58 provides voltage, V' R , at various frequencies depending upon the value of control voltage V 0 and may, for example, be a voltage to frequency converter.
- V R is a digital representation of V' R .
- the power source for circuit element 58 is not shown.
- Circuit element 60 is such that the voltage V' S represents the current I through R at resonance, which occurs at high frequencies, and may be, for example, a resistor or a current to voltage converter, whose values and parameters are stored in microprocessor 56 whose input voltage V S is a digital representation of V' S .
- Circuit 50 operates as follows. For high frequencies, microprocessor 56 outputs various control voltages V 0 such that element 58 outputs a predetermined range of high frequencies, for example 2 MHz to 3 MHz, whereby voltage V S is monitored by the microprocessor until a maximum voltage is detected. At this maximum voltage, the circuit is in resonance whereby the inductive reactance of the inductor L cancels the capacitive reactance of the capacitance C of the oil sensor 10 and the circuit is purely resistive.
- V' R represents the voltage across R and element 60 whereas V' S is a representation of the current I through R.
- Microprocessor 56 has incorporated within it all parameters, constants, algorithms, and programs to effect the operation of the circuit 50 and the present invention utilizing the conductivity ratio and conductivity or conductance by techniques well known in the art.
- FIG 2B is a second example of an electrical circuit 50' to measure conductivity of oil at high frequencies utilizing a Schering Bridge, a technique well known in the art.
- the oil sensor 10 is modeled as a capacitor 25 (see Figure 1B) having capacitance C with a resistor R in parallel with the capacitor where 1/R represents the conductance of the physical configuration of the metal plates of the oil sensor 10 filled with Diesel engine oil to be measured, and C represents the capacitance of the physical configuration of the metal plates of the oil sensor 10 filled with the Diesel engine oil.
- the oil sensor 10 comprises one arm of the Bridge.
- a second arm of the Bridge consists of capacitor C 1 while a third arm consists of resistor R 1 .
- the fourth arm of the Bridge consists of a variable resistor R A in series with a variable capacitor C A .
- the voltage V AB is the voltage between terminals A and B whereas the voltage V A is the voltage at terminal A measured with respect to ground and the voltage V B is the voltage at terminal B measured with respect to ground.
- R A could be a digitally controlled variable resistance and C A could be a varactor both controlled by microprocessor 56 by techniques well known in the art.
- Circuit element 52' is an analog to voltage (A/D) converter providing voltage V' B as one input to microprocessor 56 while circuit element 54' is an (A/D) converter providing voltage V' A as another input to the microprocessor.
- Microprocessor 56 has incorporated within it all parameters, constants, algorithms, and programs to effect the operation of the circuit 50' and the present invention utilizing the conductivity ratio and conductivity or conductance by techniques well known in the art.
- FIG 2C is an example of an electrical circuit 50" to measure the D.C. conductivity of oil utilizing a known constant current source I'.
- the oil sensor 10 is modeled as a capacitor 25 (see Figure 1B) having capacitance C with a resistor R in parallel with the capacitor where 1/R represents the conductance of the physical configuration of the metal plates of the oil sensor 10 filled with Diesel engine oil to be measured, and C represents the capacitance of the physical configuration of the metal plates of the oil sensor 10 filled with the Diesel engine oil.
- Circuit element 52" is an analog to digital voltage (A/D) converter providing voltage V DC as an input to microprocessor 56.
- V DC is a digital representation of analog voltage V' DC .
- Voltage source V E represents an electrochemical voltage due to the electrochemical reactions of the Diesel oil within the oil sensor 10.
- Circuit 50" operates as follows for D.C. After switch S is closed for a predetermined time much longer than the RC time constant of the oil sensor, for example one-second, whereat the circuit is in a steady state condition, V DC is read by microprocessor 56 and, for example, is stored as V DC (closed). Thereafter, switch S is opened for a predetermined time much longer than the RC time constant of the oil sensor, for example one-second, whereat the circuit is in a steady state condition, V DC is read by microprocessor 56 and, for example, is stored as V DC (open).
- the conductance is the reciprocal of the resistance (1/R) and the conductivity can be determined by the known parameters of the oil sensor and circuit.
- Microprocessor 56 has incorporated within it all parameters, constants, algorithms, and programs to effect the operation of the circuit 50" and the present invention utilizing the conductivity ratio and conductivity or conductance by techniques well known in the art.
- the difference [V DC (closed) - V DC (open)] eliminates the electrochemical voltage V E thereby ensuring that the resistance R is properly determined.
- the present invention indicates when Diesel engine oil has degraded by determining the amount of soot in Diesel engine oil either by use of the conductivity ratio or by the conductivity at high frequencies.
- the present invention enables a setpoint threshold for soot concentration to be chosen to indicate when the Diesel engine lubricating oil has degraded to an extent that it should be replaced with fresh Diesel engine oil.
- the present invention is independent of the brand of Diesel engine oil and is immune to the effects of adding fresh Diesel engine (lubricating) oil with different dielectric or electrical properties than that of the original oil.
- the present invention negates the necessity of the oil sensor to have a memory unit or microprocessor incorporated therein thereby simplifying the service of the Diesel engine by eliminating the need to reset the oil sensor after each oil change.
- the conductivity method of the present invention is also temperature independent.
- the steps for carrying-out the method using a ratio methodology are as follows: First experimentally determined are a set of first oil condition constants, m and a set of second oil condition constants, b, wherein m and b are determined based upon a range of temperatures of oil. Now to obtain an oil condition indication of an oil being used in a selected Diesel engine, a first measurement is taken of a selected one of conductivity and conductance of the oil of the Diesel engine at a frequency above of about 2 MHz to thereby provide a first measured value. And, a second measurement is taken of the selected one of conductivity and conductance of the oil at a frequency below about 1 KHz to thereby provide a second measured value.
- the microprocessor sends out an appropriate signal relating to the condition of the oil which may include an indication that the oil condition is acceptable; if X is above (or optionally at or above) the threshold, then the microprocessor sends out an appropriate signal relating to the condition of the oil which may include an indication that the oil condition is unacceptable.
- the microprocessor sends out an appropriate signal relating to the condition of the oil which may include an indication that the oil condition is acceptable; if X is above (or optionally at or above) the threshold, then the microprocessor sends out an appropriate signal relating to the condition of the oil which may include an indication that the oil condition is unacceptable.
- Figure 27 is an example of a microprocessor flow chart to implement the high frequency conductivity or conductance method according to the present invention.
- microprocessor 56 is initialized with appropriate values and parameters and, if necessary, the high frequency circuit may be selected by microprocessor 56 through appropriate digitally controlled switches, the method being well known in the art.
- the sensor data is then input at block 152 whereat the value of Y is ascertained.
- Block 158 compares the value of x to the threshold value of the soot concentration X THRESHOLD .
- control passes to block 152 to repeat the process. Otherwise, an oil change signal is output at block 162.
- FIG 28 is an example of a microprocessor flow chart to implement the conductivity ratio method according to the present invention.
- microprocessor 56 is initialized with appropriate values and parameters.
- the high frequency circuit may be selected by microprocessor 56 through appropriate digitally controlled switches, the method being well known in the art.
- the sensor data from the high frequency circuit is then input at block 178.
- the D.C. or low frequency circuit is selected next at block 180.
- the D.C. or low frequency circuit may be selected by microprocessor 56 through appropriate digitally controlled switches, the method being well known in the art.
- the sensor data from the D.C. or low frequency circuit is then input at block 182.
- Y is determined from the ratio of the high frequency sensor data to the D.C. or low frequency sensor data.
- Block 190 compares the value of x to the threshold value of the concentration X THRESHOLD . If the value of X > X THRESHOLD , an oil change signal is output at block 192. Otherwise, control passes to block 172 to repeat the process.
Landscapes
- Chemical & Material Sciences (AREA)
- Health & Medical Sciences (AREA)
- Life Sciences & Earth Sciences (AREA)
- General Health & Medical Sciences (AREA)
- Immunology (AREA)
- Engineering & Computer Science (AREA)
- Analytical Chemistry (AREA)
- Biochemistry (AREA)
- Chemical Kinetics & Catalysis (AREA)
- General Physics & Mathematics (AREA)
- Physics & Mathematics (AREA)
- Pathology (AREA)
- Electrochemistry (AREA)
- General Chemical & Material Sciences (AREA)
- Oil, Petroleum & Natural Gas (AREA)
- Food Science & Technology (AREA)
- Medicinal Chemistry (AREA)
- Investigating Or Analyzing Materials By The Use Of Electric Means (AREA)
Abstract
Description
| Sample | Oil | Car | TAN (mg KOH per g) | TBN (mg KOH per g) | Viscosity 40EC (cStokes) | Viscosity 100EC (cStokes) | Soot (TGA %) |
| Rotella | Shell Rotella T SAE 15W40 | VW | 0 | 0 (initial) | |||
| 009 | Shell Rotella T SAE 15W40 | VW Jetta | 2.71 | 8.09 | 120.4 | 15.9 | 0.53 |
| 556 | Shell Rotella T SAE 15W40 | Dodge RAM | 12.14 | 3.66 | 186.4 | 21.7 | 2.99 |
| 077 | Texaco Ursa Sup Plus SAE 15E40 | Dodge RAM | 1.19 | 8.87 | 106 | 14.4 | 0 (initial) |
| 102 | Texaco Ursa Sup Plus SAE 15E40 | Dodge RAM | 2.25 | 8.38 | 103.7 | 13.9 | 0.5 |
| 361 | Texaco Ursa Sup Plus SAE 15E40 | Dodge RAM | 4.07 | 8.24 | 104.4 | 14.2 | 0.68 |
| 580 | Texaco Ursa Sup Plus SAE 15E40 | Dodge RAM | 4.11 | 7.92 | 117.1 | 14.8 | 0.83 |
Claims (15)
- A method for determining engine lubricating oil condition of a Diesel engine, comprising the steps of:wherein if X is below the threshold, then the engine oil condition has a first condition; and if X is at least one of at the threshold or above the threshold, then the engine oil condition has a second condition.measuring (10) a selected one of conductivity and conductance of lubricating oil of a Diesel engine at a frequency above of about 2 MHz to thereby provide a first measured value;measuring (10) the selected one of conductivity and conductance of the oil at a frequency below about 1 KHz to thereby provide a second measured value;measuring (26) a temperature of the oil taken substantially contemporaneously with said second step of measuring;determining (142, 186) a first oil condition constant, m;determining (142, 186) a second oil condition constant, b; wherein m and b are determined based upon a predetermined relationship with respect to the measured temperature;calculating (184) a ratio, Y, of the first measured value with respect to the second measured value;calculating (188) a contaminant concentration, X, based upon a relation:determining (190) whether X has reached a predetermined threshold;
- The method of Claim 1, further comprising generating (192) an indication which is indicative of the engine oil having the second condition.
- The method of Claim 1, wherein said first measured value is measured at a selected frequency substantially between about 2 MHz and about 50 MHz.
- The method of Claim 3, further comprising generating an indication which is indicative of the engine oil having the second condition.
- The method of Claim 1, wherein said step of calculating calculates at least one of soot concentration of the oil, water concentration of the oil, and antifreeze concentration of the oil below about 2 percent by volume.
- The method of Claim 5, wherein said first measured value is measured at a selected frequency substantially between about 2 MHz and about 50 MHz.
- The method of Claim 6, further comprising generating an indication which is indicative of the engine oil having the second condition.
- A method for determining engine lubricating oil condition of a Diesel engine, comprising the steps of:wherein if X is below the threshold, then the engine oil condition has a first condition; and if X is at least one of at the threshold or above the threshold, then the engine oil condition has a second condition.measuring (10) a selected one of conductivity and conductance of lubricating oil of a Diesel engine at a frequency above of about 2 MHz to thereby provide a first measured value;measuring (10) the selected one of conductivity and conductance of the oil at a frequency below about 1 KHz to thereby provide a second measured value;measuring (26) a temperature of the oil taken substantially contemporaneously with said second step of measuring;determining (142, 186) a first oil condition constant, m;determining (142, 186) a second oil condition constant, b; wherein m and b are determined based upon a predetermined relationship with respect to the measured temperature;calculating (184) a ratio, Y, of the first measured value with respect to the second measured value;calculating (188) a soot concentration, X, based upon a relation:determining (190) whether X has reached a predetermined threshold;
- The method of Claim 8, further comprising generating (192) an indication which is indicative of the engine oil having the second condition.
- The method of Claim 8, wherein said first measured value is measured at a selected frequency substantially between about 2 MHz and about 50 MHz.
- The method of Claim 10, further comprising generating an indication which is indicative of the engine oil having the second condition.
- A method for determining engine lubricating oil condition of a Diesel engine, comprising the steps of:wherein if X is below the threshold, then the engine oil condition has a first condition; and if X is at least one of at the threshold or above the threshold, then the engine oil condition has a second condition.measuring (10) a selected one of conductivity and conductance of lubricating oil of a Diesel engine at a frequency above of about 2 MHz to thereby provide a measured value, Y;determining (142, 154) a first oil condition constant, m;determining (142, 154) a second oil condition constant, b;calculating (156) a soot concentration, X, based upon a relation:determining (158) whether X has reached a predetermined threshold;
- The method of Claim 12, further comprising generating (160) an indication which is indicative of the engine oil having the second condition.
- The method of Claim 12, wherein said first measured value is measured at a selected frequency substantially between about 2 MHz and about 50 MHz.
- The method of Claim 14, further comprising generating an indication which is indicative of the engine oil having the second condition.
Applications Claiming Priority (2)
| Application Number | Priority Date | Filing Date | Title |
|---|---|---|---|
| US226100 | 2002-08-22 | ||
| US10/226,100 US6911830B2 (en) | 2002-08-22 | 2002-08-22 | Diesel engine lubricating oil contaminant sensor method |
Publications (2)
| Publication Number | Publication Date |
|---|---|
| EP1391727A2 true EP1391727A2 (en) | 2004-02-25 |
| EP1391727A3 EP1391727A3 (en) | 2004-06-02 |
Family
ID=31188012
Family Applications (1)
| Application Number | Title | Priority Date | Filing Date |
|---|---|---|---|
| EP03077385A Withdrawn EP1391727A3 (en) | 2002-08-22 | 2003-07-30 | Diesel engine lubricating oil contaminant sensor method |
Country Status (2)
| Country | Link |
|---|---|
| US (1) | US6911830B2 (en) |
| EP (1) | EP1391727A3 (en) |
Cited By (5)
| Publication number | Priority date | Publication date | Assignee | Title |
|---|---|---|---|---|
| GB2418873A (en) * | 2004-10-06 | 2006-04-12 | Ford Global Tech Llc | Soot filter control system |
| DE102007037525A1 (en) * | 2007-08-09 | 2009-02-12 | Joma-Polytec Kunststofftechnik Gmbh | Oil filter system for internal combustion engine of motor vehicle, has filter element arrangement operated in different operating positions with filter effects, and controller for controlling arrangement depending on degree of contamination |
| WO2009005109A3 (en) * | 2007-07-05 | 2009-03-05 | Toyota Motor Co Ltd | Fuel deterioration detection apparatus for internal combustion engine |
| CN107430083A (en) * | 2015-02-02 | 2017-12-01 | 杰必机电配件西班牙公司 | For measuring the existing method of diesel fuel filter reclaimed water and water sensor for performing methods described |
| CN114216935A (en) * | 2021-12-24 | 2022-03-22 | 上海工程技术大学 | Device for detecting performance of lubricating oil based on electrostatic induction |
Families Citing this family (47)
| Publication number | Priority date | Publication date | Assignee | Title |
|---|---|---|---|---|
| US8643388B2 (en) * | 2006-02-17 | 2014-02-04 | Voelker Sensors, Inc. | Detection of fuel contamination in lubricating oil |
| US7244353B2 (en) * | 2002-11-15 | 2007-07-17 | Oil Purification Systems, Inc. | Method of and system for fluid purification |
| US6867603B2 (en) * | 2002-12-04 | 2005-03-15 | Delphi Technologies, Inc. | Method for measuring high frequency resistance in diesel engine lubrication oil |
| US6844745B1 (en) * | 2003-09-15 | 2005-01-18 | Eaton Corporation | Method of determining the fluid condition of diesel engine lubricant during real time operation |
| US20050248358A1 (en) * | 2004-05-07 | 2005-11-10 | The Lubrizol Corporation, A Corporation Of The State Of Ohio | Method for on-line monitoring of condition of non-aqueous fluids |
| US7355415B2 (en) * | 2004-05-07 | 2008-04-08 | The Lubrizol Corporation | Method for on-line monitoring of condition of non-aqueous fluids |
| US8614588B2 (en) | 2006-02-17 | 2013-12-24 | Voelker Sensors, Inc. | Active filtering of oil |
| WO2007098213A2 (en) * | 2006-02-17 | 2007-08-30 | Voelker Sensors, Inc. | Oil monitoring system |
| US20080302606A1 (en) * | 2007-06-08 | 2008-12-11 | Glacier Bay, Inc. | Oil replacement system |
| US20090001997A1 (en) * | 2007-06-29 | 2009-01-01 | Yingjie Lin | Systems and methods for determining a total acid number associated with biodiesel in a mixture of biodiesel and petrodiesel |
| DE102007042507B4 (en) | 2007-09-07 | 2019-12-12 | HELLA GmbH & Co. KGaA | Method for determining the contents of liquids, in particular motor oil |
| US8390304B2 (en) | 2008-02-22 | 2013-03-05 | Board Of Supervisors Of Louisiana State University And Agricultural And Mechanical College | Electrical resonance detection of particles and analytes in microfluidic channels |
| US9026304B2 (en) * | 2008-04-07 | 2015-05-05 | United Parcel Service Of America, Inc. | Vehicle maintenance systems and methods |
| CA2736168C (en) | 2008-09-09 | 2018-04-10 | United Parcel Service Of America, Inc. | Systems and methods of utilizing telematics data to improve fleet management operations |
| US11482058B2 (en) | 2008-09-09 | 2022-10-25 | United Parcel Service Of America, Inc. | Systems and methods for utilizing telematics data to improve fleet management operations |
| US8386120B2 (en) * | 2010-02-24 | 2013-02-26 | International Engine Intellectual Property Company, Llc. | Method for automatically determining engine oil change frequency based on fuel injected |
| CN101852758B (en) * | 2010-05-18 | 2012-12-19 | 深圳市计量质量检测研究院 | Method for rapidly screening hogwash oil |
| US9335317B2 (en) * | 2011-03-03 | 2016-05-10 | Ntn Corporation | Status monitoring system and status monitoring method for rolling device |
| US9208626B2 (en) | 2011-03-31 | 2015-12-08 | United Parcel Service Of America, Inc. | Systems and methods for segmenting operational data |
| US9953468B2 (en) | 2011-03-31 | 2018-04-24 | United Parcel Service Of America, Inc. | Segmenting operational data |
| US8897953B2 (en) | 2011-07-26 | 2014-11-25 | United Parcel Service Of America, Inc. | Systems and methods for managing fault codes |
| US9035800B2 (en) * | 2012-10-12 | 2015-05-19 | The Boeing Company | Fuel tank monitoring system |
| US20140116119A1 (en) * | 2012-10-25 | 2014-05-01 | Argosy Technologies | Device and Method for Measuring a Quantity of Water in Oil or Oil Products |
| CN104061981A (en) * | 2013-03-18 | 2014-09-24 | 鸿富锦精密工业(武汉)有限公司 | Water level detection system |
| US9293033B2 (en) | 2013-07-16 | 2016-03-22 | The Boeing Company | Wireless fuel sensor system |
| US9909916B2 (en) | 2013-07-16 | 2018-03-06 | The Boeing Company | Wireless fuel sensor system |
| US9805521B1 (en) | 2013-12-03 | 2017-10-31 | United Parcel Service Of America, Inc. | Systems and methods for assessing turns made by a vehicle |
| CN104049001B (en) * | 2014-05-27 | 2016-03-30 | 天津大学 | Vertical profit phase content based on frequency complex network is measured and verification method |
| US10309788B2 (en) | 2015-05-11 | 2019-06-04 | United Parcel Service Of America, Inc. | Determining street segment headings |
| DE112015006926B4 (en) * | 2015-09-22 | 2025-03-06 | Renesas Design North America Inc. | Selecting multiple configuration settings using a single configuration port |
| US10730626B2 (en) | 2016-04-29 | 2020-08-04 | United Parcel Service Of America, Inc. | Methods of photo matching and photo confirmation for parcel pickup and delivery |
| US9969495B2 (en) | 2016-04-29 | 2018-05-15 | United Parcel Service Of America, Inc. | Unmanned aerial vehicle pick-up and delivery systems |
| JP6401811B2 (en) * | 2017-03-15 | 2018-10-10 | Kyb株式会社 | Fluid property detector |
| US10705039B2 (en) * | 2017-03-27 | 2020-07-07 | Nabtesco Corporation | Sensor for detecting magnetic powders in a lubricant |
| CN110770145A (en) * | 2017-04-28 | 2020-02-07 | G·E·扬 | Sophisticated depth sensor |
| US10775792B2 (en) | 2017-06-13 | 2020-09-15 | United Parcel Service Of America, Inc. | Autonomously delivering items to corresponding delivery locations proximate a delivery route |
| JP6901355B2 (en) * | 2017-09-11 | 2021-07-14 | Kyb株式会社 | Fluid property detector |
| US10796423B2 (en) | 2017-09-29 | 2020-10-06 | United Parcel Service Of America, Inc. | Predictive parcel damage identification, analysis, and mitigation |
| US10934093B2 (en) | 2017-11-14 | 2021-03-02 | United Parcel Service Of America, Inc | Automated package transport vehicle |
| US11426648B2 (en) | 2018-02-14 | 2022-08-30 | Brunswick Bowling Products Llc | Contaminant detection/sensing system for bowling lane conditioning machine |
| CN114812916B (en) * | 2021-01-18 | 2023-12-19 | 博泰车联网(南京)有限公司 | Method, device and storage medium for preventing oil theft |
| US12259377B2 (en) | 2022-04-05 | 2025-03-25 | Saudi Arabian Oil Company | Detecting hydrocarbon fuels in lubrication oils |
| US12216041B2 (en) | 2022-05-31 | 2025-02-04 | Saudi Arabian Oil Company | Method to detect diesel in fluid samples using partially dissolvable cuvettes |
| JP7694913B2 (en) * | 2022-07-28 | 2025-06-18 | カヤバ株式会社 | Fluid property detection device |
| US12546759B2 (en) | 2023-03-30 | 2026-02-10 | Saudi Arabian Oil Company | Thin polymer film dissolved under tension to detect hydrocarbon fuels hidden in paraffin-based lubrication oils |
| US12298266B2 (en) | 2023-03-30 | 2025-05-13 | Saudi Arabian Oil Company | Changes in resistivity of mesh-patterned polymer thin films coated with conductive traces used to detect hydrocarbon fuels hidden in paraffin-based lubrication oils |
| US12517107B2 (en) | 2023-04-11 | 2026-01-06 | Saudi Arabian Oil Company | Detecting hydrocarbon fuels in lubrication oils |
Family Cites Families (22)
| Publication number | Priority date | Publication date | Assignee | Title |
|---|---|---|---|---|
| GB1421227A (en) * | 1973-04-25 | 1976-01-14 | Skildum J D | Test instrument and method of isolating and measuring the capacitance due to a particular functional group in a liquid |
| GB1578527A (en) | 1976-03-13 | 1980-11-05 | Lucas Industries Ltd | Apparatus for detecting water in oil |
| US4281533A (en) | 1980-01-14 | 1981-08-04 | General Motors Corporation | Apparatus for measuring soot concentration in engine oil |
| US4345202A (en) | 1980-12-19 | 1982-08-17 | General Motors Corporation | Method of detecting soot in engine oil using microwaves |
| JPS5885314A (en) | 1981-11-17 | 1983-05-21 | Nissan Motor Co Ltd | Deterioration detector of engine oil |
| US4503384A (en) | 1982-04-28 | 1985-03-05 | General Motors Corporation | Microwave probe for measurement of dielectric constants |
| US4733556A (en) | 1986-12-22 | 1988-03-29 | Ford Motor Company | Method and apparatus for sensing the condition of lubricating oil in an internal combustion engine |
| US4971015A (en) * | 1988-11-08 | 1990-11-20 | General Motors Corporation | Combustion engine with multi-fuel capability |
| US5604441A (en) | 1995-03-14 | 1997-02-18 | Detroit Diesel Corporation | In-situ oil analyzer and methods of using same, particularly for continuous on-board analysis of diesel engine lubrication systems |
| US5656767A (en) | 1996-03-08 | 1997-08-12 | Computational Systems, Inc. | Automatic determination of moisture content and lubricant type |
| DE19628690C2 (en) * | 1996-07-17 | 1999-04-22 | Achenbach Buschhuetten Gmbh | Methods and measuring systems for measuring physical quantities of low conductivity and non-conductivity fluids |
| US5933016A (en) * | 1996-08-30 | 1999-08-03 | The University Of Dayton | Single electrode conductivity technique |
| US5824889A (en) | 1997-03-06 | 1998-10-20 | Kavlico Corporation | Capacitive oil deterioration and contamination sensor |
| US6028433A (en) * | 1997-05-14 | 2000-02-22 | Reid Asset Management Company | Portable fluid screening device and method |
| US6278282B1 (en) * | 1999-10-07 | 2001-08-21 | Detroit Diesel Corporation | Method and system for determining oil quality |
| US6380746B1 (en) * | 1999-11-03 | 2002-04-30 | Eaton Corporation | Monitoring fluid condition with a spiral electrode configuration |
| US6535001B1 (en) | 2000-05-01 | 2003-03-18 | Delphi Technologies, Inc | Method and device for sensing oil condition |
| FR2820824B1 (en) * | 2001-02-12 | 2004-06-04 | Total Raffinage Distribution | DEVICE FOR MEASURING THE EFFICIENCY OF A LUBRICATING OIL AND ITS APPLICATIONS |
| US6557396B2 (en) | 2001-05-04 | 2003-05-06 | Delphi Technologies, Inc. | Flexible circuit film engine oil sensor |
| US6575018B2 (en) | 2001-07-06 | 2003-06-10 | Delphi Technologies, Inc. | Method for determining oil viscosity |
| US6509749B1 (en) | 2001-08-14 | 2003-01-21 | Delphi Technologies, Inc. | Oil condition trend algorithm |
| US6590402B2 (en) | 2001-10-02 | 2003-07-08 | Delphi Technologies, Inc. | Engine oil contamination sensor |
-
2002
- 2002-08-22 US US10/226,100 patent/US6911830B2/en not_active Expired - Fee Related
-
2003
- 2003-07-30 EP EP03077385A patent/EP1391727A3/en not_active Withdrawn
Cited By (7)
| Publication number | Priority date | Publication date | Assignee | Title |
|---|---|---|---|---|
| GB2418873A (en) * | 2004-10-06 | 2006-04-12 | Ford Global Tech Llc | Soot filter control system |
| GB2418873B (en) * | 2004-10-06 | 2009-03-18 | Ford Global Tech Llc | A soot filter control system |
| WO2009005109A3 (en) * | 2007-07-05 | 2009-03-05 | Toyota Motor Co Ltd | Fuel deterioration detection apparatus for internal combustion engine |
| DE102007037525A1 (en) * | 2007-08-09 | 2009-02-12 | Joma-Polytec Kunststofftechnik Gmbh | Oil filter system for internal combustion engine of motor vehicle, has filter element arrangement operated in different operating positions with filter effects, and controller for controlling arrangement depending on degree of contamination |
| CN107430083A (en) * | 2015-02-02 | 2017-12-01 | 杰必机电配件西班牙公司 | For measuring the existing method of diesel fuel filter reclaimed water and water sensor for performing methods described |
| CN114216935A (en) * | 2021-12-24 | 2022-03-22 | 上海工程技术大学 | Device for detecting performance of lubricating oil based on electrostatic induction |
| CN114216935B (en) * | 2021-12-24 | 2023-11-21 | 沃伯瑞新材料(江苏)有限公司 | Device for detecting lubricating oil performance based on electrostatic induction |
Also Published As
| Publication number | Publication date |
|---|---|
| US6911830B2 (en) | 2005-06-28 |
| US20040036487A1 (en) | 2004-02-26 |
| EP1391727A3 (en) | 2004-06-02 |
Similar Documents
| Publication | Publication Date | Title |
|---|---|---|
| US6911830B2 (en) | Diesel engine lubricating oil contaminant sensor method | |
| EP1014082B1 (en) | Fluid condition monitoring | |
| TWI480551B (en) | Degradation of lubricating oil ‧ Method for measuring variable mass and its measuring device | |
| EP2505998B1 (en) | Measuring method for degree of degradation of lubricating oil, and measuring device therefor, as well as lubricating oil monitoring system in machine and device | |
| US6459995B1 (en) | Electrical measurement of oil quality | |
| US6255954B1 (en) | Detection of wear-particles and other impurities in industrial or other fluids | |
| US7064562B2 (en) | Temperature compensation method for soot sensor | |
| US20040135584A1 (en) | Apparatus and method for sensing particle accumulation in a medium | |
| MXPA00010816A (en) | Monitoring fluid condition through an aperture. | |
| EP2932248B1 (en) | Lubricating grease condition monitoring | |
| US6810717B2 (en) | Method for determining engine lubricating oil condition | |
| US6774645B1 (en) | Device and method for detecting deposit formations on sensor surfaces where lubricants cause the formations | |
| Shatokhina | A device for fast quality control of oils | |
| AU760233B2 (en) | Fluid condition monitor | |
| Torrents et al. | Sensing oil condition through temperature coefficient of dielectric constant | |
| Halalay et al. | In-situ monitoring of engine oils through electrical AC impedance measurements | |
| Katafuchi et al. | Development of an apparatus to evaluate oil deterioration and oil life based on a new principle for environmental conservation | |
| Wang et al. | Feasibility of Detecting Antifreeze Leakage in Diesel Engine Oils | |
| MXPA99011820A (en) | Flu condition monitor |
Legal Events
| Date | Code | Title | Description |
|---|---|---|---|
| PUAI | Public reference made under article 153(3) epc to a published international application that has entered the european phase |
Free format text: ORIGINAL CODE: 0009012 |
|
| AK | Designated contracting states |
Kind code of ref document: A2 Designated state(s): AT BE BG CH CY CZ DE DK EE ES FI FR GB GR HU IE IT LI LU MC NL PT RO SE SI SK TR |
|
| AX | Request for extension of the european patent |
Extension state: AL LT LV MK |
|
| PUAL | Search report despatched |
Free format text: ORIGINAL CODE: 0009013 |
|
| AK | Designated contracting states |
Kind code of ref document: A3 Designated state(s): AT BE BG CH CY CZ DE DK EE ES FI FR GB GR HU IE IT LI LU MC NL PT RO SE SI SK TR |
|
| AX | Request for extension of the european patent |
Extension state: AL LT LV MK |
|
| RIC1 | Information provided on ipc code assigned before grant |
Ipc: 7G 01N 27/06 B Ipc: 7G 01N 33/28 A |
|
| 17P | Request for examination filed |
Effective date: 20041202 |
|
| AKX | Designation fees paid |
Designated state(s): DE FR GB |
|
| 17Q | First examination report despatched |
Effective date: 20060919 |
|
| 17Q | First examination report despatched |
Effective date: 20060919 |
|
| GRAP | Despatch of communication of intention to grant a patent |
Free format text: ORIGINAL CODE: EPIDOSNIGR1 |
|
| STAA | Information on the status of an ep patent application or granted ep patent |
Free format text: STATUS: THE APPLICATION IS DEEMED TO BE WITHDRAWN |
|
| 18D | Application deemed to be withdrawn |
Effective date: 20090526 |