Technical Field
-
The present invention relates to a gene panel
comprising a group of genes of which expression levels
change in hepatocytes during liver regeneration as
compared with those in a normal state and a method for
producing the same as well as use of the gene panel.
These aspects of the present invention are useful in the
fields of diagnosis, drug and so forth.
Background Art
-
After partial hepatectomy in liver cancer
treatment or transplantation of partially resected liver
in liver disease treatment, rapid regeneration of the
remaining liver or transplanted liver is important.
However, poor liver regeneration is observed in not a
few cases. Further, adults often have fatty livers, and
fatty livers often lead to poor regeneration, which
causes problems after partial hepatectomy. Furthermore,
in order to compensate for damaged liver in hepatitis,
it is important to accelerate liver regeneration. Delay
in the regeneration worsens hepatitis and can lead to
fulminant hepatitis, of which prognosis is poor.
-
Accordingly, medical care that accelerates liver
regeneration is being required, and it can be said that
screening for drugs accelerating liver regeneration is
important. However, in spite of such requirement, no
effective therapeutic agent that accelerates liver
regeneration has been found, and no method for
efficiently screening for drugs that accelerate liver
regeneration has been known.
-
It is known that, when partial hepatectomy is
performed in a rat, liver regeneration is quickly
started, and that the hepatocyte population size comes
back to the size before the hepatectomy in about 1 week.
While it is considered that liver regeneration is
accelerated by interactions of two or more kinds of
associated genes, the overall picture of liver
regeneration process remains unknown for what kinds of
genes function at what kinds of timings. Since it is
considered that many genes are involved in liver
regeneration, it is considered that it is important to
examine a large number of important genes involved in
liver regeneration to grasp the overall picture of liver
regeneration. However, although attempts have been made
so far to reproduce liver regeneration in a culture
system including a combination of genes and proteins
considered to be involved in liver regeneration, no one
has succeeded yet. Further, gene screenings utilizing
changes in expression observed during liver regeneration
as index have been reported (Xu W et al., Biochem.
Biophys. Represents. Commun., 278(2): 318-25, 2000; Kar
S and Carr BI, Biochem. Biophys. Represents. Commun.,
212(1): 21-6, 1995; Mohn KL, et al., Mol. Cell Biol.,
11(1): 381-90, 1991; Sobczak J et al., Exp. Cell Res.,
169(1): 47-56, 1987; Huber BE et al., Hepatology, 6(2):
209-19, 1986). However, in these screenings,
expressions of only a few types of genes have been
examined.
Disclosure of the Invention
-
The present invention was accomplished in view of
the above, and its object is to provide a gene panel
comprising genes of which expression levels change in
hepatocytes during liver regeneration as compared with
those in a normal state and a method for screening for a
drug that accelerates liver regeneration by utilizing
the gene panel.
-
The inventors of the present invention considered
that liver regeneration could be accelerated by
realizing behaviors of genes involved in liver
regeneration close to those of their patterns observed
when liver regeneration was being accelerated. Then,
they examined expression profiles of various genes
during liver regeneration by using partially
hepatectomized rats to obtain expression information
about genes involved in liver regeneration, and thus
accomplished the present invention.
-
That is, the present invention provides the
followings.
- (1) A gene panel comprising names of genes of which
expression levels change in hepatocytes during liver
regeneration as compared with those in a normal state
and expression profiles of the genes.
- (2) The gene panel according to (1), wherein the changes
of the gene expression levels are changes in the
expression levels in a model animal after partial
hepatectomy as compared with the expression levels in a
normal state in the model animal.
- (3) The gene panel according to (1) or (2), wherein the
expression profiles include expression profiles over
time during liver regeneration.
- (4) The gene panel according to any one of (1) to (3),
which includes sequence information of a group of PCR
primers for analyzing the expression profiles of the
genes.
- (5) The gene panel according to any one of (2) to (4),
wherein the model animal is a rat.
- (6) The gene panel according to any one of (1) to (5),
which includes expression profiles of at least 6 types
of genes among 166 types of the genes represented by the
numbers 1 to 166 in Tables 1. 6 and 7.
- (7) The gene panel according to (6), wherein the at
least 6 types of genes are selected from 151 types of
the genes represented by numbers 1 to 151 in Tables 1
and 6.
- (8) The gene panel according to (6), wherein the at
least 6 types of genes are selected from 137 types of
the genes represented by the numbers 1 to 137 in Tables
1 and 6.
- (9) The gene panel according to any one of (6) to (8),
wherein the at least 6 types of genes are the genes
represented by the numbers 5, 17, 36, 46, 67 and 68 in
Table 1.
- (10) A method for producing a gene panel comprising
expression profiles of genes of which expression levels
change in hepatocytes during liver regeneration as
compared with those in a normal state, which comprises
the steps of:
- (a) measuring expression levels of various genes in
hepatocytes of a model animal in a normal state and
expression levels of the genes during liver
regeneration;
- (b) comparing the expression levels, respectively; and
- (c) identifying a group of genes of which expression
levels change during liver regeneration and producing
expression profiles from information about gene names
and changes in the expression levels.
- (11) The method according to (10), wherein, in the step
(a), the expression levels of the gene are analyzed over
time during liver regeneration.
- (12) The method according to (11), wherein a liver
regeneration accelerating substance is administered
before, during or after liver regeneration.
- (13) The method according to (12), wherein the liver
regeneration accelerating substance is L-alanine.
- (14) The method according to any one of (10) to (13),
wherein the gene expression levels are analyzed by one
or more kinds of methods selected from the gene chip
method, the ATAC-PCR method and the Taqman PCR (SYBR
Green) method.
- (15) The method according to (14), wherein the gene
expression levels are analyzed by the gene chip method
and the ATAC-PCR method.
- (16) The method according to (14), wherein the gene
expression levels are analyzed by the Taqman PCR (SYBR
Green) method.
- (17) A method for screening for a drug involved in liver
regeneration, which comprises administering a drug to a
model animal or liver tissue or cells and profiling
expressions of genes constituting the gene panel
according to (1).
- (18) A method for evaluating a condition of liver, which
comprises profiling expressions of genes constituting
the gene panel according to (1) for liver of a subject.
- (19) A group of primers used in the method for producing
a gene panel according to (10), the screening method
according to (17) or the evaluation method according to
(18), which comprises all or a part of the
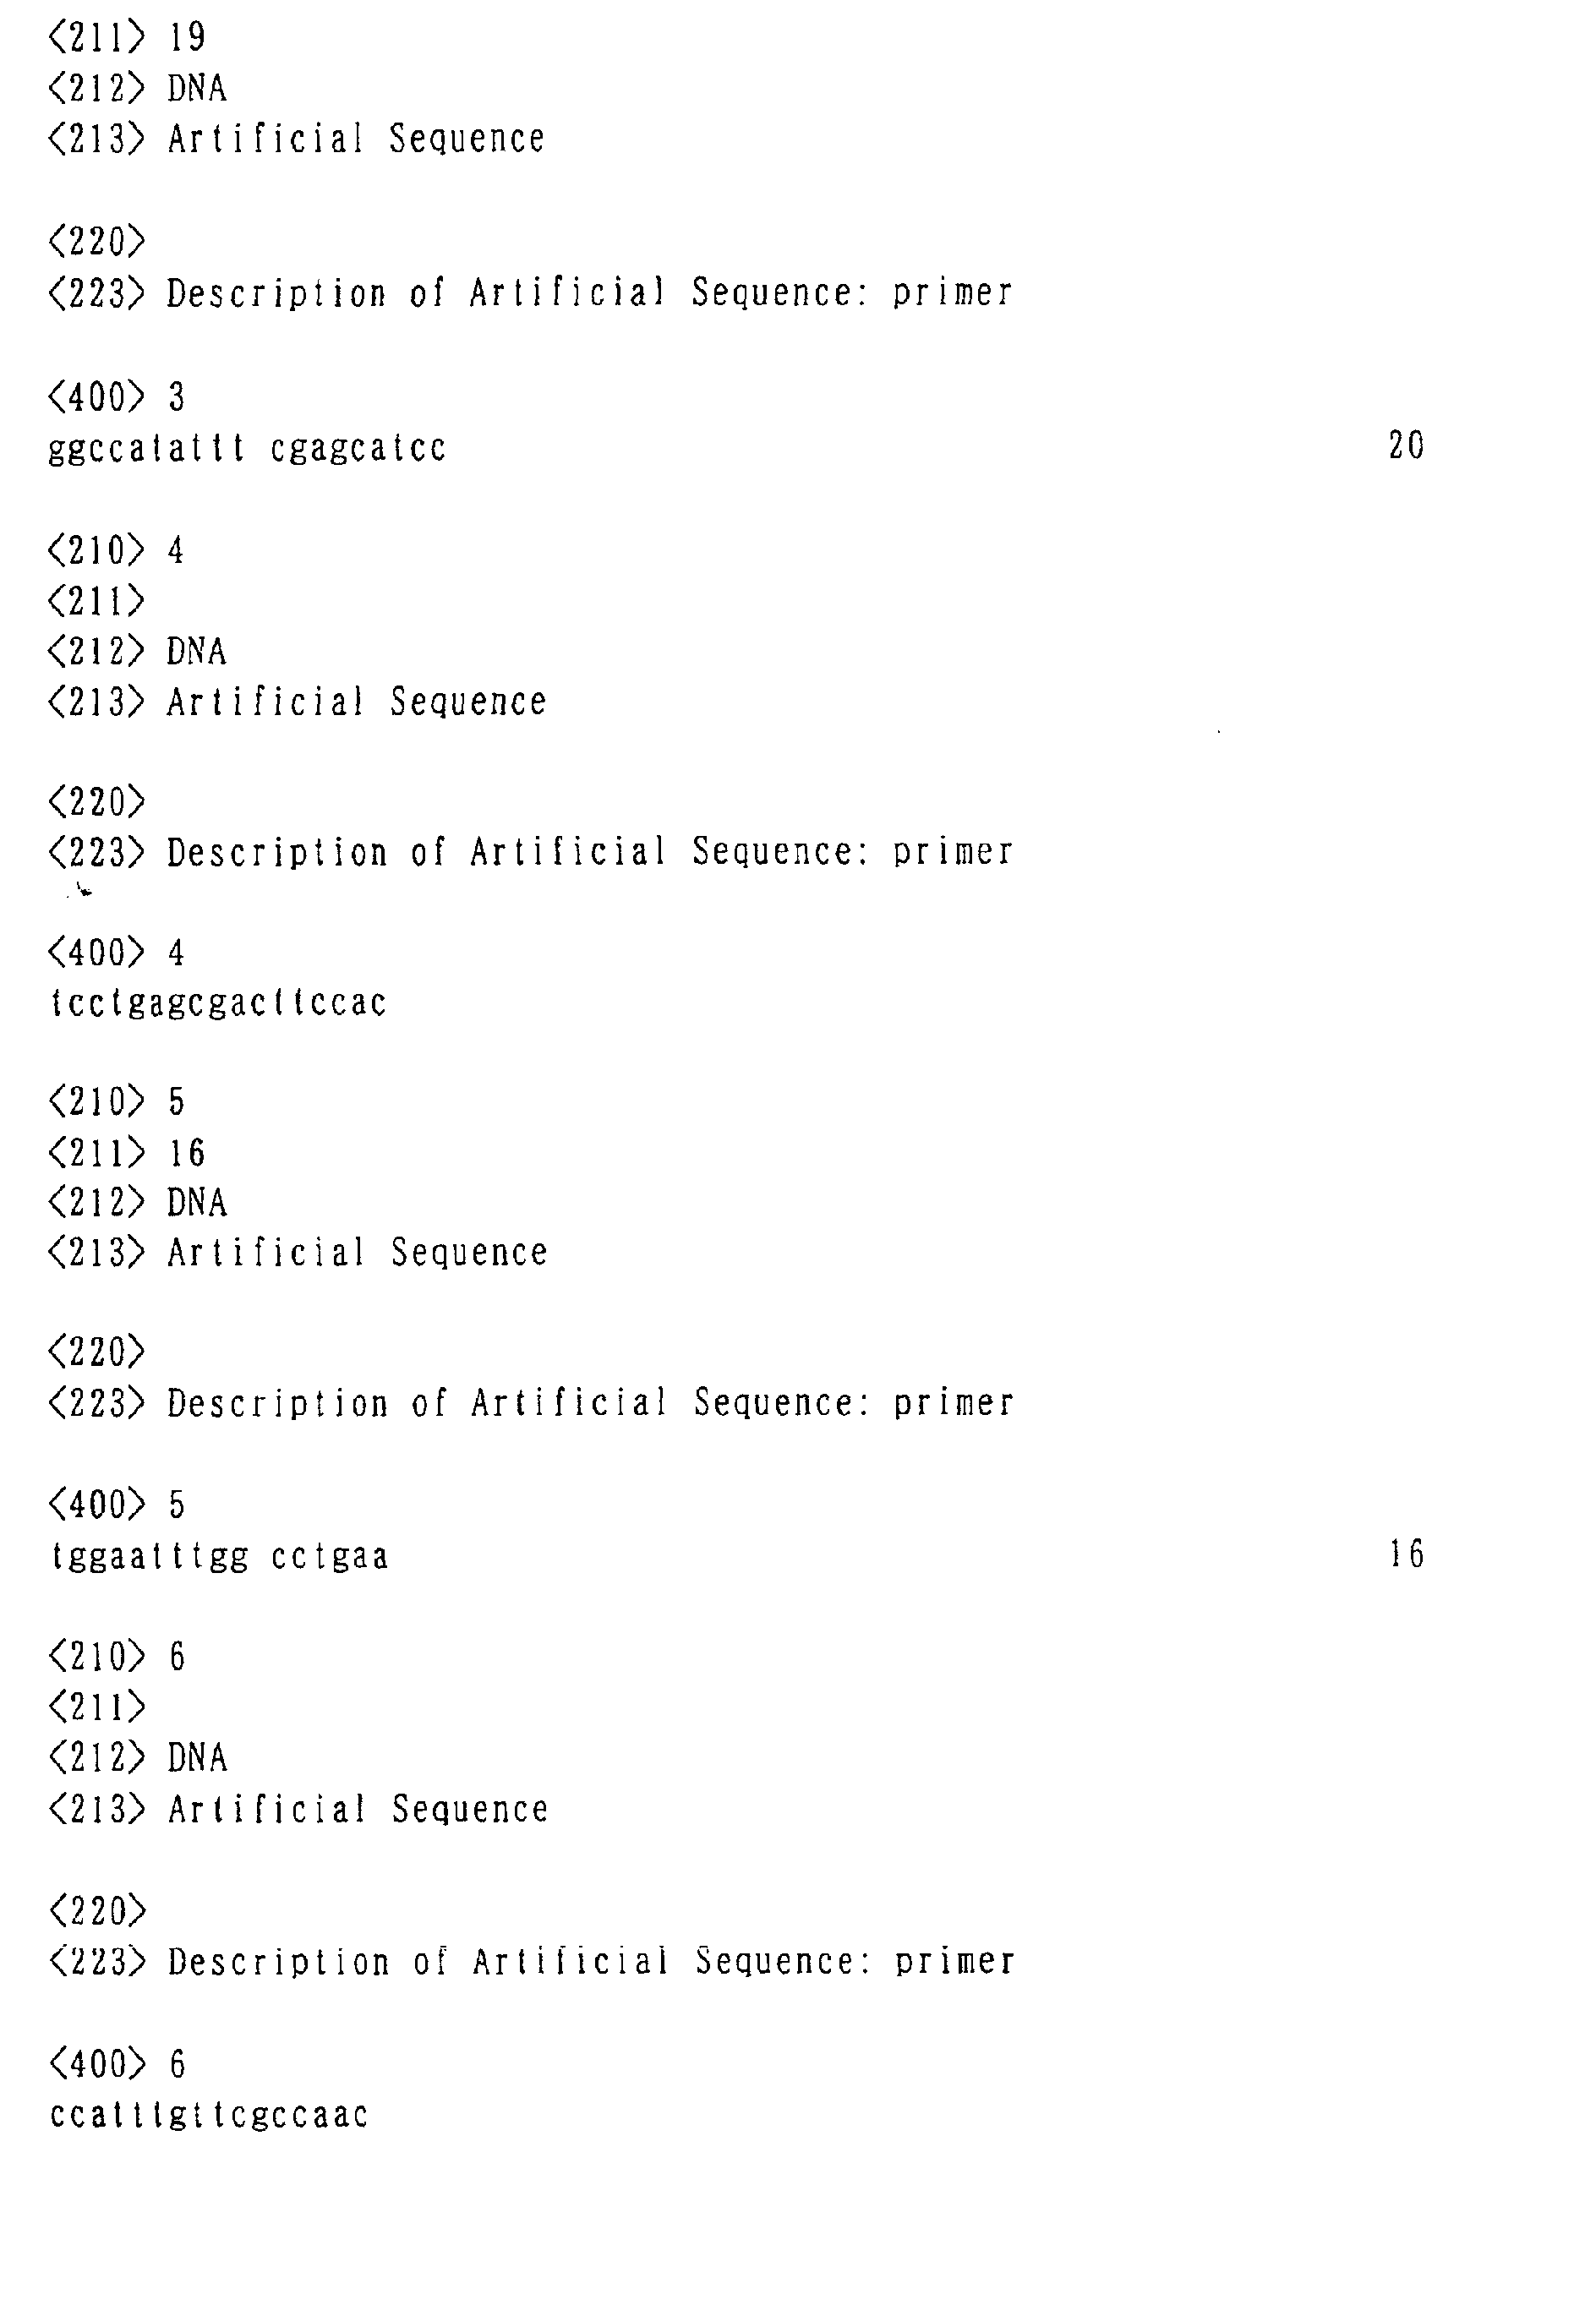
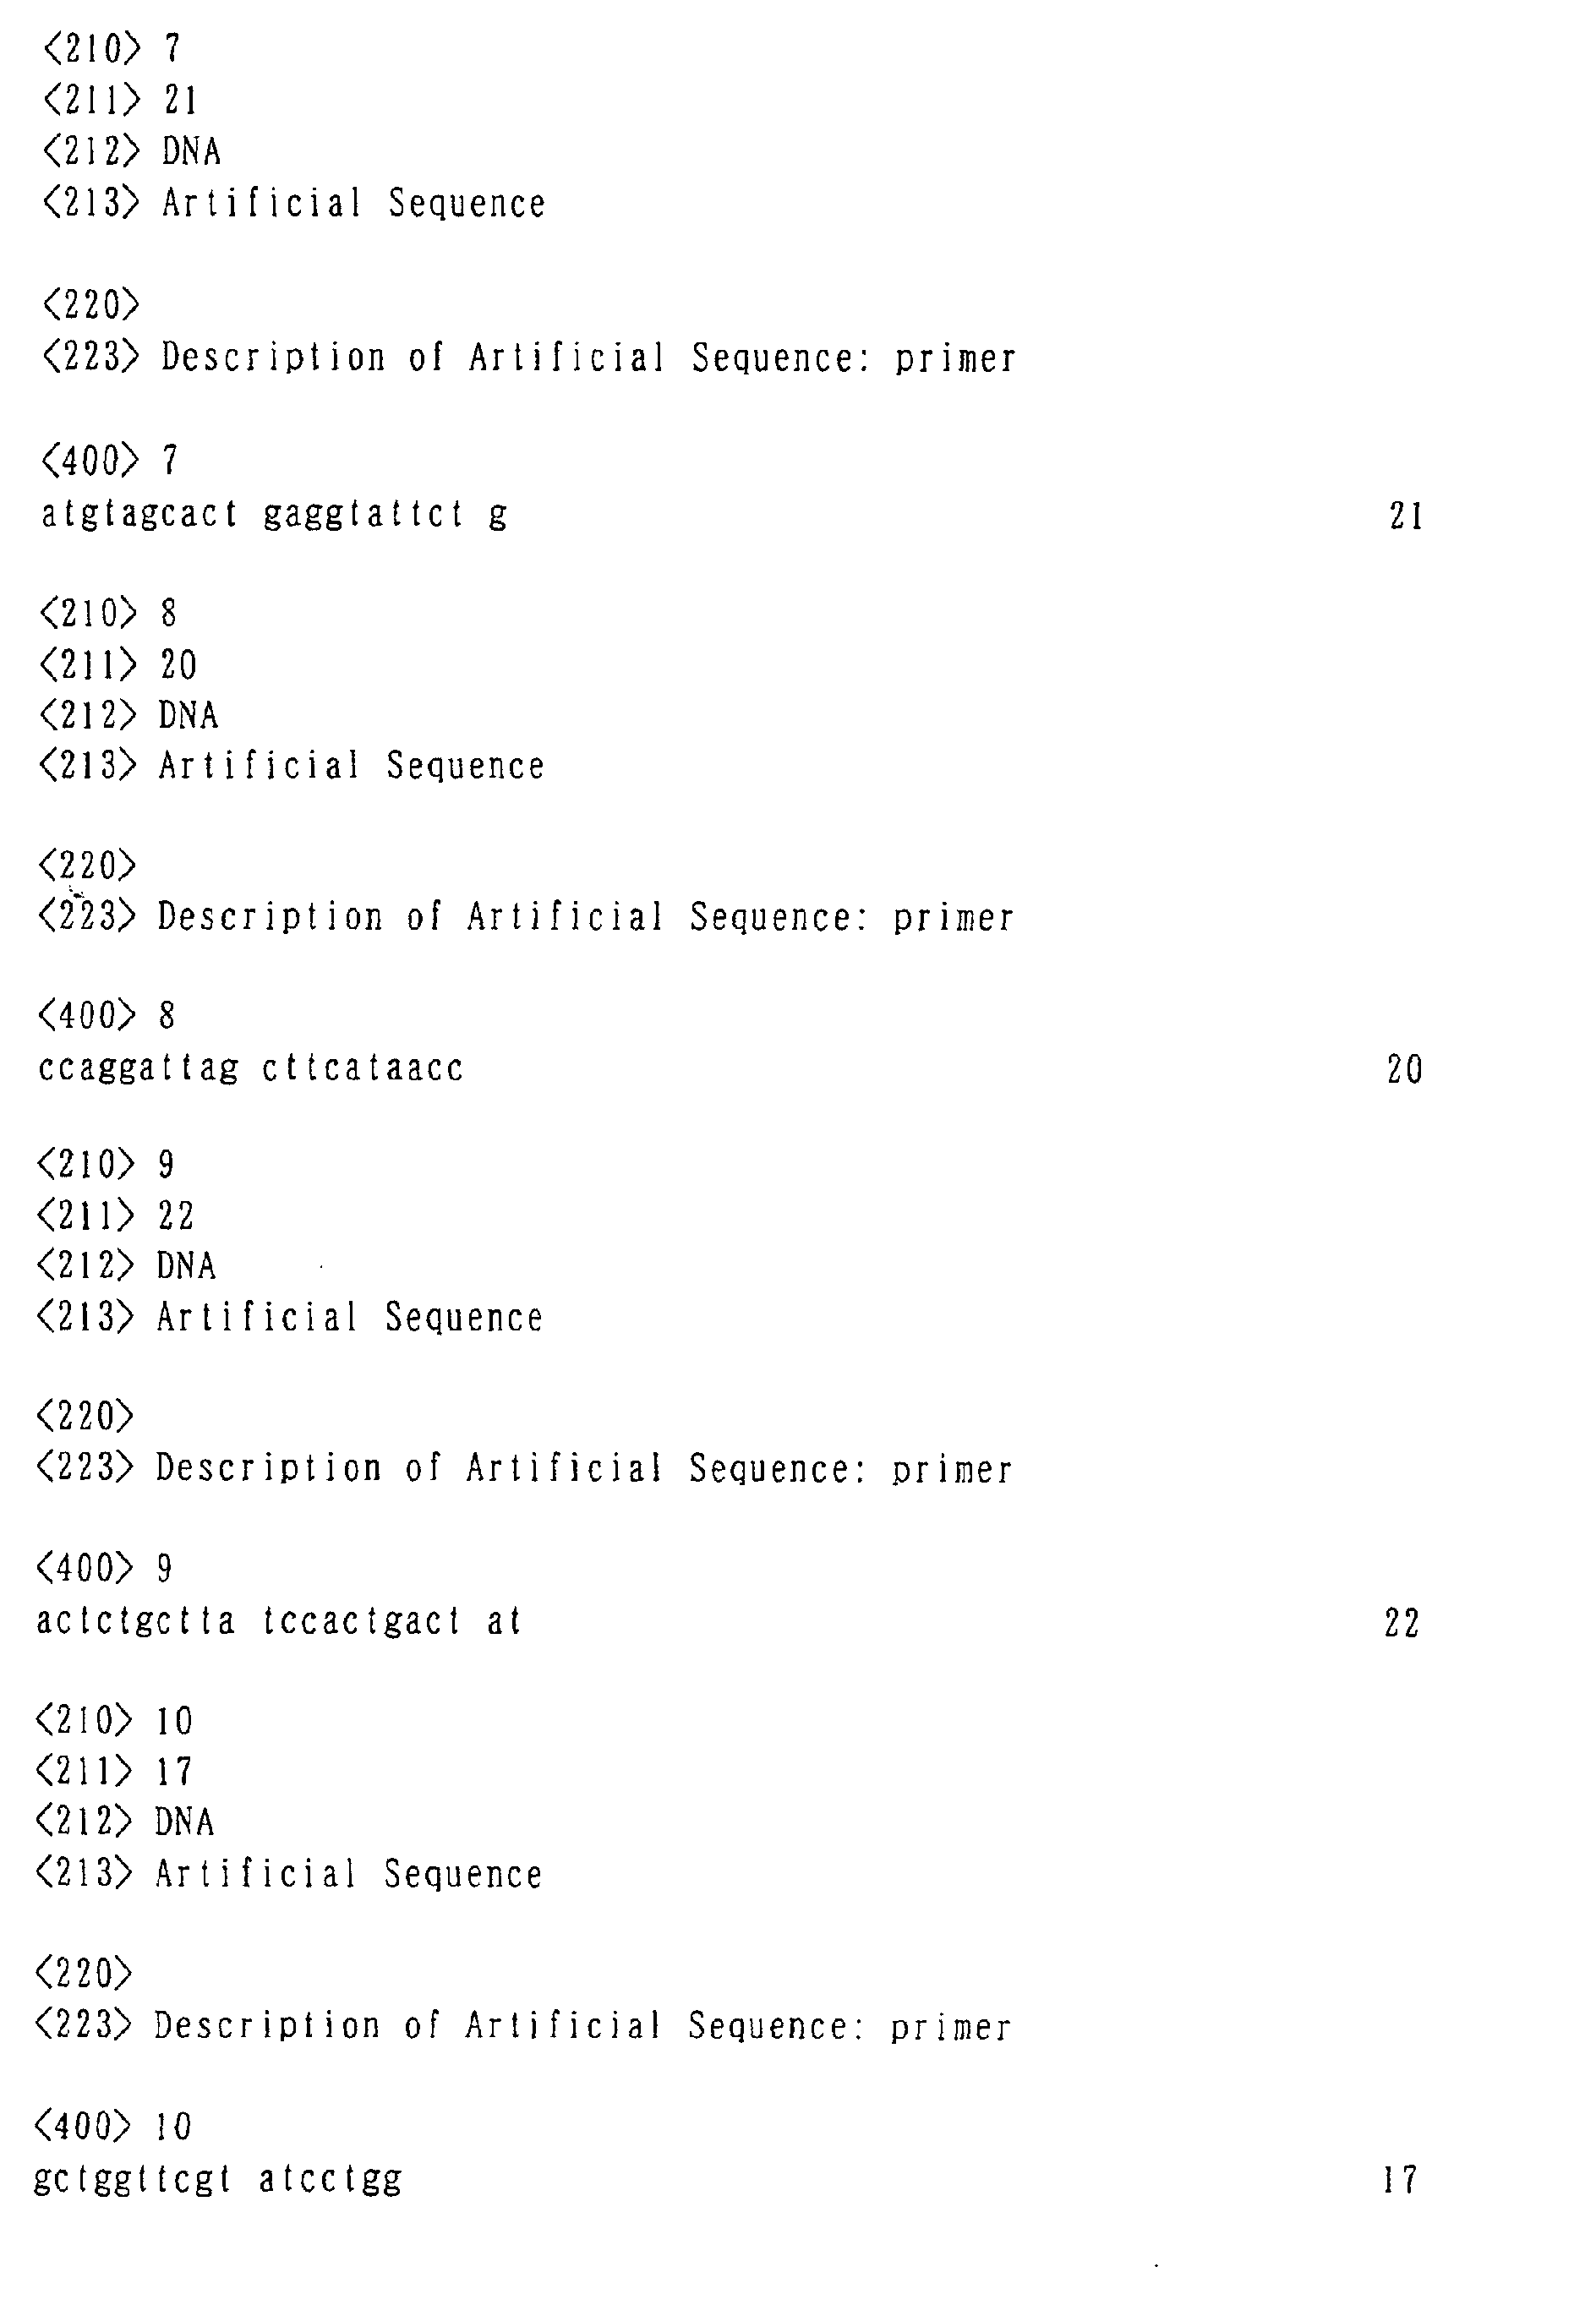
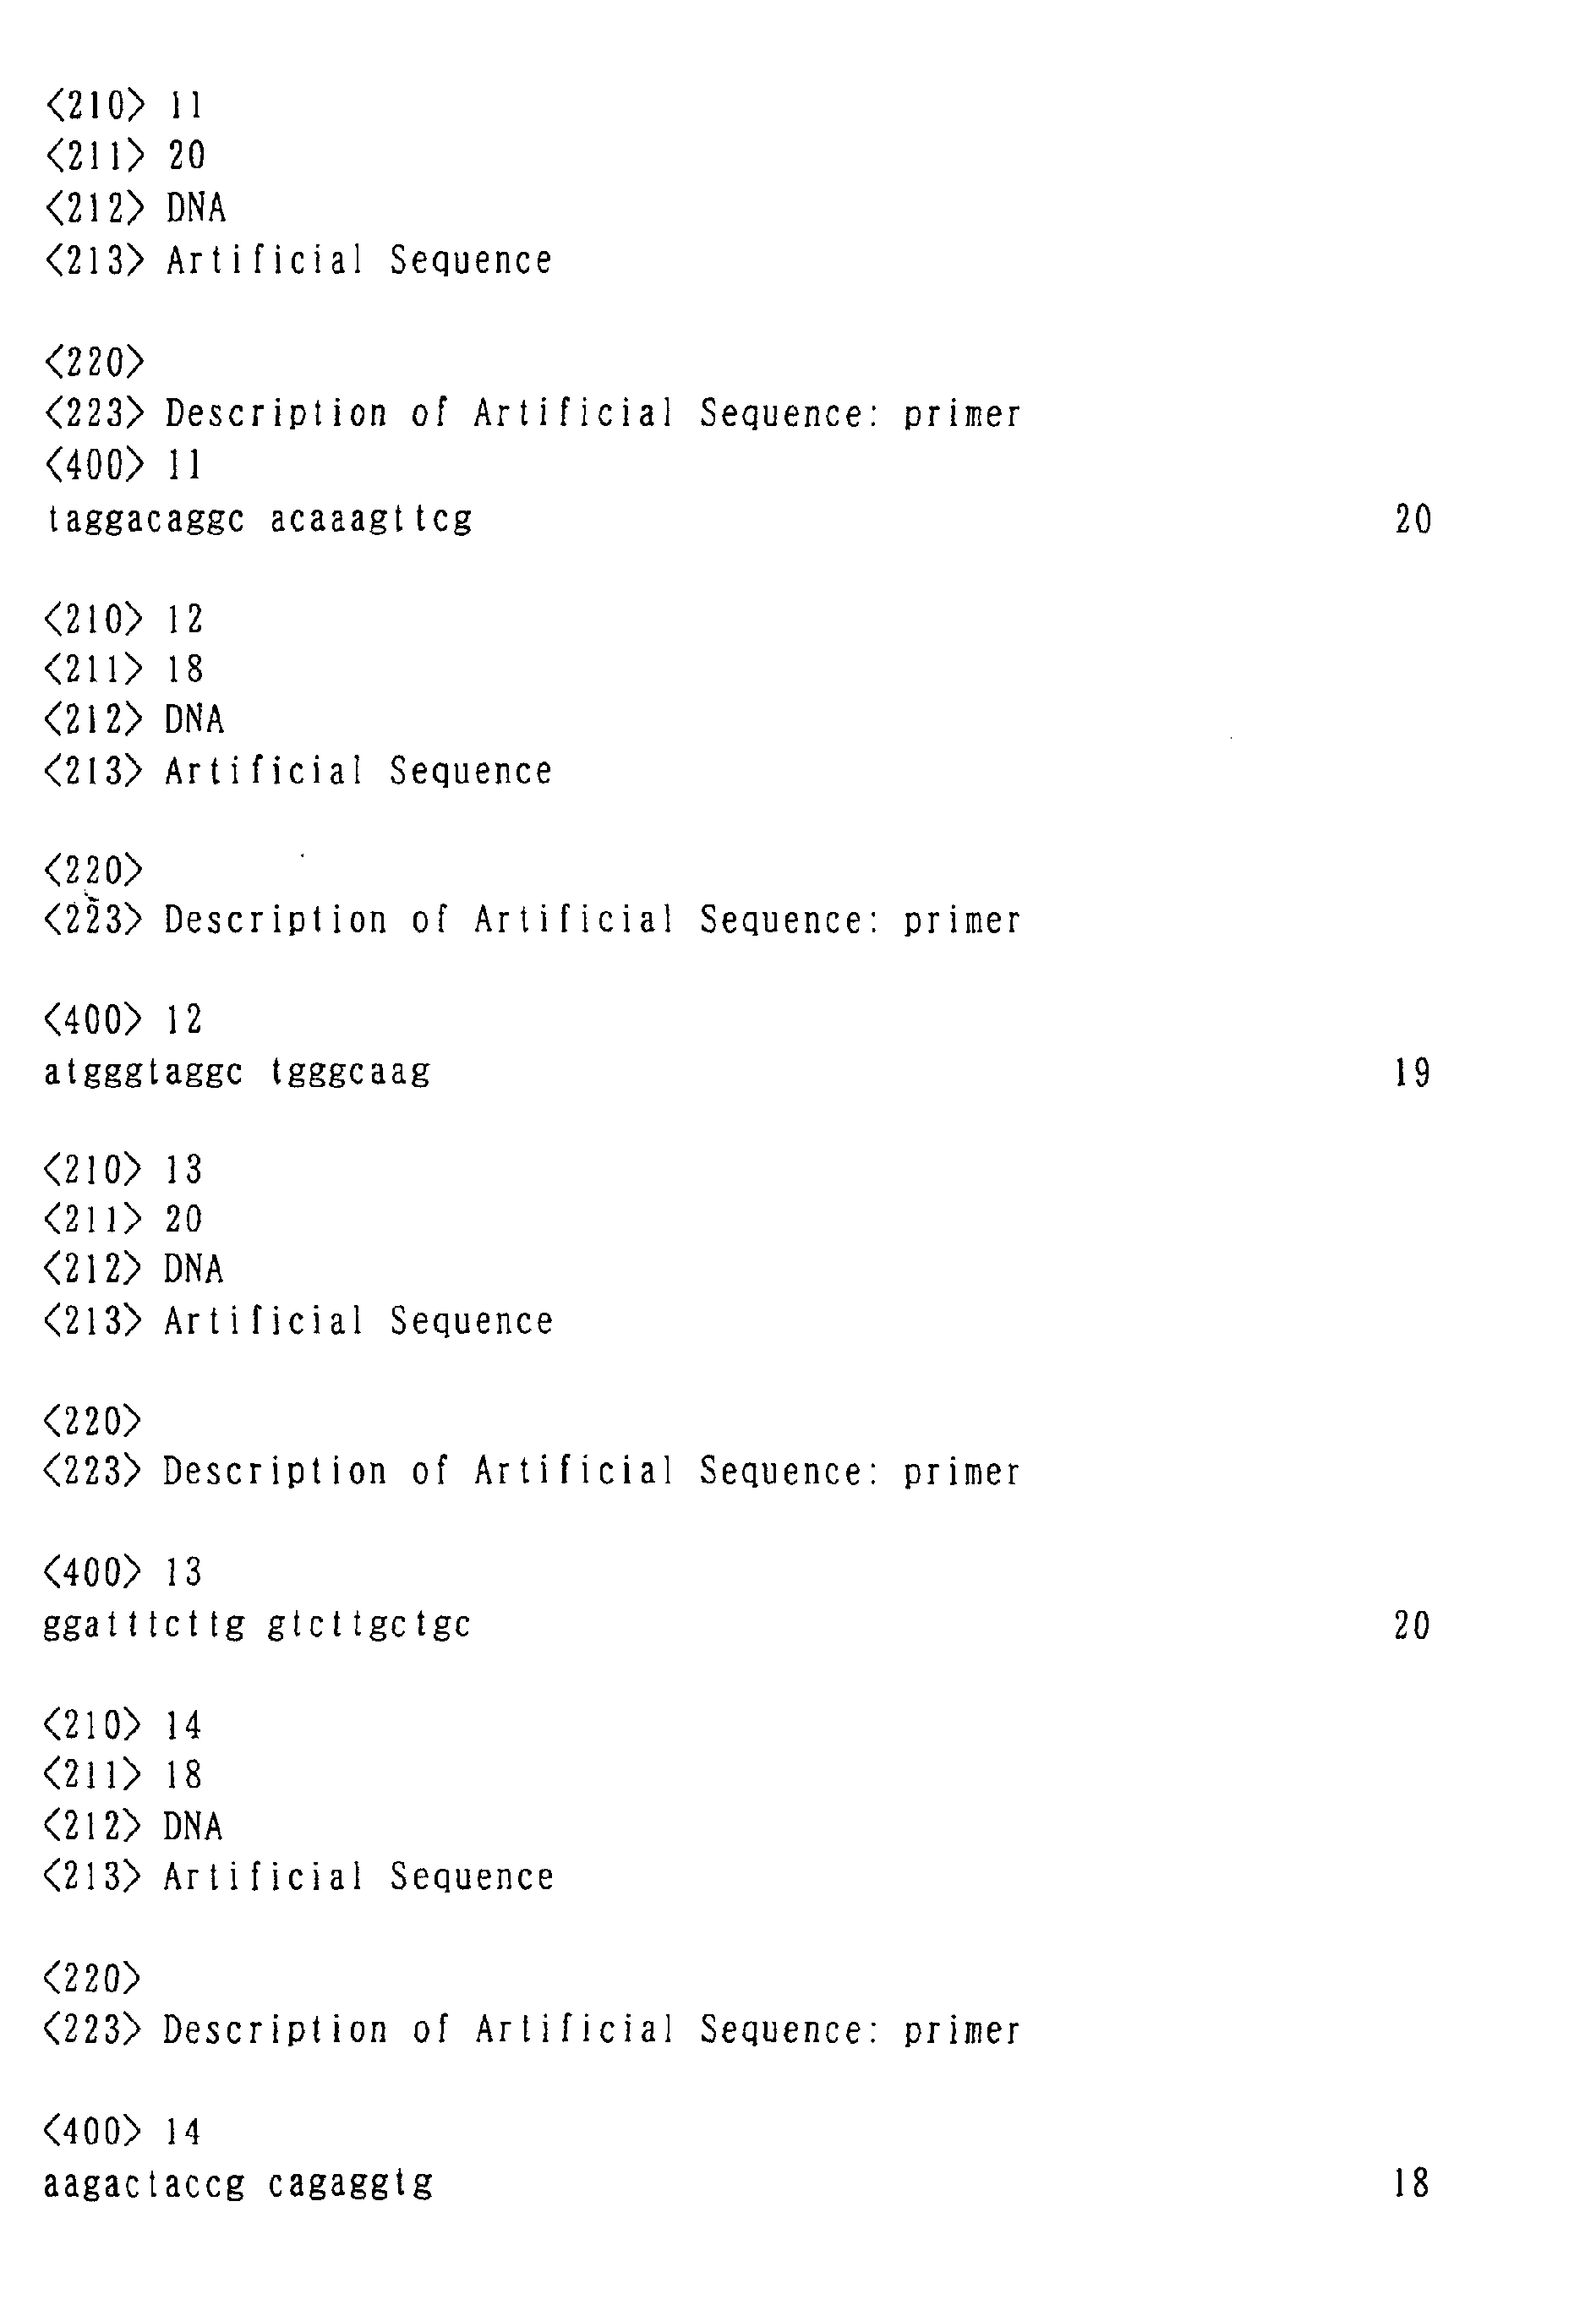
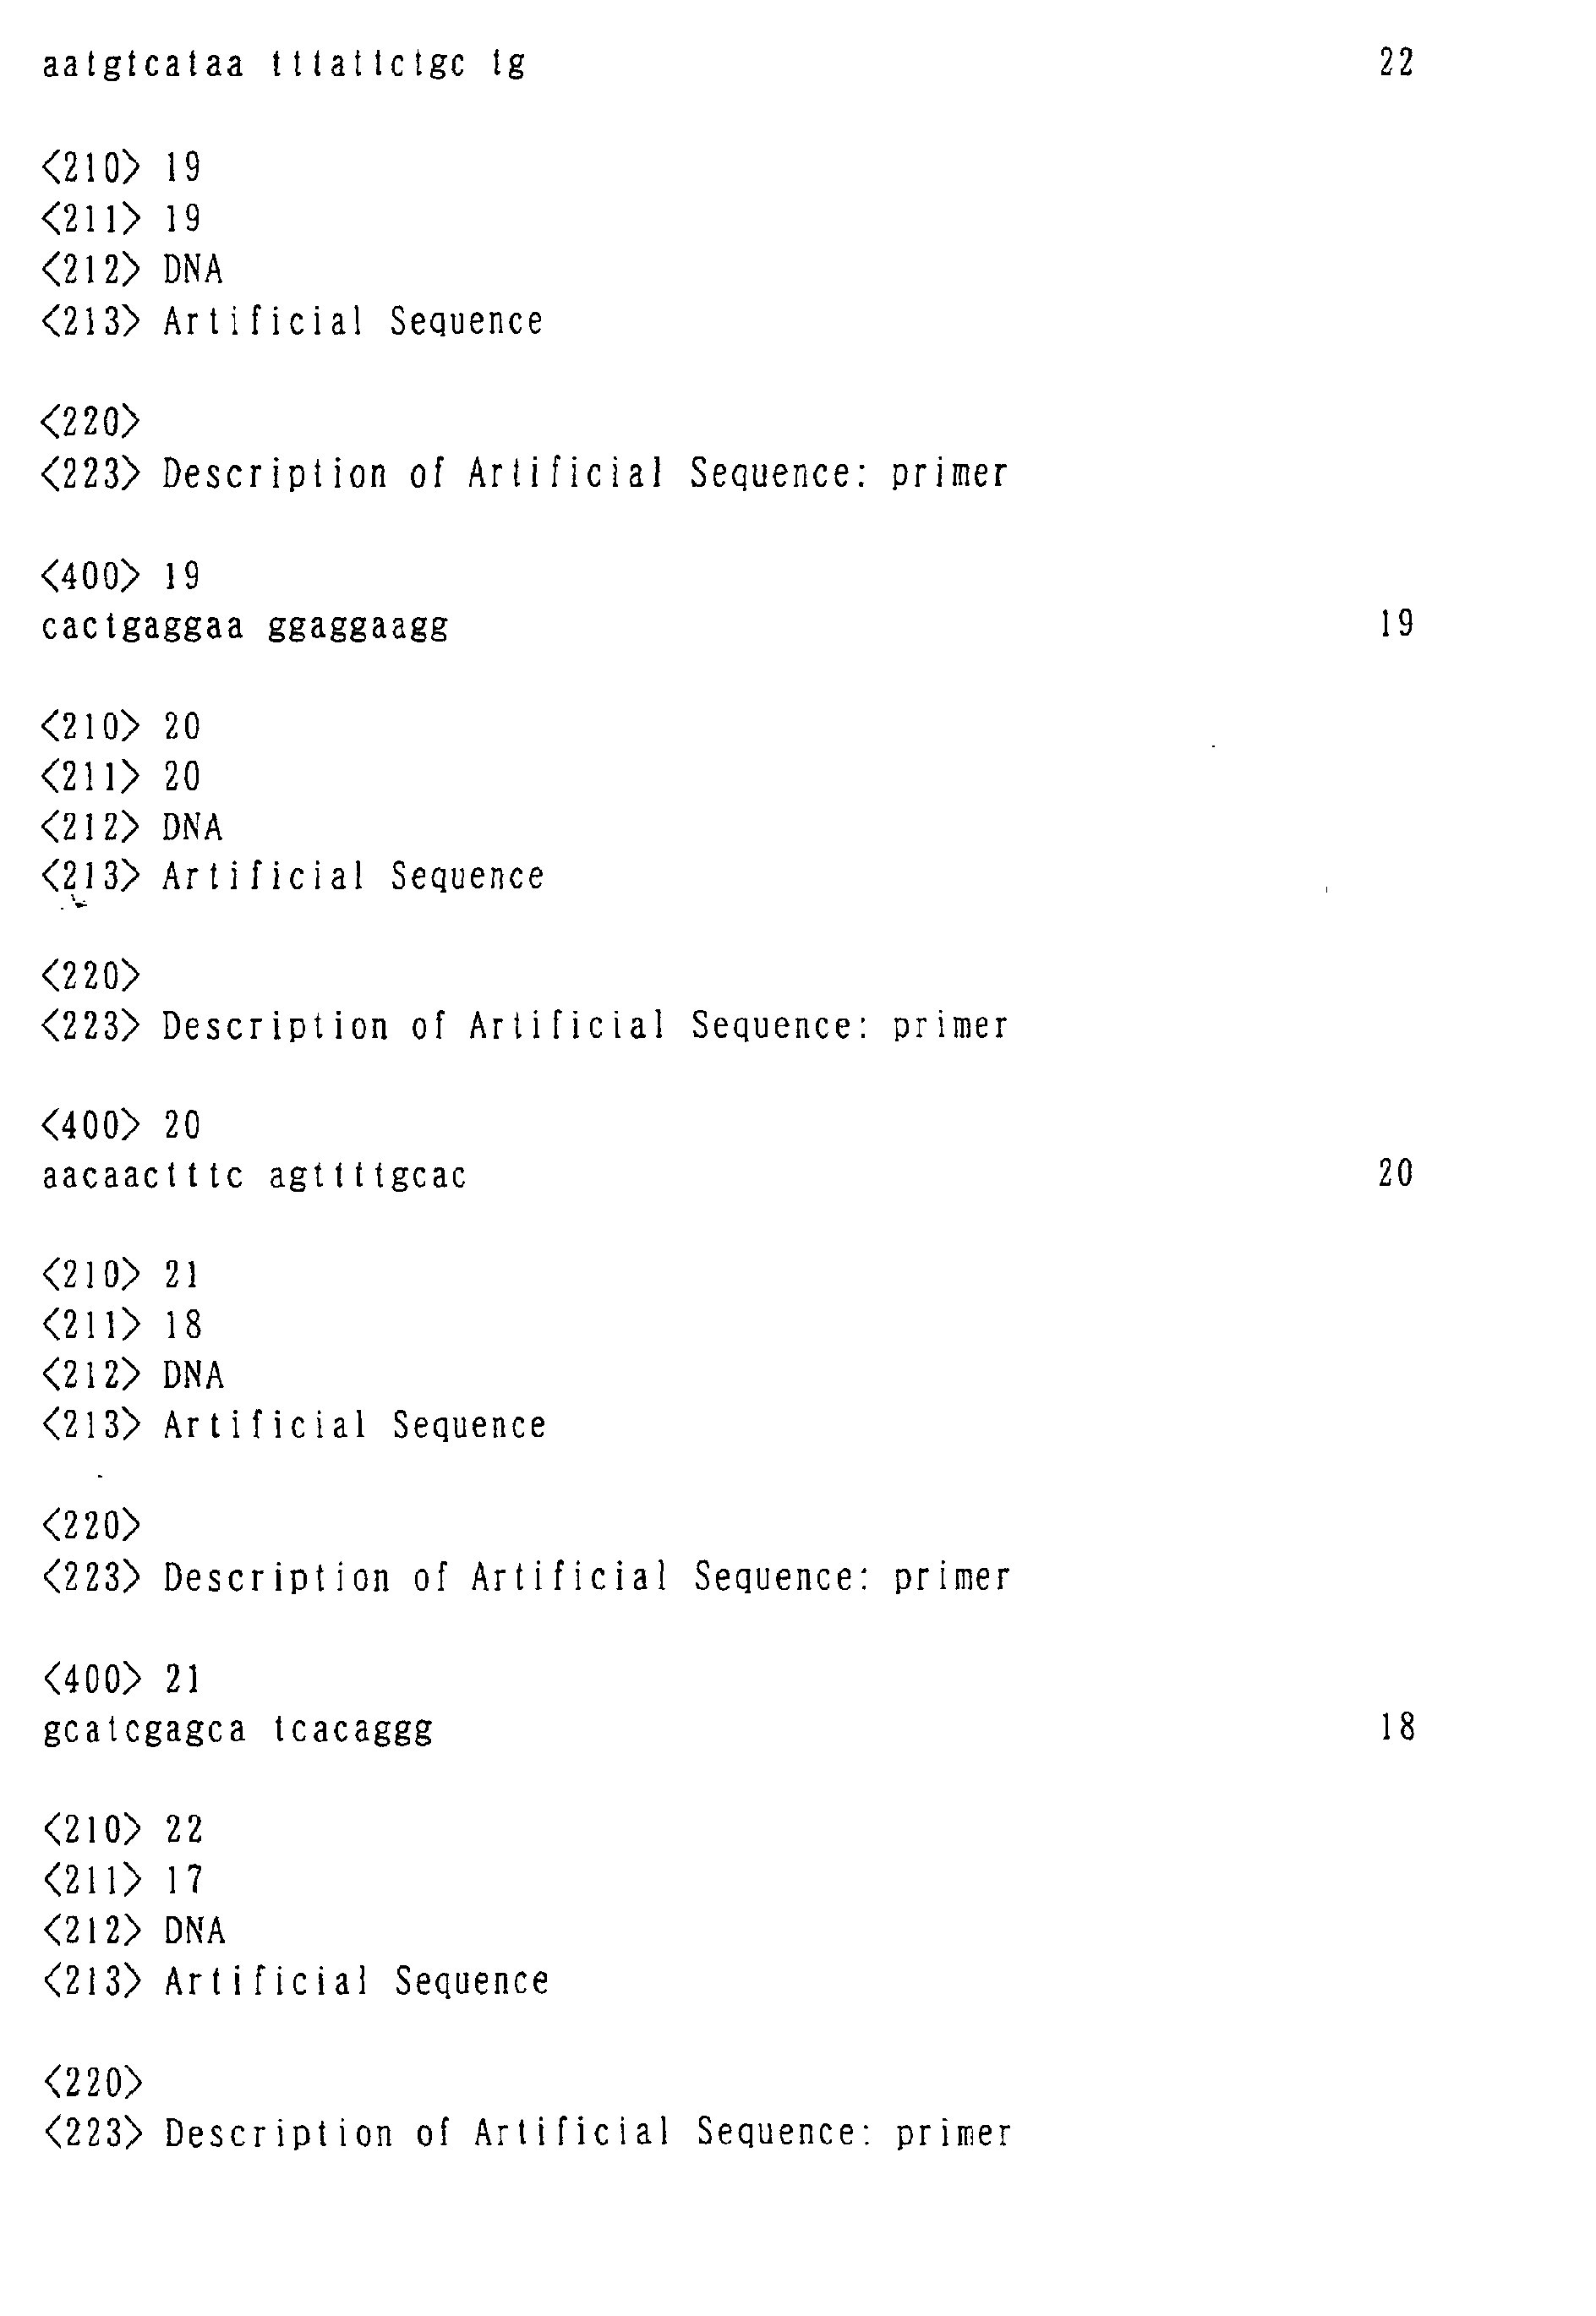
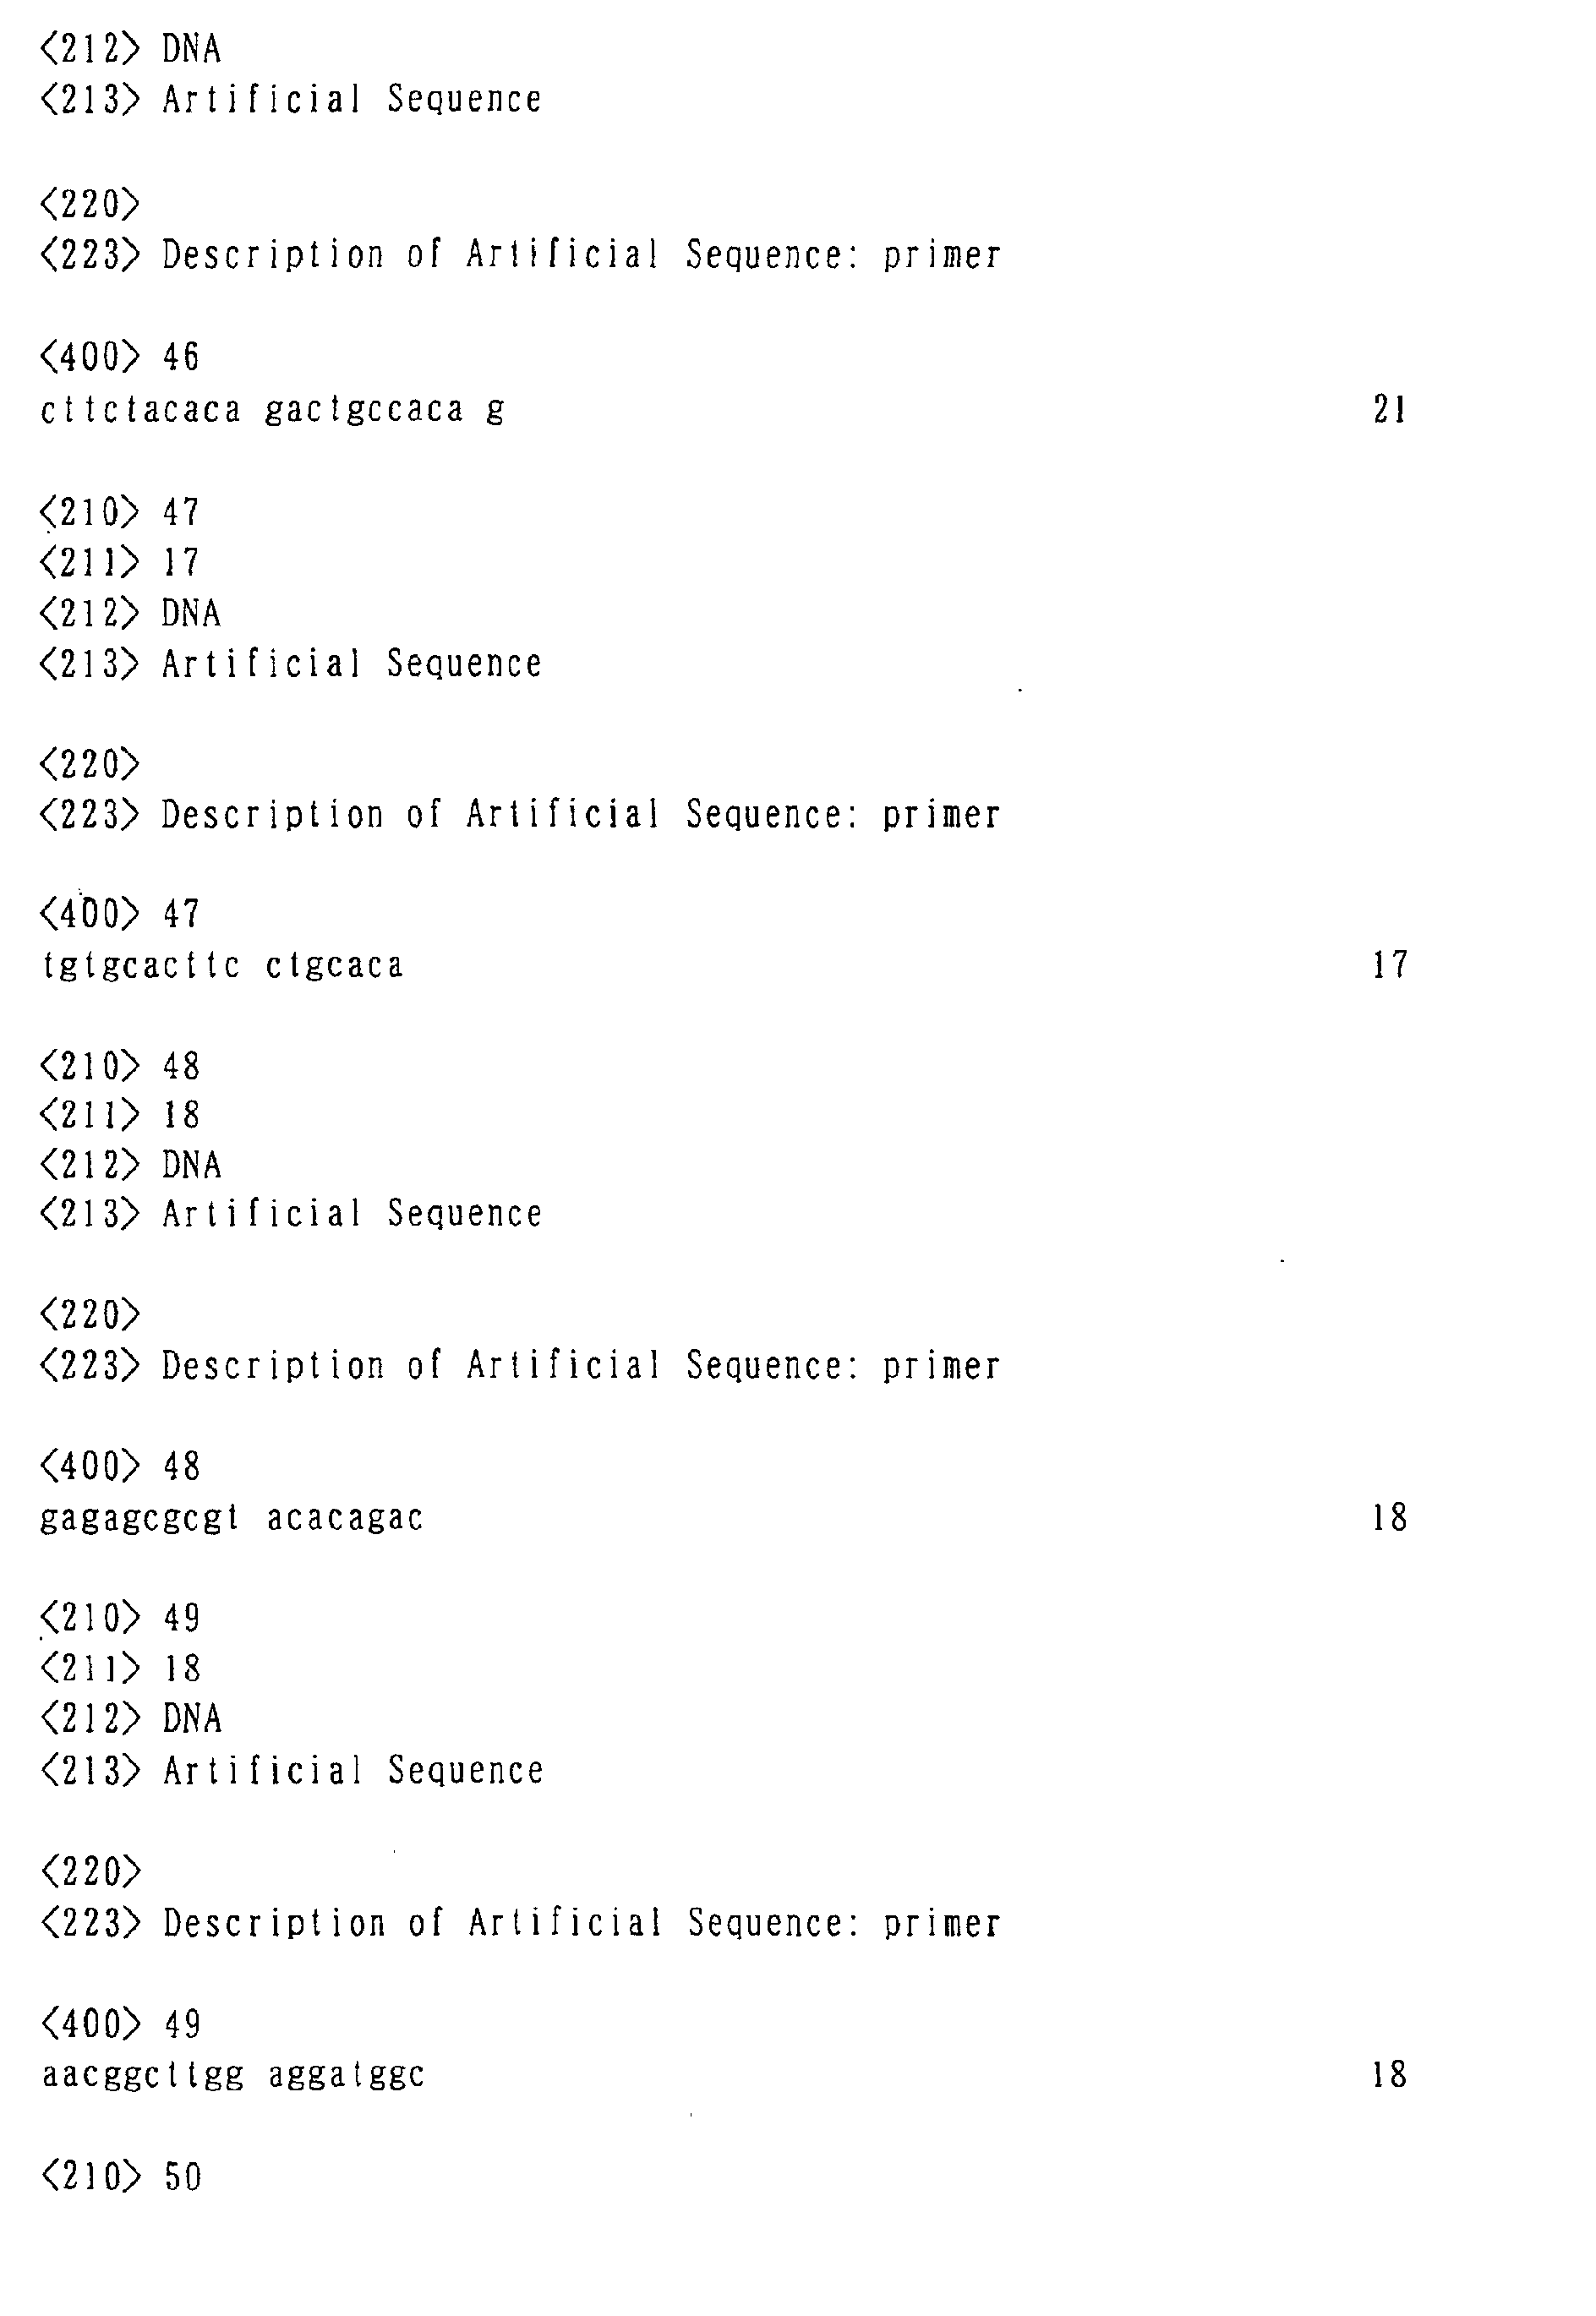
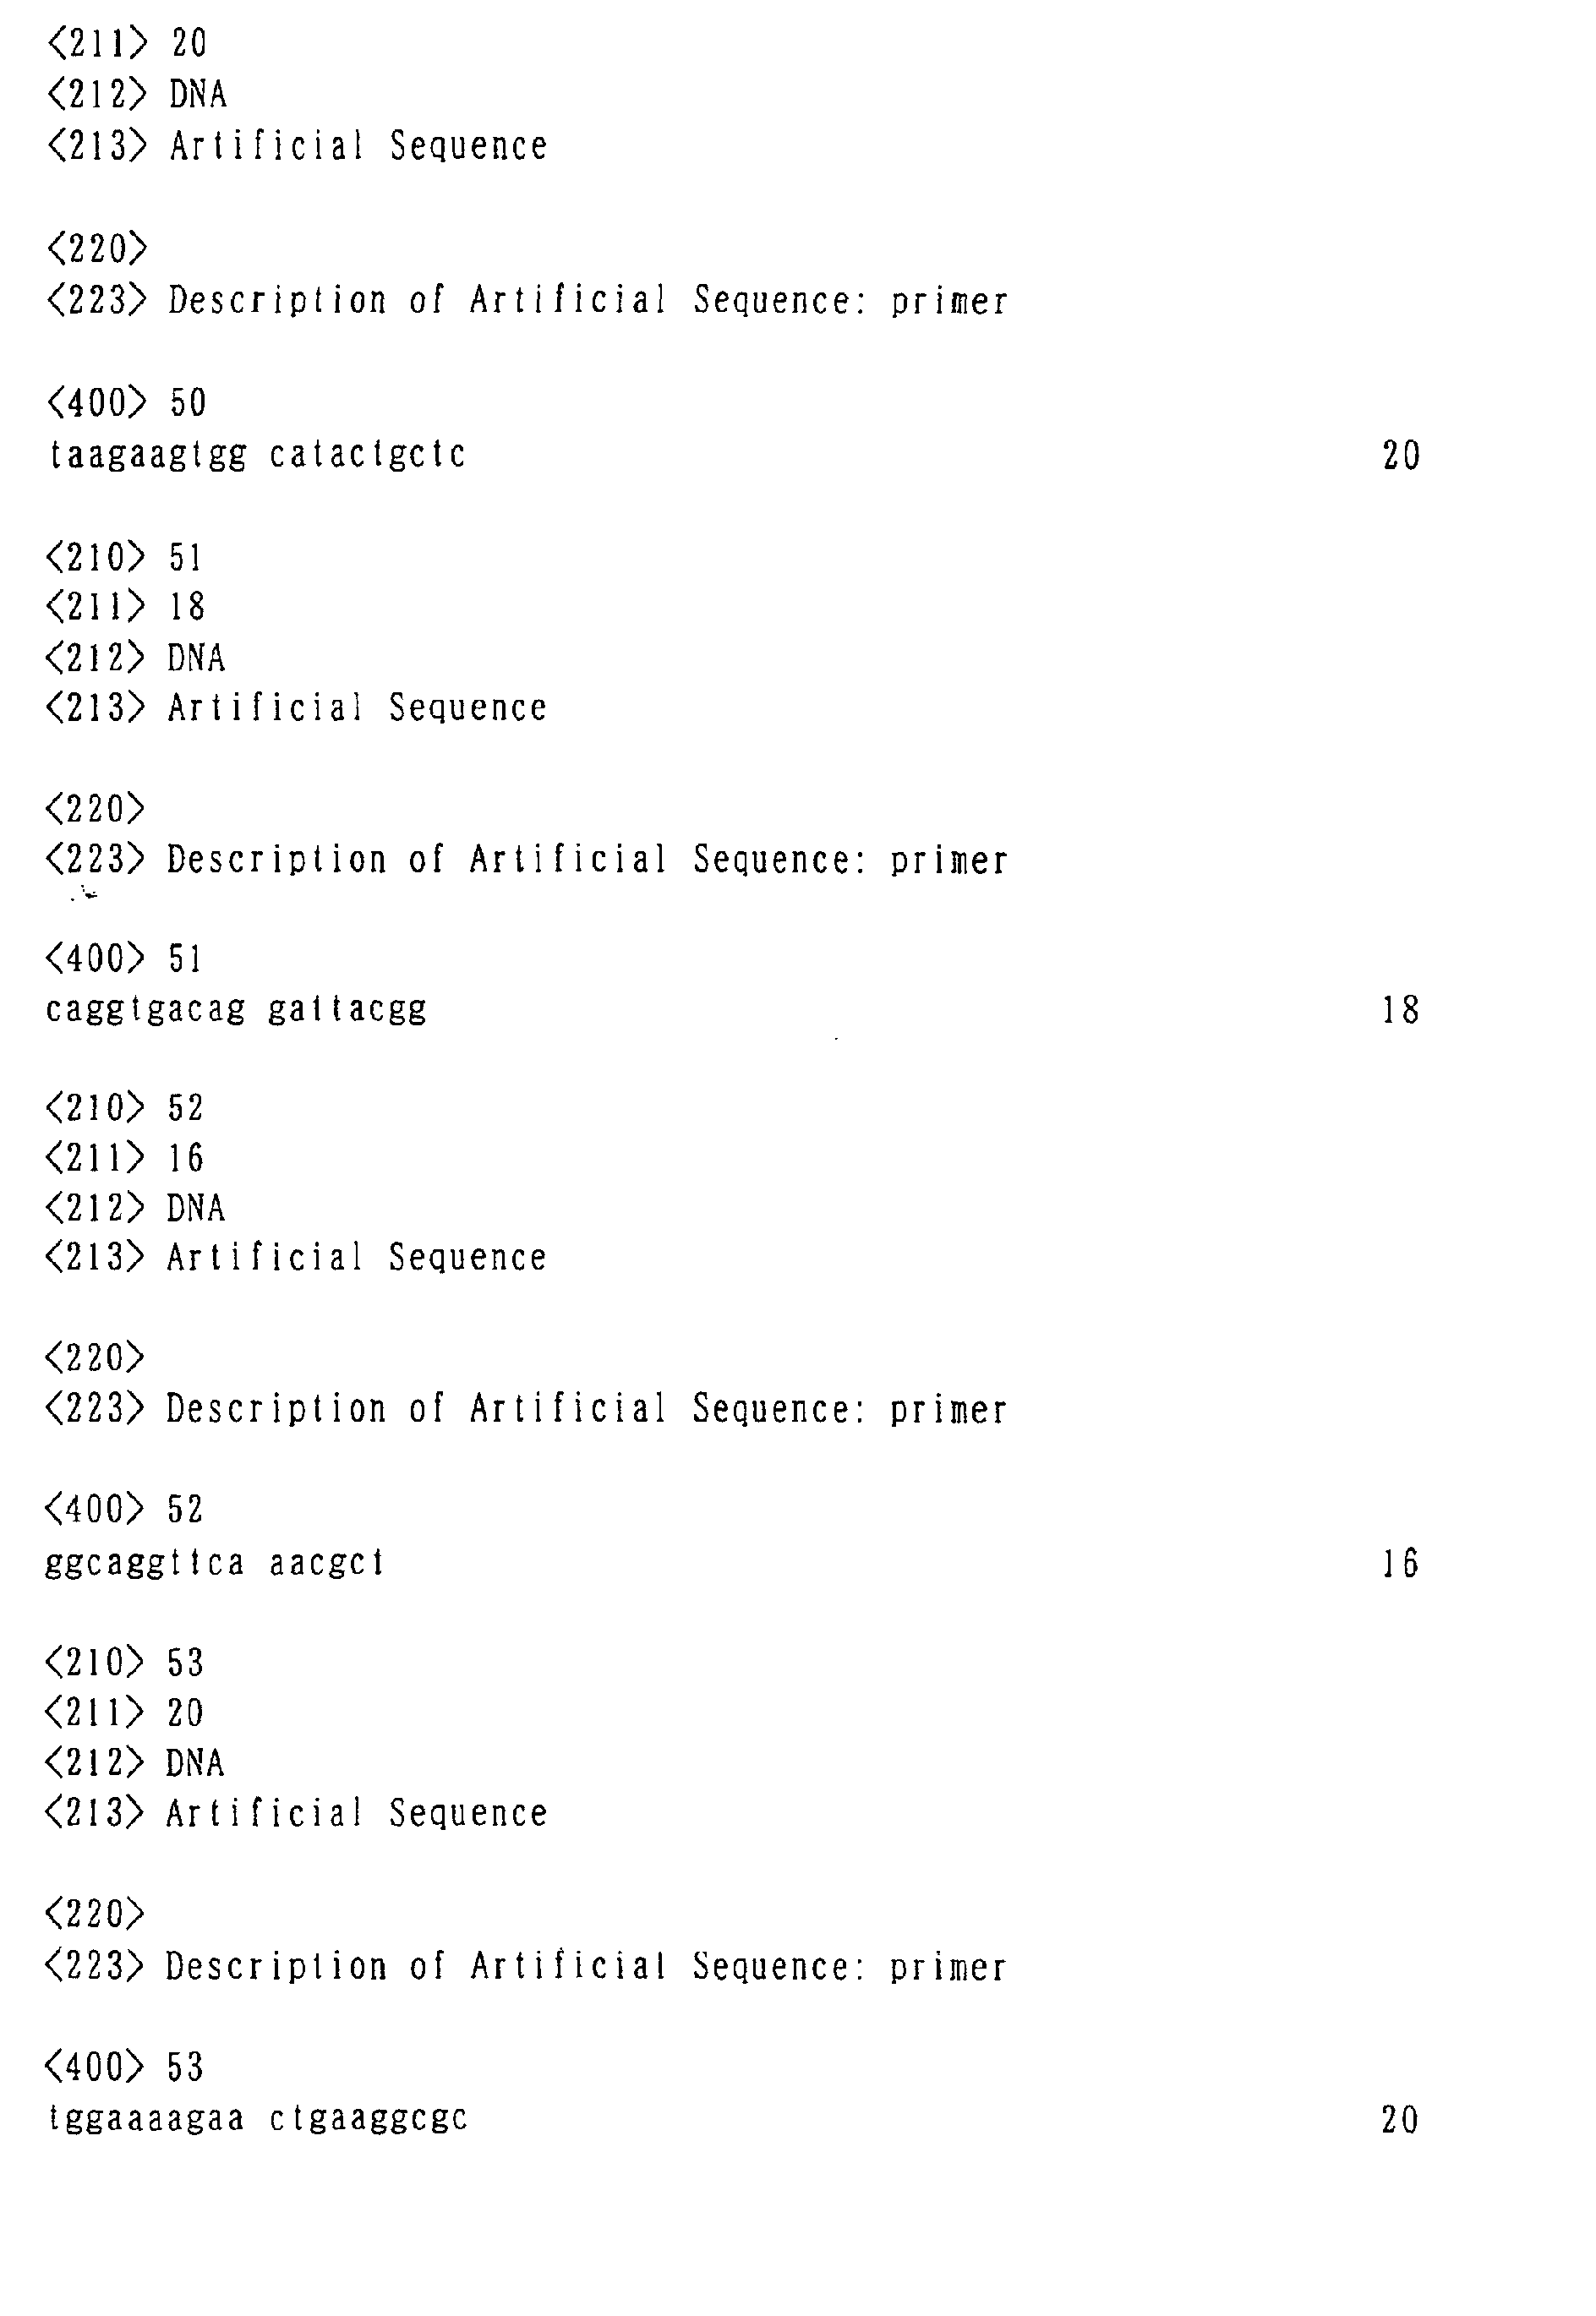
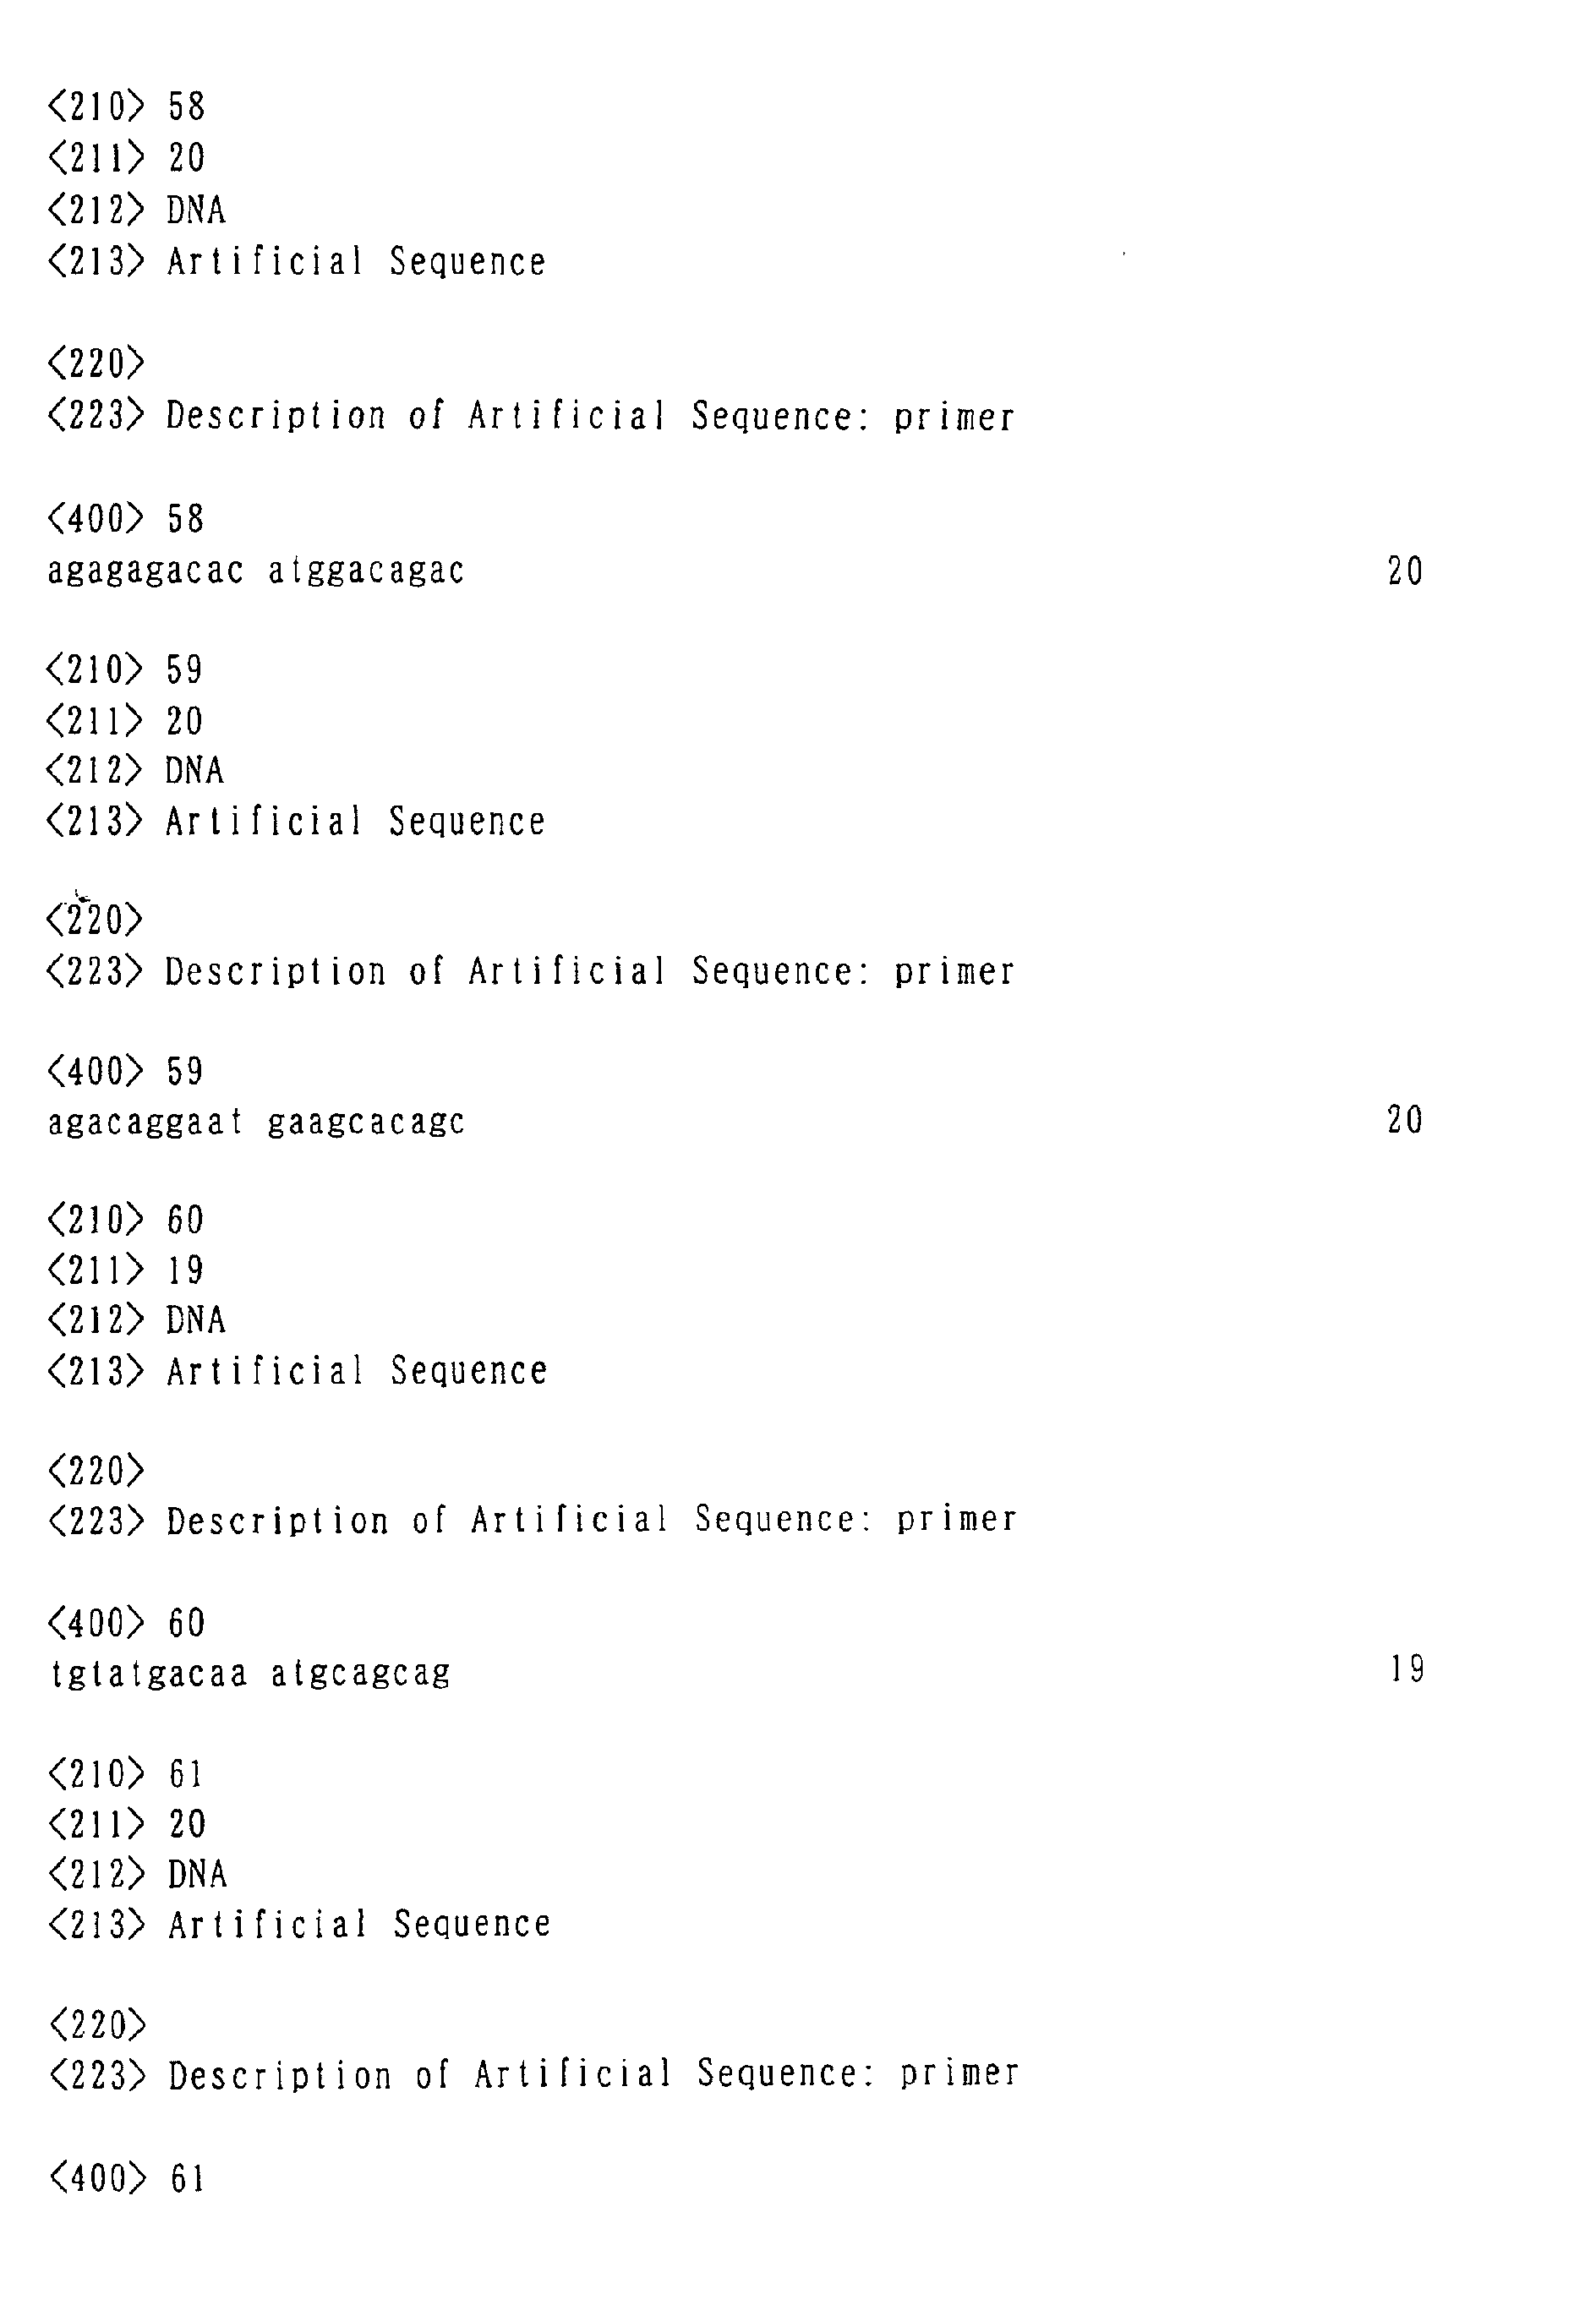
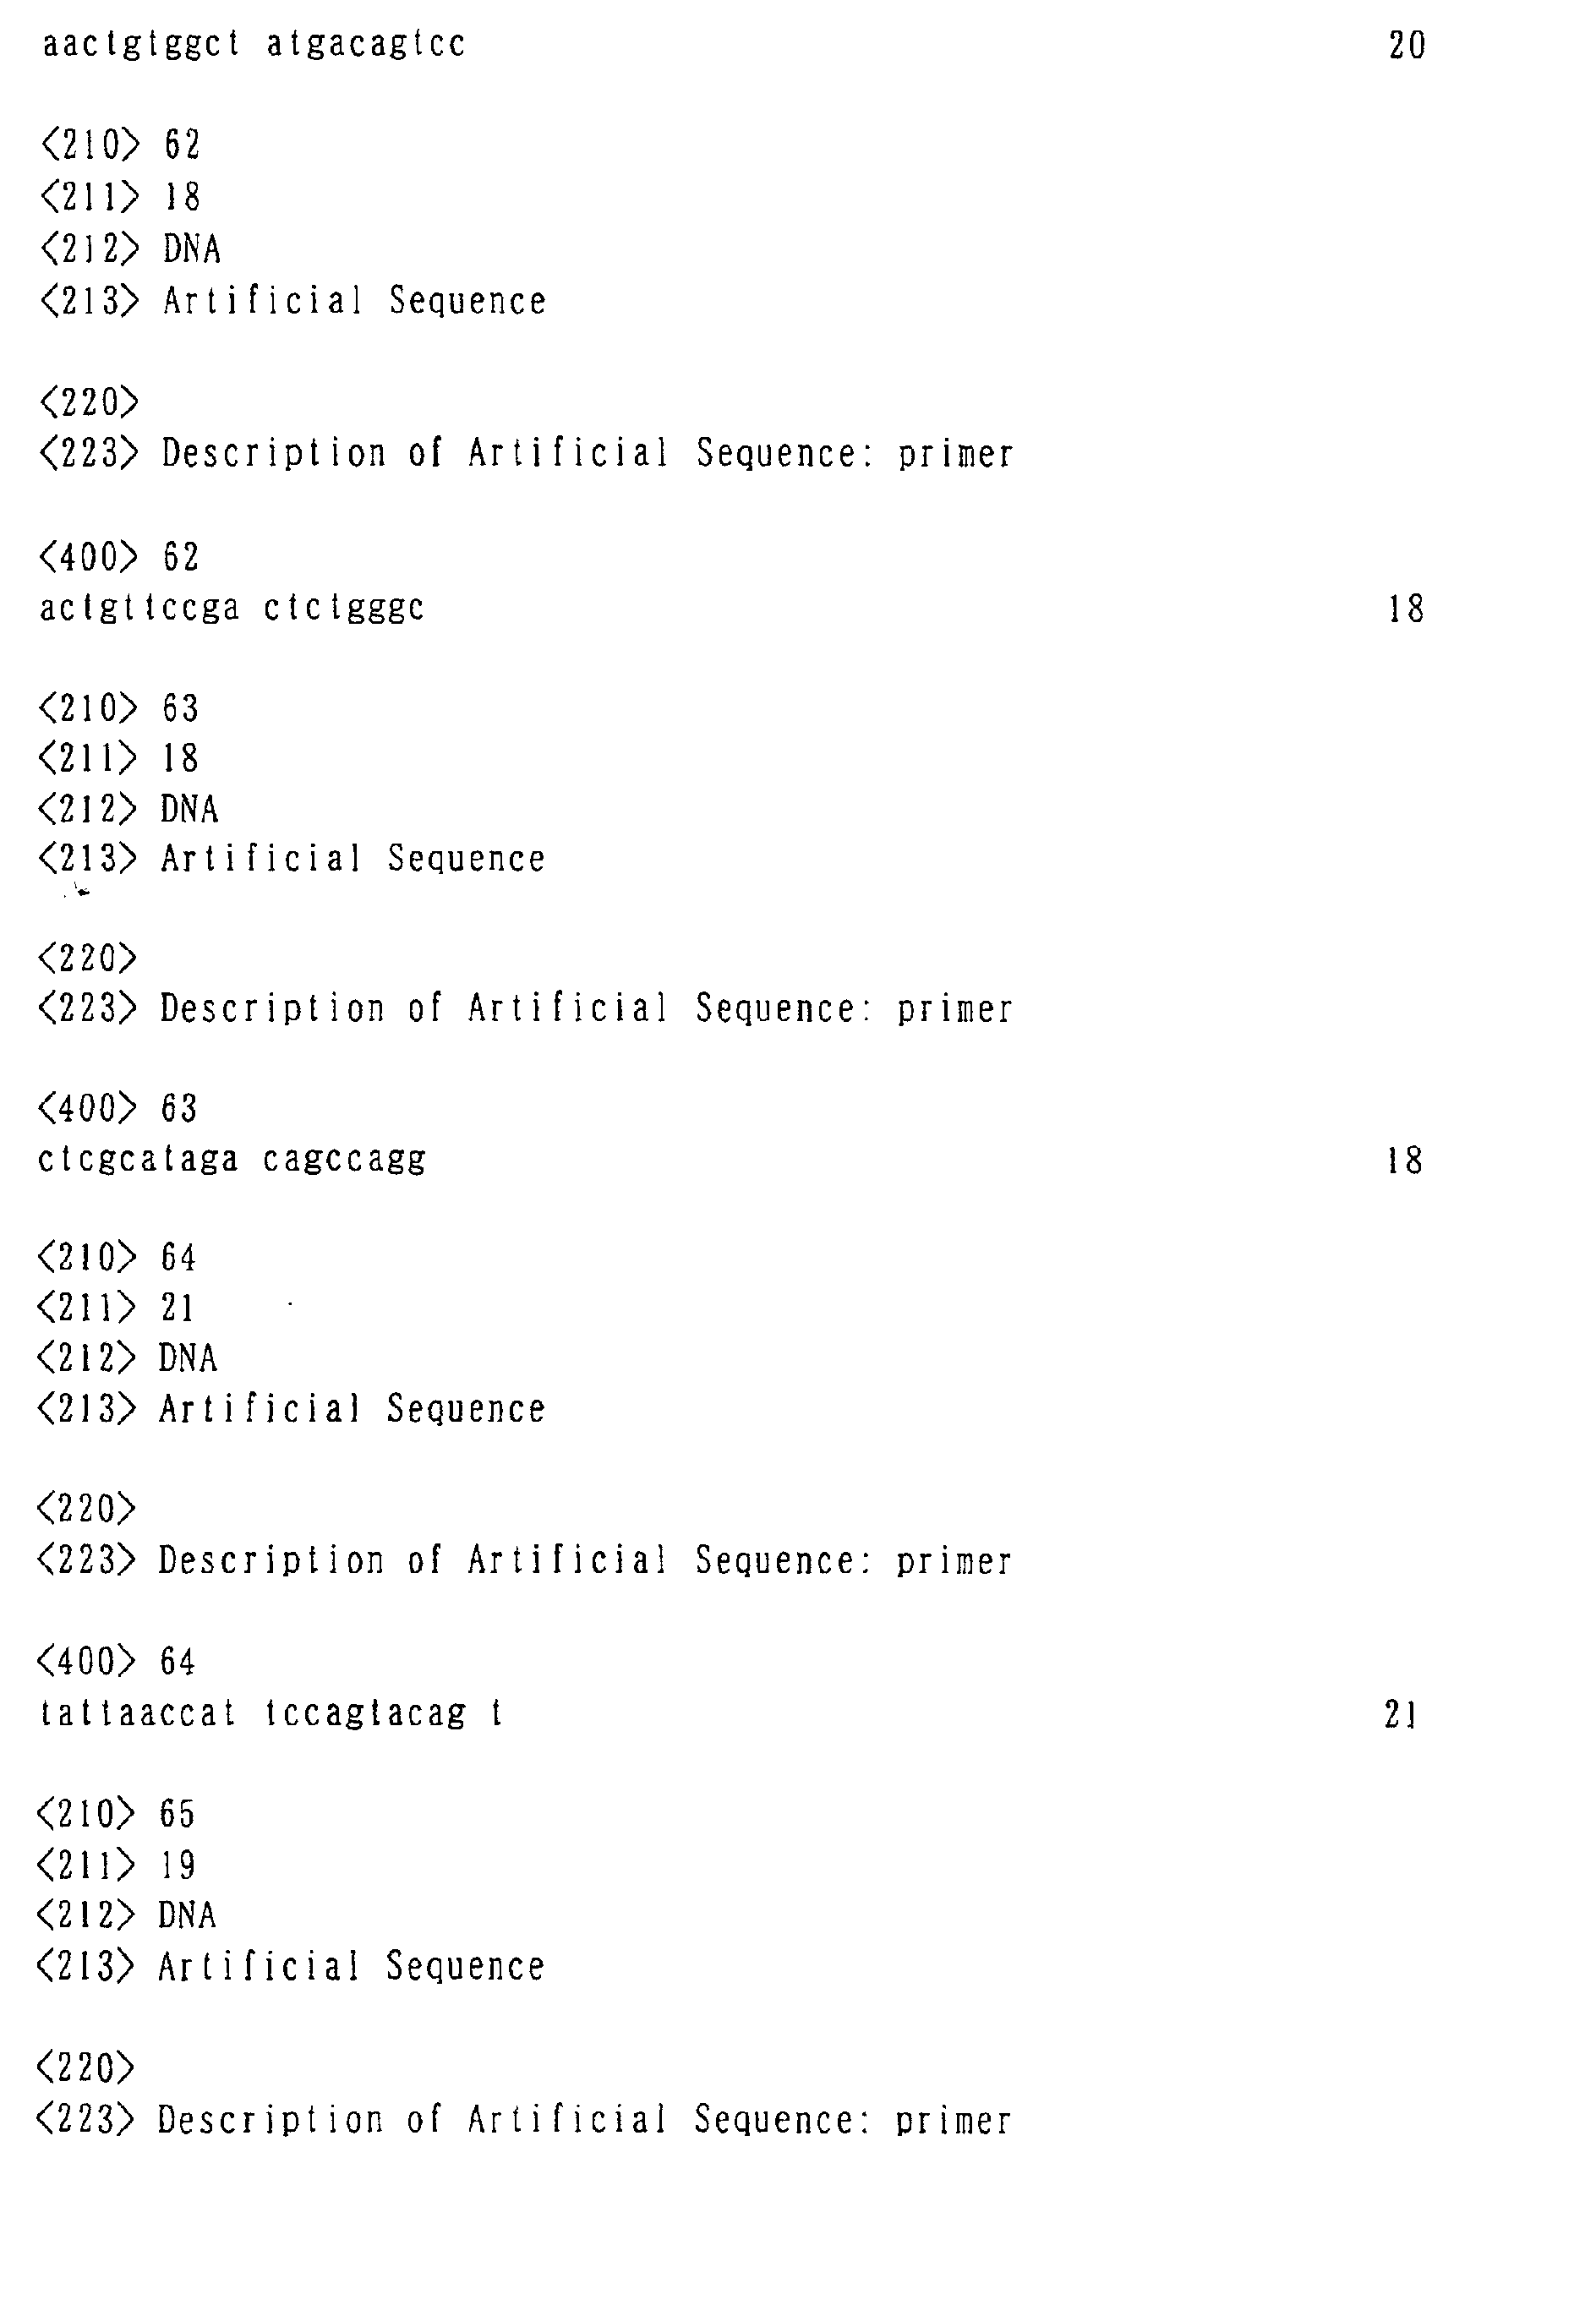
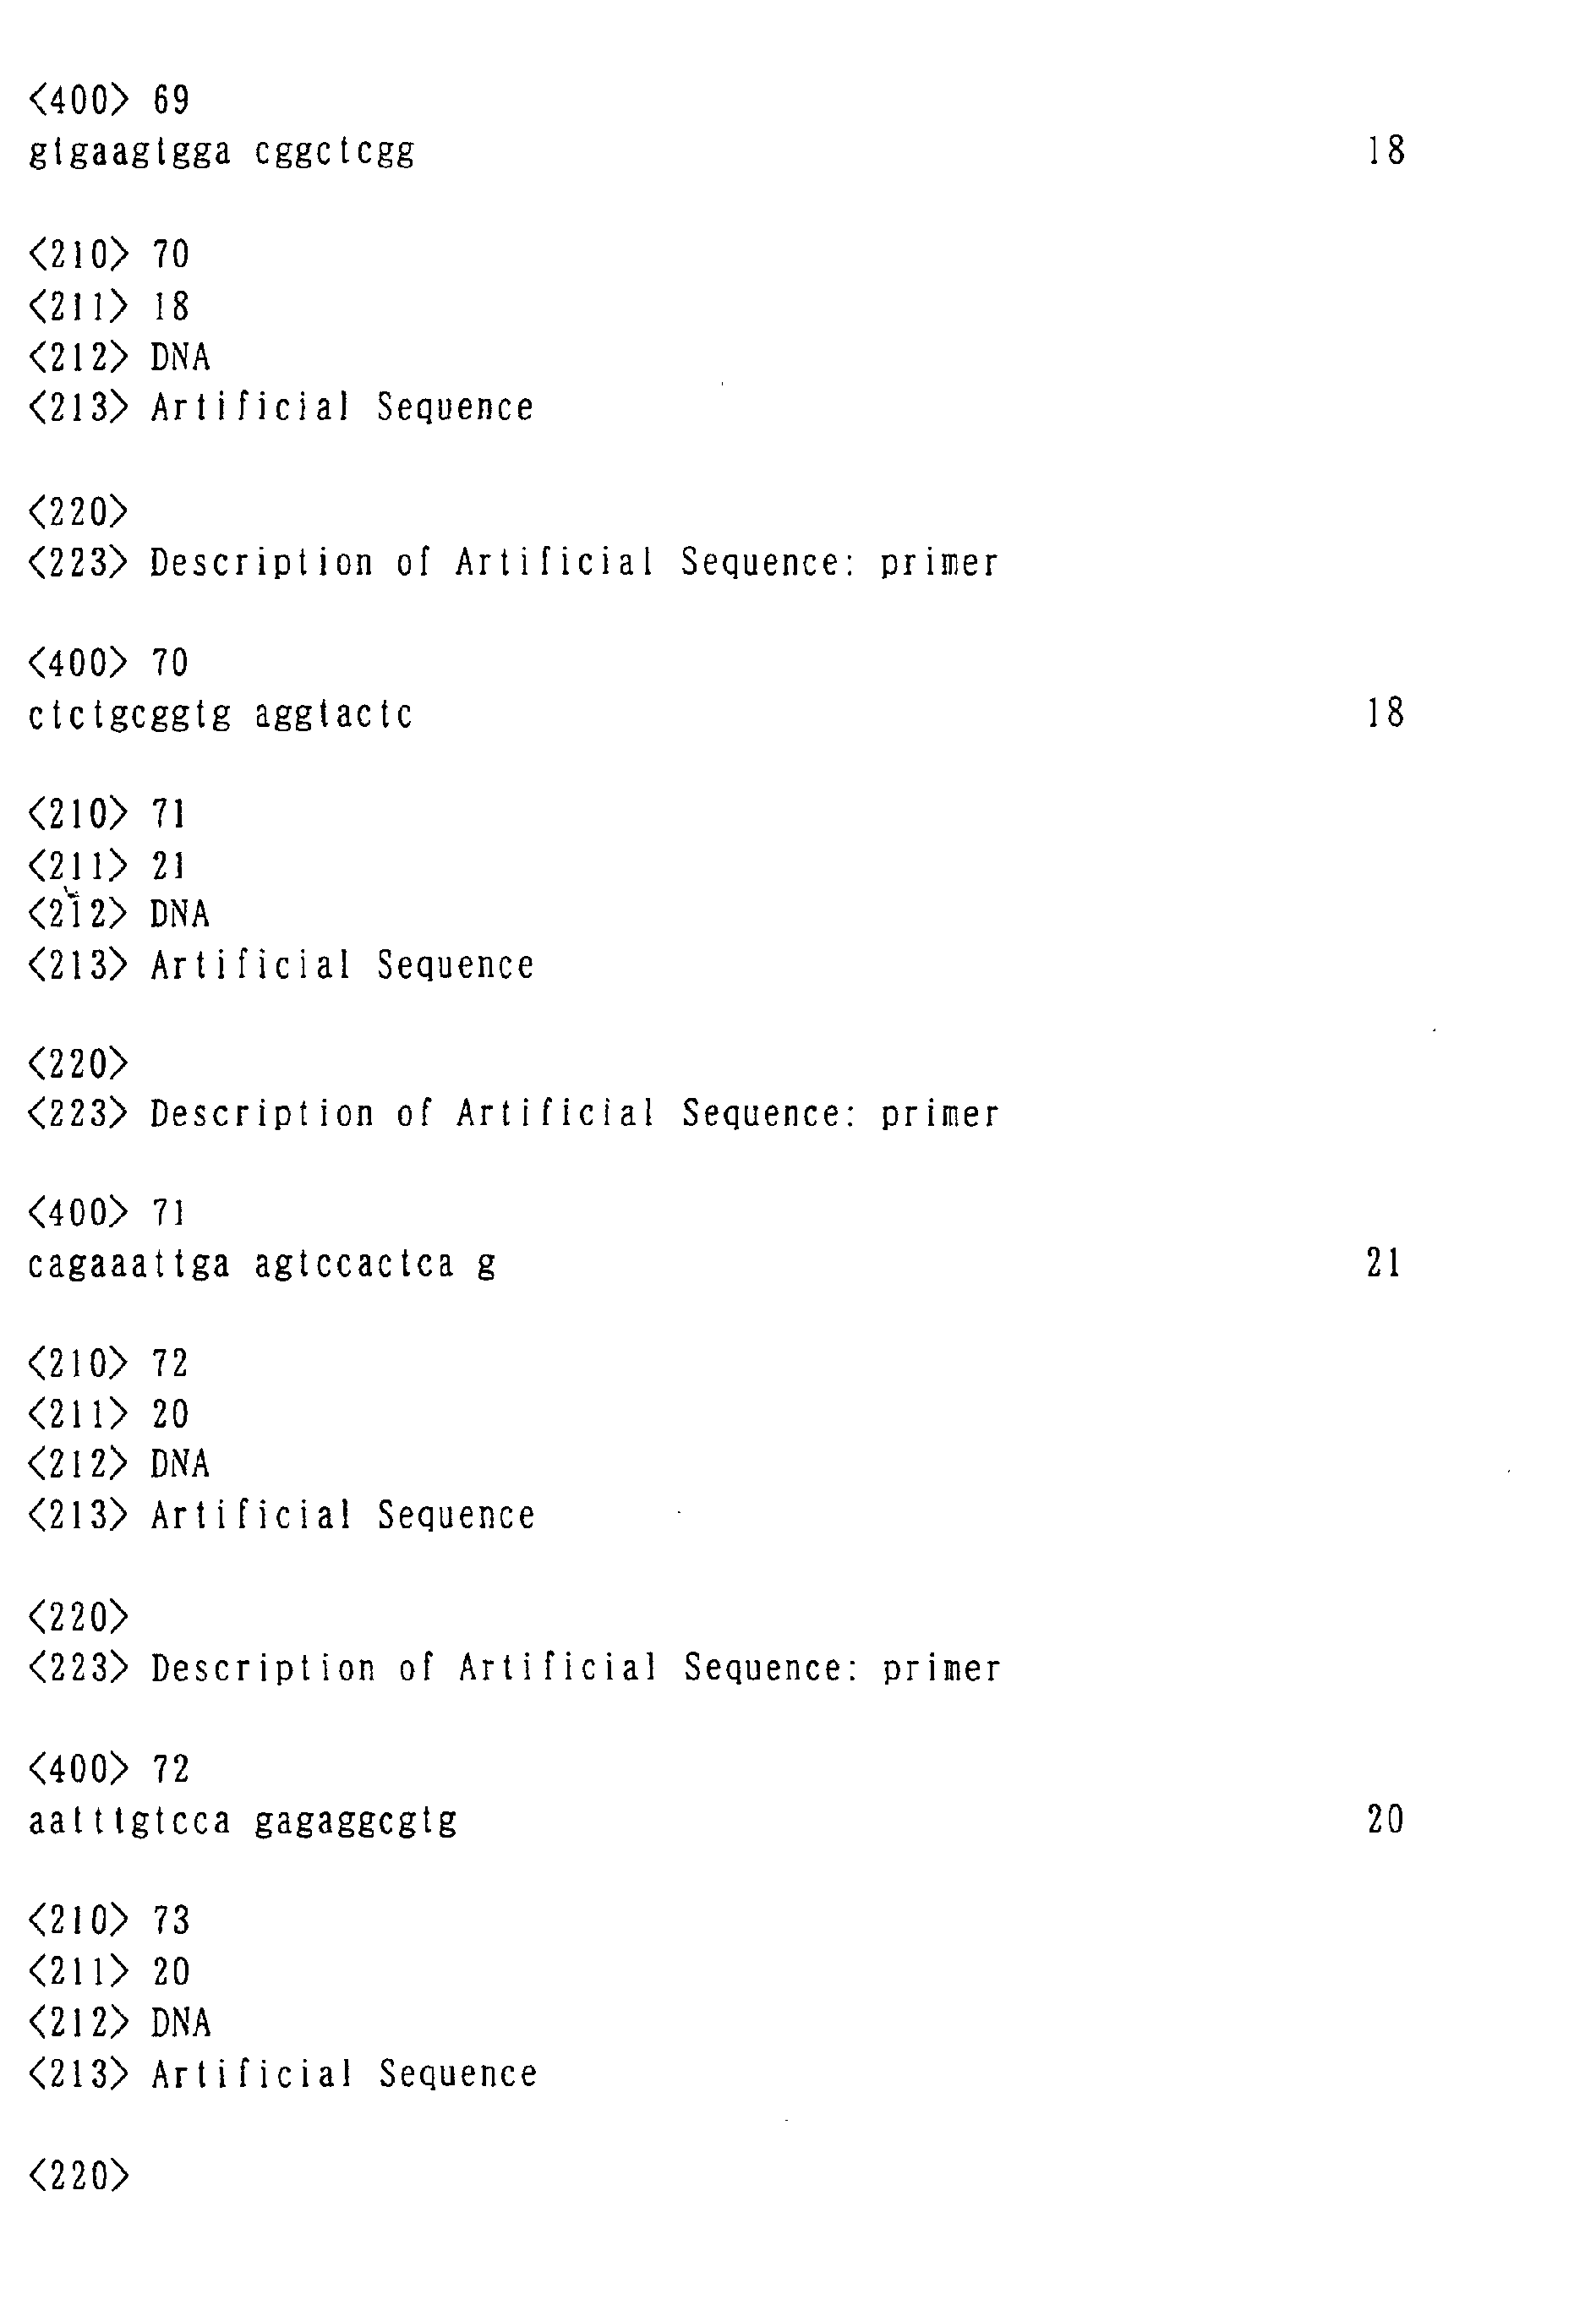
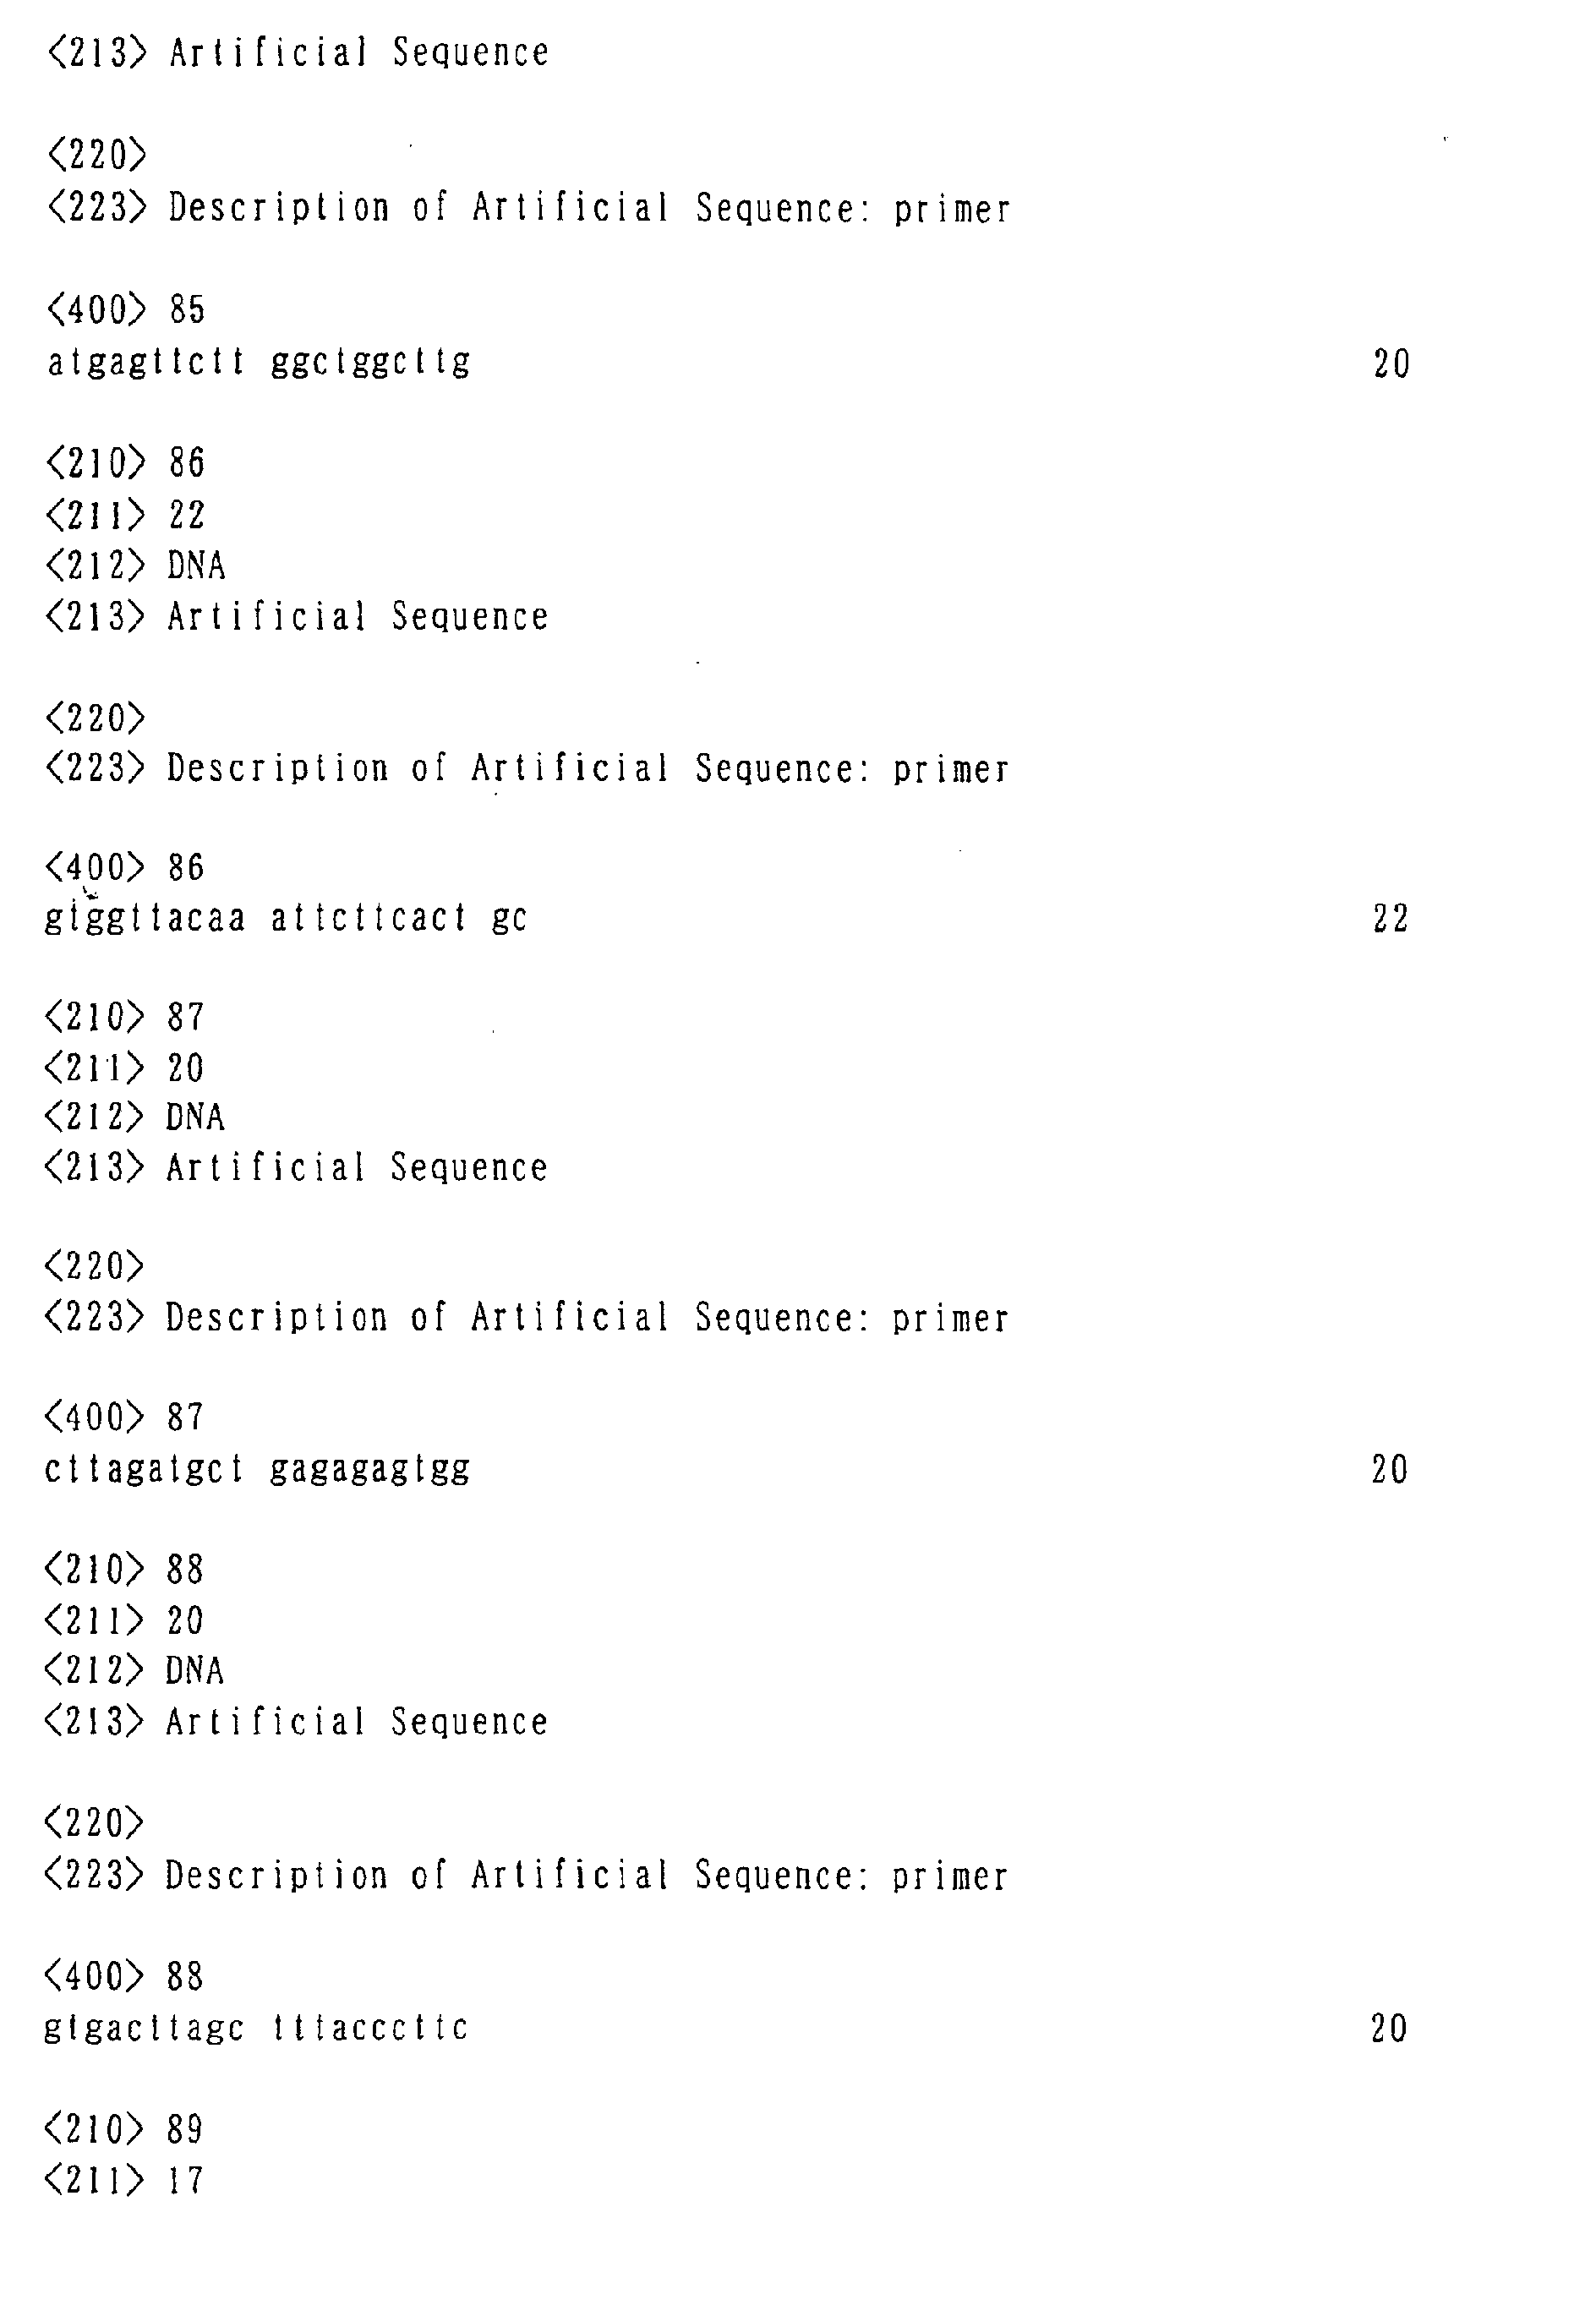
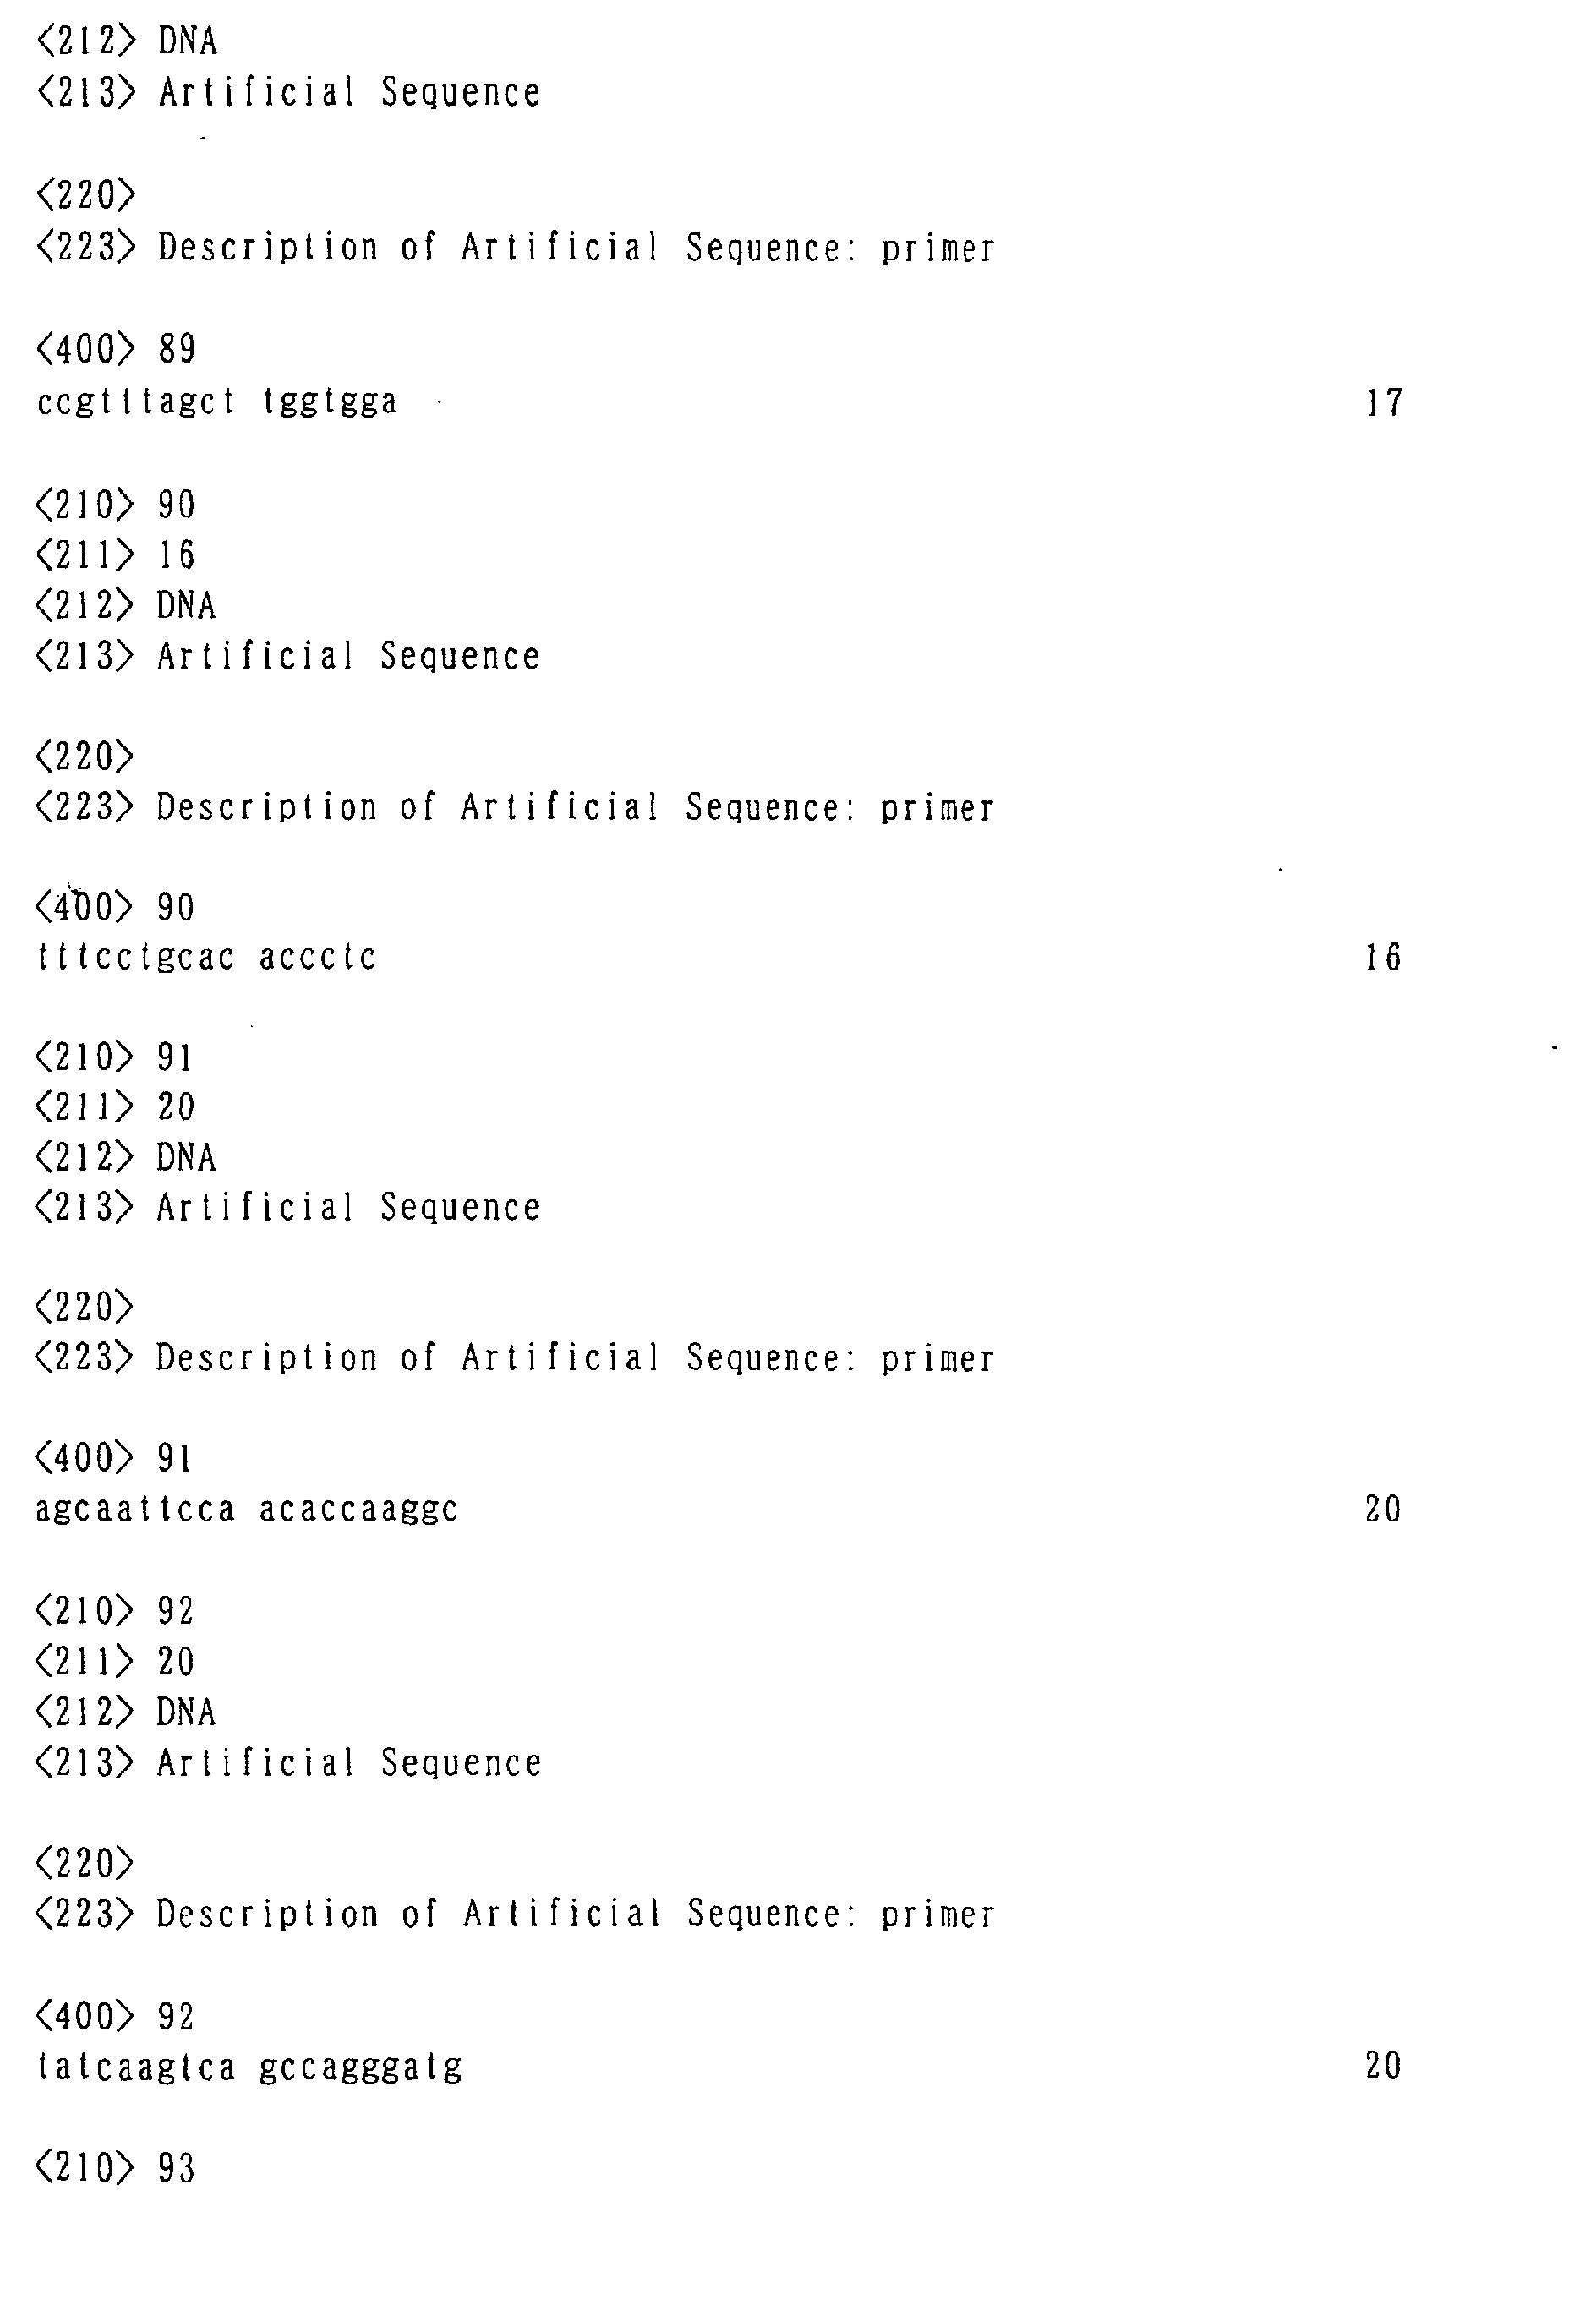
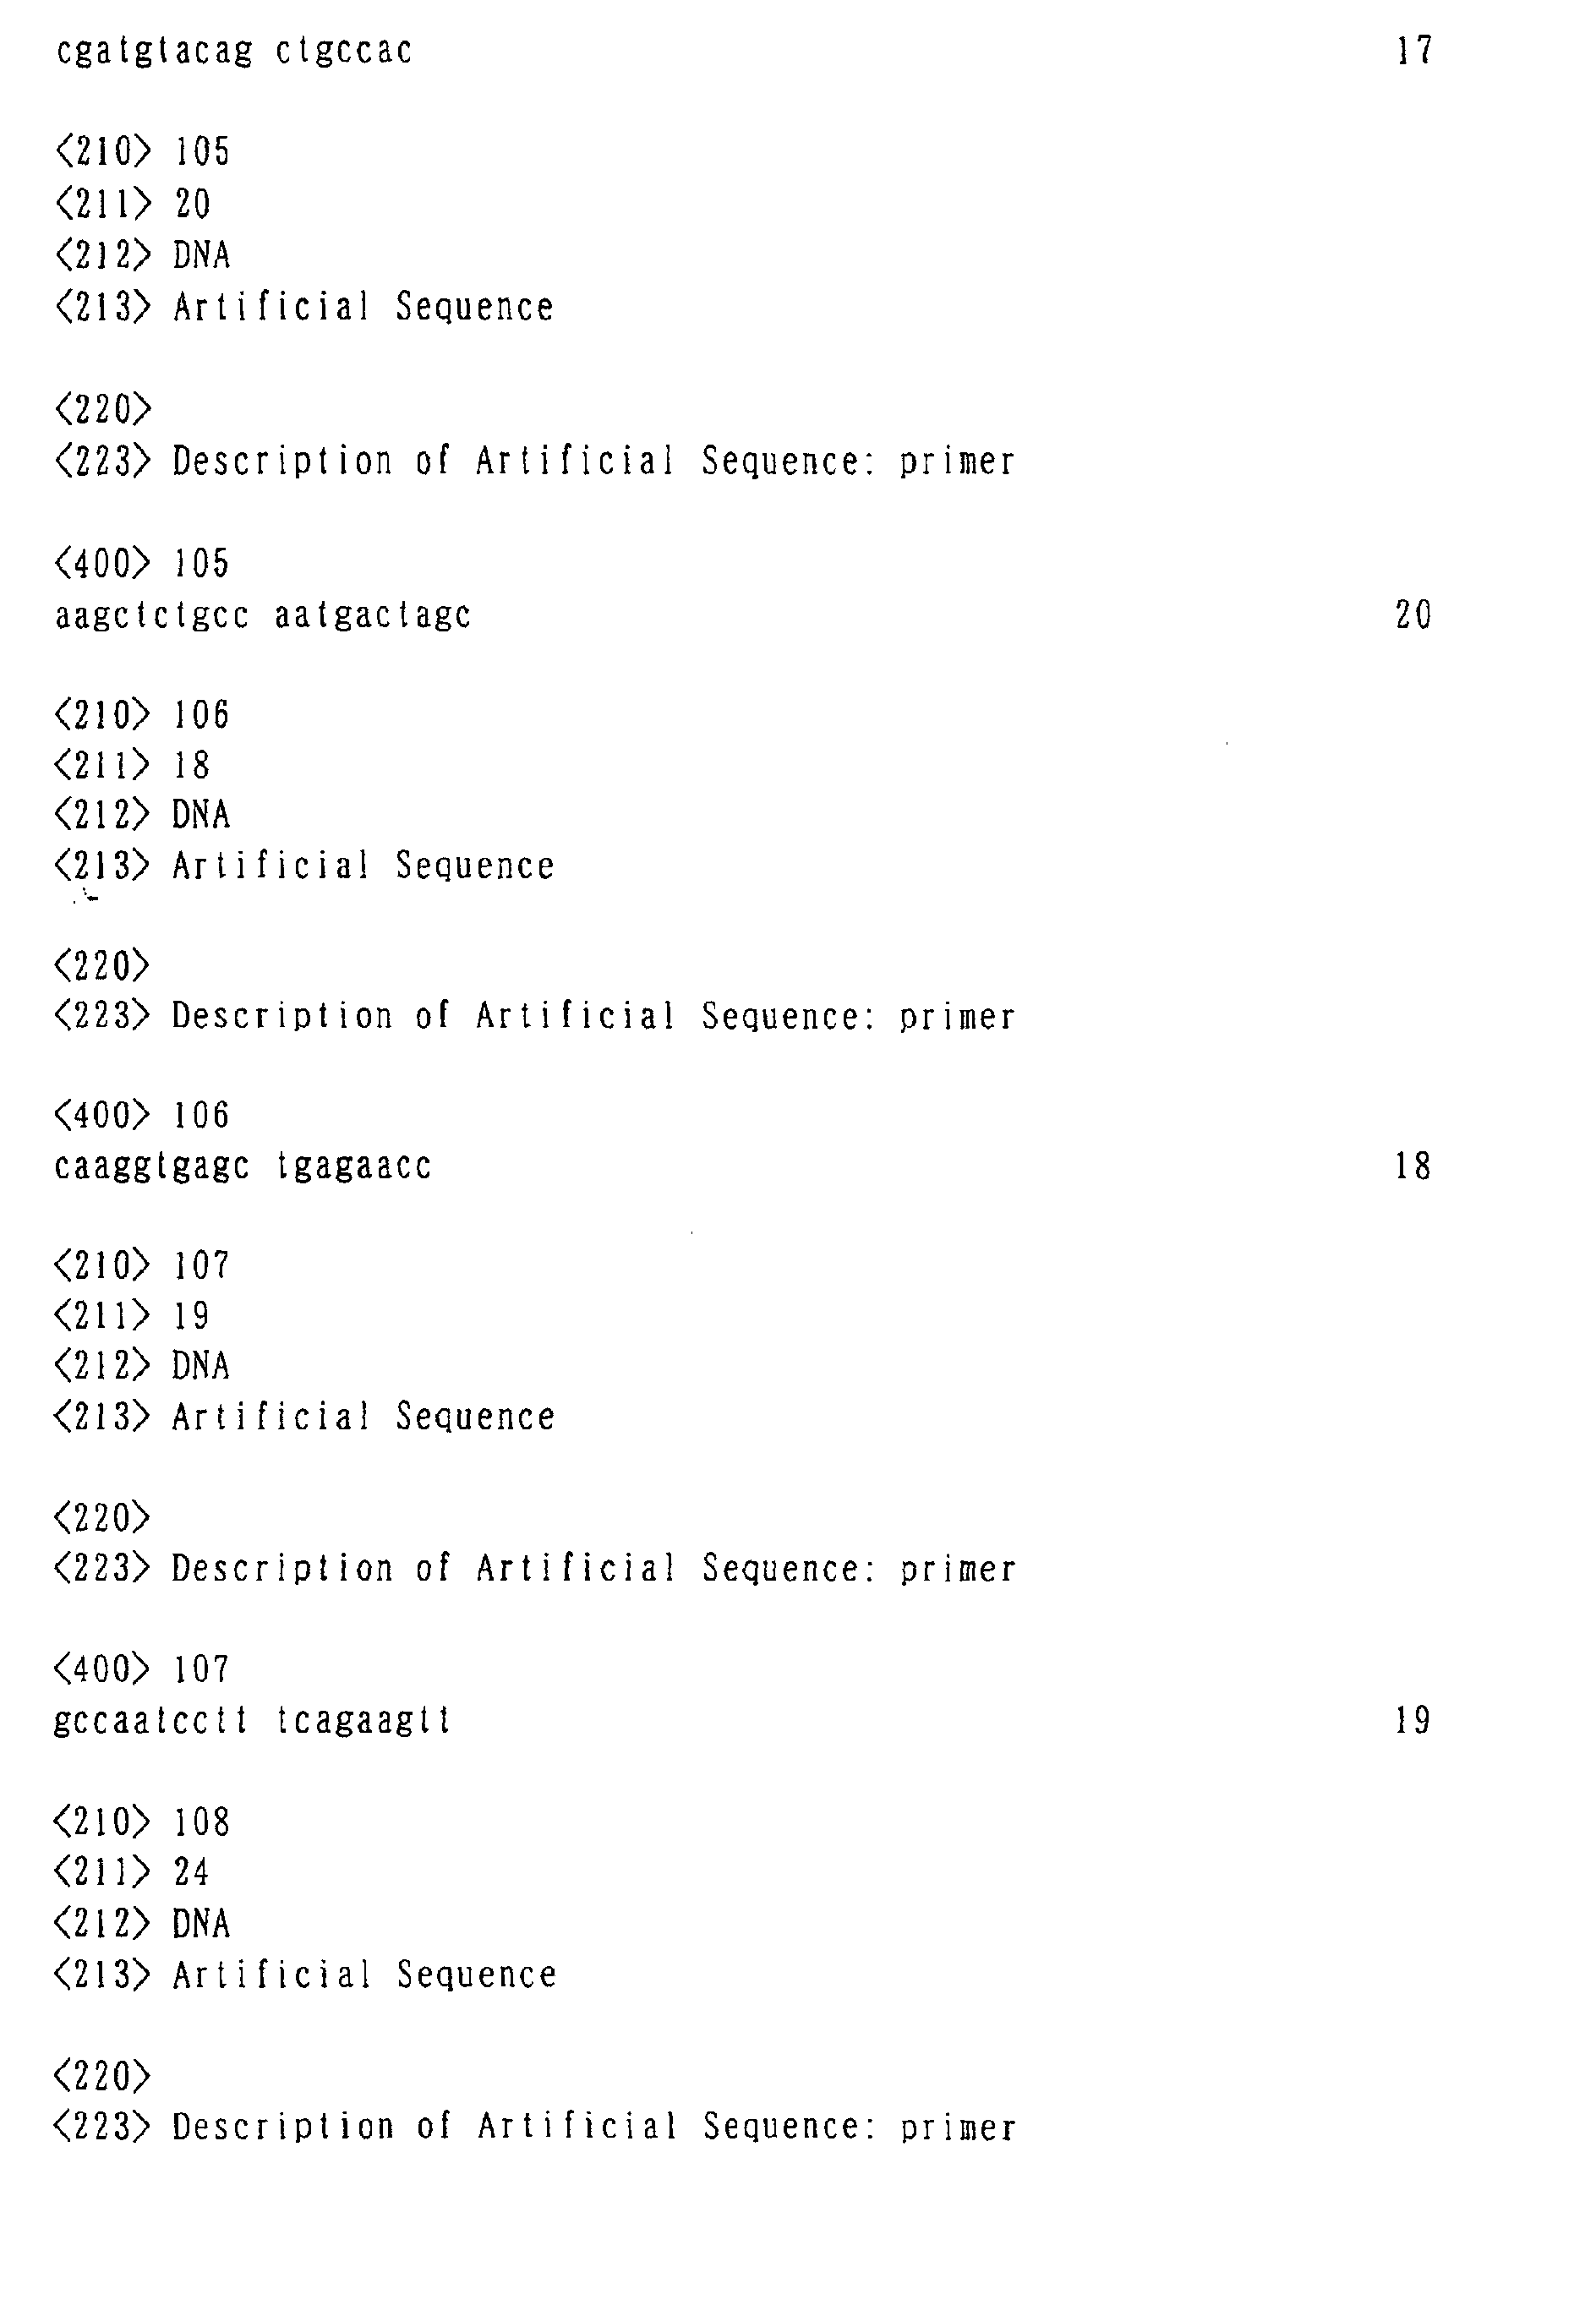
oligonucleotides of SEQ ID NOS: 1 to 127 and 135 to 192.
-
-
Hereafter, the present invention will be explained
in detail.
<1> Gene panel of the present invention
-
The gene panel of the present invention is a gene
panel comprising names of genes of which expression
levels change in hepatocytes during liver regeneration
as compared with those in a normal state and gene
expression profiles of the genes.
-
The gene panel of the present invention can be
produced by the following steps:
- (a) the step of measuring expression levels of genes in
hepatocytes of a model animal in a normal state and
expression levels of the genes during liver
regeneration;
- (b) the step of comparing the expression levels,
respectively; and
- (c) the step of identifying a group of genes of which
expression levels change during liver regeneration and
producing expression profiles from information about
gene names and changes in expression levels.
-
-
The liver regeneration refers to a phenomenon that,
when a part of cells in the liver are damaged or lost
due to resection or the like, the condition is repaired
and goes back to the original normal liver condition.
For example, this phenomenon is observed in the
remaining liver or transplanted liver after partial
hepatectomy in liver cancer treatment or transplantation
of partially resected liver in liver disease treatment.
-
The gene expression level is synonymous with
expression amount, expression intensity or expression
frequency of a gene, and is usually analyzed based on a
production amount of a transcription product
corresponding to the gene, activity of its translation
product or the like.
-
The gene expression level can be measured by
methods usually utilized in analyses of gene expressions.
Examples of preferred methods include the gene chip
method, the gene microarray method, the gene macroarray
method and so forth. In these methods, gene fragments
arrayed and immobilized on a certain plate (usually,
slide glass) are used. This chip is hybridized with
fluorescence-labeled mRNA, and the type and amount of
the mRNA are measured.
-
Further, as methods preferred in the present
invention, the ATAC-PCR method and the Taqman PCR (SYBR
Green) method can be mentioned. The ATAC-PCR method is
a type of the quantitative PCR technique developed by
Kato et al (Kato, K. et al., Nucl. Acids Res., 25, 4694-4696,
1997) and is characterized in that it enables
quantification of expression of a trace amount sample.
Further, while conventional quantitative PCR methods
enable quantification of expressions of several tens of
types of genes at most, the ATAC-PCR method enables
quantification of expressions of 1000 or more types of
genes. The Taqman PCR (SYBR Green method) is a common
technique for quantitative RT-PCR (Schmittgen TD,
Methods, 25, 383-385, 2001) and is characterized in that
primers can be readily designed. Moreover, its
procedure is simple, and expressions of a large number
of genes can be measured in a short time (40 to 150
genes/2 hours).
-
Besides the above, examples of the gene expression
analysis method include the body map method (Gene, 174,
151-158, 1996), serial analysis of gene expression
(SAGE) (U.S. Patent Application Nos. 527,154 and 544,861,
European Patent Publication No. 0761822), micro-analysis
of gene expression (MAGE) (Japanese Patent Laid-open
Publication (Kokai) No. 2000-232888) and so forth.
-
The body map method will be outlined below. A
poly-T sequence on a vector and a poly-A tail at the 3'
end of mRNA are ligated, and cDNA is synthesized by
using the vector poly-T sequence as a primer. Further,
the cDNA is digested with a restriction enzyme MboI.
Since one MboI site exists per 300 base pairs on average
on cDNA, the cDNA on the vector is divided into
fragments of 300 base pairs in average. At this time,
the cDNA fragment closest to the poly-A tail remains as
ligated to the vector. The vector having this cDNA
fragment is cyclized and introduced into Escherichia
coli to construct a cDNA library. About 1000 clones are
arbitrarily selected from the library, and a nucleotide
sequence of 300 base pairs in average is determined for
each clone. Among these sequences, clones comprising
the same sequences are collected, and the type and the
emerging frequency of each sequence are obtained to
create a gene expression profile. Homology search
(BLAST search) in the data bank is performed for each
cDNA sequence, and a clone having the same sequence as
that of a known gene is given the name of the gene.
When the sequence is not registered at the data bank, it
is assumed that a gene corresponding to the sequence
does not exist.
-
In order to perform the homology search by the
BLAST search, information of at least 11 base pairs is
necessary. There are about one million types of genes
having sequences comprising 10 nucleotides. This number
of types is far more than the number of 100,000 types of
genes expected to exist in human. That is, if there is
information about 11 base pairs, genes having the
sequence can be identified, and the gene expression
profiles can be analyzed. Therefore, in order to
efficiently analyze gene expression profiles by the body
map method requiring many sequences, cDNA fragments
having about 300 base pairs in the body map can be
further divided into short fragments having 11 base
pairs or more (referred to as "tag"), and these
fragments can be further ligated to one another as many
kinds of fragments and inserted into a vector to
construct a ligated tag library. Then, if about 1000
clones are arbitrarily selected as in the body map
method to determine the DNA sequences of the ligated
tags, it can be expected that information about
expressions of more genes can be obtained with the same
procedure as in the body map method. Each tag
represents a gene sequence, and the emerging frequency
of the tag represents the expression frequency of the
gene. Since the length of a DNA sequence that can be
determined in one sequencing is usually about 600 base
pairs, DNA sequences of about 50 tags at most can be
determined by one sequencing. That is, gene expression
profile analysis can be performed with about 50 times
higher efficiency at most compared with the body map
method.
-
The SAGE method is a method for analyzing gene
expression profiles based on the above concept. The
SAGE method is performed as follows. cDNA is prepared
by using a poly-T bonded with biotin at the 3' end as a
primer and digested with a restriction enzyme such as
MboI (referred to as "anchoring enzyme") as in the body
map, and then a cDNA fragment including the 3' end
bonded with biotin is adsorbed on avidin beads. Then,
the beads are divided into two portions, and one of two
types of linkers (A and B) is bonded to the cDNA
fragment (about 13 bp) adsorbed on the beads of one of
the two portions, respectively. A site for a Class II
restriction enzyme such as BsmFI (referred to as
"tagging enzyme) is added to each linker beforehand.
The cDNA fragments are excised from the beads with the
tagging enzyme, the digestion sites are blunt-ended, and
the tag ligated to the linker A and the tag ligated to
the linker B are ligated to each other. This product is
called a ditag. The ditag is amplified by PCR using
primers recognizing the linker A and the linker B. The
amplified ditags are ligated to one another as many
kinds of fragments and incorporated into a vector and
sequenced. About 50 tag sequences can be obtained per
sequencing. This tag sequence information is collected
to obtain the gene expression frequency.
-
The MAGE method is a modified version of the
aforementioned method, and is a method enabling gene
expression frequency analysis with high efficiency and
precision, in which cDNAs are synthesized from mRNAs by
using a vector primer having a poly-T sequence, the cDNA
sequences are tagged on a vector, the obtained tags are
ligated via a sequence that allows identification of the
tag end to form a concatemer, and the nucleotide
sequence of the concatemer is analyzed.
-
In the present invention, the gene expression
analysis method is not particularly limited so long as
gene expression levels can be analyzed, and any of
currently known methods and methods to be developed in
future can be employed. Among the methods mentioned
above, particularly preferred are the gene chip method,
the gene microarray method, the ATAC-PCR method and the
Taqman PCR (SYBR Green) method.
-
In the present invention, gene expression levels
may be analyzed based on results obtained by a single
kind of method or results obtained by two or more kinds
of methods. Although the analysis can be performed by a
single kind of method to a certain extent, more precise
analysis can be attained by using two or more kinds of
methods in combination. Specifically, a correlation
coefficient is calculated for results obtained by two or
more kinds of methods, for example, the gene chip method
and the ATAC-PCR methods. When the correlation
coefficient is a certain value or higher, it is assumed
that the expression level of the corresponding gene has
changed.
-
Various gene chips, gene microarrays and gene
macroarrays of human or animal such as mouse are
commercially available, and these may be used in the
present invention.
-
In the present invention, changes in gene
expression levels can be analyzed by measuring
expression levels of various genes in hepatocytes in a
normal state and expression levels of these genes during
liver regeneration and comparing their expression levels,
respectively. The gene expression levels during liver
regeneration are analyzed by, for example, using a model
animal such as a partially hepatectomized rat and
measuring the gene expression levels in hepatocytes
after the hepatectomy. On the other hand, the gene
expression levels in a normal state are typically
measured immediately before the hepatectomy. The gene
expression levels are preferably analyzed over time
during liver regeneration.
-
As described above, a group of genes of which
expression levels change during liver regeneration is
identified. Expression profiles of these genes are
produced by allocating information about the change of
analyzed expression level to the identified gene,
respectively.
-
Further, in the present invention, as genes of
which expression levels change during liver regeneration
as compared with those in a normal state, that is,
candidates of genes considered to be involved in liver
regeneration, genes estimated to be involved in the
metabolism of L-alanine can be mentioned.
-
L-alanine is known to accelerate liver
regeneration (Maezono K et al., Hepatology 24(5), 1996;
Japanese Patent Laid-open Publication No. 5-229940).
Further, elevation of the L-alanine concentration in
human plasma after hepatectomy (Nijveldt RJ et al.,
Liver 21(1): 56-63, 2001), accumulation of L-alanine in
rat liver tissue after hepatectomy (Brand HS et al., J.
Hepatology, 23, 333-340, 1995) and so forth have been
reported. As data supporting these findings, elevation
of mRNA level of the amino acid transporter system A
(ATA2), which transports L-alanine, was observed in 70%
partially hepatectomized rat as a liver regeneration
model, as described later (the examples of the present
specification). Further, since increase of the L-alanine
transporting activity in a similar liver
regeneration model has also been observed (Joan-Vicenc
et al., FEBS LETTERS, 329(1,2): 189-193, 1993; Freeman
TL et al., BBRC, 278, 729-732, 2000), possibility of
increase in uptake of L-alanine into hepatocytes during
liver regeneration is suggested.
-
Further, the uptake of [3H] thymidine into DNA is
decreased when the Ala transport activity of ATA2 is
inhibited by a treatment with MeAIB (nonmetabolizable
System A-specific substrate, alpha-(methylamino)isobutyric
acid) (Freeman TL et al.,
Hepatology, 30(2): 437-444, 1999). Therefore, it is
suggested that acceleration of liver regeneration is
suppressed when transport of L-alanine into hepatocytes
is inhibited. This also strongly suggests that ATA2
(Ala) is involved in acceleration of liver regeneration.
-
Furthermore, in the field of surgical operations,
it has been reported from old days that markedly
increased energy metabolism is observed in liver under
an invasive condition such as hepatectomy, and amino
acids represented by L-alanine are supplied primarily as
a result of decomposition of myoproteins and used as
substrates for gluconeogenesis (Felig P et al.,
Metabolism, 22, 179-207, 1973) and protein synthesis.
As described above, L-alanine is generally considered to
supply energy through gluconeogenesis during liver
regeneration. In fact, oxidation of L-alanine was
suppressed in a liver regeneration model rat at 9 or 18
hours after hepatectomy, and increase in plasma glucose
level, accumulation of liver glycogen and enhanced
activities of fructose-1,6-diphosphatase and PEPCK have
also been reported (Klain GJ et al., J. Nutr. Biochem.,
1 (Nov), 578-584, 1990).
-
Based on the above findings, it was revealed that
L-alanine accelerated liver regeneration, and it was
hypothesized that its action mechanism is based on the
energy supply increased by L-alanine during liver
regeneration. Therefore, as shown in the examples
described later, expressions of 59 types of rat genes
involved in L-alanine metabolism were analyzed during
liver regeneration. As a result, changes in expression
were observed for 17 types of the genes. Accordingly,
when the gene panel of the present invention is produced,
genes involved in the L-alanine metabolism may be
selected prior to the step (a) mentioned above.
-
Even for a gene of which expression change is not
observed during liver regeneration, expression change
may be observed if L-alanine is administered before,
during or after liver regeneration as shown in Example 3.
Such a gene may also be included in the gene panel.
Further, a substance having an action for accelerating
liver regeneration (liver regeneration accelerating
substance) other than L-alanine may also be administered
before, during or after liver regeneration. Examples of
the liver regeneration accelerating substance include a
mixture of liver extract and flavin adenine dinucleotide
(15 µl of liver extract, 10 mg of FAD per 1 ml), liver
hydrolysate, saiko-keishito, shosaikoto,
diisopropylamine dichloroacetate, placenta hydrolysate,
valine (WO 0113912), vascular endothelial growth
factor/vascular permeability factor (VEGF/VPF) (WO
0132213), macrolide compounds (JP 3240728), TCF II (JP
10194986), TGF-β release/activation/synthesis inhibitor
(JP8333249), glucose-1-phosphate, glucose-6-phosphate
(JP2202821), desialated orosomucoid (JP 6122025) and so
forth.
-
The gene panel of the present invention includes
at least names of various genes identified as described
above and expression profiles of the respective genes.
As for the name of genes, the nomenclature for the genes
is not particularly limited so long as the genes can be
distinguished from one another. Typically, names of
products encoded by the genes, accession numbers or gene
names used in the database of GenBank etc., probe set
names or gene names on a gene chip and so forth are used.
-
In the present invention, the term "expression
profile" means information about change in expression
level of each gene included in the gene panel. In a
preferred embodiment, the expression level is measured
and recorded over time. In the expression profile,
expression level of a gene may be represented by an
absolute value or relative value.
-
In a preferred embodiment of the gene panel of the
present invention, genes are classified according to the
expression levels at certain times after hepatectomy.
For example, genes are classified into a group in which
the expression levels markedly increase 1 hour and 6
hours after hepatectomy (early stage of liver
regeneration) (Groups 1 and 2), a group in which the
expression levels conversely decrease at this stage
(Groups 6 and 7), a group in which the expression levels
markedly increase 24 hours and 48 hours after
hepatectomy (mid stage of liver regeneration) (Groups 3
and 4), a group in which the expression levels
conversely decrease at this stage (Groups 8 and 9), a
group in which the expression levels markedly increase 7
days after hepatectomy (later stage of liver
regeneration) (Group 5) and a group in which the
expression levels conversely decrease at this stage
(Group 10). The expression "markedly" used herein means
that the increase or decrease of the expression level is
3 times more compared with the level before hepatectomy
in the gene chip method, or that, in the case of the
Taqman-PCR (SYBR Green) method, if a difference is
observed in a significance test, it is considered that
there is a difference of expression.
-
In an embodiment of the gene panel of the present
invention, these groups can be listed in the order of
the length of the time for which the expression levels
after the increase or decrease of expression are
maintained or for which the increase or decrease
continues, starting with the longest time as listed in
Table 1.
-
Further, the gene panel preferably includes
information about liver weight at a certain time after
hepatectomy. For example, liver is extracted at an
early stage of liver regeneration (1 hour and 6 hours
after hepatectomy), mid stage of liver regeneration (24
hours and 48 hours after hepatectomy) and later stage of
liver regeneration (7 days after hepatectomy), and
weight of each liver is measured.
-
The gene panel of the present invention may
include sequence information of PCR primers for
analyzing expression level of each gene. Examples of
the primers include primers comprising all or a part of
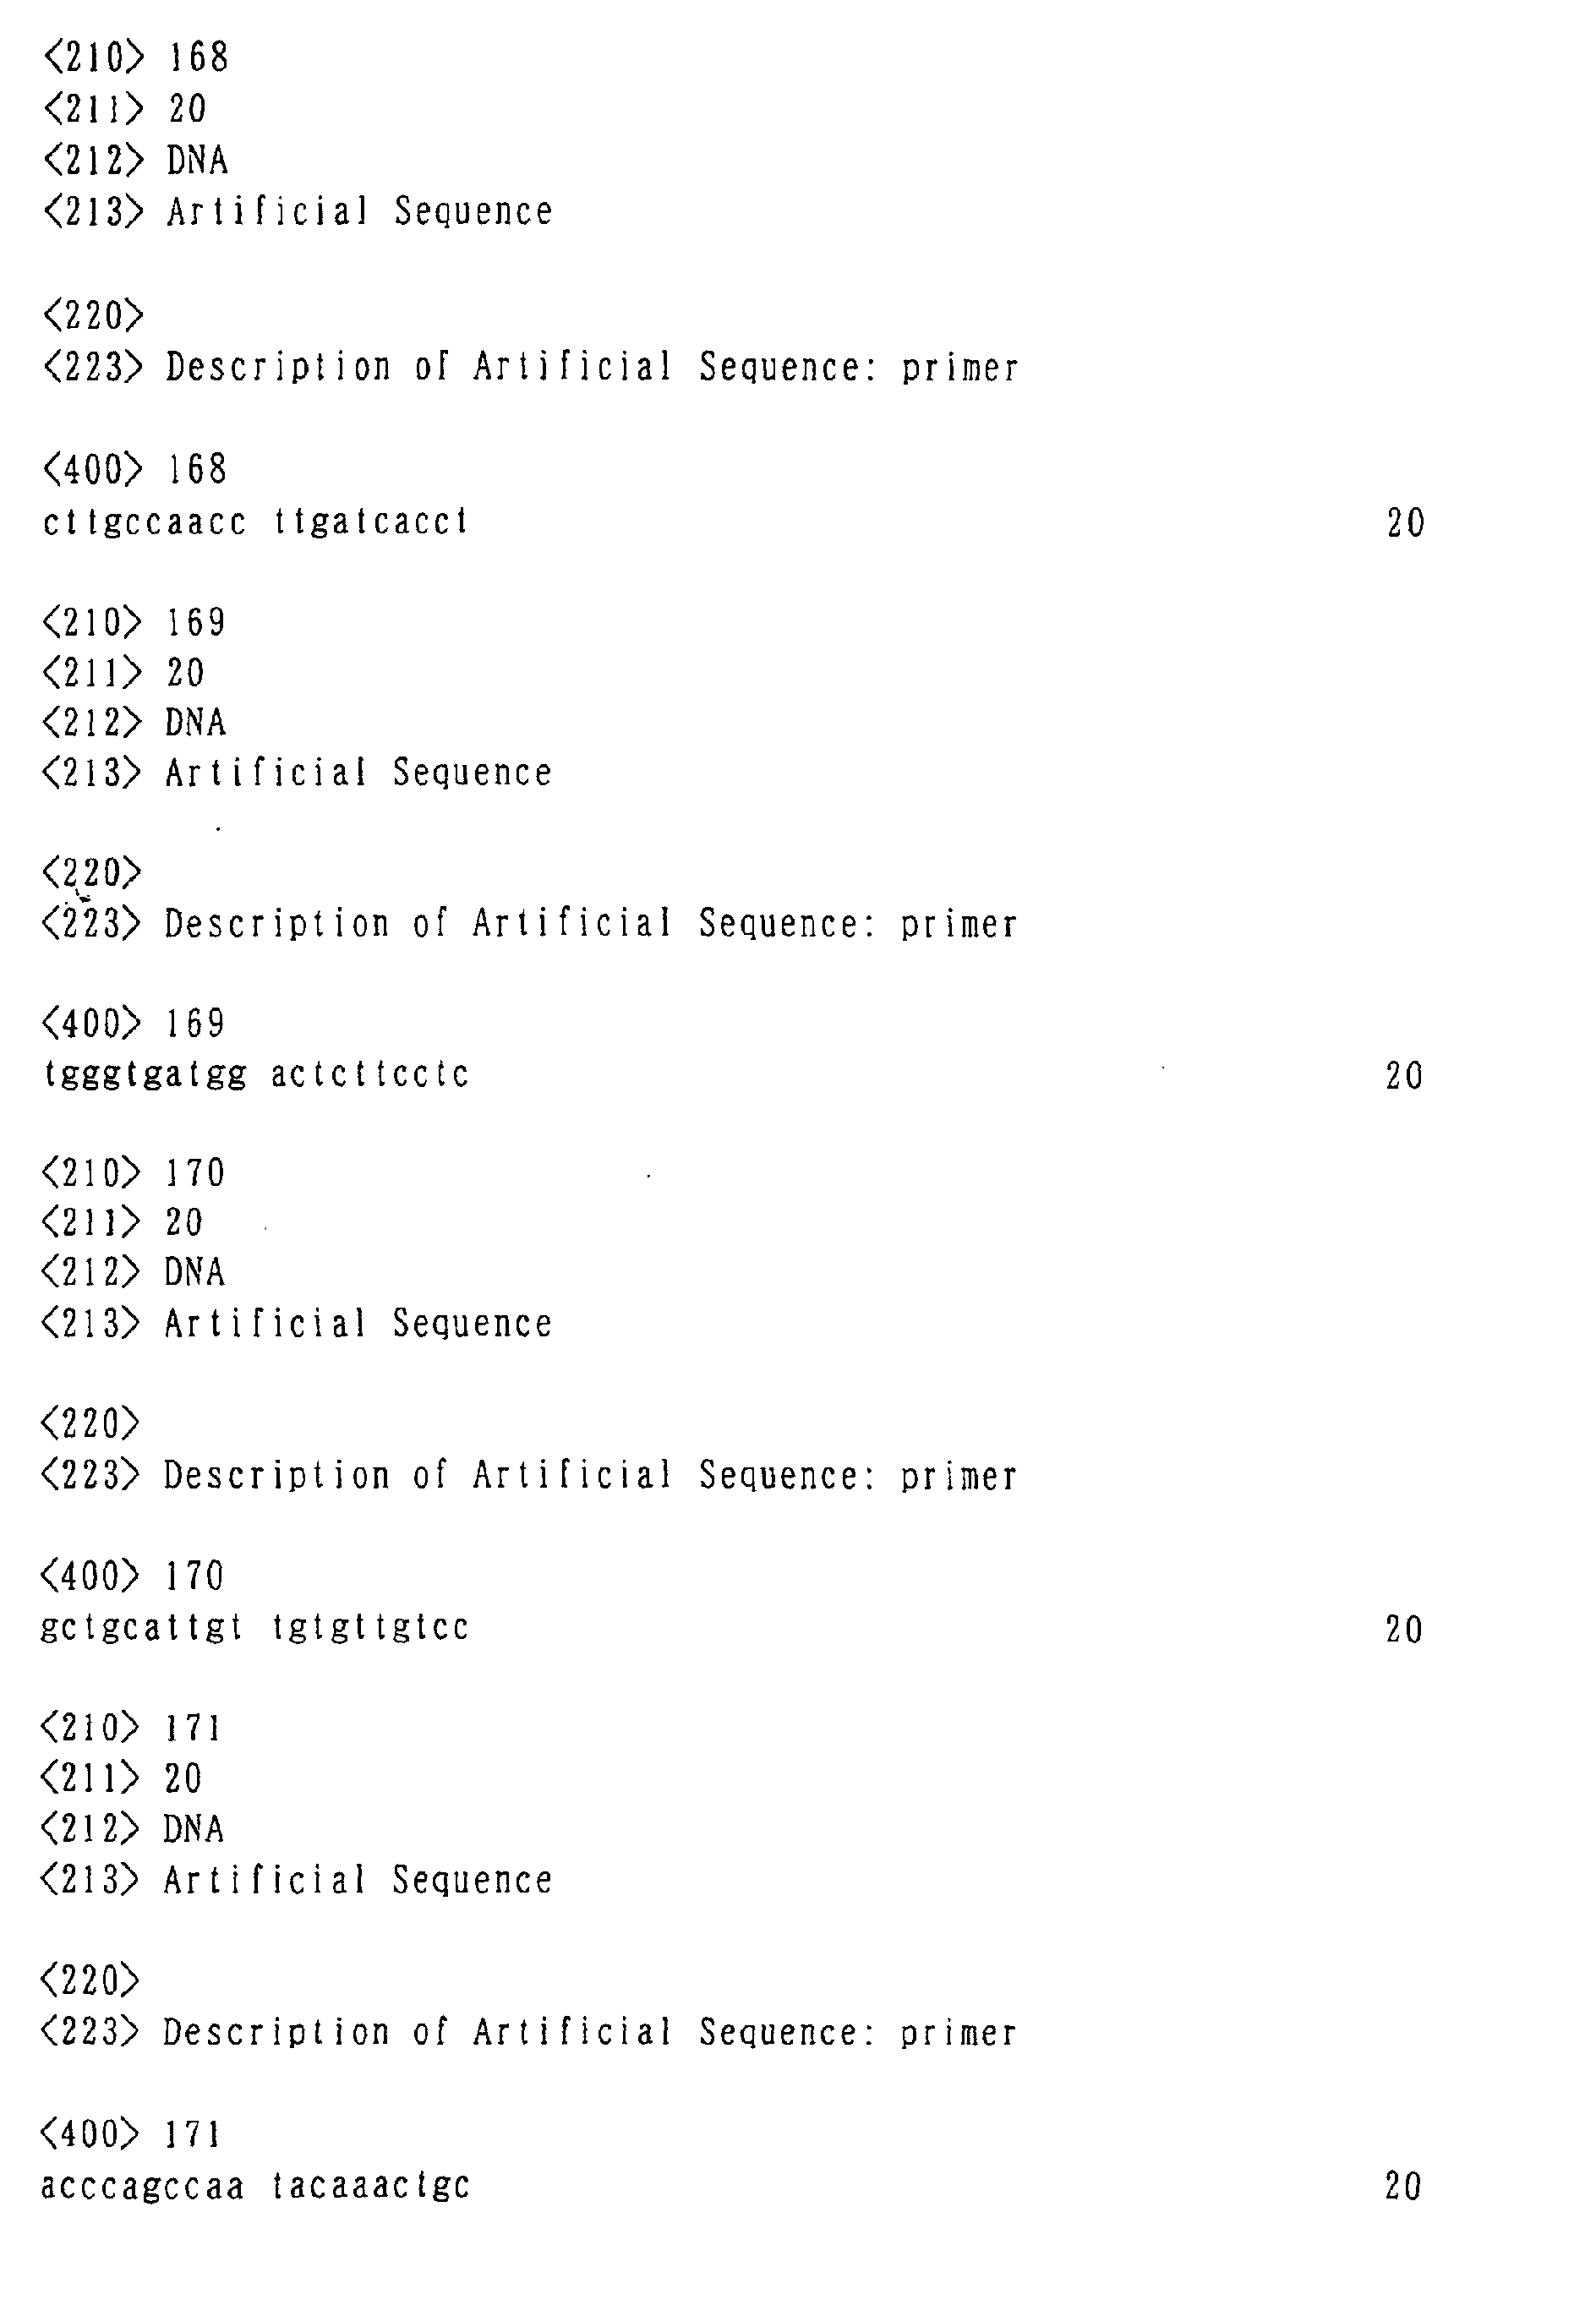
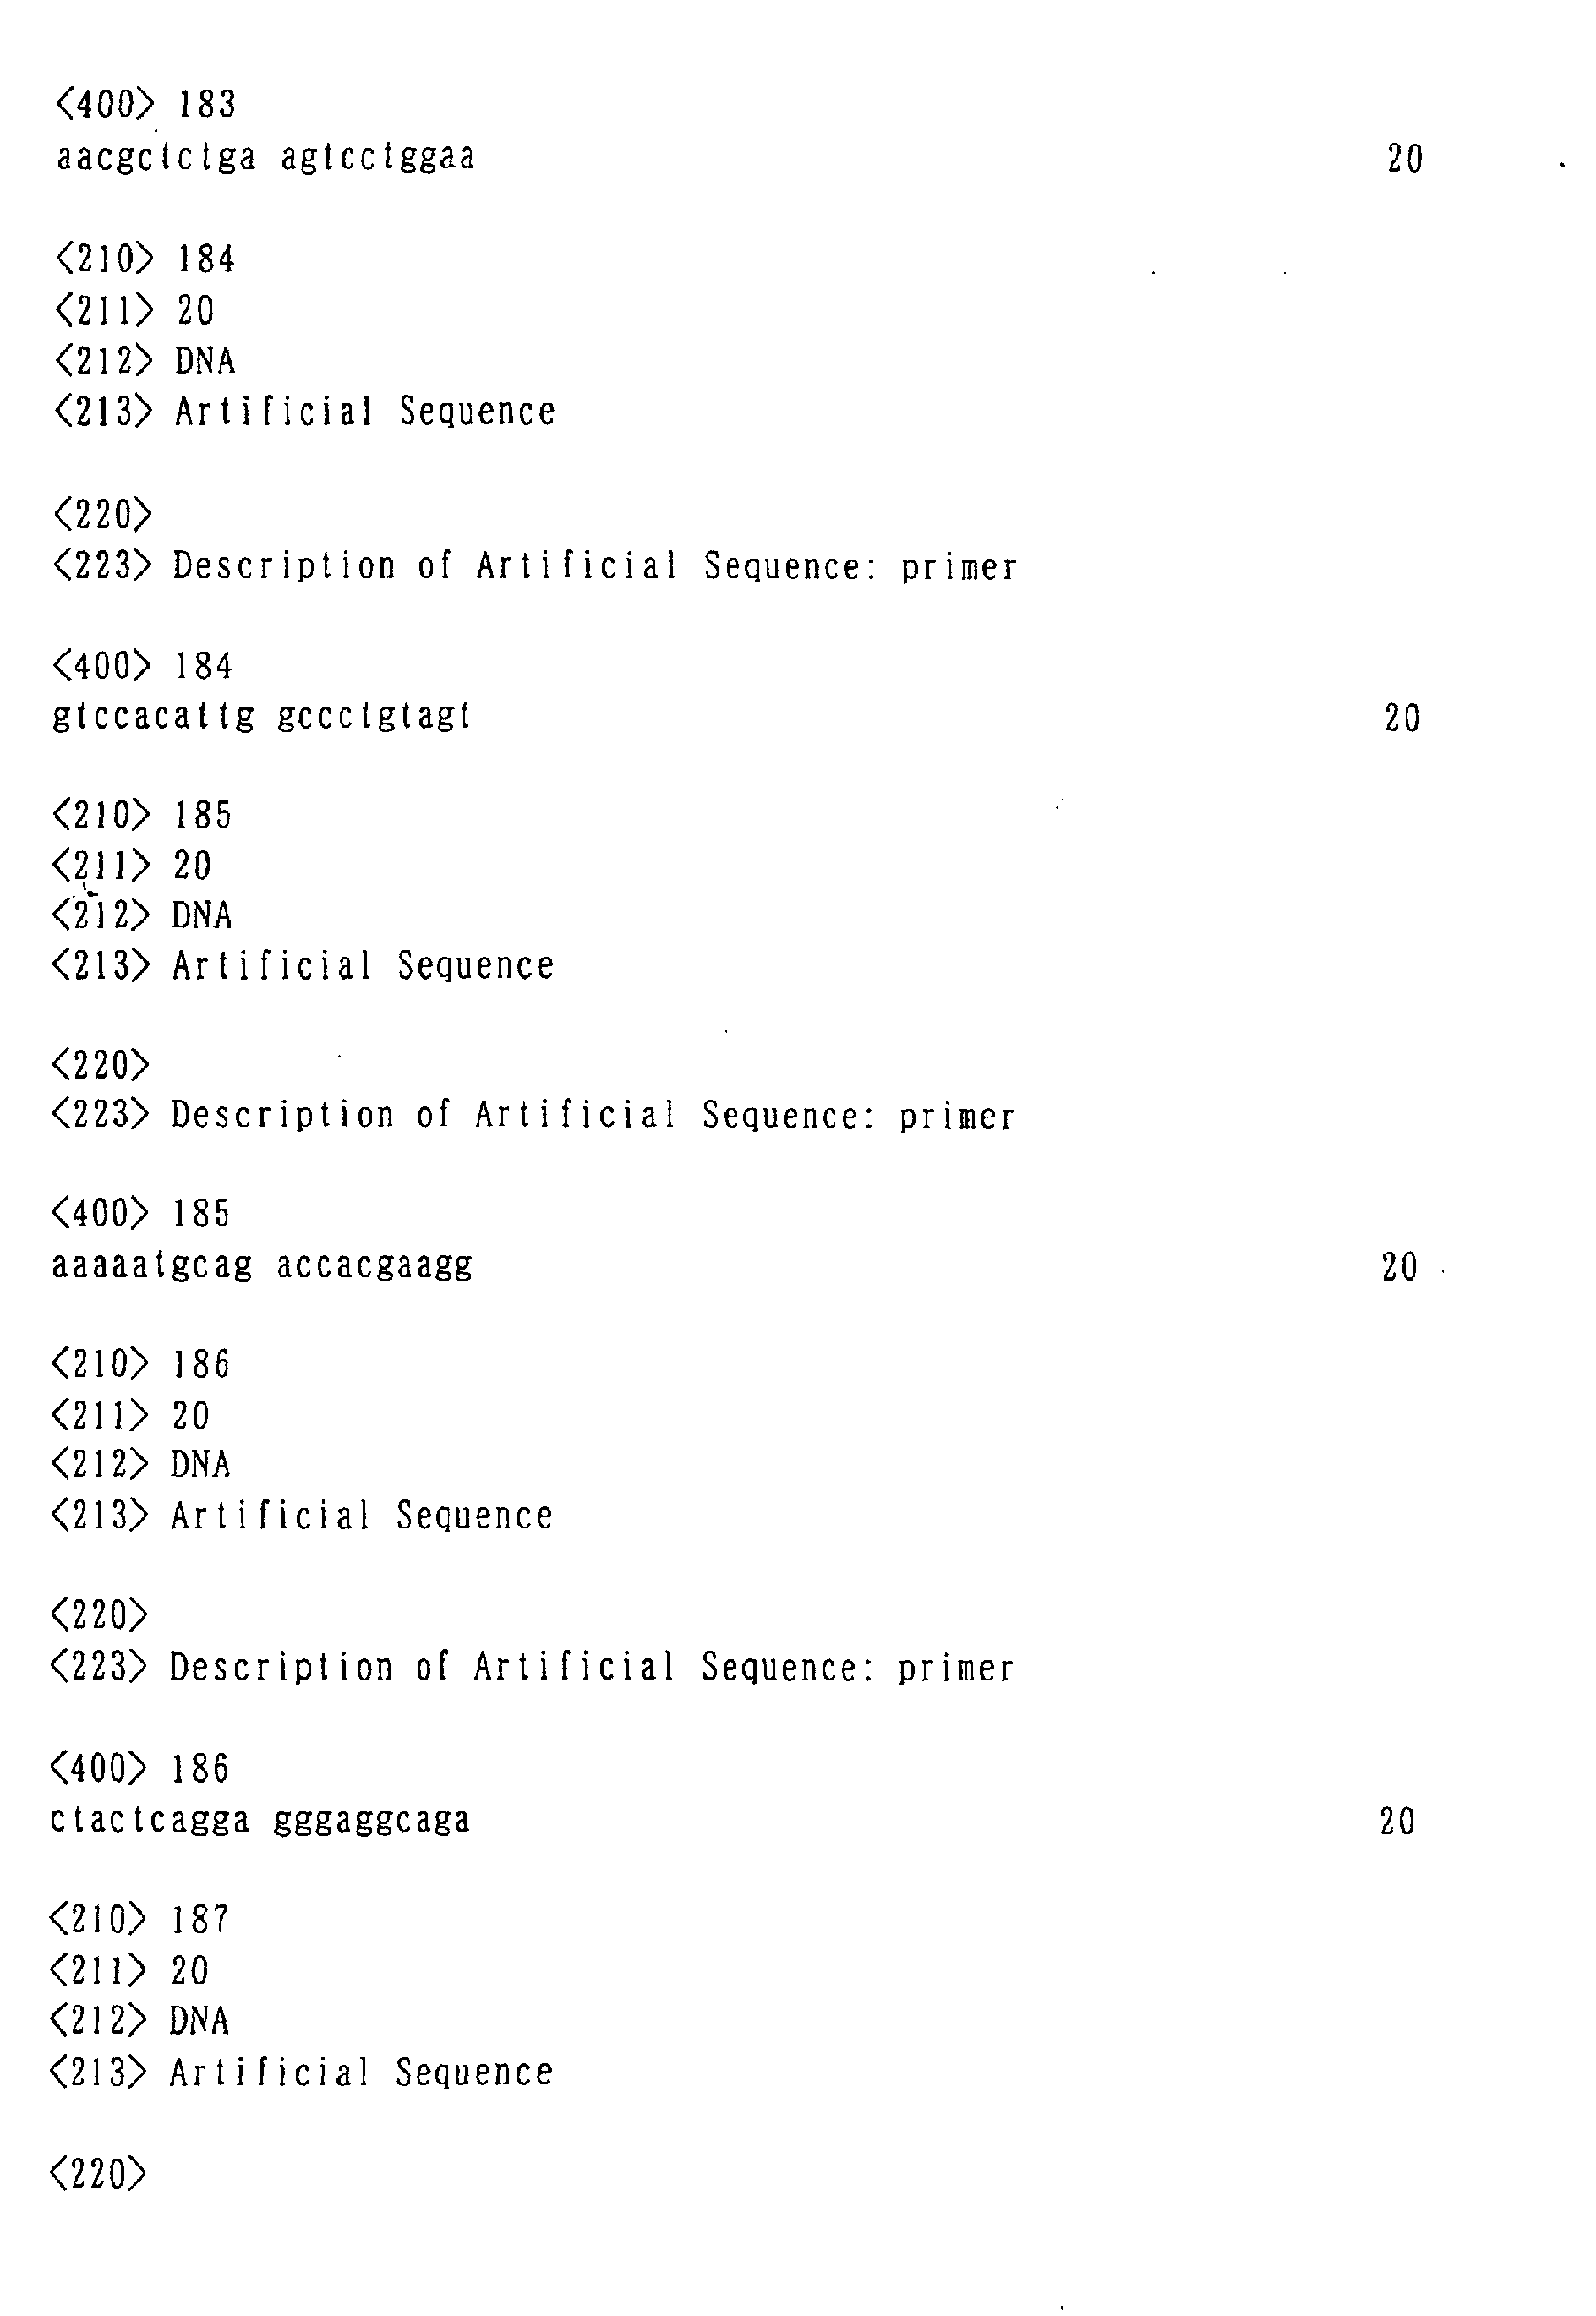
the oligonucleotides of SEQ ID NOS: 1 to 127 and 135 to
192. Further, in addition to the sequence information
of the primers, nucleotide sequence information of
adaptors used in the ATAC-PCR method and/or the Taqman
PCR (SYBR Green) method may be included. SEQ ID NOS: 1
to 127 represent primers used in the ATAC-PCR method,
and SEQ ID NOS: 135 to 192 represent primers used in the
Taqman PCR (SYBR Green) method. As for the nucleotide
sequences of the adaptors, adaptors having the
nucleotide sequence of SEQ ID NOS: 128 to 133 can be
mentioned.
<2> Screening method of the present invention
-
Based on the gene panel of the present invention,
various screening tests are enabled by constructing a
system for quantitatively or semi-quantitatively
measuring expressions of genes included in the gene
panel.
-
For example, screening for a drug involved in
liver regeneration can be performed by administering
drugs to a model animal or liver tissue or cells and
profiling expressions of genes constituting the gene
panel of the present invention. That is, a drug that
provides gene expression profiles similar to the
expression profiles in the gene panel is considered to
accelerate liver regeneration.
-
Further, a liver regeneration accelerating
substance can also be screened by screening for a drug
that further increases or decreases the increased or
decreased expression levels of genes of the gene panel
of the present invention. In this case, screening can
be performed by paying attention to expression changes
of about 6 types of genes. Examples of the screening
based on this conception will be shown in the examples
described later.
-
As the aforementioned 6 types of genes, for
example, there can be mentioned the genes of Nos. 5
(amino acid transporter system A (ATA2)), 17 (high
mobility group protein 2), 36 (nuclear RNA helicase), 46
(liver nuclear protein p47), 67 (leukemia-associated
cytosolic phosphoprotein stathmin) and 68 (deoxy-UTPase
(dUTPase)) among the 137 types of genes in the gene
panel shown in Table 1 ((1) to (11)).
-
Examples of the method for profiling gene
expressions include the DNA microarray and DNA
macroarray methods using a slide glass, nylon membrane
or the like on which fragments of genes constituting the
gene panel are immobilized, the ATAC-PCR method, a
method utilizing the Taqman probe, quantitative PCR
utilizing SYBR Green and so forth. The expression
profiling may be carried out by using a single kind of
method or two or more kinds of methods in combination.
-
Hereafter, a specific example of screening
procedure will be described.
-
As primary screening, cultured hepatocytes are
treated with drugs to be screened or the drugs are
administered to rats. After a certain time, RNAs are
prepared from the cells or liver. The gene expression
levels are measured before and after the drug treatment,
and drugs that provide expression profiles similar to
those in the gene panel are screened. The gene
expression patterns in hepatocytes after the drug
treatment are grouped, and drugs that provide grouping
similar to the grouping in the gene panel are screened.
The grouping is performed by classifying the genes
according to expression levels at a certain time in the
same manner as in the production of the gene panel.
-
As for culture conditions of hepatocytes, usual
culture may be used, or addition of substances that
damage hepatocytes such as galactosamine, heavy metal
ions or carbon tetrachloride to a medium and so forth
may be used. It is expected that substances that
accelerate liver regeneration or proliferation of
cultured hepatocytes can be screened by culturing cells
under the usual condition. Further, it is expected that
substances that accelerate recovery of the liver
function by liver regeneration after cell damage can be
screened by carrying out the culture in the presence of
a substance that damages hepatocytes.
-
As secondary screening, candidate drugs expected
to exhibit action for accelerating liver regeneration
based on the results of the primary screening are
administered to partially hepatectomized rats, and liver
is extracted after certain intervals, for example, at an
early stage of liver regeneration (1 hour and 6 hours
after hepatectomy), mid stage of liver regeneration (24
hours and 48 hours after hepatectomy) and later stage of
liver regeneration (7 days after hepatectomy). The
liver weights are measured, and RNAs are extracted from
the livers to measure changes in gene expression. The
obtained data are compared with data of liver weight
changes and gene expression changes in partially
hepatectomized rats not administered with the drugs to
evaluate effect of the drugs on liver regeneration.
-
The aforementioned screening can also be performed
by using laboratory animals other than rats. In this
case, it is preferable to newly produce a gene panel for
homologues corresponding to the rat genes and perform
the screening.
-
In addition to the screening of drugs that provide
expression changes similar to those in the gene panel,
the following drug screening can be performed by
utilizing the gene panel. The genes that show the
changes in the early stage of liver regeneration (for
example, Groups 1, 2, 6 and 7 mentioned above) are
considered to be important for initiation of liver
regeneration. Therefore, it is expected that drugs
effective for the initiation of liver regeneration can
be obtained by screening for drugs that provide patterns
similar to the patterns of these genes of these groups
after the treatment with the drugs.
-
Further, the genes of which expression changes
start in the mid stage of liver regeneration (for
example, those of Groups 3, 4, 8 and 9 mentioned above)
are considered to act on acceleration of proliferation
or differentiation of hepatocytes after the initiation
of liver regeneration. Therefore, it is expected that
drugs that positively act on the acceleration of
proliferation or differentiation of hepatocytes can be
obtained by screening for drugs that provide patterns
similar to the patterns of these genes after the
treatment with the drugs.
-
The genes of which expression changes start in the
later stage of liver regeneration (for example, those of
Groups 5 and 10 mentioned above) are considered to be
important for termination of liver regeneration and
normal hepatocyte functions after the completion of
regeneration. Therefore, it is expected that drugs that
negatively act on the proliferation of hepatocytes or
drugs effective for normal hepatocyte functions after
the completion of regeneration can be obtained by
screening for drugs that provide patterns similar to the
patterns of these genes after the treatment with the
drugs. The drugs that negatively act on the
proliferation of hepatocytes can be used for prevention
of excessive proliferation of hepatocytes, and
possibility of use thereof as drugs for liver cancer or
the like is expected.
-
As described above, the gene panel of the present
invention is considered to be useful also for screening
for drugs effective in each stage of liver regeneration
(for example, initiation, cellular proliferation,
differentiation, termination of cellular proliferation
etc.), and it is considered that more effective liver
regeneration agents can also be created by using drugs
obtained as a result of the above screenings.
-
L-alanine is known to have liver regeneration
effect. However, since L-alanine is easily metabolized
and disappears in a living body, sufficient drug
efficacy cannot be obtained. Accordingly, drugs are
being required which have the same drug efficacy as that
of L-alanine and are imparted with better
characteristics such as prolonged effect obtained
through improved pharmacokinetics. Further, there are
substances such as crude drugs, of which drug efficacy
is known but amount is insufficient for use as a drug
since it is hard to secure their raw material and they
act as a mixture of two or more kinds of components.
Therefore, substances that have liver regeneration
action and can be sufficiently supplied are being
required. The present invention enables screening of
substances useful as drugs with high sensitivity and
high efficiency.
<3> Method for evaluating condition of liver of the
present invention
-
The gene panel of the present invention can be
used for a system for evaluating whether diseased liver
shows progression towards regeneration in liver diseases
such as hepatitis and cirrhosis. Further, a drug
treatment suitable for each patient can be performed by
examining the gene expression change pattern of each
patient. For example, a series of drugs that
specifically control certain genes (gene group) in the
gene panel of the present invention in a positive or
negative manner are screened. Then, drugs necessary for
liver regeneration can be selected by examining
expressions of the genes in the gene panel of each
patient with liver disease.
Brief Description of the Drawings
-
- Fig. 1 shows a structure of adaptor.
- Figs. 2 to 4 show relative expression levels of
genes involved in L-alanine metabolism, of which
expressions change during liver regeneration after
administration of L-alanine (relative expression levels
based on the expression level of β-actin, which is taken
as 1000).
-
Best Mode for Carrying out the Invention
-
The present invention will be explained more
specifically with reference to the following examples.
Example 1
<1> Preparation of regenerating liver
-
Ten week-old F344/DvCrj (Fischer) rats were
etherized. The abdomen was incised, and the left lobe
and the intermediate lobe of the liver were extruded
from the incision. The liver was bound with sutures
between the left lobe and the intermediate lobe and
between the right lobe and the caudate lobe. The right
lobe and the caudate lobe were left in the body, and the
left lobe and the intermediate lobe were resected. Then,
the incision was closed with a suture. As for the
animals which were examined at 0 hour after the excision,
suturing was not performed, and the remaining liver was
successively extracted. The incision was opened again
at 1, 6, 12, 24 and 168 hours after the hepatectomy to
extract the remaining liver (regenerating liver). The
weight of the remaining livers (right lobe and caudate
lobe) was about 30% of the weight of the whole rat liver
(right lobe, left lobe, intermediate lobe and caudate
lobe).
-
Three liver regeneration model rats were prepared
for each group, and the remaining liver weight at the
time of extraction was measured. The weight was 2 ± 0.3
g (1.6 g) 0 hour after the excision, 1.7 ± 0.3 g (1.4 g)
1 hour after the extraction, 2.1 ± 0.5 g (2.1 g) 6 hours
after the extraction, 2.5 ± 0.5 g (3.0 g) 24 hours after
the extraction, 2.5 ± 0.5 g (2.0 g) 48 hours after the
extraction, and 5.6 ± 0.3 g (5.8 g) 7 days after the
extraction (the parenthesized numerical values are
weights of the regenerating livers used for the
measurement using a gene chip described later).
<2> Purification of total RNA
-
In a volume of 10 ml of ISOGEN (Nippon Gene) was
added to 1 g of rat liver, and the liver was homogenized.
The obtained homogenate was centrifuged to collect
supernatant. This supernatant was added with 200 µl of
chloroform per 1 ml of the added ISOGEN and lightly
stirred. The mixture was left at room temperature for 2
minutes and centrifuged at 15000 rpm at 4°C for 10
minutes, and the aqueous layer was transferred to a new
centrifuge tube. This aqueous layer was added with an
equivalent volume of 2-propanol, left at room
temperature for 5 minutes and centrifuged at 15000 rpm
at 4°C for 15 minutes. The supernatant was discarded,
and the precipitated pellet was added with 70% ethanol
and centrifuged at 15000 rpm at 4°C for 15 minutes. The
pellet was rinsed by removing the 70% ethanol. The
rinsed pellet was dried at room temperature for 5
minutes and added with DEPC (diethyl pyrocarbonate)-treated
water to dissolve the pellet. Purification of
the total RNA fraction obtained as described above was
confirmed by 1% agarose gel electrophoresis.
-
As described above, total RNA was purified from
each of the remaining livers (regenerating liver) at 0,
1, 6, 24, 48 and 168 hours after the partial hepatectomy
of rats, and changes in expression levels of various
genes were examined by using GeneChip (Affymetrix) and
ATAC-PCR.
<3> Gene expression analysis by GeneChip
-
Gene expressions were analyzed by using GeneChip
according to the protocol recommended by Affymetrix.
The procedure is shown below.
(1) Probe synthesis
(i) Synthesis of double-stranded cDNA
-
First, double-stranded cDNA was synthesized from
the total RNA prepared in <2> by using SUPERSCRIPT
Choice System produced by Gibco BRL. In an amount of 15
µg of total RNA and 100 pmol of T7-(dT)24 primer were
dissolved in DEPC-treated water to a volume of 11 µl. A
reaction was allowed at 70°C for 10 minutes, and then
the reaction mixture was cooled on ice, added with 4 µl
of 5 x 1st strand cDNA buffer (Gibco BRL), 2 µl of 0.1 x
DTT (dithiothreitol, Gibco BRL) and 1 µl of 10 mM dNTP
mix (Gibco BRL) and kept warm at 42°C for 2 minutes.
The reaction mixture was added with 2 µg of reverse
transcriptase (Superscript II RT) and allowed to react
at 42°C for 1 hour.
-
The aforementioned reaction mixture was added with
DEPC-treated water, 30 µl of 5 x 2nd strand reaction
buffer, 3 µl of 10 mM dNTP, 1 µl of 10 U/µl DNA ligase,
4 µl of 10 U/µl DNA polymerase I and 2 U/µl of RNase H
and allowed to react at 16°C for 2 hours. Then, the
reaction mixture was added with 2 µl of 5 U/µl T4 DNA
polymerase and allowed to react at 16°C for 5 minutes.
The reaction mixture was added with 10 µl of 0.5 M EDTA.
To this reaction mixture, an equal volume of a solution
(phenol:chloroform = 1:1) was added, and these were
mixed by vertically shaking the tube containing them.
This mixture was centrifuged at 15000 rpm at 4°C for 10
minutes, and the aqueous layer was transferred to a new
centrifuge tube. This aqueous layer was added with 1/10
volume of 3 M sodium acetate and 3-fold volume of 100%
ethanol and mixed well. The mixture was left at -80°C
for 10 minutes and then centrifuged at 15000 rpm at 4°C
for 10 minutes. The precipitated pellet was rinsed
twice with 70% ethanol, dried at room temperature for 5
minutes and then added with 12 µl of DEPC-treated water.
(ii) Synthesis of biotin-labeled cRNA probe
-
Subsequently, a biotin-labeled cRNA probe was
synthesized from the double-stranded cDNA synthesized as
described above by using Bio Array High Yield RNA
Transcript Labeling Kit produced by Enzo. In a volume
of 5 µl of double-stranded cDNA, 17 µl of DEPC-treated
water, 4 µl of 10 x HY buffer, 4 µl of 10 x biotin-labeled
ribonucleotide, 4 µl of 10 x DTT, 4 µl of 10 x
RNase inhibitor mix and 2 µl of 20 x T7 RNA polymerase
were mixed and allowed to react at 37°C for 4 hours.
-
Then, unreacted biotin-labeled ribonucleotides
were removed from the solution of the biotin-labeled
cRNA probe synthesized as described above by using
RNeasy produced by Qiagen. The biotin-labeled cRNA
probe solution was added with 160 µl of DEPC-treated
water, mixed with 700 µl of RLT buffer, then added with
500 µl of 100% ethanol and mixed well. In a volume of
700 µl each of this solution was added to an RNeasy mini
spin column and centrifuged at 8000 rpm for 15 seconds.
The eluted solution was added to the RNeasy mini spin
column again and centrifuged at 8000 rpm for 15 seconds.
Subsequently, 500 µl of RPE buffer was added to the
RNeasy mini spin column and centrifuged at 8000 rpm for
15 seconds. In a volume of 500 µl of RPE buffer was
added to the RNeasy mini spin column again and
centrifuged at 15000 rpm for 2 minutes.
-
The RNeasy mini spin column which was adsorbed
with the biotin-labeled cRNA probe and washed as
described above was transferred to a new centrifuge tube.
In a volume of 30 µl of DEPC-treated water was added to
the RNeasy mini spin column and left at room temperature
for 1 minute. The mixture was centrifuged at 8000 rpm
for 15 seconds to elute a purified biotin-labeled cRNA
probe solution.
-
Subsequently, the purified biotin-labeled cRNA
probe solution was fragmented. The biotin-labeled cRNA
probe solution and 5 x fragmentation buffer (1/5 volume
of the final solution volume was added) were mixed to
obtain a biotin-labeled cRNA probe concentration of 0.5
µg/µl and allowed to react at 94°C for 35 minutes. The
reaction mixture was subjected to 1% agarose gel
electrophoresis to confirm that the probe had been cut
into fragments having a length of about 100 bases.
(2) Hybridization
-
The fragmented biotin-labeled cRNA probe was first
evaluated by using a test chip (TEST2 Chip) to confirm
that the probe had no problem, and then the objective
test of hybridization was performed. Rat chip sets (RG-U34A,
RG-U34B, RG-U34C) were used for the objective test.
These 3 types of rat chip sets include 7000 types of
known rat genes and 17000 types of unknown genes in
total. Hybridization was performed by the following
procedure for the both cases using the test chip and the
rat chip sets.
-
In an amount of 60 µg of the fragmented biotin-labeled
cRNA probe, 12 µl of control oligonucleotide B2
(5 nM), 12 µl 100 x control cRNA cocktail, 12 µl of
herring sperm DNA (10 mg/ml), 12 µl of acetylated BSA
(50 mg/mg) and 600 µl of 2 x MES hybridization buffer
were added, and the total volume was adjusted to 1200 µl
with DEPC-treated water (referred to as "hybridization
cocktail" hereinafter). The hybridization cocktail was
heated at 99°C for 5 minutes to cause heat denaturation,
left at 45°C for 5 minutes and centrifuged at 15000 rpm
at room temperature for 5 minutes. For hybridization,
the supernatant was added in a volume of 80 µl to the
test chip (TEST2 Chip) or in a volume of 200 µl to each
of the rat chip sets (RG-U34A, RG-U34B, RG-U34C).
-
The GeneChip was returned to room temperature, and
prehybridization was performed with 1 x MES buffer (80
µl for the TEST2 chip and 200 µl for the rat chip sets)
at 60 rpm at 45°C for 10 minutes. Subsequently, the
prehybridization solution was removed, and the
aforementioned heat-denatured hybridization cocktail was
added. Hybridization was allowed at 45°C for 16 hours
at 60 rpm.
(3) Washing, staining and scanning
-
The hybridization cocktail was removed from the
GeneChip, and a non-stringent wash buffer was added to
perform washing and staining by using Fluidic Station
(Affymetrix). The washing and staining were performed
according to the Mini_euk1 protocol of Fluidic Station
for the TEST2 Chip and according to the EukGE-WS2
protocol for the rat chip sets. After the completion of
the washing and staining, the chip was scanned with a
scanner to obtain image data.
(4) Data analysis
-
Data analysis of the hybridization was performed
by using GeneChip Analysis Suite. The expression level
of each gene was represented by a relative value
(average difference) based on the average value of
expression levels of all the genes, which was taken as
100 (Table 1, (1) to (11)). In the table, the gene chip
probe set names are identification numbers for
management corresponding to the genes, which were
designated by Affymetrix. UniGene is a database of DNA
sequences registered at GenBank compiled according to
gene (transcription product) types and species.
-
The column of 0hr in the table shows the gene
expression levels in rat livers examined at 0 hour after
partial hepatectomy. Similarly, the columns of 1hr, 6hr,
24hr, 48hr and 7d show gene expression levels in rat
livers at 1, 6, 24, 48 hours and 7 days, respectively,
after partial hepatectomy. The values in the columns of
0hr/0hr, 1hr/0hr, 6hr/0hr, 24hr/0hr, 48hr/0hr and 7d/0hr
show relative values of gene expression levels at 0, 1,
6, 24, 48 hours and 7 days after partial hepatectomy
based on the gene expression level at 0 hour after
partial hepatectomy. The second decimal place of a
value was rounded off. Further, values of expression
levels of 0 or less were assumed as a value of 1 for
convenience to obtain the expression ratio.
-
To produce a gene panel, known genes (genes of
which sequence structures including all ORF had been
registered in the GenBank database excluding those only
of which partial sequences are known such as EST) were
used.
-
For 77 types of known genes, expression levels in
regenerating liver markedly increased as compared with
the expression levels in normal liver (increased about 3
times or more, shown in boldfaces in Table 1). For 60
types of known genes, expression levels in regenerating
liver markedly decreased as compared with the expression
levels in normal liver (decreased to about 1/3 or less,
shown in italics in Table 1). Among these, 7 types of
known genes showed marked expression increases as well
as decreases during liver regeneration. That is, marked
expression changes (increases or decrease of 3 times or
more from the expressions before hepatectomy) were
observed during liver regeneration for 137 types of
known genes.
| No. | GeneChip probe set | Rat UniGene No | Gene |
| 1 | U17254_g_at | Rn. 10000 | immediate early gene transcription factor NGFI-B |
| 2 | J05460_s_at | Rn.10737 | P-450 cholesterol 7-alpha-hydroxylase |
| 3 | E01524cds_s_at | Rn.11359 | NADPH-cytochrome P450 redutase |
| 4 | AF030091 UTR#1_g_at | Rn.12962 | cyclin ania-6a |
| 5 | rc_Al1171231_at | Rn.16393 | amino acid transporter system A (ATA2) |
| 6 | rc_Al070318_at | Rn.17145 | connective tissue growth factor |
| 7 | M58587_at | Rn.1716 6 | Interieukin 6 receptor |
| 8 | AF036335_g_at | Rn.1926 | NonO/p54nrb homolog |
| 9 | D12769_g_at | Rn.19481 | BTE binding protein (same as 105-E9,126-A2) |
| 10 | rc_Al103604_at | Rn.19491 | deubiquitinating enzyme Ubp45 (ubp45) |
| 11 | rc_AA900505_at | Rn.2042 | rhoB |
| 12 | rc_AA849767_at | Rn.20670 | brain-enriched SH3-domain protein |
| 13 | rc_Al137820_at | Rn.22129 | CYR61 |
| 14 | rc_AA849718_g_at | Rn.2648 | interferon-inducible protein 16 |
| 15 | rc_Al101099_at | Rn.2714 | Metallothionein2 |
| 16 | M60921_at | Rn.27923 | B-cell translocation gene 2, anti-proliferative (PC3) |
| 17 | rc_Al008836_s_at | Rn.2874 | high mobility group protein 2 |
| 18 | S74351 s_ at | Rn.31120 | protein tyrosine phosphatase (dual specificity phosphate) |
| 19 | D37920_at | Rn.33239 | squalene epoxidase |
| 20 | M58634_at | Rn.34026 | Insulin-like growth factor binding protein 1 |
| 21 | rc_Al014163_at | Rn.3723 | interferon-related developmental regulator 1 (PC4) |
| 22 | AF020618_g_at | Rn.37483 | progression elevated gene 3 protein |
| 23 | rc_AA900348_s_at | Rn.40138 | tip associating protein (TAP) |
| 24 | rc Al072078_at | Rn.42905 | protein kinase KID2 (Kid2) |
| 25 | X54686cds_at | Rn.44317 7 | pJunB |
| 26 | J03190_at | Rn.6274 | 5-ar-rinotevulinate synthase |
| 27 | S77528cds_s_at | Rn.6479 | rNFIL-6=C/EBP-related transcription factor (C/EBP-beta) |
| 28 | AF023087_s_at | Rn.9096 | nerve growth factor induced factor A (Early growth response 1) |
| 29 | L27843_s_at | Rn.9459 | tyrosine phosphatase (PRL-1) |
| 30 | L41275cds_s_at | Rn.10089 | p21(WAF1) |
| 31 | rc_Al236828_s_at | Rn.10247 | Signal transducer and activator of transcription 3 |
| 32 | X68101_at | Rn.10431 | trg |
| 33 | M33962_g_at | Rn.11317 7 | Protein-tyrosine phosphatase |
| 34 | rc_Al234949_at | Rn.12262 | phocein protein |
| 35 | S85184_at | Rn.1294 | Cyclic Protein-2=cathepsin L proenzyme |
| 36 | 3AF063447_at | Rn.14550 | nuclear RNA helicase |
| 37 | M12919mRNA#2_at | Rn.1774 | Aldolase A fructose-bisphosphate |
| 38 | L23148_g_ at | Rn.2113 | Inhibitor of DNA binding 1, helix-loop-helix protein (splice variaton) |
| 39 | U21871_at | Rn.2143 | outer mitochondrial membrane receptor rTOM20 |
| 40 | X16038exon_s_at | Rn.25737 | alkaline phosphatase |
| 41 | X62952_at | Rn.271 0 | vimentin |
| 42 | M24067_at | Rn.29367 | Plasminogen activator inhibitor |
| 43 | J02722cds_at | Rn.3160 | heme oxygenase |
| 44 | X58828_at | Rn.33497 | PTP-S mRNA for protein-tyrosine phosphatase |
| 45 | 016309_at | Rn.3483 | cyclin D3 |
| 46 | rc_AA892014_s_at | Rn.351 6 | liver nuclear protein p47 |
| 47 | U33500_g_at | Rn.37873 | retinol dehydrogenase type II |
| 48 | J00692_at | Rn.39438 | skeletal muscle alpha-actin |
| 49 | U75404UTR#1_s_at | Rn.42891 | Ssecks 322 (PKC binding protein) |
| 50 | U42627_at | Rn.431 3 | dual-specificity protein tyrosine phosphatase (rVH6) |
| 51 | rc_AA997933_at | Rn.43930 | Nopp140 associated protein (NAP65) |
| 52 | M14369exon#2_at | Rn.44576 | K-kininogen, differential splicing leads to HMW Kngk |
| 53 | Y14933mRNA_s_at | Rn.4881 2 | hepatocyte nuclear factor 6 beta |
| 54 | rc_AA900769_s_at | Rn.6321 | smooth muscle alpha-actin |
| 55 | rc_Al 146033_at | Rn.8459 | small zinc finger-like protein (TlM9a) |
| 56 | rc_Al176376_s_at | Rn.8925 | ATPase Na+/K+ transporting beta 1 polypeptide |
| 57 | rc_Al230712_at | Rn.950 | Subtilisin - like endoprotease |
| 58 | AB000717exons#1-8_s_at | Rn.9855 | non-hepatic-type S-adenosylmethionine synthetase |
| 59 | M24604_at | Rn.223 | proliferating cell nuclear antigen (PCNA/cyclin) mRNA |
| 60 | rc_AA860030_s_at | Rn.2458 | class I beta-tubulin |
| 61 | S80431_s_at | Rn.2571 6 | delta 4-3-ketosteroid 5 beta-reductase |
| 62 | J03786_s_at | Rn.2586 | Cytochrom P450 15-beta gene |
| 63 | rc_Al639082_s_at | Rn.33226 | mini chromosome maintenance deficient 6 |
| 64 | rc_AA818524_at | Rn.3611 5 | hnRNP protein, partial |
| 65 | rc_AA998683_g_at | Rn.3841 | Rat heat shock protein (Hsp27) |
| 66 | M33329 f at | Rn.40124 | hydroxysteroid sulfotransferase a (STa) |
| 67 | rc_Al231821 at | Rn.555 | Leukemia-associated cytosolic phosphoprotein stathmin |
| 68 | U64030_at | Rn.6102 | dUTPase |
| 69 | M22670cds_g_at | Rn.780 | alpha-2-macroglobulin |
| 70 | D14014_at | Rn.947 1 | cyclin D1 |
| 71 | L15079mRNA_s_at | Rn.9679 | P-glycoprotein 3/ multidrug resistance 2 |
| 72 | VO1227_s_at | Rn.3441 | alpha-tubulin |
| 73 | M37584_at | Rn.3636 | Rat histone (H2AZ) |
| 74 | rc_AA946368_at | Rn.3790 | FAT |
| 75 | rc_Al230970_f_at | Rn.11229 | Hemoglobin, alpha 1 |
| 76 | rc_AA925864_at | Rn.32702 | aldose-reductase-like protein MVDP/AKR1-B7 |
| 77 | D14989_f_at | Rn.40365 | hydroxysteroid sulfotransferase subunit |
| 78 | rc_Al234295_at | Rn.16933 | type IIb sodium-phosphate transporter |
| 79 | rc Al234100_f_at | Rn.2401 | cysteine rich protein |
| 80 | M11794cds#2_f_at | Rn.271 4 | Metallothionein 1(same as 6-E2) |
| 81 | J05210_at | Rn.29771 | ATP citrate lyase |
| 82 | AF089825_at | Rn.30020 | activin beta E |
| 83 | rc_AA943735_at | Rn.32110 | glycine transporter |
| 84 | X05684_at | Rn.48821 | Pyruvate kinase, liver and RBC |
| 85 | rc_Al009273_s_at | Rn.9486 | fatty acid synthase |
| 86 | M96601_at | Rn.9968 | taurine/beta-alanine transporter |
| 87 | L16995_at | | add1(helix-loop-helix protein associated with adipocyte determination and differentiation) |
| 88 | X91234_at | Rn. 10515 | 17-beta hydroxysteroid dehydrogenase type 2 |
| 89 | L37333_s_at | Rn.10992 | glucose-6-phosphatase (G6Pase) |
| 90 | D43964_at t | Rn.11129 | bile acid-Coenzyme A dehydrogenase: amino acid n-acyltransferase |
| 91 | X74593_at | Rn.11334 | Sorbitol dehydrogenase |
| 92 | rc_AA852046_s_at | Rn.11350 | VL30 element (same as 12-C10) |
| 93 | rc_ AA892553_at | Rn.12592 | signal transducer and activator of transcription (Stat1) |
| 94 | rc_Al113166_s_at | Rn.15739 | Apolipoprotein C-IV |
| 95 | rc_ AA818627_at | Rn.16736 | ISI1 RAT INSULIN-INDUCED PROTEIN 1 |
| 96 | AB016800_g_at | Rn.228 | 7-dehydrocholesterol reductase |
| 97 | rc_Al233209_ at | Rn.24561 | CDK108 |
| 98 | rc_AA893485_at | Rn.31772 | Glu-Pro dipeptide repeat protein |
| 99 | M95591_at | Rn.3252 | famesyl diphosphate farnesyl transferase 1 |
| 100 | L25785_at | Rn.3545 | Transforming growth factor beta stimulated clone 22 |
| 101 | D17370_at | Rn.3881 | cystathionine gamma-lyase |
| 102 | AJ011656cds s at | Rn.451 3 | claudin 3 |
| 103 | rc Al177004_s_at | Rn.5106 | 3-hydroxy-3-methylglutaryl-Coenzyme A synthase 1 |
| 104 | rc Al172293 at | Rn.716 7 | RANP-1 |
| 105 | rc AA957498_at | Rn.8548 | androgen-inducible aldehyde reductase |
| 106 | rc_Al232087_at | Rn.A 10417 7 | (S)-2-hydroxy acid oxidase |
| 107 | M18363cds_s_ at | Rn.10870 | Cytochrome P450, subfamily IIC (mephenytoin 4-hydroxylase) |
| 108 | J02585_at | Rn.10982 | liver stearyl-CoA desaturase |
| 109 | rc_Al044610_s_at | Rn.11064 | Dopa decarboxylase (aromatic L-amino acid decarboxylase) |
| 110 | X06150cds. g_at | Rn.11142 | glycine methyltransferase |
| 111 | J05031 _g_at | Rn.147 | Isovaleryl Coenzyme A dehydrogenase |
| 112 | rc_AA925393_at | Rn.1551 6 | acetyl-coenzyme A carboxylase |
| 113 | rc_AA926200_at | Rn.1568 1 | aldehyde oxidase (female form) |
| 114 | AF037072_at | Rn.1647 | carbonic anhydrase 3 |
| 115 | rc AA819899_at | Rn.1829 | transcobalamin II precursor (TCII) |
| 116 | M22359mRNA s_at | Rn.1911 1 | plasma proteinase inhibitor alpha-1-inhibitor III |
| 117 | K00996rnRNA_s_at | Rn.2287 | cytochrome p-450e (2b19(Cyp2b15)) |
| 118 | M59861_at | Rn.2328 | 10-formyltetrahydrofolate dehydrogenase |
| 119 | rc_Al169656_at | Rn.23348 | organic anion transporter 3 |
| 120 | X14552 at | Rn.33965 | Caldesmon 1 |
| 121 | Y07534cds_s_at | Rn34396 | Serine protease inhibitor (cytochrome P451 c27/25) |
| 122 | J02827_g_at | Rn3489 | Branched chain alpha-ketoacid dehydrogenase subunit E1 alpha |
| 123 | K03249_at | Rn3671 | peroxisomal enoyl-CoA- hydrotase-3-trycroxyacyl-CoA bifunctional enzyme |
| 124 | rc_Al639418_at | Fh42914 | type I thyroxine deiodinase |
| 125 | U88036_at | Rn5641 | brain digoxin carrier protein |
| 126 | X65296cds_s_at | Rn6066 | carboxylesterase (Es-HVEL (cholesterol esterase) |
| 127 | D10354_s_at | Rn6318 | alanine aminotransferase |
| 128 | rc_Al144586_at | Rn8415 | evectin-1 (EVT1) |
| 129 | M84719_ at | Rn867 | flavin-containing monooxygenase 1 (FMO-1) |
| 130 | K01934mRN4#2_at | Rn9854 | Thyroid hormone responsive protein (spot14) |
| 131 131 | M77479 at M77479_at | Rn9913 Rn9913 | Solute carrier family 10 (sodium/bile acid cotransporter family), member 1 |
| 132 | J03863_at | Rn9918 | serine dehydratase (SDH2) |
| 133 | L22339_g_at | Rn9937 | N-hydroxy-2-acetylaminofluorene (ST1C1) |
| 134 | X79081 mRNA_f_at | | p450CYP2C11 gene for cytochrome |
| 135 | rc_AA945418_at | Rn23013 | sterol 12alpha-hydroxylase P450 |
| 136 | rc_Al231076_at | Rn3572 | IBP4_RAT INSULIN-LIKE CROWTH FACTOR BINDING PROTEIN 4 PRECURSOR |
| 137 | U10697_s_at | Rn10050 | kidney microsomal carboxylesterase |


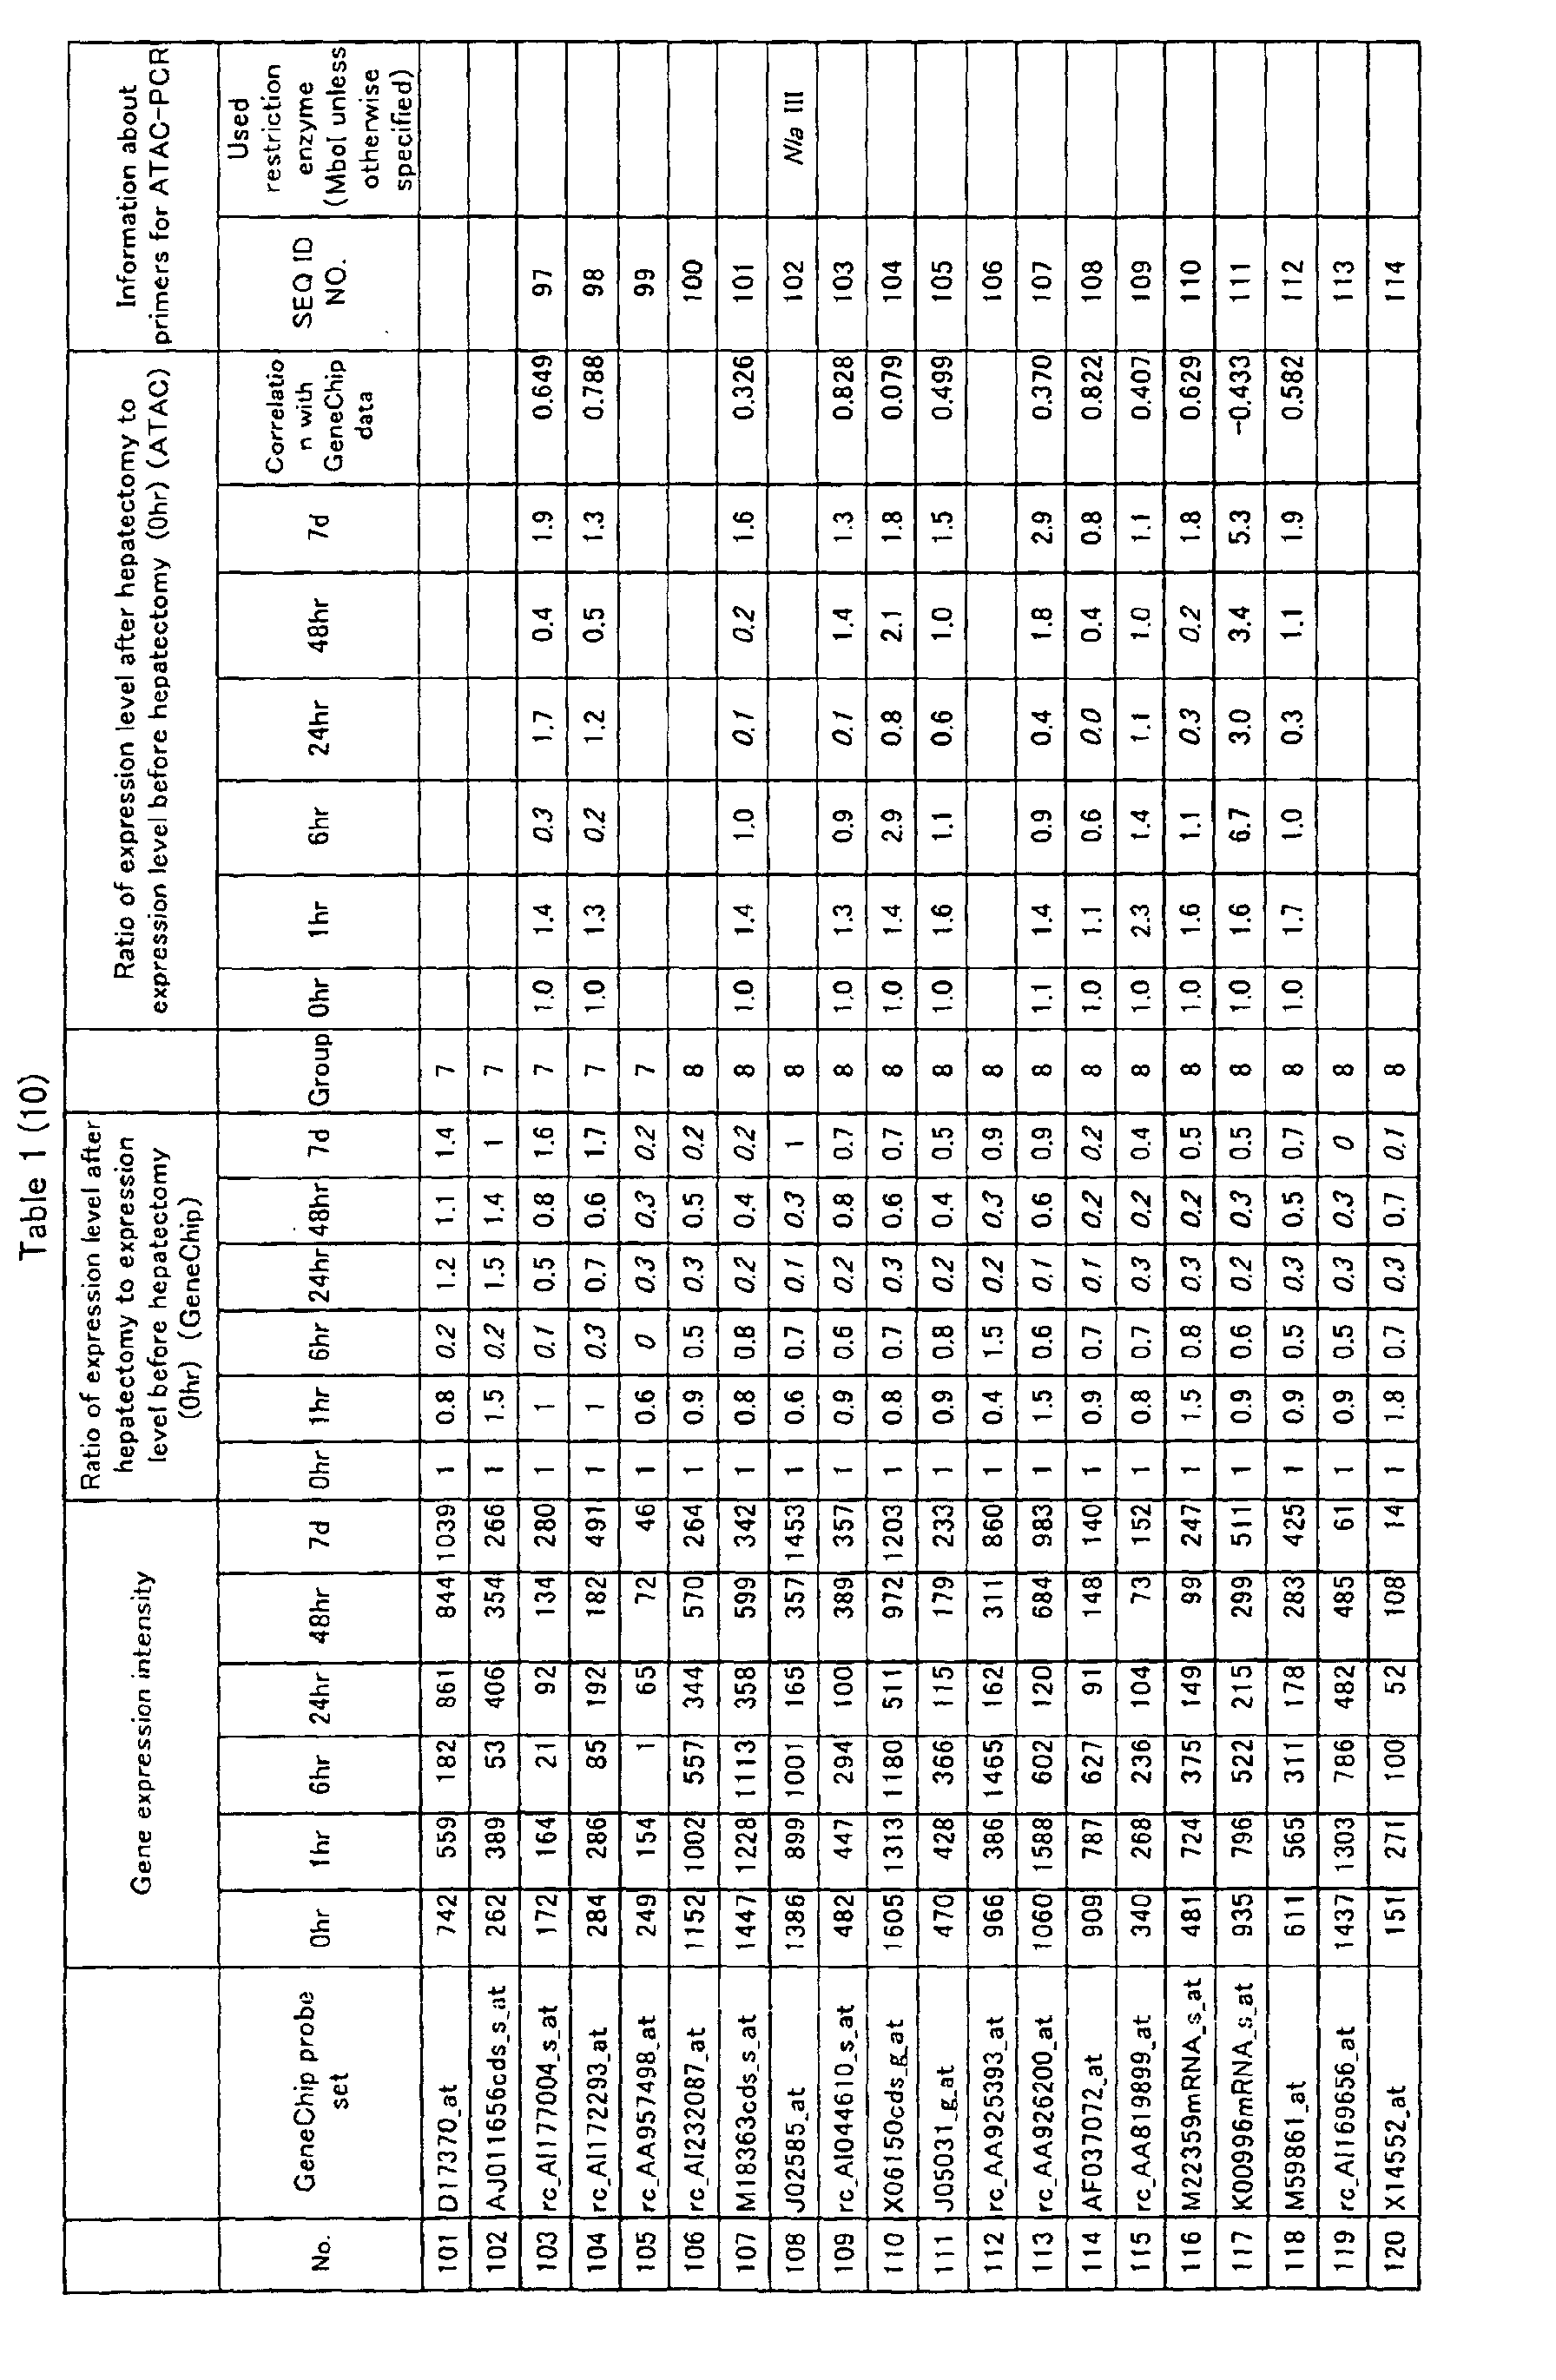

<4> Gene expression analysis by ATAC-PCR
-
ATAC-PCR is a technique developed by Kato et al.
(Kato, K et al., Nucl. Acids Res., 25, 4694-4696, 1997)
and based on competitive RT-PCR using fluorescent
primers. Quantitative expression analysis of a large
number of genes can be conveniently carried out by ATAC-PCR.
The experimental procedure of the ATAC-PCR method
was according to the method of Kato et al. (Kato, K et
al., Nucl. Acids Res., 25, 4694-4696, 1997).
-
First, double-stranded DNA was synthesized from
cDNA synthesized by using a 5' biotinylated oligo dT
primer and digested with a particular restriction enzyme
(example utilizing MboI is explained herein).
Subsequently, an adaptor having the same end sequence as
that of the site digested with the restriction enzyme (6
types having different lengths were prepared) and the
double-stranded DNA digested with the restriction enzyme
MboI were ligated with DNA ligase. Among the 6 types of
adaptors, 3 types were ligated to control cDNA (cDNA
prepared from rat liver before hepatectomy) and mixed at
a ratio of 10:3:1. The remaining 3 types of adaptors
were ligated with cDNA prepared from the rat liver at 1,
6, 24, 48 hours and 7 days after the hepatectomy.
-
The ligation reaction products were mixed, 3'
fragments of the double-stranded cDNA were recovered by
using streptavidin-coated beads, and competitive RT-PCR
was performed by using primers having a sequence common
to all of the adaptors. The PCR products were analyzed
by using ABI PRISM 3700 DNA Analyzer. This apparatus
can separate fragments at each length by capillary
electrophoresis and detect fluorescence intensity
proportional to each expression level.
-
A calibration curve was prepared from fluorescence
intensity of the PCR products obtained from the control,
and gene expression change amounts in resected liver to
be measured were calculated by using the calibration
curve.
-
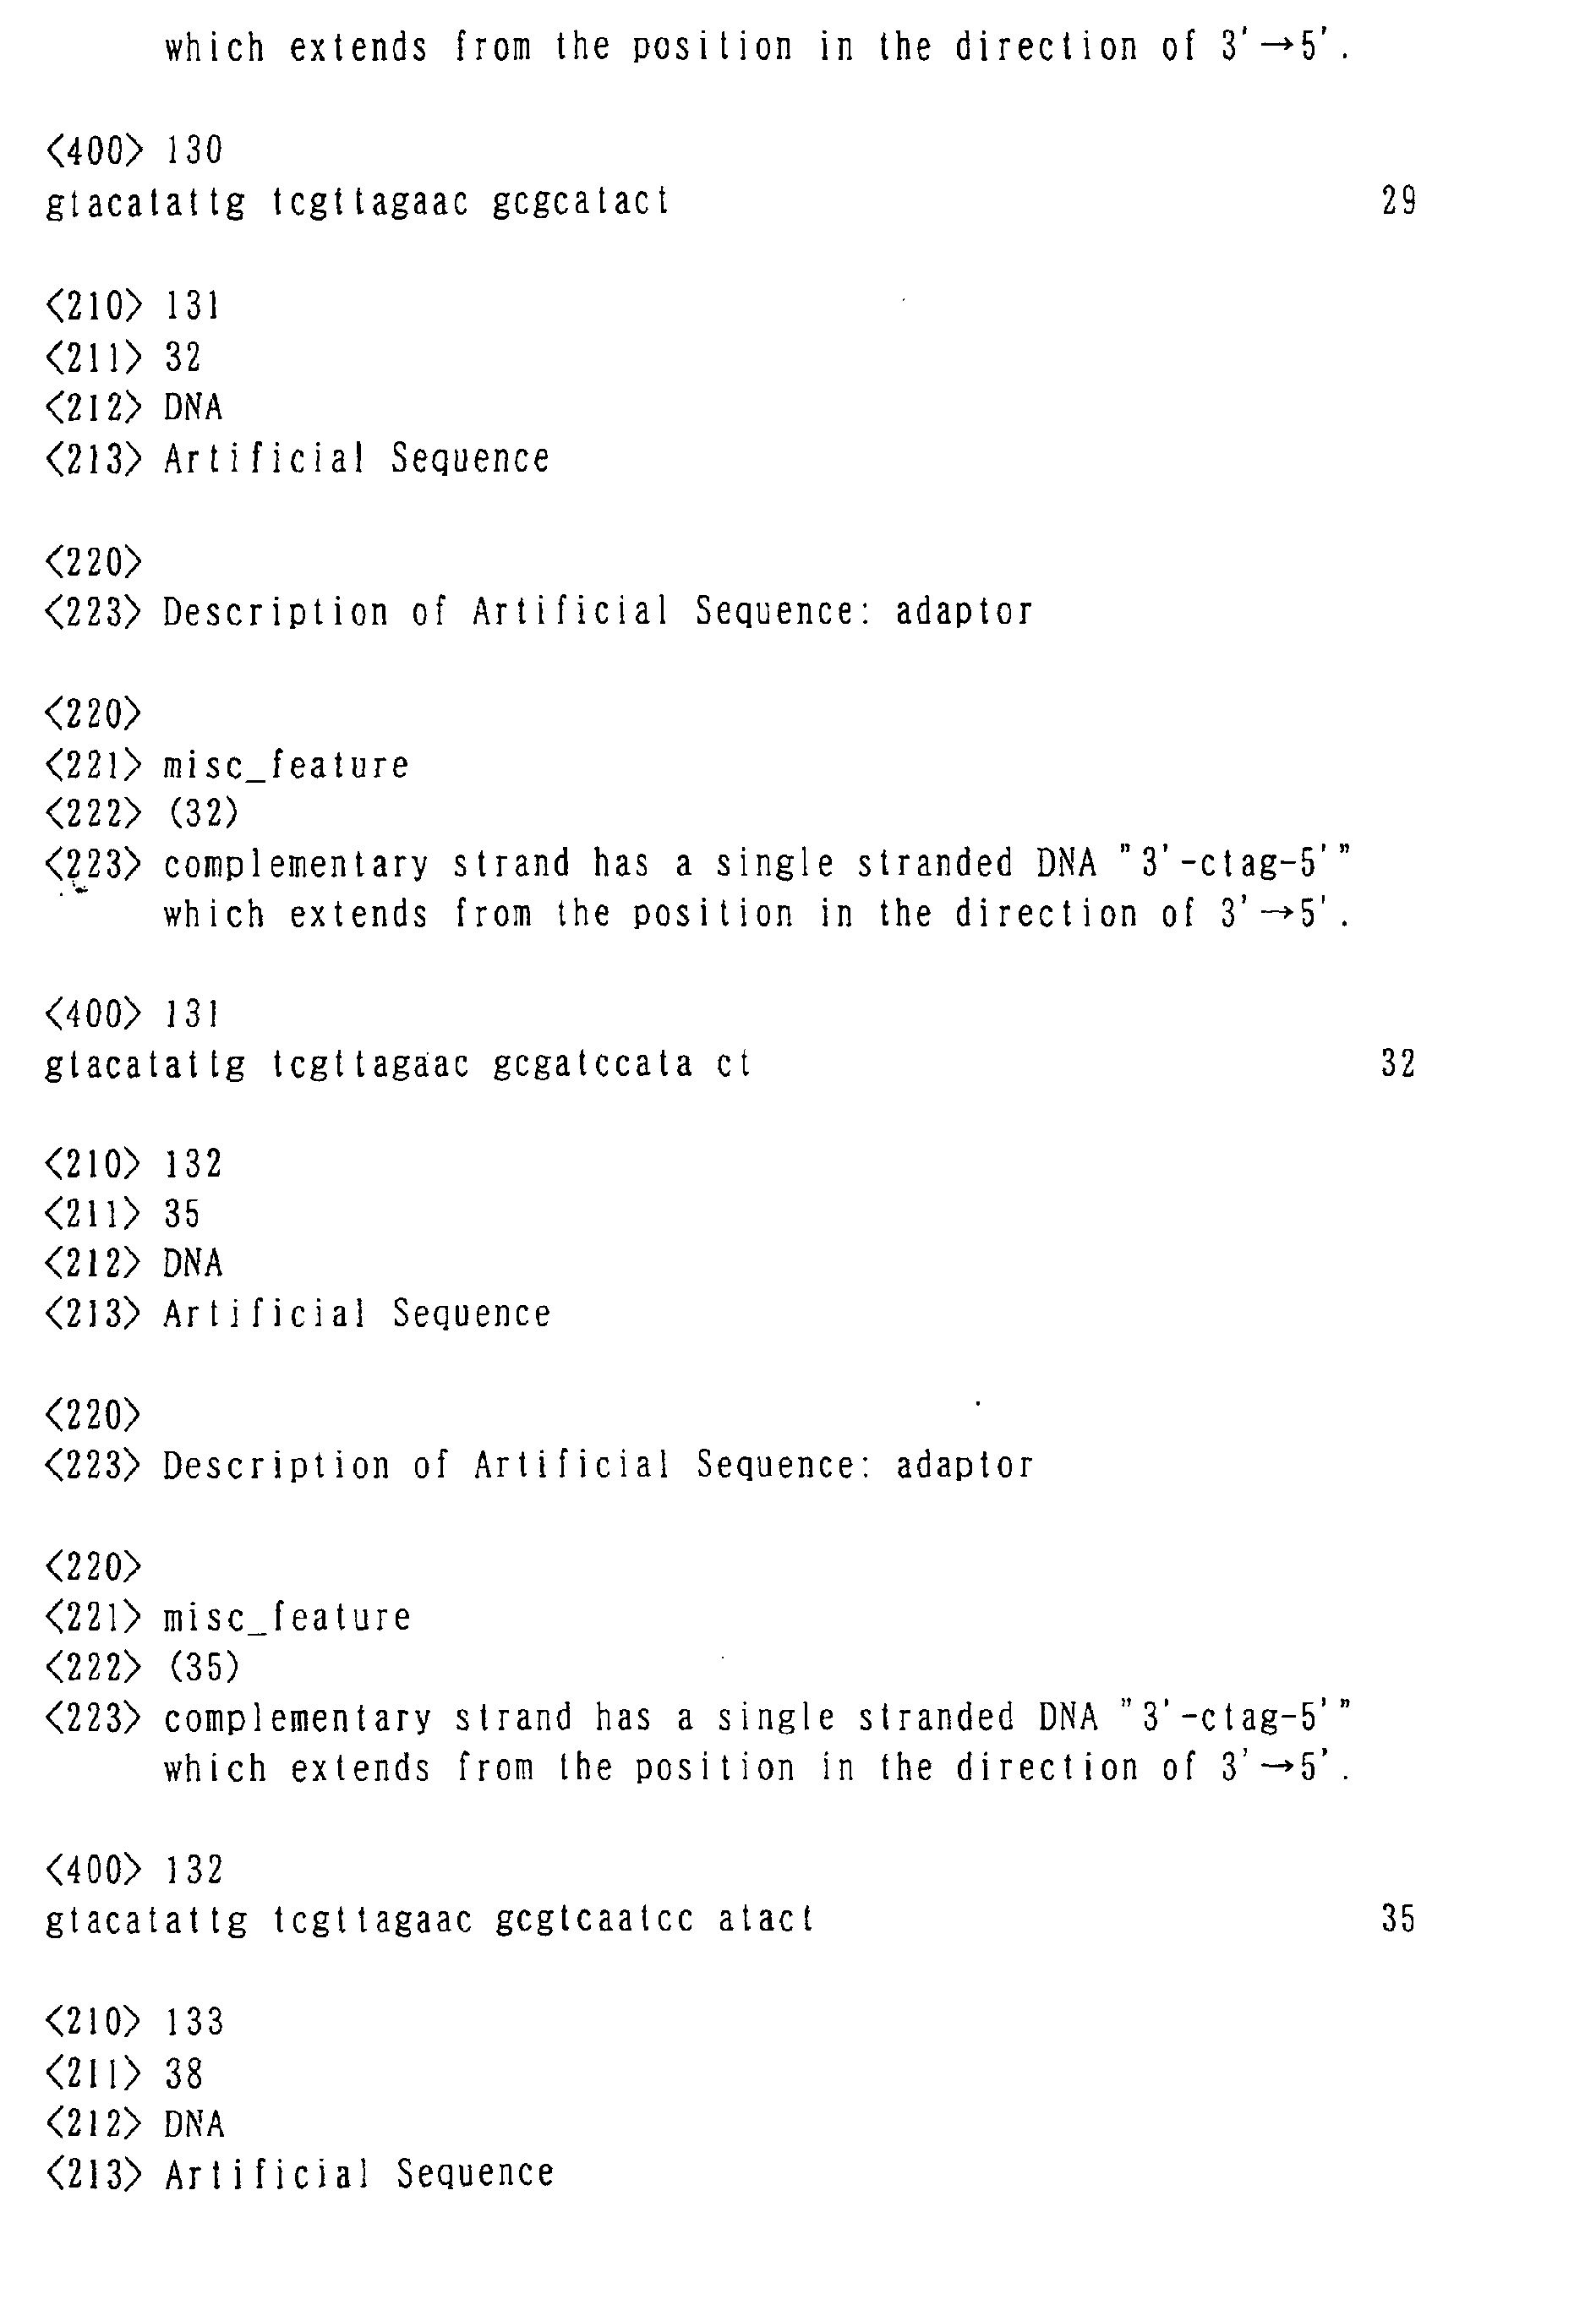
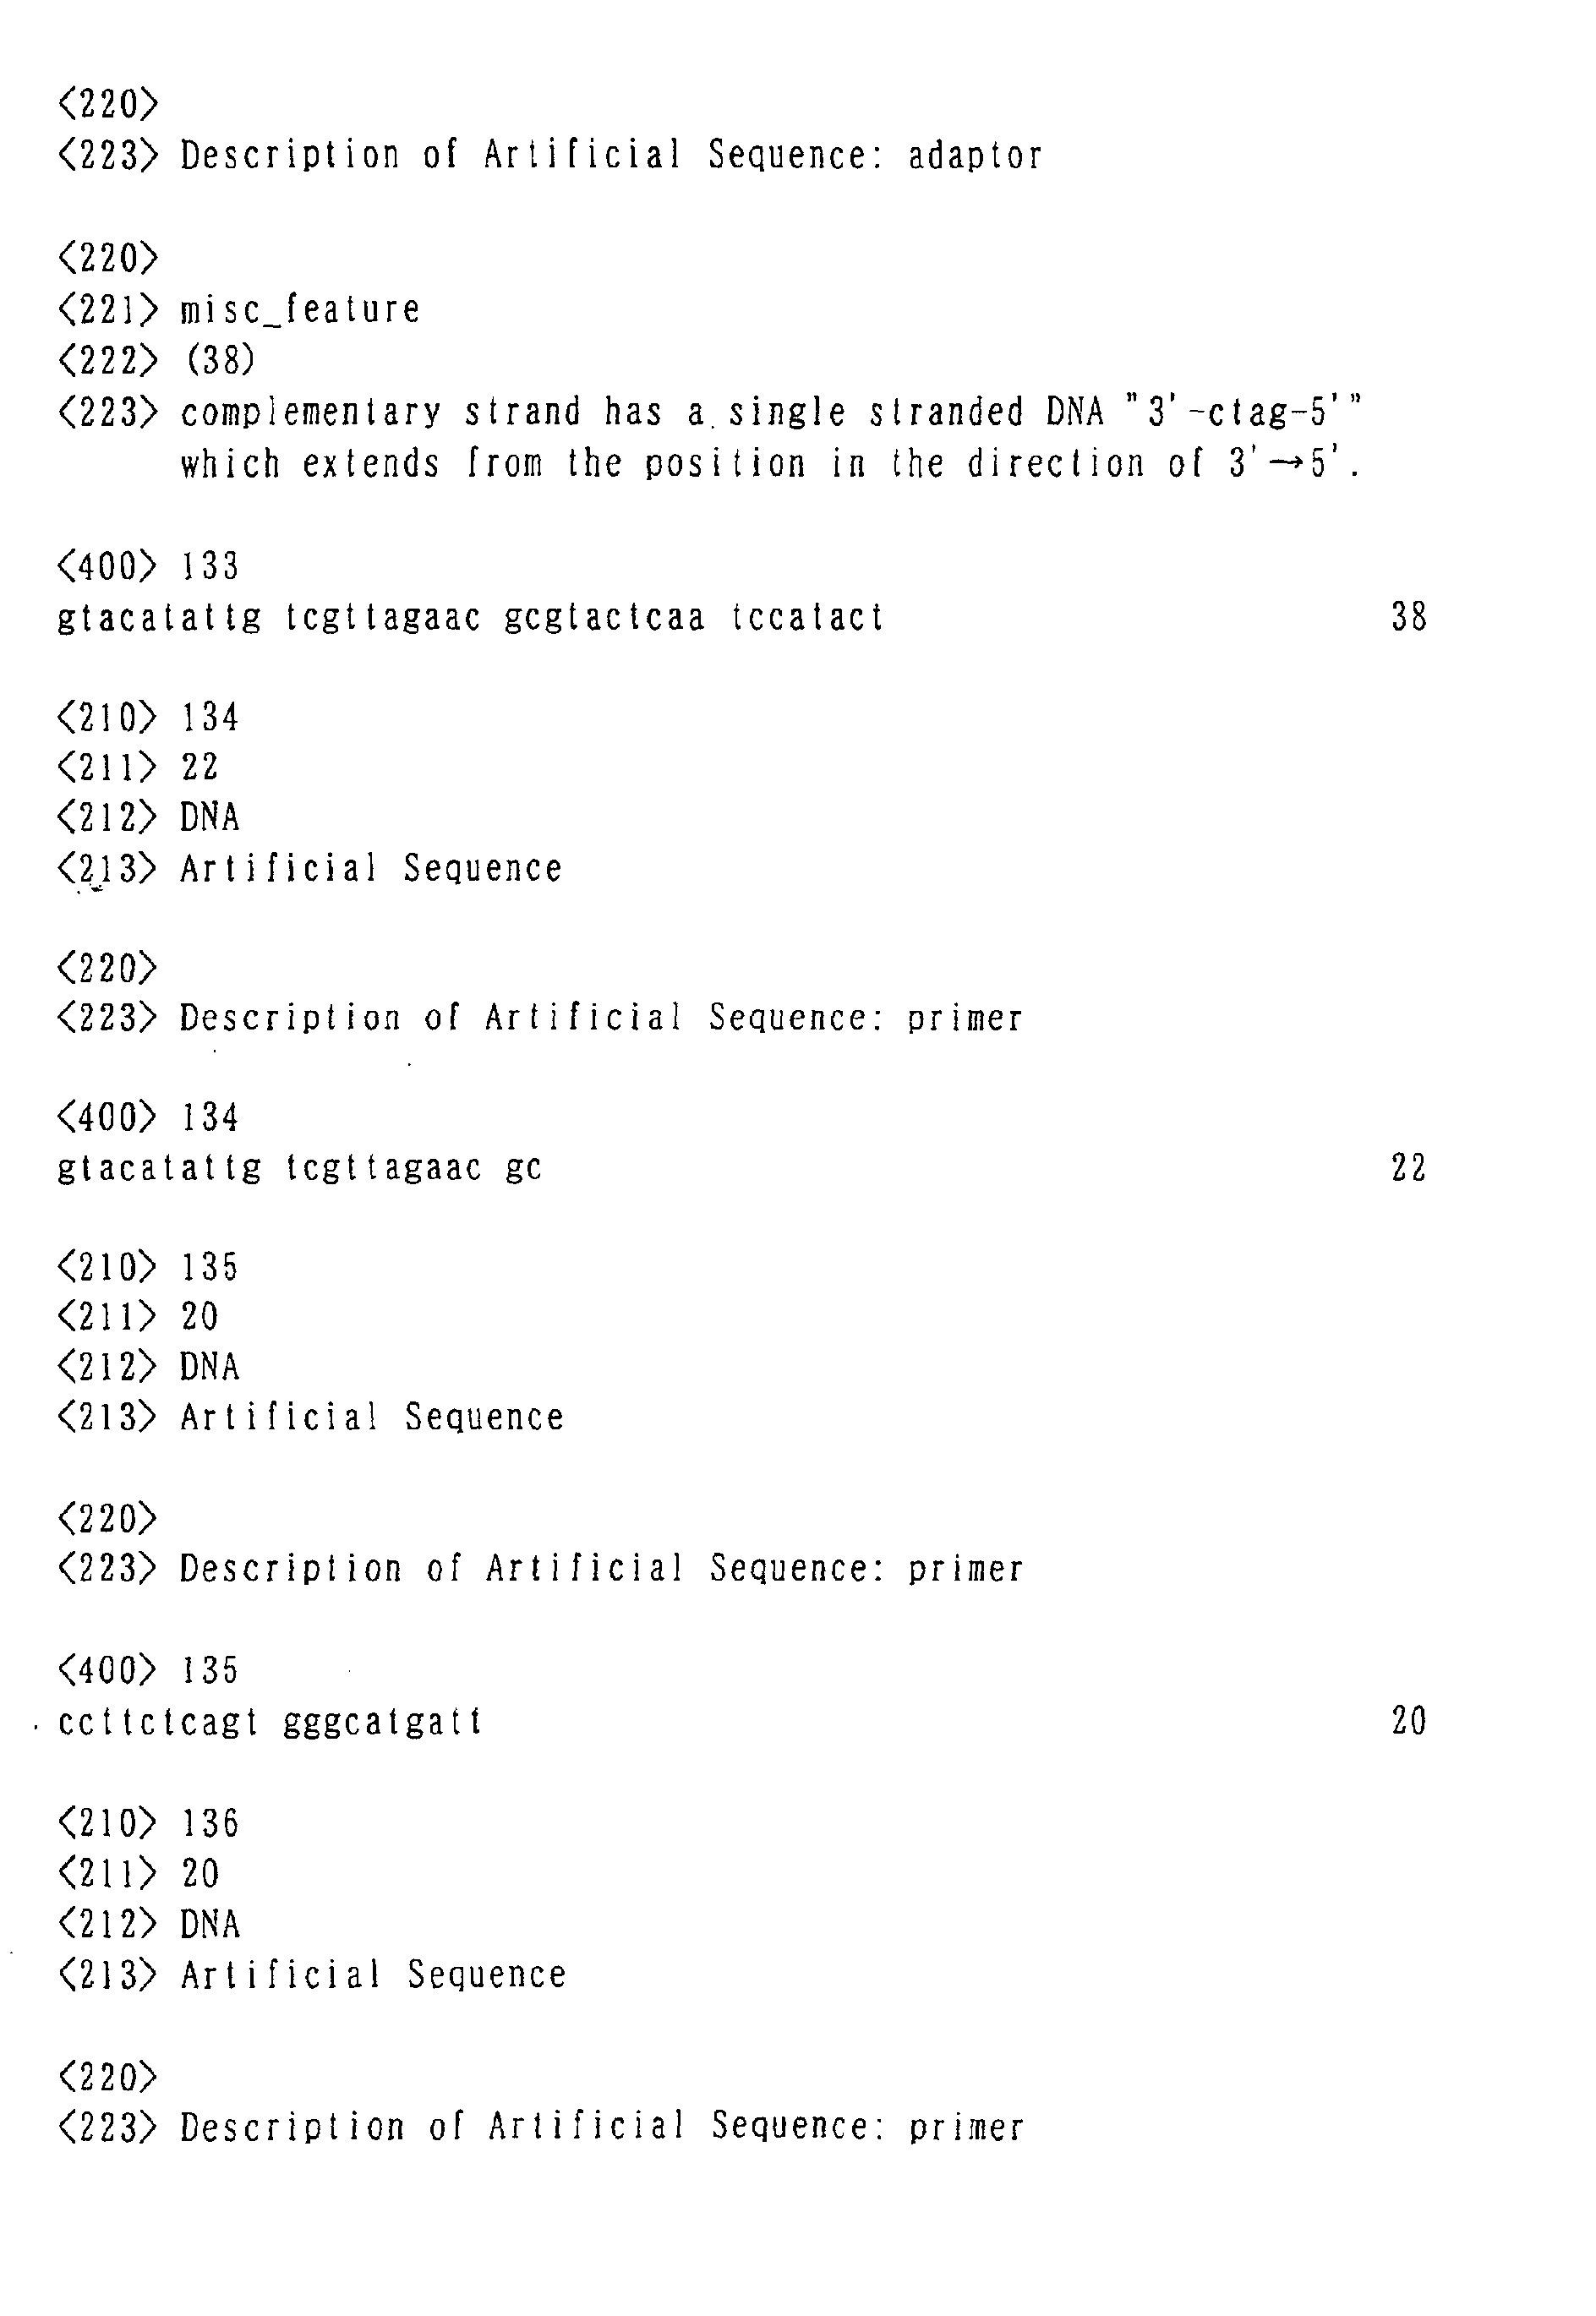
The nucleotide sequences of the used adaptors are
shown below.
(Adaptor 1, SEQ ID NO: 128)
(Adaptor 2, SEQ ID NO: 129)
(
Adaptor 3, SEQ ID NO: 130)
(Adaptor 4, SEQ ID NO: 131)
(
Adaptor 5, SEQ ID NO: 132)
(Adaptor 6, SEQ ID NO: 133)
-
As for the primer set used for the competitive PCR,
the primer having the following nucleotide sequence was
commonly used for the adaptor-side of all genes, and the
sequences shown in Table 1 and Sequence Listing (shown
in a direction from 5' to 3') were used as gene-specific
primers.
(Adaptor-side primer)
-
For the genes of which expression changes were
examined by ATAC-PCR using restriction enzymes other
than MboI, names of the used restriction enzymes are
shown in Table 1. Further, in such cases, adaptor
sequences having an end sequence different from that
used for MboI were used. Fig. 1 shows sequences of the
different portions (boldfaces).
<5> Application of gene panel to screening for candidate
liver regeneration accelerating substance
-
An experiment was performed to demonstrate that
the gene panel of the present invention was effective
for screening for liver regeneration accelerating
substances.
-
L-alanine is known to have effect of accelerating
liver regeneration (Maezono K et al., Hepatology 24(5),
1996, Effect of Alanine on D-Galactosamine-Induced Acute
Liver Failure in Rats; Japanese Patent Laid-open
Publication No. 5-229940). Therefore, rats were
subjected to partial hepatectomy and orally administered
with L-alanine at 18 and 21 hours after the hepatectomy,
and then gene expressions at 24 hours after the
hepatectomy were examined.
-
Five 6 week-old F344 male rats (120 g) were
preliminarily fed for 6 days by giving feed CRF-1
(Oriental Yeast) and water and then divided into 2
groups (Group 1 and Group 2) each consisting of rats
with the same body weight. At 24 hours before
dissection, 70% partial hepatectomy was performed by the
method by Higgins-Anderson (Higgins, GM and Anderson, RM,
Arch. Pathol. 12, 186-191, 1931). On the day of autopsy,
the rats were starved for 6 hours before dissection. At
6 and 3 hours before dissection, 2 g/10 ml/kg of L-alanine
was orally administered as an aqueous solution
containing 0.3% aqueous carboxymethylcellulose (CMC).
-
After the rats were killed by bleeding under
anesthesia, the dissection was performed. Liver was
extracted, weighed, cryopreserved, and then subjected to
the mRNA expression measurement by the ATAC-PCR method.
Further, liver samples were prepared to measure the
liver proliferating cell nucleus antigen (PCNA) levels.
-
Gene expressions in rat liver in each group were
measured by ATAC-PCR. The preparation of RNA and ATAC-PCR
were performed as described above. In ATAC-PCR,
among the genes in the gene panel, 117 types of which
expression could be measured by ATAC-PCR using the
restriction enzyme MboI were measured (those except for
Nos. 12, 49, 52, 55, 58, 59, 61, 69, 73, 77, 83, 90, 93,
101, 102, 108, 130, 134, 135 and 136 mentioned in Table
1).
-
Further, the livers of rats administered with L-alanine
were stained by using anti-PCNA antibodies
(antibodies directed to proliferating cell nuclear
antigen (PCNA), a replication factor that accelerates
activity of DNA polymerase a), and the PCNA labeling
index was measured by the method of Tanaka et al.
(Tanaka et al., Byori to Rinsho, 9 (6): 791-798, 1991).
-
The measurement results of the PCNA labeling index
are shown in Table 2. Due to the L-alanine
administration, the PCNA labeling index in the livers
elevated as compared with the livers of the non-administered
rats (Table 2). In Table 2, Ala+
represents the L-alanine-administered group, and Ala-represents
the L-alanine non-administered group. Thus,
hepatocytes proliferation accelerating effect due to the
L-alanine administration was observed.
| | PCNA positive cells | PCNA Negative cells | Labeling Index (%) |
| 1-1 | 4 | 570 | 0.7% |
| 1-2 | 5 | 578 | 0.9% |
| 1-3 | 2 | 658 | 0.3% |
| Mean | | | 0.6% |
| SD | | | 0.3% |
| 2-1 | 468 | 247 | 65.5% |
| 2-2 | 426 | 240 | 64.0% |
| Mean | | | 64.7% |
| SD | | | 1.1% |
1-1 to 1-3: Group 1
2-1, 2-2: Group 1 |
-
Further, the gene expressions in Groups 1 and 2
were measured by ATAC-PCR for the genes of the gene
panel and compared. The expression levels were obtained
as relative values of Group 1 based on the values of
Group 1 (Ala+/Ala- in Table 3). As a result, there were
found 7 types of genes which showed 3 times or more of
expression diffence between the L-alanine-administered
group and L-alanine non-administered group (Table 3).
| Number | Ala+, 24hr/Ala-, 24hr |
| 5 | 4.8 |
| 17 | 5.5 |
| 36 | 4.6 |
| 46 | 4.4 |
| 67 | 4.2 |
| 68 | 3.5 |
| 117 | 3.2 |
-
Subsequently, to compare expression changes of the
genes in the gene panel and gene expression changes due
to the L-alanine administration, the ratios of
expressions of the genes in Group 2 to expressions of
the genes in the gene panel at 0 hour after the
hepatectomy were calculated. The results are shown in
Table 4. In Table 4, 1hr, 6hr, 24hr, 48hr and 7d
represent relative expression values in the remaining
livers based on the gene expression in the liver before
the hepatectomy at 1, 6, 24, 48 hours and 7 days after
the hepatectomy, respectively. When the expression
values of Ala- at 24hr and Ala+ at 24hr are compared,
marked differences (3 times or more) in the expression
levels were observed in both of Groups 1 and 2 for 7
types (Nos. 5, 17, 36, 46, 67, 68 and 117) among the
genes in the gene panel (Table 4). Among these, the
results of 5 types (Nos. 17, 36, 46, 67 and 68)
corelated with the results of the genes in the gene
panel. That is, for the genes in the gene panel which
showed expression increases from the levels before the
hepatectomy at 24 hours, expressions exceeding the
increased expressions were observed due to the L-alanine
administration. On the contrary, for the genes in the
gene panel which showed expression decreases from the
levels before hepatectomy at 24 hours, the expressions
less than the decreased expressions were observed due to
the L-alanine administration.
-
For the remaining 2 types ( Nos. 5 and 117) other
than the above, the genes of the gene panel did not show
increased or decreased expression change due to the L-alanine
administration at 24 hours. However, for No. 5,
expression increase was observed due to the L-alanine
administration at the maximum expression times (6 hr and
1 hr). As a result, it can be construed that
expressions higher than the expressions of the genes in
the gene panel were maintained at 24 hours. On the
other hand, since No. 117 showed decreased change
(decrease of expression) with the L-alanine
administration compared with that observed without L-alanine
administration at 24 hours, it is determined
that it is not suitable for use in screening for
candidate liver regeneration accelerating substance.
| Number | Ala- | Ala+ |
| | 1hr | 6hr | 24hr | 48hr | 7d | 24hr | |
| 5 | 10.3 | 14.1 | 1 | 1.4 | 2.3 | 4.8 |
| 17 | 10 | 8.3 | 41.5 | 61.3 | 28 | 228.3 |
| 36 | 1 | 3.2 | 5.6 | 5.4 | 3.3 | 25.8 |
| 46 | 1.3 | 5.4 | 2.6 | 4.3 | 3.2 | 11.4 |
| 67 | 1.5 | 0.4 | 6.1 | 10.4 | 4.8 | 25.6 |
| 68 | 1.3 | 1 | 7.1 | 8 | 3.3 | 24.9 |
| 117 | 0.9 | 0.6 | 0.2 | 0.3 | 0.5 | 0.6 |
-
Based on the above results, it can be considered
that, in screening utilizing the gene panel of the
present invention, if a substance provides marked
expression changes (3 times or more) of about 6 genes
and the changes corelate to those in the gene panel
(genes showing expression increase in the gene panel
show further expression increases, and genes showing
expression decrease in the gene panel show further
expression decreases), such a substance can be selected
as a candidate liver regeneration accelerating substance.
Example 2: Expression analysis of genes involved in L-alanine
metabolism during liver regeneration by Tagman
PCR (SYBR Green).
-
In the same manner as in the above <1> and <2>,
total RNA was purified from the remaining livers
(regenerating livers) at 0, 1, 6, 24, 48 and 168 hours
after the partial hepatectomy of rats, and changes in
expression levels of various genes were examined by
using the Taqman PCR (SYBR Green) method.
(1) Preparation of template
-
The synthesis of template cDNA used for Taqman PCR
(SYBR Green) was performed by using Superscript First-Strand
Synthesis System for RT-PCR (GIBCO BRL). In an
amount of 500 ng of total RNA, 1 µl of 0.5 µg/µl Oligo
(dT)12-18 and 1 µl of 10 mM dNTP mix were dissolved in
DEPC-treated water to obtain a total volume of 10 µl. A
reaction was allowed at 65°C for 5 minutes, and the
reaction mixture was cooled on ice, added and mixed with
2 µl of 10 x RT buffer, 4 µl of 25 mM MgCl2 , 2 µl of 0.1
M DTT and 1 µl of RNase Inhibitor, and kept warm at 42°C
for 2 minutes. The reaction mixture was added with 1 µl
(50 units) of reverse transcriptase (Superscript II RT),
and a reaction was allowed at 42°C for 50 minutes and
further at 70°C for 15 minutes.
(2) Selection of candidate gene and design of primer
-
The expression profiles of the genes involved in
L-alanine metabolism during liver regeneration were
examined. To exhaustively extract rat genes involved in
L-alanine metabolism, the external database UniGene
(http://www.ncbi.nlm.nih.gov/UniGene) was searched with
keywords related to amino acid transporters, TCA cycle,
respiratory chain and various carriers, and 59 types of
genes of which sequences were known or for which primers
could be designed were retrieved. Among these, 42 types
were among the genes analyzed by using GeneChip in
Example 1.
-
The primers used in Taqman PCR (SYBR Green) were
designed by using the external database Primer3
(http://www-genome.wi.mit.edu/cgi-bin/primer/primer3_www.cgi).
The names and Unigene Nos.
of the genes and the nucleotide sequences of their
primers are shown in Table 6. The table includes only
the genes of which expression changes were observed as a
result of the analysis by Taqman PCR (SYBR Green).
(3) Taqman PCR (SYBR Green)
-
Taqman PCR (SYBR Green) was performed by the SYBR
Green method (Schmittgen TD et al., Analytical Biochem.,
285, 194-204, 2000). Specifically, the reaction was
performed as follows. A reaction mixture having the
composition shown in Table 5 was mixed in a PCR tube for
Taqman, and PCR was performed by using ABI 7700 Prism
Sequence Detector (ABI). The rection was performed
with a cycle consisting of reactions at 50°C for 2
minutes and at 95°C for 10 minutes followed by reactions
at 95°C for 15 seconds and at 60°C for 1 minute, which
was repeated 40 times.
| Composition of PCR reaction mixture (per tube) |
| Template cDNA (corresponding to 2.5 ng of total RNA) | 0.1 µl |
| 5 units/µl AmpliTaq Gold | 0.05 µl |
| dNTP mix (2.5 mM each) | 0.8 µl |
| 25 mM MgCl2 | 1.2 µl |
| 10 x SYBR buffer | 1 µl |
| Primer solution (forward) | 1 µl |
Primer solution (reverse)
Distilled water | 1 µl |
| | Total: 10 µl |
(3) Data Analysis
-
All the Taqman PCR (SYBR Green) reactions were
performed in duplicate, and the cycle threshold (CT) was
calculated. The expression level at CT = 30 was defined
as 1, and a relative expression level was obtained
according to the following equation. "CT sample"
represents CT of a gene measured.
Relative expression level = 2(30 - CT sample)
-
Further, a relative value of the expression level
of each gene was obtained based on the relative
expression level of β-actin, which was taken as 1000.
The results of the genes of which expressions changed in
regenerating livers compared with those in normal liver
are shown in Table 6. It is noted that, among the genes
which showed expression change in regenerating livers in
Example 1, expression changes were not reproduced for
the genes of Nos. 81 (Rn.29771) and 131 (Rn.9913)
mentioned in Table 1.
Example 3: Expression analysis of genes involved in L-alanine
metabolism by Taqman PCR (SYBR Green) with L-alanine
administration during liver regeneration
-
Expression changes were examined with L-alanine
administration during liver regeneration regarding 59
types of rat genes involved in L-alanine metabolism
extracted in Example 2.
(1) Preparation of regenerating liver
-
Five 6 week-old F344 male rats (120 g) were fed
for 6 days by giving feed CRF-1 (Oriental Yeast) and
water and then divided into 2 groups (Group 1 and Group
2) each consisting of rats with the same body weight.
At 24 hours before dissection, 70% partial hepatectomy
(left lobe and intermediate lobe) was performed by the
method of Higgins-Anderson (Higgins, GM and Anderson, RM,
Arch. Pathol. 12, 186-191, 1931). On the day of autopsy,
the rats were starved for 6 hours before the dissection.
At 18 and 21 hours after the partial hepatectomy, 2 g/10
ml/kg BW of L-alanine was orally administered as an
aqueous solution containing 0.3% carboxymethylcellulose
(Group 1), and only 0.3% carboxymethylcellulose was
orally administered as a control (Group 2).
-
Dissection was performed at 24 hours after the
partial hepatectomy. After the rats were killed by
bleeding under anesthesia, livers were extracted,
weighed, cryopreserved and then subjected to the mRNA
expression measurement by the Taqman PCR (SYBR Green)
method.
(2) Purification of total RNA
-
Total RNA was purified from the remaining liver of
70% partially hepatectomized rats in the L-alanine
administered group (Group 1) and the control group
(Group 2) in the same manner as in Example 1.
(3) Synthesis of template
-
Templante cDNA used in Taqman PCR (SYBR Green) was
synthesized in the same manner as in Example 2.
(4) Desigan of primers
-
Primers used in Taqman PCR (SYBR Green) were
designed by using the external database Primer3
(http://www-genome.wi.mit.edu/cgi-bin/primer/primer3_www.cgi).
The names and Unigene Nos.
of the genes and the nucleotide sequences of their
primers are shown in Table 7. The table includes only
the genes for which expression changes were observed as
a result of the analysis by Taqman PCR (SYBR Green).
(5) Taqman PCR (SYBR Green)
-
Taqman PCR (SYBR Green) was performed in the same
manner as in Example 2.
(6) Data analysis
-
All the Taqman PCR (SYBR Green) reactions were
performed in duplicate, and the cycle threshold (CT) was
calculated. The expression level at CT = 30 was defined
as 1, and a relative expression level was obtained
according to the following equation.
Relative expression level = 2(30 - CT sample)
-
Futher, a relative value of the expression level
of each gene was obtained based on the relative
expression of β-Actin, which was taken as 1000. The
results of genes for which changes in expression level
due to the L-alanine administration were observed are
shown in Figs. 2 to 4. Among these genes, expression
changes were also observed in 4 types of genes (Nos. 139,
140 and 151 mentioned in Table 6 and No. 166 mentioned
in Table 7) among the genes of which expressions changed
in regenerating liver in Example 2.
Industrial Applicability
-


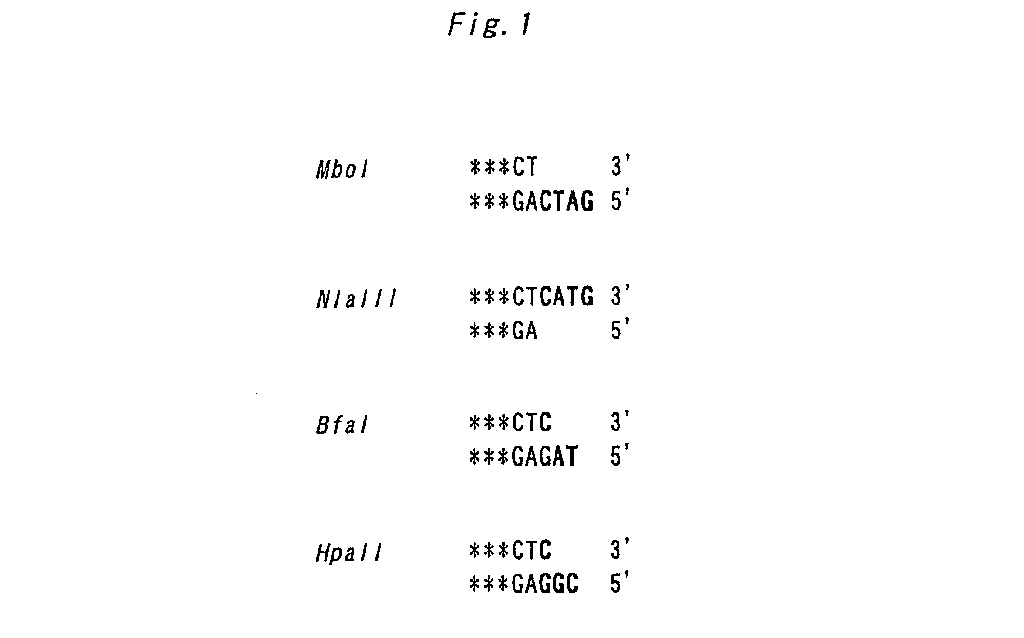
 (
(
 (
(
 (Adaptor 6, SEQ ID NO: 133)