EP1304822A1 - Apparatus, method, and program for displaying waveform quality of cdma signal, and recorded medium where the program is recorded - Google Patents
Apparatus, method, and program for displaying waveform quality of cdma signal, and recorded medium where the program is recorded Download PDFInfo
- Publication number
- EP1304822A1 EP1304822A1 EP01936912A EP01936912A EP1304822A1 EP 1304822 A1 EP1304822 A1 EP 1304822A1 EP 01936912 A EP01936912 A EP 01936912A EP 01936912 A EP01936912 A EP 01936912A EP 1304822 A1 EP1304822 A1 EP 1304822A1
- Authority
- EP
- European Patent Office
- Prior art keywords
- signal
- channel
- power
- noise
- measured
- Prior art date
- Legal status (The legal status is an assumption and is not a legal conclusion. Google has not performed a legal analysis and makes no representation as to the accuracy of the status listed.)
- Granted
Links
Images





Classifications
-
- H—ELECTRICITY
- H04—ELECTRIC COMMUNICATION TECHNIQUE
- H04B—TRANSMISSION
- H04B17/00—Monitoring; Testing
-
- H—ELECTRICITY
- H04—ELECTRIC COMMUNICATION TECHNIQUE
- H04B—TRANSMISSION
- H04B1/00—Details of transmission systems, not covered by a single one of groups H04B3/00 - H04B13/00; Details of transmission systems not characterised by the medium used for transmission
- H04B1/69—Spread spectrum techniques
- H04B1/707—Spread spectrum techniques using direct sequence modulation
-
- H—ELECTRICITY
- H04—ELECTRIC COMMUNICATION TECHNIQUE
- H04B—TRANSMISSION
- H04B17/00—Monitoring; Testing
- H04B17/20—Monitoring; Testing of receivers
- H04B17/23—Indication means, e.g. displays, alarms, audible means
-
- H—ELECTRICITY
- H04—ELECTRIC COMMUNICATION TECHNIQUE
- H04B—TRANSMISSION
- H04B17/00—Monitoring; Testing
- H04B17/30—Monitoring; Testing of propagation channels
- H04B17/309—Measuring or estimating channel quality parameters
- H04B17/318—Received signal strength
- H04B17/327—Received signal code power [RSCP]
-
- H—ELECTRICITY
- H04—ELECTRIC COMMUNICATION TECHNIQUE
- H04B—TRANSMISSION
- H04B17/00—Monitoring; Testing
- H04B17/30—Monitoring; Testing of propagation channels
- H04B17/373—Predicting channel quality or other radio frequency [RF] parameters
-
- H—ELECTRICITY
- H04—ELECTRIC COMMUNICATION TECHNIQUE
- H04J—MULTIPLEX COMMUNICATION
- H04J13/00—Code division multiplex systems
- H04J13/10—Code generation
- H04J13/12—Generation of orthogonal codes
-
- H—ELECTRICITY
- H04—ELECTRIC COMMUNICATION TECHNIQUE
- H04L—TRANSMISSION OF DIGITAL INFORMATION, e.g. TELEGRAPHIC COMMUNICATION
- H04L1/00—Arrangements for detecting or preventing errors in the information received
- H04L1/24—Testing correct operation
Definitions
- the present invention relates to the display of CDMA signal waveform quality.
- Fig. 13 shows an example of power display of various channels as measured by the measuring method disclosed therein.
- electric power W is plotted along the axis of ordinate, while channels CH are plotted along the axis of abscissa.
- Walsh code length is set at "32" to permit connection of 32-channel lines, and a state is shown in which channels 0, 1, 3, 5, 7, 9, 11, 13 ... 29, and 31 are generating signals.
- a signal power of each channel is merely displayed and the measurement of noise level is not performed.
- the measurement of noise level is an important parameter, for example, in case of building a base station for portable radio communication and making tests.
- a CDMA signal waveform quality display system includes: an orthogonal transformer for orthogonal transformation of a digital measurement signal in each channel into a base band signal and correcting a carrier frequency error; a demodulator for demodulating the measurement signal in each channel corrected by the orthogonal transformer to afford demodulated data and an amplitude value; an ideal signal generator for generating an ideal signal in each channel from the demodulated data, the amplitude value, and estimated parameters; a parameter estimator for estimating various parameters in each channel from the ideal signal in each channel and the corrected measurement signal in each channel; an optimizing unit which, using the estimated parameters, performs the correction in the orthogonal transformer and the generation of the ideal signal in the ideal signal generator, further performing the processings in the demodulator and the parameter estimator, and which repeats the correction, demodulation, and estimation until the estimated parameters are optimized; a power coefficient calculator which calculates a power coefficient of the measurement signal in each channel in the optimized state in the optimizing unit; a noise power coefficient calculator
- a CDMA signal waveform quality display system includes: a power measuring unit for measuring a signal component power of a signal to be measured in a certain specific channel to be measured; a noise component power measuring unit for measuring a noise component power of the signal to be measured in the channel to be measured; and a calculation result display unit for displaying a graph having a length proportional to the value of the signal component power and a graph having a length proportional to the value of the noise component power in such a manner that in a longitudinal direction of one of the graphs there is disposed the other graph.
- the present invention as described in claim 3, is a CDMA signal waveform quality display system according to claim 2, wherein in the case where the channel to be measured is free of the signal component power, the calculation result display unit displays the graph having a length proportional to the value of the noise component power.
- the present invention as described in claim 4 is a CDMA signal waveform quality display system according to claim 2 or claim 3, wherein the calculation result display unit causes a marker to be displayed on a display surface and displays the value of the signal component power and of the noise component power in a position indicated by the marker.
- the present invention as described in claim 5, is a CDMA signal waveform quality display system according to claim 2, wherein the calculation result display unit displays the graphs in such an arranged state of the graphs as avoids overlapping of the graphs, the graphs each having a width corresponding to a band width which is determined by a diffusion code length corresponding to the channel to be measured.
- the present invention as described in claim 6, is a CDMA signal waveform quality display system according to claim 5, wherein the calculation result display unit displays the graphs in such a state as the graphs are arranged in accordance with Paley order to avoid overlapping of the graphs.
- a CDMA signal waveform quality display method includes: an orthogonal transformation step for orthogonal transformation of a digital measurement signal in each channel into a base band signal and correcting a carrier frequency error; a demodulating step for demodulating the measurement signal in each channel corrected by the orthogonal transformation step to afford demodulated data and an amplitude value; an ideal signal generating step for generating an ideal signal in each channel from the demodulated data, the amplitude value, and estimated parameters; a parameter estimating step for estimating various parameters in each channel from the ideal signal in each channel and the corrected measurement signal in each channel; an optimizing step which, using the estimated parameters, performs the correction in the orthogonal transformation step and the generation of the ideal signal in the ideal signal generating step, further performing the processings in the demodulating step and the parameter estimating step, and which repeats the correction, demodulation, and estimation until the estimated parameters are optimized; a power coefficient calculating step which calculates a power coefficient of the measurement signal in each channel in the optimized
- a CDMA signal waveform quality display method includes: a power measuring step for measuring a signal component power of a signal to be measured in a certain specific channel to be measured; a noise component power measuring step for measuring a noise component power of the signal to be measured in the channel to be measured; and a calculation result display step for displaying a graph having a length proportional to the value of the signal component power and a graph having a length proportional to the value of the noise component power in such a manner that in a longitudinal direction of one of the graphs there is disposed the other graph.
- the present invention as described in claim 9, is a program of instructions for execution by the computer to perform a CDMA signal waveform quality display processing, the CDMA signal waveform quality display processing including: an orthogonal transformation process for orthogonal transformation of a digital measurement signal in each channel into a base band signal and correcting a carrier frequency error; a demodulating process for demodulating the measurement signal in each channel corrected by the orthogonal transformation process to afford demodulated data and an amplitude value; an ideal signal generating process for generating an ideal signal in each channel from the demodulated data, the amplitude value, and estimated parameters; a parameter estimating process for estimating various parameters in each channel from the ideal signal in each channel and the corrected measurement signal in each channel; an optimizing process which, using the estimated parameters, performs the correction in the orthogonal transformation process and the generation of the ideal signal in the ideal signal generating process, further performing the processings in the demodulating process and the parameter estimating process, and which repeats the correction, demodulation, and estimation until the estimated parameters are optimized; a
- the present invention as described in claim 10, is a program of instructions for execution by the computer to perform a CDMA signal waveform quality display processing, the CDMA signal waveform quality display processing including: a power measuring process for measuring a signal component power of a signal to be measured in a certain specific channel to be measured; a noise component power measuring process for measuring a noise component power of the signal to be measured in the channel to be measured; and a calculation result display process for displaying a graph having a length proportional to the value of the signal component power and a graph having a length proportional to the value of the noise component power in such a manner that in a longitudinal direction of one of the graphs there is disposed the other graph.
- the present invention as described in claim 11, is a computer-readable medium having a program of instructions for execution by the computer to perform a CDMA signal waveform quality display processing, the CDMA signal waveform quality display processing including: an orthogonal transformation process for orthogonal transformation of a digital measurement signal in each channel into a base band signal and correcting a carrier frequency error; a demodulating process for demodulating the measurement signal in each channel corrected by the orthogonal transformation process to afford demodulated data and an amplitude value; an ideal signal generating process for generating an ideal signal in each channel from the demodulated data, the amplitude value, and estimated parameters; a parameter estimating process for estimating various parameters in each channel from the ideal signal in each channel and the corrected measurement signal in each channel; an optimizing process which, using the estimated parameters, performs the correction in the orthogonal transformation process and the generation of the ideal signal in the ideal signal generating process, further performing the processings in the demodulating process and the parameter estimating process, and which repeats the correction, demodulation, and estimation until the
- the present invention as described in claim 12, is a computer-readable medium having a program of instructions for execution by the computer to perform a CDMA signal waveform quality display processing, the CDMA signal waveform quality display processing including: a power measuring process for measuring a signal component power of a signal to be measured in a certain specific channel to be measured; a noise component power measuring process for measuring a noise component power of the signal to be measured in the channel to be measured; and a calculation result display process for displaying a graph having a length proportional to the value of the signal component power and a graph having a length proportional to the value of the noise component power in such a manner that in a longitudinal direction of one of the graphs there is disposed the other graph.
- the present invention since not only a signal power of each channel but also a noise power of each channel in CDMA signal is displayed on the same screen, it is possible to know a signal-to-noise ratio (S/N) easily. There accrues an advantage that it is possible to provide a CDMA signal waveform quality measuring system convenient for use.
- a frequency-diffused, multi-channel CDMA signal from a base station is inputted through an input terminal 11 and is converted to an intermediate frequency signal by means of a down converter 12.
- the intermediate frequency signal is amplified by an amplifier 13, then is bandlimited by a filter 14, and is thereafter converted to a digital signal by an A/D converter 15.
- the digital intermediate frequency signal from the A/D converter 15 is converted to a base band signal by an orthogonal transformer 17 which includes a complementary filter, affording a base band measurement signal Z(k).
- the base band measurement signal Z(k) is inverse-diffused in a demodulator 25 with a diffusion code (Walsh code) provided from a diffusion code generator 20 and bit data is demodulated for each channel. At the same time, amplitude a'i (i is channel number) of each channel is detected.
- a diffusion code Wang code
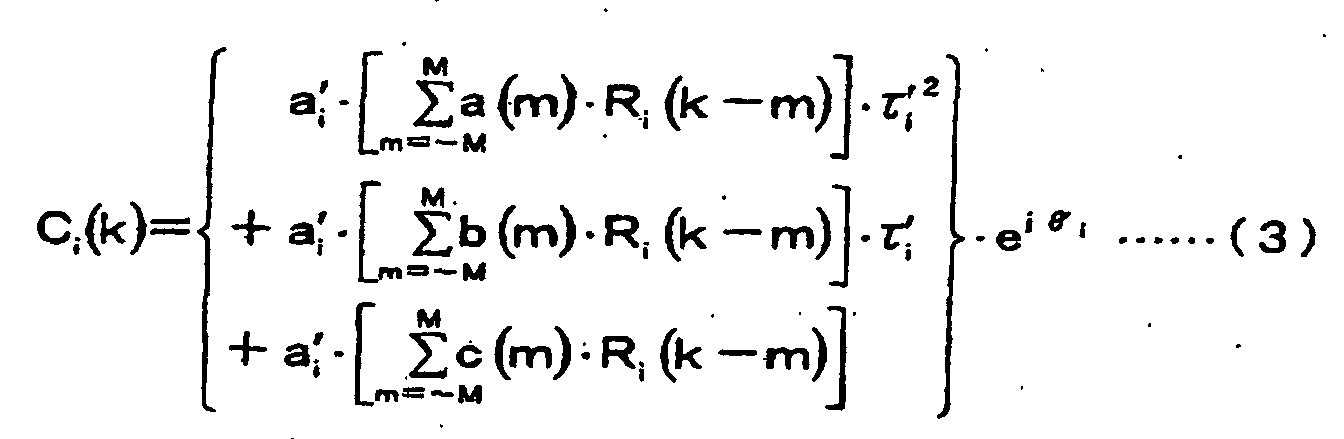
- an ideal signal Ri (i is channel number) is produced on the basis of both bit data provided from the demodulator 25 and diffusion code PN (Walsh code) provided from the diffusion code generator 20. Further, in accordance with the ideal signal Ri, the following expressions are calculated to generate correction data Ai(k), Bi(k), Ci(k), Ii(k), and Hi(k):
- the ideal signal Ri is obtained in the following manner. Demodulated bit data of each channel i provided from the demodulator 25 are inverse-diffused with I- and Q-side diffusion codes (Walsh codes) provided from the diffusion code generator 20, then chips "0" and "1" in the thus inversion-diffused I- and Q-side chip rows are converted to + 2 and - 2 , respectively to afford I and Q signals of QPSK signal with an amplitude of 1. That is, using the ideal signal Ri(k-m) with a normalized amplitude and the amplitude a'i from the demodulator 25, there are calculated auxiliary data Ai(k), Bi(k), Ci(k), Ii(k), and Hi(k).
- auxiliary data Ai(k), Bi(k), Ci(k), Ii(k), and Hi(k).
- auxiliary data Ai(k), Bi(k), Ci(k), Ii(k), and Hi(k) and the measurement signal Z(k) are inputted to a parameter estimator 27, in which simultaneous equations shown in Fig. 2 are solved and estimate values ⁇ ai, ⁇ i, ⁇ i, and ⁇ are obtained as solutions thereof.
- the correction parameters so far used a'i, ⁇ 'i, ⁇ 'i, and ⁇ ' are updated as follows in a transformer 28: ⁇ ' ⁇ ⁇ ' + ⁇ a' i ⁇ a' i + ⁇ ai ⁇ ' i ⁇ ⁇ ' i + ⁇ i ⁇ ' i ⁇ ⁇ ' i + ⁇ i
- an optimizing means 22 is constituted by the orthogonal transformer 17 which includes a complementary filter, the demodulator 25, the ideal signal generator 26, the parameter estimator 27, and the transformers 28 and 29.
- Correction for the measurement signal Z(k) is made as follows relative to Z(k) of the last time: Z (k) ⁇ Z(t - ⁇ ' 0) (1/a' 0) exp[-j ( ⁇ ' (t - ⁇ ' 0) + ⁇ ' 0 )]
- the calculation for correction may be performed for the measurement signal Z(k) after conversion to the base band.
- this base band-converted signal is a signal after having passed the complementary filer (the same pass band width as the band width of the input signal). If there is a gross frequency error, this filter processing may result in that a portion of the signal is removed, that is, the measurement signal to be used in parameter estimation, etc., is chipped. Therefore, the result of the frequency estimation is corrected at a stage which precedes the complementary filter. But the correction may be made for the measurement signal after conversion to the base band, provided there is used a low pass filter of a sufficiently wide band without using the complementary filter in the orthogonal transformer/complementary filter 17.
- the parameters for the ideal signal Ri of channels other than the 0 th channel are corrected by 0 th parameters as in the expression (8).
- correction for the measurement signal Z(k) is made using the correction parameters of the 0 th channel and therefore, as correction parameters used in the auxiliary data generator 26, there is used the expression (8) normalized by the parameters of the 0 th channel, i.e., a transformed output of the transformer 29. More particularly, the calculations of the expressions (1) to (5) are performed using parameters which are conceivable in the expression (8) to determine auxiliary data Ai(k), Bi(k), Ci(k), Ii(k), and Hi(k). In these calculations for determining auxiliary data there are used bit data and amplitude a'i, the bit data being obtained as a result of demodulating Z(k) in the demodulator 25 after correction by the expression (7).
- the parameters a ⁇ , ⁇ i, ⁇ i, ⁇ , ⁇ 0, and the power coefficient ⁇ i obtained in the power coefficient calculator 31 are displayed on a calculation result display 33.
- the measurement signal Z(k) and the ideal signal Ri are corrected using estimated parameters, and the estimation of parameters is again performed using both corrected signals until optimization of the estimated parameters. Since all the parameters are used in this optimization, all the parameters are optimized, and after the optimization, the power coefficient ⁇ i is determined using the measurement signal, so that the power coefficient ⁇ i can be obtained with a high accuracy. Other parameters are also determined with a high accuracy because the measurement signal is included in the optimization loop.
- a noise coefficient calculator 31A is provided in the power coefficient calculator 31 to calculate a noise coefficient ⁇ Ni of each channel. Further, a noise power display 33A is provided in the calculation result display 33, and the noise coefficient ⁇ Ni of each channel calculated in the noise power coefficient calculator 31A is inputted to the noise power display 33A, allowing a noise power to be calculated.
- Signal power and noise power of each channel are calculated in the following manner.
- Signal power W s 10.0 x log 10 ( ⁇ i)
- ⁇ i is obtained in the foregoing expression (9).
- Walsh code length is fixed to 64
- Walsh length actually takes the values of 4, 8, 16, 32, 64, 128, and 256 for various channels.
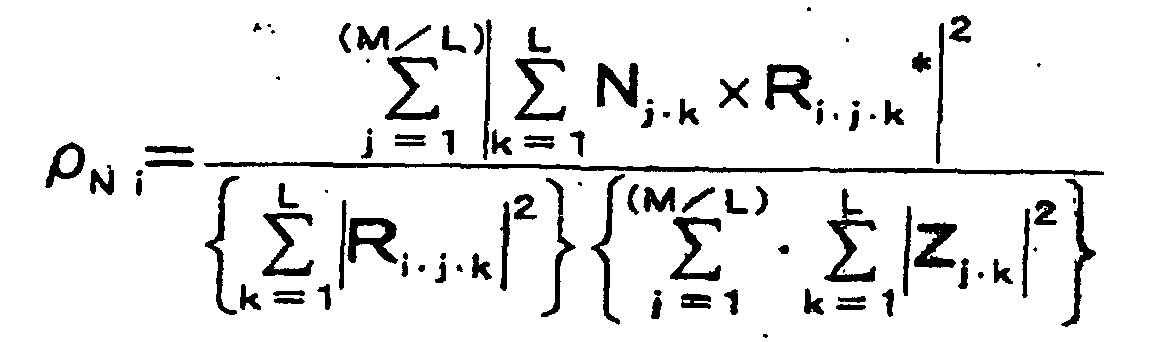
- Noise power coefficient ⁇ Ni (code Domain Error) is calculated as follows using Z j ⁇ k and Ri ⁇ j ⁇ k in the expression (9).
- the result of the calculation is stored in a memory in a pair with the signal power W S channel by channel.
- the values of signal power W S and noise power W N in each channel are graphed by a graph plotting means (included in the calculation result display 33) and written as a graph in an image memory.
- the values of signal power W S and noise power W N in all the channels are all stored in the image memory, whereby the states of all the channels are displayed on the display.
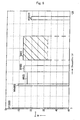
- Fig. 3 shows an example of the plotting.
- hatched portions (graphs) with solid lines represent signal powers W S of the channels, while dotted line portions (graphs) represent noise powers W N of the channels.
- signal-free channels are also measured for noise power and the results are displayed.
- the height (length) of each graph represents the signal power W S and noise power W N of each channel.
- the graphs of noise power W N underlie vertical (longitudinal) extension lines of the graphs of signal power W S .
- the solid line and dotted line portions in Fig. 3 may actually be represented in different line colors in the case of a color display to make distinction in display between signal power W S and noise power W N .
- the symbol M in the figure stands for a marker.
- the marker M By moving the marker M to the portion whose measured value is to be known, it is possible to let the measured value at that position be displayed in a numerical value display column 34.
- the channel indicated by the marker M is "5"
- Walsh code length is 32
- noise power CDE is -55.22 dBm
- signal power POWER is -32.29 dBm.
- This second embodiment is different from the first embodiment in that bar graphs are arranged and displayed in accordance with Paley order.
- Fig. 4 is a block diagram showing the construction of a CDMA signal waveform quality display system according to the second embodiment of the present invention.
- the same portions as in the first embodiment are identified by like reference numerals and explanations thereof will be omitted.
- the CDMA signal waveform quality display system of this second embodiment is further provided, in addition to the components described in the first embodiment, with a diffusion code length setting updating means 34A, a diffusion code number setting updating means 34B, a setting means 35, a memory 33A', a graphing means 33B, and an image memory 33C.
- the diffusion code generator 20 In accordance with diffusion code length L and diffusion code number i produced in the diffusion code length setting updating means 34A and the diffusion code number setting updating means 34B, the diffusion code generator 20 generates a diffusion code PN corresponding to all the channels for each diffusion code length L, and with this diffusion code PN the demodulator 25 demodulates the signal of each channel at each diffusion code length.
- the ideal signal generator 26 generates an ideal signal Ri from the data obtained by demodulation, and various parameters ⁇ ai, ⁇ i, ⁇ i, and ⁇ are produced in the parameter estimator 27 in accordance with the ideal signal Ri, then those parameters are fed back to the orthogonal transformer 17 for optimization processing, to afford a signal Z(k) with few errors.
- the signal Z(k) with few errors is inputted to the power coefficient calculator 31, which in turn calculates power coefficients ⁇ i of the channels.
- the power coefficients ⁇ i thus calculated in the power coefficient calculator 31 and the parameters ⁇ ai ⁇ L, ⁇ i ⁇ L, ⁇ i ⁇ L, ⁇ , ⁇ 0' outputted from the transformer 32 are stored in the memory 33A' in accordance with respective diffusion code lengths and diffusion code numbers.
- a setting means 35 sets a to-be-displayed channel (the channel of a signal transmitted by a communication device being measured) among all the channels stored in the memory 33A' and reads the power coefficient ⁇ i and parameters of the channel thus set. In this example, therefore, electric power of the channel set in the setting means 35 is displayed on the calculation result display 33.
- Fig. 5 shows the operation of the diffusion code length setting updating means 34A and that of the diffusion code number setting updating means 34B and also shows in what state arithmetic processings are performed in various components.
- step SP4 parameters are estimated in the parameter estimator 27 in accordance with the ideal signal Ri ⁇ L and are then fed back to the orthogonal transformer 17 for optimization processing. Then, the power coefficient ⁇ i ⁇ L is calculated on the basis of the measurement signal Z(k) after optimization processing and the diffusion code produced in the diffusion code generator 20.
- step SP5 the power coefficient ⁇ i ⁇ L calculated in step SP4 and other parameters ⁇ ai ⁇ L, ⁇ i ⁇ L, ⁇ i ⁇ L, ⁇ , ⁇ 0' are stored in the memory 33A'.
- the noise coefficient ⁇ Ni is also stored in the memory 33A'.
- step SP9 a check is made to see if the value L of Walsh code length has become larger than the maximum value 128. If the value L of Walsh code length has become larger than the maximum value 128, the flow returns to step SP2.
- the Walsh code length L is updated in the order of 4, 8, 16, 32, 64, and 128, and power coefficient ⁇ i ⁇ L, noise coefficient ⁇ Ni, and parameters ⁇ ai, ⁇ i, ⁇ i, ⁇ , ⁇ 0', are stored in the memory 33A' for each channels determined by each Walsh code length L.
- step SP9 If it is detected in step SP9 that the value L of Walsh length has exceeded the maximum value of 128, the processing flow branches to step SP10.
- step SP10 a power coefficient of each channel is calculated from the Walsh code length as a desired diffusion code length set in the setting means 35 and also from an address which depends on the diffusion code number (Walsh code number), and a signal power of each channel is determined from the power coefficient ⁇ i thus obtained.
- This conversion to electric power can be done in the graphing means 33B for example. How to obtain the noise power W N is the same as in the first embodiment, and also in this case the graphing means 33B may be utilized.
- Data converted to signal power and noise power can be graphed by the graphing means 33B, but in this example the level of electric power is represented in terms of a strip-like display region (bar graph) channel by channel. Therefore, the length in Y-axis direction of the strip-like display region depends on the converted electric power value. In the present invention. Moreover, the width (in X-axis direction) of the strip-like display region is determined correspondingly to the diffusion code length L.
- Fig. 6 shows an example of the display in question.
- channel number and electric power are plotted along the axis of abscissa and the axis of ordinate, respectively.
- a noise component graph underlie a signal component graph on an extension line of the length (height) of the latter graph, as in the first embodiment. This is also the same as the other display regions.
- the graphing means 33B can know the diffusion code length L to which the read power coefficient ⁇ i belongs. On the basis of the value of the diffusion code length L it is possible to determine the widths of the display regions W4, W8, W16, W32, W64, and W128.
- colors can be affixed to the display regions W4, W8, W16, W32, W64, and W128 in accordance with the diffusion code number of the power coefficient read from the memory 33A'.
- the contour lines of the display regions W4, W8, W16, W32, W64, and W128 may be colored in black, blue, green, dark blue, yellow, and red, respectively.
- the thus-colored image data are stored in the image memory 33C and the thus-stored images are displayed on a display result display 33D.
- the present invention further proposes that in the graphing means 33B the display positions in X-axis direction of the display regions W5-W128 be not defined by the diffusion code numbers shown in Fig. 7 but defined in accordance with Paley order.
- Fig. 7 shows a relation between Walsh code length and Walsh code.
- a predetermined band width ⁇ F is divided in four and four channels of 0, 1, 2, and 3 are allocated thereto.
- the channel numbers 0, 1, 2, and 3 of the four channels are given in terms of Walsh code numbers 0, 1, 2, and 3.
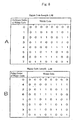
- Paley order is as shown in Fig. 8B relative to the arrangement of Walsh codes shown in Fig. 8A.
- Fig. 9A shows an ordinary order of Walsh codes and Fig. 9B shows Paley order.
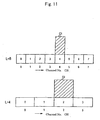
- the power displaying region C1 and C2 overlap each other as in Fig. 11.
- the present invention proposes that the display positions on X axis of the display regions W4 ⁇ W128 be determined in accordance with Paley order.
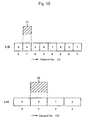
- Fig. 10 shows a state in which the overlapped state of both display regions C1 and C2 in Fig. 11 has been extinguished by making the display in accordance with Paley order.
- Paley order is like 0, 2, 1, 3 in terms of diffusion code numbers as in Fig. 9B. This order of diffusion code numbers 0, 2, 1, 3 corresponds to channel numbers 0, 1, 2, 3.
- Paley order is like 0, 4, 2, 6, 1, 5, 3, 7 as is apparent from Fig. 8B.
- the display regions C1 and C2 do not overlap each other in display.
- channels selected in accordance with channel selecting conditions in a communication device (a portable telephone set) described previously never overlap in their channel positions when conversion is made into Paley order.
- the channel selecting condition in a communication device is as follows: "A channel of a higher hierarchical level than the selected channel should not be selected.”
- This principle is also applicable to a method of determining a channel to be used in a base station for portable telephone.
- the above embodiments can be implemented in the following manner.
- a computer provided with a CPU, a hard disk, and a media (e.g., floppy disk and CD-ROM) reader
- the media reader is allowed to read a media which stores programs for implementing the foregoing components and the read data are installed in a hard disk. Even with such a method it is possible to implement the functions described above.
Landscapes
- Engineering & Computer Science (AREA)
- Computer Networks & Wireless Communication (AREA)
- Signal Processing (AREA)
- Physics & Mathematics (AREA)
- Electromagnetism (AREA)
- Quality & Reliability (AREA)
- Monitoring And Testing Of Transmission In General (AREA)
- Mobile Radio Communication Systems (AREA)
- Measurement And Recording Of Electrical Phenomena And Electrical Characteristics Of The Living Body (AREA)
Abstract
Description




That is, there is a case where only the display region C2 appears to be present and there also is a case where signals appear to be present in both
As is apparent from the above description, as to a channel selected in accordance with the channel selecting condition in a portable telephone set, if a display position of the channel is specified in accordance with Paley order, there never occurs a positional overlap in display.
Claims (12)
- A CDMA signal waveform quality display system comprising:an orthogonal transformer for orthogonal transformation of a digital measurement signal in each channel into a base band signal and correcting a carrier frequency error;a demodulator for demodulating the measurement signal in each channel corrected by said orthogonal transformer to afford demodulated data and an amplitude value;an ideal signal generator for generating an ideal signal in each channel from said demodulated data, said amplitude value, and estimated parameters;a parameter estimator for estimating various parameters in each channel from said ideal signal in each channel and the corrected measurement signal in each channel;an optimizing means which, using said estimated parameters, performs the correction in said orthogonal transformer and the generation of the ideal signal in said ideal signal generator, further performing the processings in said demodulator and said parameter estimator, and which repeats said correction, demodulation, and estimation until said estimated parameters are optimized;a power coefficient calculator which calculates a power coefficient of the measurement signal in each channel in the optimized state in said optimizing means;a noise power coefficient calculator which calculates a noise coefficient channel by channel; anda calculation result display which determines a signal power and a noise power on the basis of the power coefficient in each channel calculated in said power coefficient calculator and the noise power coefficient in each channel calculated in said noise power coefficient calculator and which displays said signal power and noise power on one and same display.
- A CDMA signal waveform quality display system comprising:a power measuring means for measuring a signal component power of a signal to be measured in a certain specific channel to be measured;a noise component power measuring means for measuring a noise component power of the signal to be measured in the channel to be measured; anda calculation result display means for displaying a graph having a length proportional to the value of said signal component power and a graph having a length proportional to the value of said noise component power in such a manner that in a longitudinal direction of one of said graphs there is disposed the other graph.
- A CDMA signal waveform quality display system according to claim 2, wherein in the case where said channel to be measured is free of said signal component power, said calculation result display means displays the graph having a length proportional to the value of said noise component power.
- A CDMA signal, waveform quality display system according to claim 2 or claim 3, wherein said calculation result display means causes a marker to be displayed on a display surface and displays the value of said signal component power and of said noise component power in a position indicated by said marker.
- A CDMA signal waveform quality display system according to claim 2, wherein said calculation result display means displays said graphs in such an arranged state of the graphs as avoids overlapping of the graphs, said graphs each having a width corresponding to a band width which is determined by a diffusion code length corresponding to the channel to be measured.
- A CDMA signal waveform quality display system according to claim 5, wherein said calculation result display means displays said graphs in such a state as the graphs are arranged in accordance with Paley order to avoid overlapping of the graphs.
- A CDMA signal waveform quality display method comprising:an orthogonal transformation step for orthogonal transformation of a digital measurement signal in each channel into a base band signal and correcting a carrier frequency error;a demodulating step for demodulating the measurement signal in each channel corrected by said orthogonal transformation step to afford demodulated data and an amplitude value;an ideal signal generating step for generating an ideal signal in each channel from said demodulated data, said amplitude value, and estimated parameters;a parameter estimating step for estimating various parameters in each channel from said ideal signal in each channel and the corrected measurement signal in each channel;an optimizing step which, using said estimated parameters, performs the correction in said orthogonal transformation step and the generation of the ideal signal in said ideal signal generating step, further performing the processings in said demodulating step and said parameter estimating step, and which repeats said correction, demodulation, and estimation until said estimated parameters are optimized;a power coefficient calculating step which calculates a power coefficient of the measurement signal in each channel in the optimized state in said optimizing step;a noise power coefficient calculating step which calculates a noise coefficient channel by channel; anda calculation result display step which determines a signal power and a noise power on the basis of the power coefficient in each channel calculated in said power coefficient calculating step and the noise power coefficient in each channel calculated in said noise power coefficient calculating step and which displays said signal power and noise power on one and same display.
- A CDMA signal waveform quality display method comprising:a power measuring step for measuring a signal component power of a signal to be measured in a certain specific channel to be measured;a noise component power measuring step for measuring a noise component power of the signal to be measured in the channel to be measured; anda calculation result display step for displaying a graph having a length proportional to the value of said signal component power and a graph having a length proportional to the value of said noise component power in such a manner that in a longitudinal direction of one of said graphs there is disposed the other graph.
- A program of instructions for execution by the computer to perform a CDMA signal waveform quality display processing, said CDMA signal waveform quality display processing comprising:an orthogonal transformation process for orthogonal transformation of a digital measurement signal in each channel into a base band signal and correcting a carrier frequency error;a demodulating process for demodulating the measurement signal in each channel corrected by said orthogonal transformation process to afford demodulated data and an amplitude value;an ideal signal generating process for generating an ideal signal in each channel from said demodulated data, said amplitude value, and estimated parameters;a parameter estimating process for estimating various parameters in each channel from said ideal signal in each channel and the corrected measurement signal in each channel;an optimizing process which, using said estimated parameters, performs the correction in said orthogonal transformation process and the generation of the ideal signal in said ideal signal generating process, further performing the processings in said demodulating process and said parameter estimating process, and which repeats said correction, demodulation, and estimation until said estimated parameters are optimized;a power coefficient calculating process which calculates a power coefficient of the measurement signal in each channel in the optimized state in said optimizing process;a noise power coefficient calculating process which calculates a noise coefficient channel by channel; anda calculation result display process which determines a signal power and a noise power on the basis of the power coefficient in each channel calculated in said power coefficient calculating process and the noise power coefficient in each channel calculated in said noise power coefficient calculating process and which displays said signal power and noise power on one and same display.
- A program of instructions for execution by the computer to perform a CDMA signal waveform quality display processing, said CDMA signal waveform quality display processing comprising:a power measuring process for measuring a signal component power of a signal to be measured in a certain specific channel to be measured;a noise component power measuring process for measuring a noise component power of the signal to be measured in the channel to be measured; anda calculation result display process for displaying a graph having a length proportional to the value of said signal component power and a graph having a length proportional to the value of said noise component power in such a manner that in a longitudinal direction of one of said graphs there is disposed the other graph.
- A computer-readable medium having a program of instructions for execution by the computer to perform a CDMA signal waveform quality display processing, said CDMA signal waveform quality display processing comprising:an orthogonal transformation process for orthogonal transformation of a digital measurement signal in each channel into a base band signal and correcting a carrier frequency error;a demodulating process for demodulating the measurement signal in each channel corrected by said orthogonal transformation process to afford demodulated data and an amplitude value;an ideal signal generating process for generating an ideal signal in each channel from said demodulated data, said amplitude value, and estimated parameters;a parameter estimating process for estimating various parameters in each channel from said ideal signal in each channel and the corrected measurement signal in each channel;an optimizing process which, using said estimated parameters, performs the correction in said orthogonal transformation process and the generation of the ideal signal in said ideal signal generating process, further performing the processings in said demodulating process and said parameter estimating process, and which repeats said correction, demodulation, and estimation until said estimated parameters are optimized;a power coefficient calculating process which calculates a power coefficient of the measurement signal in each channel in the optimized state in said optimizing process;a noise power coefficient calculating process which calculates a noise coefficient channel by channel; anda calculation result display process which determines a signal power and a noise power on the basis of the power coefficient in each channel calculated in said power coefficient calculating process and the noise power coefficient in each channel calculated in said noise power coefficient calculating process and which displays said signal power and noise power on one and same display.
- A computer-readable medium having a program of instructions for execution by the computer to perform a CDMA signal waveform quality display processing, said CDMA signal waveform quality display processing comprising:a power measuring process for measuring a signal component power of a signal to be measured in a certain specific channel to be measureda noise component power measuring process for measuring a noise component power of the signal to be measured in the channel to be measured; anda calculation result display process for displaying a graph having a length proportional to the value of said signal component power and a graph having a length proportional to the value of said noise component power in such a manner that in a longitudinal direction of one of said graphs there is disposed the other graph.
Applications Claiming Priority (5)
| Application Number | Priority Date | Filing Date | Title |
|---|---|---|---|
| JP2000173484 | 2000-06-09 | ||
| JP2000173484 | 2000-06-09 | ||
| JP2000175176 | 2000-06-12 | ||
| JP2000175176 | 2000-06-12 | ||
| PCT/JP2001/004843 WO2001095535A1 (en) | 2000-06-09 | 2001-06-08 | Apparatus, method, and program for displaying waveform quality of cdma signal, and recorded medium where the program is recorded |
Publications (3)
| Publication Number | Publication Date |
|---|---|
| EP1304822A1 true EP1304822A1 (en) | 2003-04-23 |
| EP1304822A4 EP1304822A4 (en) | 2005-04-06 |
| EP1304822B1 EP1304822B1 (en) | 2006-10-11 |
Family
ID=26593632
Family Applications (1)
| Application Number | Title | Priority Date | Filing Date |
|---|---|---|---|
| EP01936912A Expired - Lifetime EP1304822B1 (en) | 2000-06-09 | 2001-06-08 | Apparatus, method, and program for displaying waveform quality of cdma signal, and recorded medium where the program is recorded |
Country Status (6)
| Country | Link |
|---|---|
| US (1) | US7379851B2 (en) |
| EP (1) | EP1304822B1 (en) |
| KR (1) | KR100516690B1 (en) |
| CN (1) | CN1197288C (en) |
| DE (1) | DE60123798T2 (en) |
| WO (1) | WO2001095535A1 (en) |
Cited By (3)
| Publication number | Priority date | Publication date | Assignee | Title |
|---|---|---|---|---|
| WO2003107566A1 (en) * | 2002-06-14 | 2003-12-24 | Rohde & Schwarz Gmbh & Co. Kg | Signal analyzer and method for displaying capacities of code channels |
| WO2008035232A3 (en) * | 2006-05-26 | 2008-10-30 | Tektronix Internat Sales G M B | Power display for communication signal and signal analyzer |
| DE102008058823A1 (en) * | 2008-11-25 | 2010-05-27 | Rohde & Schwarz Gmbh & Co. Kg | Method and apparatus for analyzing code domain power and code domain error power |
Families Citing this family (12)
| Publication number | Priority date | Publication date | Assignee | Title |
|---|---|---|---|---|
| KR100717822B1 (en) * | 2000-12-30 | 2007-05-11 | 에스케이 텔레콤주식회사 | Wireless Packet Data Quality Measurement Method in Mobile Communication Networks |
| JP3934607B2 (en) * | 2001-07-06 | 2007-06-20 | 株式会社アドバンテスト | MEASUREMENT DATA DISPLAY DEVICE, METHOD, PROGRAM, AND RECORDING MEDIUM CONTAINING THE PROGRAM |
| US7346638B2 (en) * | 2003-11-21 | 2008-03-18 | Board Of Regents, The University Of Texas System | Filtering, equalization, and power estimation for enabling higher speed signal transmission |
| KR100719890B1 (en) * | 2005-08-01 | 2007-05-18 | 에스케이 텔레콤주식회사 | Method of measuring video call quality in wireless communication network |
| US8657119B2 (en) * | 2006-01-04 | 2014-02-25 | Scott D. Wolf | Segmented media publishing system |
| CN101031126B (en) * | 2007-02-05 | 2010-05-19 | 京信通信技术(广州)有限公司 | Path-measuring receiver and method for processing base-band signal |
| CN101426212B (en) * | 2007-10-29 | 2011-01-26 | 中国移动通信集团公司 | Method and device for noise floor and signal component threshold estimation based on channel measurement |
| US8526552B1 (en) * | 2009-08-25 | 2013-09-03 | Marvell International Ltd. | Noise estimation in communication receivers |
| CN102055704B (en) * | 2009-11-10 | 2013-05-08 | 中兴通讯股份有限公司 | Method and device for noise estimation in orthogonal frequency division multiplexing (OFDM) system |
| US8483641B1 (en) | 2010-07-28 | 2013-07-09 | Marvell International Ltd. | Validation and stabilization of noise matrices |
| US9603153B2 (en) * | 2013-10-24 | 2017-03-21 | Netgear, Inc. | Wireless access point management system and method |
| WO2021221195A1 (en) * | 2020-04-28 | 2021-11-04 | 엘지전자 주식회사 | Signal processing device and image display device including same |
Family Cites Families (14)
| Publication number | Priority date | Publication date | Assignee | Title |
|---|---|---|---|---|
| JPS61138118A (en) * | 1984-12-11 | 1986-06-25 | Toshiba Corp | Method and device for displaying bar graph |
| US5087808A (en) * | 1991-02-26 | 1992-02-11 | Reed Edwin A | Combined optical power and noise meter |
| JPH09307525A (en) * | 1996-05-17 | 1997-11-28 | Advantest Corp | Modulation parameter measuring device for digital quadrature modulation signal |
| JP3746580B2 (en) | 1996-12-09 | 2006-02-15 | 株式会社アドバンテスト | Method for measuring waveform quality of CDMA signal |
| US6219340B1 (en) * | 1998-05-08 | 2001-04-17 | Agilent Technologies Inc. | Display of code power in all symbol rates in a single screen for code-division multiple access signals employing layered orthogonal codes |
| JP2000134180A (en) * | 1998-10-28 | 2000-05-12 | Advantest Corp | CDMA code domain display method |
| JP2000216754A (en) * | 1998-11-18 | 2000-08-04 | Advantest Corp | W-CDMA analysis device, W-CDMA analysis result display method, and recording medium recording W-CDMA analysis result display program |
| US6356531B1 (en) * | 1999-06-07 | 2002-03-12 | Qualcomm Incorporated | Monitoring of CDMA load and frequency reuse based on reverse link signal-to-noise ratio |
| JP3961290B2 (en) * | 1999-09-30 | 2007-08-22 | 富士通株式会社 | Noise suppressor |
| JP2001189711A (en) * | 1999-12-29 | 2001-07-10 | Agilent Technologies Japan Ltd | Apparatus and method for indicating code domain power |
| US6850238B2 (en) * | 2001-07-31 | 2005-02-01 | Tektronix, Inc. | Display of code power levels and relationships of multiple spreading factor orthogonal codes in a CDMA signal |
| DE10226640A1 (en) * | 2002-06-14 | 2003-12-24 | Rohde & Schwarz | Signal analyzer and method for displaying performance of code channels |
| US7130328B2 (en) * | 2002-08-15 | 2006-10-31 | Tektronix, Inc. | Time history display of orthogonal code power levels |
| US7218948B2 (en) * | 2003-02-24 | 2007-05-15 | Qualcomm Incorporated | Method of transmitting pilot tones in a multi-sector cell, including null pilot tones, for generating channel quality indicators |
-
2001
- 2001-06-08 DE DE60123798T patent/DE60123798T2/en not_active Expired - Fee Related
- 2001-06-08 CN CNB018108601A patent/CN1197288C/en not_active Expired - Fee Related
- 2001-06-08 WO PCT/JP2001/004843 patent/WO2001095535A1/en not_active Ceased
- 2001-06-08 EP EP01936912A patent/EP1304822B1/en not_active Expired - Lifetime
- 2001-06-08 US US10/297,484 patent/US7379851B2/en not_active Expired - Fee Related
- 2001-06-08 KR KR10-2002-7016590A patent/KR100516690B1/en not_active Expired - Fee Related
Cited By (5)
| Publication number | Priority date | Publication date | Assignee | Title |
|---|---|---|---|---|
| WO2003107566A1 (en) * | 2002-06-14 | 2003-12-24 | Rohde & Schwarz Gmbh & Co. Kg | Signal analyzer and method for displaying capacities of code channels |
| US7295527B2 (en) | 2002-06-14 | 2007-11-13 | Rohde Schwarz Gmbh & Co. Kg | Signal analyzer and method for displaying power levels of code channels |
| WO2008035232A3 (en) * | 2006-05-26 | 2008-10-30 | Tektronix Internat Sales G M B | Power display for communication signal and signal analyzer |
| US9166710B2 (en) | 2006-05-26 | 2015-10-20 | Tektronix International Sales Gmbh | Power display for communication signal and signal analyzer |
| DE102008058823A1 (en) * | 2008-11-25 | 2010-05-27 | Rohde & Schwarz Gmbh & Co. Kg | Method and apparatus for analyzing code domain power and code domain error power |
Also Published As
| Publication number | Publication date |
|---|---|
| DE60123798D1 (en) | 2006-11-23 |
| DE60123798T2 (en) | 2007-08-23 |
| EP1304822B1 (en) | 2006-10-11 |
| CN1435024A (en) | 2003-08-06 |
| US7379851B2 (en) | 2008-05-27 |
| US20040039763A1 (en) | 2004-02-26 |
| KR100516690B1 (en) | 2005-09-22 |
| EP1304822A4 (en) | 2005-04-06 |
| CN1197288C (en) | 2005-04-13 |
| KR20030007882A (en) | 2003-01-23 |
| WO2001095535A1 (en) | 2001-12-13 |
Similar Documents
| Publication | Publication Date | Title |
|---|---|---|
| EP1304822B1 (en) | Apparatus, method, and program for displaying waveform quality of cdma signal, and recorded medium where the program is recorded | |
| JP3135999B2 (en) | CN ratio measuring device | |
| US6519227B1 (en) | W-CDMA analyzing apparatus, method of displaying results of W-CDMA analysis, and recording medium carrying record of program for displaying results of W-CDMA analysis | |
| US6275521B1 (en) | Demodulating apparatus and demodulating method | |
| KR100427967B1 (en) | Physical quantity display device for displaying physical quantity of multiple signals, method and recording medium | |
| EP1304823B1 (en) | Multiplexed signal quality display, method, and program, and recorded medium where the program is recorded | |
| CN100372256C (en) | Method and device for estimating the signal-to-interference ratio of a signal | |
| EP1300974B1 (en) | Multiplexed signal quality display, method, and program, and recorded medium where the program is recorded | |
| US20090274197A1 (en) | Method and apparatus for compensating for phase noise of symbols spread with a long spreading code | |
| JP3782382B2 (en) | Modulation signal analyzing apparatus and receiving module evaluation system | |
| JPWO2001095535A1 (en) | CDMA signal waveform quality display device, method, program, and recording medium on which the program is recorded | |
| RU2000112022A (en) | METHOD AND DEVICE FOR MEASURING NONLINEAR IMPACTS IN A COMMUNICATION SYSTEM AND FOR SELECTING CHANNELS BASED ON THE RESULTS OF THIS MEASUREMENT | |
| JP4165629B2 (en) | Power measurement device for measuring received signal power and received interference power | |
| JP3474789B2 (en) | Spread code phase shift measuring device in mobile terminal test equipment | |
| JP4421342B2 (en) | Method and apparatus for determining and displaying code channel power | |
| US6434111B1 (en) | Soft decision rule for demodulation of bi-orthogonal signals | |
| JPWO2001097421A1 (en) | Multiplexed signal quality display device, method, program, and recording medium on which the program is recorded | |
| US7162396B2 (en) | Measurement data displaying device, method, and program, and recording medium on which the program is recorded | |
| JP4074613B2 (en) | CDMA signal analyzer | |
| KR100666985B1 (en) | Error correction method and apparatus for adaptive array antenna system | |
| JPWO2001095536A1 (en) | Multiplexed signal quality display device, method, program, and recording medium on which the program is recorded | |
| JP3375318B2 (en) | Signal generator with crest factor characteristic measurement function | |
| CN101138170A (en) | Measuring Signal Quality | |
| CN101253714A (en) | SIR detection apparatus and radio communication apparatus |
Legal Events
| Date | Code | Title | Description |
|---|---|---|---|
| PUAI | Public reference made under article 153(3) epc to a published international application that has entered the european phase |
Free format text: ORIGINAL CODE: 0009012 |
|
| 17P | Request for examination filed |
Effective date: 20030103 |
|
| AK | Designated contracting states |
Designated state(s): AT BE CH CY DE DK ES FI FR GB GR IE IT LI LU MC NL PT SE TR |
|
| RBV | Designated contracting states (corrected) |
Designated state(s): DE FI FR GB SE |
|
| A4 | Supplementary search report drawn up and despatched |
Effective date: 20050217 |
|
| 17Q | First examination report despatched |
Effective date: 20050524 |
|
| GRAP | Despatch of communication of intention to grant a patent |
Free format text: ORIGINAL CODE: EPIDOSNIGR1 |
|
| GRAS | Grant fee paid |
Free format text: ORIGINAL CODE: EPIDOSNIGR3 |
|
| GRAA | (expected) grant |
Free format text: ORIGINAL CODE: 0009210 |
|
| AK | Designated contracting states |
Kind code of ref document: B1 Designated state(s): DE FI FR GB SE |
|
| PG25 | Lapsed in a contracting state [announced via postgrant information from national office to epo] |
Ref country code: FI Free format text: LAPSE BECAUSE OF FAILURE TO SUBMIT A TRANSLATION OF THE DESCRIPTION OR TO PAY THE FEE WITHIN THE PRESCRIBED TIME-LIMIT Effective date: 20061011 |
|
| REG | Reference to a national code |
Ref country code: GB Ref legal event code: FG4D |
|
| REF | Corresponds to: |
Ref document number: 60123798 Country of ref document: DE Date of ref document: 20061123 Kind code of ref document: P |
|
| PG25 | Lapsed in a contracting state [announced via postgrant information from national office to epo] |
Ref country code: SE Free format text: LAPSE BECAUSE OF FAILURE TO SUBMIT A TRANSLATION OF THE DESCRIPTION OR TO PAY THE FEE WITHIN THE PRESCRIBED TIME-LIMIT Effective date: 20070111 |
|
| PGFP | Annual fee paid to national office [announced via postgrant information from national office to epo] |
Ref country code: DE Payment date: 20070522 Year of fee payment: 7 |
|
| EN | Fr: translation not filed | ||
| PLBE | No opposition filed within time limit |
Free format text: ORIGINAL CODE: 0009261 |
|
| STAA | Information on the status of an ep patent application or granted ep patent |
Free format text: STATUS: NO OPPOSITION FILED WITHIN TIME LIMIT |
|
| 26N | No opposition filed |
Effective date: 20070712 |
|
| GBPC | Gb: european patent ceased through non-payment of renewal fee |
Effective date: 20070608 |
|
| PG25 | Lapsed in a contracting state [announced via postgrant information from national office to epo] |
Ref country code: FR Free format text: LAPSE BECAUSE OF FAILURE TO SUBMIT A TRANSLATION OF THE DESCRIPTION OR TO PAY THE FEE WITHIN THE PRESCRIBED TIME-LIMIT Effective date: 20070601 |
|
| PG25 | Lapsed in a contracting state [announced via postgrant information from national office to epo] |
Ref country code: GB Free format text: LAPSE BECAUSE OF NON-PAYMENT OF DUE FEES Effective date: 20070608 |
|
| PG25 | Lapsed in a contracting state [announced via postgrant information from national office to epo] |
Ref country code: FR Free format text: LAPSE BECAUSE OF FAILURE TO SUBMIT A TRANSLATION OF THE DESCRIPTION OR TO PAY THE FEE WITHIN THE PRESCRIBED TIME-LIMIT Effective date: 20061011 |
|
| PG25 | Lapsed in a contracting state [announced via postgrant information from national office to epo] |
Ref country code: DE Free format text: LAPSE BECAUSE OF NON-PAYMENT OF DUE FEES Effective date: 20090101 |