EP1288639A1 - Living body data management system with function of displaying a growth process graph - Google Patents
Living body data management system with function of displaying a growth process graph Download PDFInfo
- Publication number
- EP1288639A1 EP1288639A1 EP02017391A EP02017391A EP1288639A1 EP 1288639 A1 EP1288639 A1 EP 1288639A1 EP 02017391 A EP02017391 A EP 02017391A EP 02017391 A EP02017391 A EP 02017391A EP 1288639 A1 EP1288639 A1 EP 1288639A1
- Authority
- EP
- European Patent Office
- Prior art keywords
- data
- growth
- acquired
- body weight
- storing means
- Prior art date
- Legal status (The legal status is an assumption and is not a legal conclusion. Google has not performed a legal analysis and makes no representation as to the accuracy of the status listed.)
- Withdrawn
Links
Images

Classifications
-
- G—PHYSICS
- G01—MEASURING; TESTING
- G01G—WEIGHING
- G01G19/00—Weighing apparatus or methods adapted for special purposes not provided for in the preceding groups
- G01G19/44—Weighing apparatus or methods adapted for special purposes not provided for in the preceding groups for weighing persons
- G01G19/50—Weighing apparatus or methods adapted for special purposes not provided for in the preceding groups for weighing persons having additional measuring devices, e.g. for height
-
- A—HUMAN NECESSITIES
- A61—MEDICAL OR VETERINARY SCIENCE; HYGIENE
- A61B—DIAGNOSIS; SURGERY; IDENTIFICATION
- A61B5/00—Measuring for diagnostic purposes; Identification of persons
- A61B5/103—Detecting, measuring or recording devices for testing the shape, pattern, colour, size or movement of the body or parts thereof, for diagnostic purposes
- A61B5/107—Measuring physical dimensions, e.g. size of the entire body or parts thereof
- A61B5/1072—Measuring physical dimensions, e.g. size of the entire body or parts thereof measuring distances on the body, e.g. measuring length, height or thickness
-
- G—PHYSICS
- G01—MEASURING; TESTING
- G01G—WEIGHING
- G01G19/00—Weighing apparatus or methods adapted for special purposes not provided for in the preceding groups
- G01G19/40—Weighing apparatus or methods adapted for special purposes not provided for in the preceding groups with provisions for indicating, recording, or computing price or other quantities dependent on the weight
- G01G19/413—Weighing apparatus or methods adapted for special purposes not provided for in the preceding groups with provisions for indicating, recording, or computing price or other quantities dependent on the weight using electromechanical or electronic computing means
- G01G19/414—Weighing apparatus or methods adapted for special purposes not provided for in the preceding groups with provisions for indicating, recording, or computing price or other quantities dependent on the weight using electromechanical or electronic computing means using electronic computing means only
- G01G19/4146—Weighing apparatus or methods adapted for special purposes not provided for in the preceding groups with provisions for indicating, recording, or computing price or other quantities dependent on the weight using electromechanical or electronic computing means using electronic computing means only for controlling caloric intake, e.g. diet control
-
- G—PHYSICS
- G01—MEASURING; TESTING
- G01G—WEIGHING
- G01G19/00—Weighing apparatus or methods adapted for special purposes not provided for in the preceding groups
- G01G19/44—Weighing apparatus or methods adapted for special purposes not provided for in the preceding groups for weighing persons
-
- G—PHYSICS
- G16—INFORMATION AND COMMUNICATION TECHNOLOGY [ICT] SPECIALLY ADAPTED FOR SPECIFIC APPLICATION FIELDS
- G16H—HEALTHCARE INFORMATICS, i.e. INFORMATION AND COMMUNICATION TECHNOLOGY [ICT] SPECIALLY ADAPTED FOR THE HANDLING OR PROCESSING OF MEDICAL OR HEALTHCARE DATA
- G16H10/00—ICT specially adapted for the handling or processing of patient-related medical or healthcare data
- G16H10/60—ICT specially adapted for the handling or processing of patient-related medical or healthcare data for patient-specific data, e.g. for electronic patient records
-
- G—PHYSICS
- G16—INFORMATION AND COMMUNICATION TECHNOLOGY [ICT] SPECIALLY ADAPTED FOR SPECIFIC APPLICATION FIELDS
- G16H—HEALTHCARE INFORMATICS, i.e. INFORMATION AND COMMUNICATION TECHNOLOGY [ICT] SPECIALLY ADAPTED FOR THE HANDLING OR PROCESSING OF MEDICAL OR HEALTHCARE DATA
- G16H40/00—ICT specially adapted for the management or administration of healthcare resources or facilities; ICT specially adapted for the management or operation of medical equipment or devices
- G16H40/60—ICT specially adapted for the management or administration of healthcare resources or facilities; ICT specially adapted for the management or operation of medical equipment or devices for the operation of medical equipment or devices
- G16H40/63—ICT specially adapted for the management or administration of healthcare resources or facilities; ICT specially adapted for the management or operation of medical equipment or devices for the operation of medical equipment or devices for local operation
-
- A—HUMAN NECESSITIES
- A61—MEDICAL OR VETERINARY SCIENCE; HYGIENE
- A61B—DIAGNOSIS; SURGERY; IDENTIFICATION
- A61B5/00—Measuring for diagnostic purposes; Identification of persons
- A61B5/0002—Remote monitoring of patients using telemetry, e.g. transmission of vital signals via a communication network
-
- A—HUMAN NECESSITIES
- A61—MEDICAL OR VETERINARY SCIENCE; HYGIENE
- A61B—DIAGNOSIS; SURGERY; IDENTIFICATION
- A61B5/00—Measuring for diagnostic purposes; Identification of persons
- A61B5/74—Details of notification to user or communication with user or patient ; user input means
- A61B5/742—Details of notification to user or communication with user or patient ; user input means using visual displays
Definitions
- the present invention relates to a living body data management system with a function of displaying a growth process graph which allows an examiner to realize growth trends of a body weight and height of a subject who is in a process of growing in contrast to reference growth trends of a body weight and height.
- the above system is not capable of allowing an examiner to realize the graphed trend in changes in the body weight of the subject in visual contrast to a reference trend in changes in a body weight.
- the above system in view of the fact that those who are fat in childhood often become fat when they enter adulthood, it has been becoming increasingly important to administrate trends in changes in a height and body weight in a stage in a process when growths of the height and body weight are significant.
- an object of the present invention is to provide a living body data management system with a function of displaying a growth process graph which allows an examiner to visually realize growth trends of a height and body weight of a subject who is in a process in which growths of the height and body weight are significant in contrast to reference growth trends of a height and body weight.
- graphs showing correlation(s) between the reference growth range data stored in the reference growth range data storing means and the acquired data stored in the acquired data storing means are displayed on the graph display means.
- the living body data management system of the present invention further comprises acquisition time point specifying means for specifying a time point at which the acquired data has been acquired, and the acquired data storing means continuously stores the acquired data if the acquisition time point of the acquired data which has been specified by the acquisition time point specifying means matches a growth administration time point. According to the system, only acquired data whose acquisition time point matches a growth administration time point is stored in the acquired data storing means. Thereby, a large amount of acquired data can be stored.
- the period in the growth process to which the reference growth range data stored in the reference growth range data storing means belongs is a period spanning from birth until the subject reaches under the age of seven. Thereby, an examiner can visually realize a growth status of the subject in an early stage of growth by contrasting the acquired data with the reference growth range data at a glance.
- the period in the growth process to which the reference growth range data stored in the reference growth range data storing means belongs is a period spanning from birth until the subject reaches the age of one.
- the growth administration time point is set on a weekly basis during a period spanning from birth until the subject reaches the age of one and set on a monthly basis after the subject reaches the age of one.
- intervals between growth administration time points are set to be short only during infancy which is a period between birth and the age of one, a large amount of acquired data can be stored, and a growth status of the subject particularly in the infancy in which growths of a body weight and height are significant can be realized clearly in an early stage.
- the graph display means displays graphs which are scrollable in directions of a vertical axis which represents acquired data and a horizontal axis which represents a period spanning from birth to a current age of the subject.
- the graph display means displays acquired data corresponding to a specified growth administration time point. Thereby, since acquired data corresponding to a specified growth administration time point is displayed, an examiner can realize acquired data corresponding to a growth administration time point which is associated with the acquired data that the examiner wants to know, without reading a scale.
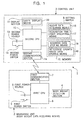
- Reference numeral 1 denotes a living body data management system with a function of displaying a growth process graph
- 2 a measuring unit (body weight data acquiring means); 3 a control unit; 4 a body weight detection section; 5 a first power switch; 6 a first power source; 7 a first communication section; 8 a first CPU; 9 a setting switch; 10 a memory; 11 a display section; 12 a second power switch; 13 a second power source; 14 a second communication section; 15 a second CPU; 16 height data acquiring means; 17 acquisition time point specifying means; 18 acquired data storing means; 19 reference growth range data storing means; 20 graph display means; a and d newly acquired body weight data; b and c newly acquired height data; H a growth curve graph of a height; W a growth curve graph of a body weight; and P a cursor.
- a living body data management system 1 with a function of displaying a growth process graph according to the present invention is roughly constituted by a measuring unit 2 and a control unit 3.
- the measuring unit 2 is body weight data acquiring means for acquiring body weight data of a subject. It comprises a body weight detection section 4 for detecting body weight data, a first power switch 5 for turning on the measuring unit 2, a first power source 6 for supplying power to the measuring unit 2 according to opening and closing of the first power switch 5, a first communication section 7 for carrying out data communication with a second communication section 14 of the control unit 3, and a first CPU 8 for controlling operations of these sections and performing computations.
- the control unit 3 comprises a setting switch 9, a memory 10, a display section 11, a second power switch 12 for turning on the control unit 3, a second power source 13 for supplying power to the control unit 3 according to opening and closing of the second power switch 12, the second communication section 14 for carrying out data communication with the first communication section 7 of the measuring unit 2, and a second CPU 15 for controlling operations of these sections and performing computations.
- the setting switch 9 of the control unit 3 is used to enter and set personal data of a subject such as a name, date of birth and gender and to operate a graph displayed on the display section 11. Further, the setting switch 9 is also height data acquiring means 16 for acquiring height data of a subject. The means 16 acquires height data of a subject by causing the subject to enter and set the height data of the subject by means of the setting switch 9. In addition, the setting switch 9 is also acquisition time point specifying means 17 for specifying a time point at which body weight data and height data have been acquired as acquired data. The means 17 specifies a time point at which body weight data and height data have been acquired by causing a subject to enter and set a date and time of measurements by means of the setting switch 9.
- the memory 10 comprises acquired data storing means 18 and reference growth range data storing means 19.
- the acquired data storing means 18 continuously store, as acquired data, body weight data acquired by the body weight acquiring means, i.e., body weight data sent from the measuring unit 2, and height data acquired by the height data acquiring means 16, i.e., height data entered and set by means of the setting switch 9.
- the reference growth range data storing means 19 stores in advance reference growth range data obtained as average growth ranges of body weights and heights of infants during a period spanning from birth until they reach under the age of seven, based on body weight data and height data collected from a number of infants during a period spanning from birth until they reach under the age of seven.
- the display section 11 displays personal data and height data of a subject which have been entered and set by means of the setting switch 9 and body weight data sent from the measuring unit 2.
- the display section 11 is also graph display means 20 for displaying graphs showing correlations between reference growth range data stored in the reference growth range data storing means 19 and acquired data stored in the acquired data storing means 18.
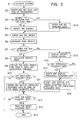
- Fig. 3 shows steps performed by the living body data management system with a function of displaying a growth process graph according to the present invention.
- the operations of the present invention will be described without describing operations of the measuring unit 2 separately from those of the control unit 3.
- the living body data management system 1 with a function of displaying a growth process graph according to the present invention is activated by closing the first power switch 5 of the measuring unit 2 and the second power switch 12 of the control unit 3 (STEP 1).
- a screen for entering and setting a date and time of measurement is displayed on the display section 11.
- a subject enters and sets a date and time of measurement by means of the setting switch 9 as the acquisition time point specifying means 17 (STEP 2).
- a screen which asks whether the subject is one who is to register for the first time (“YES") or not (“NO") is displayed on the display section 11 (STEP 3). If the subject has never registered, the subject chooses "YES” in STEP 3 and then enters and sets personal data of the subject such as a name, date of birth and gender in accordance with a screen displayed on the display section 11 (STEP 14).
- a screen for selecting a subject (for example, a screen showing a list of subjects who have registered in the past) is displayed on the display section 11, and the subject finds and selects himself/herself on the screen (STEP 4).
- a screen for entering and setting a height of the subject is displayed on the display section 11.
- the subject enters and sets height data at the time of measurement of the subject by means of the setting switch 9 as the height data acquiring means 16 (STEP 5).
- the height data entered and set by means of the setting switch 9 is stored in the acquired data storing means 18 temporarily.
- the body weight data is stored in the acquired data storing means 18 temporarily.
- the second CPU 15 calculates age of the subject from the date of measurement entered and set in STEP 2 and the date of birth entered in STEP 14 so as to determine whether the subject is under the age of seven (STEP 7). At this point, when the subject is one year old or younger, the age of the subject is determined in months and weeks, while when the subject is over one year old, the age of the subject is determined in years and months.
- an obesity index (%) of the subject is calculated (STEP 8).
- An obesity index (%) is determined based on a formula: (measured body weight (kg) - height 2 (m) x 22) ⁇ (height 2 (m) x 22) x 100.
- the obesity index (%) calculated by the second CPU 15 a comment on the obesity index, a symbol characterizing the subject, and the name (Riku-kun) of the subject are displayed (STEP 9).
- “somewhat fat” is displayed when the obesity index is 15% or higher and lower than 20%
- “fat” is displayed when the obesity index is 20% or higher and lower than 30%
- “too fat” is displayed when the obesity index is 30% or higher
- “thin” is displayed when the obesity index is -15% or lower.
- the second CPU 15 determines whether there are any previously acquired data in the acquired data storing means 18 (STEP 10).
- the previously acquired data as well as the newly acquired data are displayed on the display section 11 as a graph as shown in Fig. 4 (STEP 11).
- growth curve graphs obtained by graphing reference growth range data stored in the reference growth range data storing means 19 in advance are displayed on the display section 11 (STEP 15).
- the growth curve graphs displayed on the display section 11, as shown in Fig. 5, are displayed as average growth ranges (a growth curve graph of a body weight is a range W, and a growth curve graph of a height is a range H) of a body weight and height from birth to a current age of the subject, on a screen with a vertical axis representing a body weight and a height and a horizontal axis representing a period between birth and the current age of the subject.
- the newly acquired data, a symbol characterizing the subject, and the name (Kai-kun) of the subject are also displayed on the display section 11.
- the second CPU 15 determines whether there are any previously acquired data which are continuously stored in the acquired data storing means 18 (STEP 16).
- the previously acquired data which are continuously stored in the acquired data storing means 18 are displayed over the growth curve graphs displayed on the display section 11 as shown in Fig. 5 (STEP 17).
- the graphs displayed on the display section 11 represent correlations between the reference growth range data stored in the reference growth range data storing means 19 in advance and the previously acquired data stored in the acquired data storing means 18.
- STEP 11 or STEP 18 it is determined after STEP 11 or STEP 18 whether the acquisition time point of the newly acquired data stored in the acquired data storing means 18 falls on a growth administration time point (STEP 12). To be more specific, it is determined whether the acquisition time point of the newly acquired data which has been specified by the acquisition time point specifying means 17 matches a growth administration time point which is set on a weekly basis after birth when the subject is one year old or younger or on a monthly basis after birth when the subject is over one year old.
- the newly acquired data is stored in the acquired data storing means 18 subsequently to previously acquired data (STEP 13).
- the living body data management system 1 with a function of displaying a growth process graph displays, as the growth curve graphs (H, W), the reference growth range data obtained as average growth ranges of body weights and heights of infants during a period spanning from birth until they reach under the age of seven based on body weight data and height data collected from a number of infants during a period spanning from birth until they reach under the age of seven, on the display section 11 which is the graph display means 20 and further displays the acquired data stored in the acquired data storing means 18 over the growth curve graphs (H, W) displayed on the display section 11.
- an examiner can realize growth statuses of the acquired data by contrasting the acquired data with the growth curve graphs (H, W) at a glance.
- the reference growth range data are obtained as average growth ranges of body weights and heights of infants during a period spanning from birth until they reach under the age of seven, an examiner can realize the growth statuses of the acquired data in an early stage of growth.
- the acquisition time point of the newly acquired data which has been determined from the date and time of measurements entered and set by means of the setting switch 9 as the acquisition time point specifying means 17 matches a growth administration time point which indicates how many weeks have just passed since birth when the subject is one year old or younger or indicates how many months have just passed since birth when the subject is over one year old
- the newly acquired data is stored in the acquired data storing means 18 continuously.
- the graph displaying screen of the display section 11 as the graph display means 20 is scrolled not only in a horizontal direction according to the movement of the cursor P but also in a vertical direction so as to cause graph portions of body weights and heights which correspond to a position of the horizontally moved cursor P to fit in the screen.
- an examiner can view the graphs covering a whole period for administrating growth in a right size even if the screen for displaying the graphs is small.
- body weight data and height data at points on the graphs which correspond to a position of the cursor P are displayed near the points on the corresponding graphs, pointing at the points on the graphs.
- the reference growth range data are average growth ranges of body weights and heights of infants during a period spanning from birth until they reach under the age of seven
- the reference growth range data may be average growth ranges of body weights and heights of infants during a period spanning from birth until they reach the age of one.
- body weight data is acquired by measuring a body weight by means of the measuring unit 2, and height data is acquired by entering and setting a height by means of the setting switch 9.
- the body weight data may be acquired by entering and setting the body weight by means of the setting switch 9, and the height data may be acquired by measuring the height by means of the measuring unit 2 .
- both the body weight data and the height data may be acquired by means of only the measuring unit 2 or only the setting switch 9. In addition, only either one of the body weight data and the height data may be involved.
- the reference growth range data stored in the reference growth range data storing means 19 in advance are average growth ranges of body weights and heights of infants during a period spanning from birth until they reach under the age of seven based on body weight data and height data collected from a number of infants during a period spanning from birth until they reach under the age of seven.
- the reference growth range data may also be reference growth range data obtained as average growth ranges of body weights and heights of infants during a period with a low disease rate or other periods in a growth process.
- acquired data corresponding to time points specified by the acquisition time point specifying means 17 are stored continuously in the acquired data storing means 18.
- all data acquired by each measurement are stored in the acquired data storing means 18 and displayed as graphs on the graph display means 20 with a horizontal axis representing the number of measurements after birth by limiting intervals between the measurements.
- a growth administration time point is set on a weekly basis when a subject is one year old or younger or on a monthly basis when the subject is over one year old.
- the growth administration time point may be set on a biweekly basis when the subject is one year old or younger or on a bimonthly basis when the subject is over one year old.
- the growth administration time point may be set on a daily basis when the subject is one year old or younger or on a weekly basis or at other intervals when the subject is over one year old.
- a selecting switch may be provided to switch between two different measurement modes, e.g., a weekly basis when the subject is one year old or younger and a monthly basis when the subject is over one year old, according the age of the subject.
- the living body data management system with a function of displaying a growth process graph displays graphs showing correlations between reference growth range data and acquired data on the graph display means. Thereby, an examiner can visually realize growth statuses of the acquired data by contrasting the acquired data with the reference growth range data at a glance.
- the reference growth range data covers a period spanning from birth until a subject reaches under the age of seven in a growth process. Thereby, an examiner can visually realize a growth status of the subject in an early stage of growth by contrasting acquired data with the reference growth range data at a glance.
- the reference growth range data may cover a period spanning from birth until the subject reaches the age of one in a growth process.
- an examiner can visually realize a growth status of the subject particularly in infancy in which growths of a body weight and height are significant, by contrasting acquired data with the reference growth range data at a glance.
- acquired data are stored continuously in the acquired data storing means at short intervals between growth administration time points. Thereby, a large amount of acquired data can be stored, and a growth status of the subject particularly in the infancy in which growths of a body weight and height are significant can be realized clearly in an early stage.
- the graph display means displays graphs which are scrollable in directions of vertical and horizontal axes. Thereby, an examiner can view the graphs covering a whole period for administrating growth in a right size even if a display screen of the graph display means is small.
- the graph display means displays acquired data corresponding to a specified growth administration time point.
- an examiner can realize acquired data corresponding to a growth administration time point which is associated with the acquired data that the examiner wants to know, without reading a scale.
Abstract
Description
- The present invention relates to a living body data management system with a function of displaying a growth process graph which allows an examiner to realize growth trends of a body weight and height of a subject who is in a process of growing in contrast to reference growth trends of a body weight and height.
- It has heretofore been proposed to administrate a dietary life or health of a subject based on a trend in changes in a body weight of the subject by use of, for example, a system (refer to Japanese Patent Application Laid-Open No. 21689/1997) which displays body weights of the subject which are stored in body weight storing means in chronological order on display means as a graph.
- However, the above system is not capable of allowing an examiner to realize the graphed trend in changes in the body weight of the subject in visual contrast to a reference trend in changes in a body weight. Meanwhile, in view of the fact that those who are fat in childhood often become fat when they enter adulthood, it has been becoming increasingly important to administrate trends in changes in a height and body weight in a stage in a process when growths of the height and body weight are significant.
- Under the above circumstances, an object of the present invention is to provide a living body data management system with a function of displaying a growth process graph which allows an examiner to visually realize growth trends of a height and body weight of a subject who is in a process in which growths of the height and body weight are significant in contrast to reference growth trends of a height and body weight.
- It is a primary object of the present invention to provide a living body data management system with a function of displaying a growth process graph.
- It is a still further object of the present invention to provide a living body data management system with a function of displaying a growth process graph, which comprises body weight data acquiring means, acquired data storing means, reference growth range data storing means and graph display means, wherein the body weight data acquiring means acquires body weight data of a subject who is in a process of growing, the acquired data storing means continuously stores the body weight data acquired by the body weight data acquiring means as acquired data, the reference growth range data storing means stores reference growth range data determined as a reference growth range of a body weight during a period in the growth process, and the graph display means displays graphs showing a correlation between the reference growth range data stored in the reference growth range data storing means and the acquired data stored in the acquired data storing means.
- It is a still further object of the present invention to provide a living body data management system with a function of displaying a growth process graph, which comprises height data acquiring means, acquired data storing means, reference growth range data storing means and graph display means, wherein the height data acquiring means acquires height data of a subject who is in a process of growing, the acquired data storing means continuously stores the height data acquired by the height data acquiring means as acquired data, the reference growth range data storing means stores reference growth range data determined as a reference growth range of a height during a period in the growth process, and the graph display means displays graphs showing a correlation between the reference growth range data stored in the reference growth range data storing means and the acquired data stored in the acquired data storing means.
- It is a still further object of the present invention to provide a living body data management system with a function of displaying a growth process graph, which comprises body weight data acquiring means, height data acquiring means, acquired data storing means, reference growth range data storing means and graph display means, wherein the body weight data acquiring means acquires body weight data of a subject who is in a process of growing, the height data acquiring means acquires height data of the subject who is in a process of growing, the acquired data storing means continuously stores the body weight data acquired by the body weight data acquiring means and the height data acquired by the height data acquiring means as acquired data, the reference growth range data storing means stores reference growth range data determined as reference growth ranges of a body weight and height during a period in the growth process, and the graph display means displays graphs showing correlations between the reference growth range data stored in the reference growth range data storing means and the acquired data stored in the acquired data storing means.
- According to these systems, graphs showing correlation(s) between the reference growth range data stored in the reference growth range data storing means and the acquired data stored in the acquired data storing means are displayed on the graph display means. Thereby, an examiner can realize growth status(es) of the acquired data in contrast to the reference growth range data at a glance.
- Further, the living body data management system of the present invention further comprises acquisition time point specifying means for specifying a time point at which the acquired data has been acquired, and the acquired data storing means continuously stores the acquired data if the acquisition time point of the acquired data which has been specified by the acquisition time point specifying means matches a growth administration time point. According to the system, only acquired data whose acquisition time point matches a growth administration time point is stored in the acquired data storing means. Thereby, a large amount of acquired data can be stored.
- Further, the period in the growth process to which the reference growth range data stored in the reference growth range data storing means belongs is a period spanning from birth until the subject reaches under the age of seven. Thereby, an examiner can visually realize a growth status of the subject in an early stage of growth by contrasting the acquired data with the reference growth range data at a glance.
- Further, the period in the growth process to which the reference growth range data stored in the reference growth range data storing means belongs is a period spanning from birth until the subject reaches the age of one. Thereby, an examiner can visually realize a growth status of the subject particularly in infancy in which growths of a body weight and height are significant, by contrasting the acquired data with the reference growth range data at a glance.
- Further, the growth administration time point is set on a weekly basis during a period spanning from birth until the subject reaches the age of one and set on a monthly basis after the subject reaches the age of one. When intervals between growth administration time points are set to be short only during infancy which is a period between birth and the age of one, a large amount of acquired data can be stored, and a growth status of the subject particularly in the infancy in which growths of a body weight and height are significant can be realized clearly in an early stage.
- Further, the graph display means displays graphs which are scrollable in directions of a vertical axis which represents acquired data and a horizontal axis which represents a period spanning from birth to a current age of the subject. Thereby, since the graphs are scrollable in directions of the vertical and horizontal axes, an examiner can view the graphs covering a whole period for administrating growth in a right size even if a display screen of the graph display means is small.
- Further, the graph display means displays acquired data corresponding to a specified growth administration time point. Thereby, since acquired data corresponding to a specified growth administration time point is displayed, an examiner can realize acquired data corresponding to a growth administration time point which is associated with the acquired data that the examiner wants to know, without reading a scale.
-
- Fig. 1 is a block diagram showing a constitution of a living body data management system with a function of displaying a growth process graph according to the present invention.
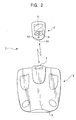
- Fig. 2 is a plan view of an external appearance of the living body data management system according to the present invention.
- Fig. 3 is a flowchart illustrating steps performed by the living body data management system according to the present invention.
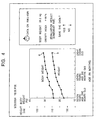
- Fig. 4 is an example of data displayed on the living body data management system according to the present invention.
- Fig. 5 is another example of data displayed on the living body data management system according to the present invention.
-
-
Reference numeral 1 denotes a living body data management system with a function of displaying a growth process graph; 2 a measuring unit (body weight data acquiring means); 3 a control unit; 4 a body weight detection section; 5 a first power switch; 6 a first power source; 7 a first communication section; 8 a first CPU; 9 a setting switch; 10 a memory; 11 a display section; 12 a second power switch; 13 a second power source; 14 a second communication section; 15 a second CPU; 16 height data acquiring means; 17 acquisition time point specifying means; 18 acquired data storing means; 19 reference growth range data storing means; 20 graph display means; a and d newly acquired body weight data; b and c newly acquired height data; H a growth curve graph of a height; W a growth curve graph of a body weight; and P a cursor. - Hereinafter, an embodiment of the present invention will be described with reference to the drawings.
- Firstly, a constitution of a living body data management system with a function of displaying a growth process graph is shown in a block diagram in Fig. 1. Further, a plan view of its external appearance is shown in Fig. 2. A living body
data management system 1 with a function of displaying a growth process graph according to the present invention is roughly constituted by ameasuring unit 2 and acontrol unit 3. - The
measuring unit 2 is body weight data acquiring means for acquiring body weight data of a subject. It comprises a bodyweight detection section 4 for detecting body weight data, afirst power switch 5 for turning on themeasuring unit 2, afirst power source 6 for supplying power to themeasuring unit 2 according to opening and closing of thefirst power switch 5, afirst communication section 7 for carrying out data communication with asecond communication section 14 of thecontrol unit 3, and afirst CPU 8 for controlling operations of these sections and performing computations. - The
control unit 3 comprises asetting switch 9, amemory 10, adisplay section 11, asecond power switch 12 for turning on thecontrol unit 3, asecond power source 13 for supplying power to thecontrol unit 3 according to opening and closing of thesecond power switch 12, thesecond communication section 14 for carrying out data communication with thefirst communication section 7 of themeasuring unit 2, and asecond CPU 15 for controlling operations of these sections and performing computations. - The
setting switch 9 of thecontrol unit 3 is used to enter and set personal data of a subject such as a name, date of birth and gender and to operate a graph displayed on thedisplay section 11. Further, thesetting switch 9 is also height data acquiring means 16 for acquiring height data of a subject. Themeans 16 acquires height data of a subject by causing the subject to enter and set the height data of the subject by means of thesetting switch 9. In addition, thesetting switch 9 is also acquisition time point specifying means 17 for specifying a time point at which body weight data and height data have been acquired as acquired data. Themeans 17 specifies a time point at which body weight data and height data have been acquired by causing a subject to enter and set a date and time of measurements by means of thesetting switch 9. - Further, the
memory 10 comprises acquired data storing means 18 and reference growth range data storing means 19. The acquired data storing means 18 continuously store, as acquired data, body weight data acquired by the body weight acquiring means, i.e., body weight data sent from themeasuring unit 2, and height data acquired by the heightdata acquiring means 16, i.e., height data entered and set by means of thesetting switch 9. The reference growth range data storing means 19 stores in advance reference growth range data obtained as average growth ranges of body weights and heights of infants during a period spanning from birth until they reach under the age of seven, based on body weight data and height data collected from a number of infants during a period spanning from birth until they reach under the age of seven. - Further, the
display section 11 displays personal data and height data of a subject which have been entered and set by means of thesetting switch 9 and body weight data sent from themeasuring unit 2. In addition, thedisplay section 11 is also graph display means 20 for displaying graphs showing correlations between reference growth range data stored in the reference growth range data storing means 19 and acquired data stored in the acquired data storing means 18. - Next, operations of the present invention will be described with reference to a flowchart in Fig. 3 which shows steps performed by the living body data management system with a function of displaying a growth process graph according to the present invention. The operations of the present invention will be described without describing operations of the measuring
unit 2 separately from those of thecontrol unit 3. Firstly, the living bodydata management system 1 with a function of displaying a growth process graph according to the present invention is activated by closing thefirst power switch 5 of themeasuring unit 2 and thesecond power switch 12 of the control unit 3 (STEP 1). - Then, a screen for entering and setting a date and time of measurement is displayed on the
display section 11. A subject enters and sets a date and time of measurement by means of thesetting switch 9 as the acquisition time point specifying means 17 (STEP 2). - Then, a screen which asks whether the subject is one who is to register for the first time ("YES") or not ("NO") is displayed on the display section 11 (STEP 3). If the subject has never registered, the subject chooses "YES" in
STEP 3 and then enters and sets personal data of the subject such as a name, date of birth and gender in accordance with a screen displayed on the display section 11 (STEP 14). - Meanwhile, if the subject has registered before, the subject chooses "NO" in
STEP 3. Thereby, a screen for selecting a subject (for example, a screen showing a list of subjects who have registered in the past) is displayed on thedisplay section 11, and the subject finds and selects himself/herself on the screen (STEP 4). - Then, a screen for entering and setting a height of the subject is displayed on the
display section 11. The subject enters and sets height data at the time of measurement of the subject by means of thesetting switch 9 as the height data acquiring means 16 (STEP 5). The height data entered and set by means of thesetting switch 9 is stored in the acquired data storing means 18 temporarily. - Then, a screen for encouraging the subject to measure his/her body weight is displayed on the
display section 11. Then, body weight data of the subject is measured by the measuringunit 2 which is the body weight data acquiring means (STEP 6). - Then, after the body weight is measured by the measuring
unit 2, the body weight data is stored in the acquired data storing means 18 temporarily. Subsequently, thesecond CPU 15 calculates age of the subject from the date of measurement entered and set inSTEP 2 and the date of birth entered inSTEP 14 so as to determine whether the subject is under the age of seven (STEP 7). At this point, when the subject is one year old or younger, the age of the subject is determined in months and weeks, while when the subject is over one year old, the age of the subject is determined in years and months. - When the subject is not under the age of seven ("NO" in STEP 7), an obesity index (%) of the subject is calculated (STEP 8). An obesity index (%) is determined based on a formula: (measured body weight (kg) - height2 (m) x 22) ÷ (height2 (m) x 22) x 100.
- Then, on the
display section 11, as shown in Fig. 4, the obesity index (%) calculated by thesecond CPU 15, a comment on the obesity index, a symbol characterizing the subject, and the name (Riku-kun) of the subject are displayed (STEP 9). As the comment, "somewhat fat" is displayed when the obesity index is 15% or higher and lower than 20%, "fat" is displayed when the obesity index is 20% or higher and lower than 30%, "too fat" is displayed when the obesity index is 30% or higher, and "thin" is displayed when the obesity index is -15% or lower. - Then, the
second CPU 15 determines whether there are any previously acquired data in the acquired data storing means 18 (STEP 10). When there are previously acquired data ("YES" in STEP 10), the previously acquired data as well as the newly acquired data (body weight data a and height data b obtained in the latest measurements) are displayed on thedisplay section 11 as a graph as shown in Fig. 4 (STEP 11). - Meanwhile, when the subject is under the age of seven ("YES" in STEP 7), growth curve graphs obtained by graphing reference growth range data stored in the reference growth range data storing means 19 in advance are displayed on the display section 11 (STEP 15). The growth curve graphs displayed on the
display section 11, as shown in Fig. 5, are displayed as average growth ranges (a growth curve graph of a body weight is a range W, and a growth curve graph of a height is a range H) of a body weight and height from birth to a current age of the subject, on a screen with a vertical axis representing a body weight and a height and a horizontal axis representing a period between birth and the current age of the subject. Together with the growth curve graphs, the newly acquired data, a symbol characterizing the subject, and the name (Kai-kun) of the subject are also displayed on thedisplay section 11. - Then, the
second CPU 15 determines whether there are any previously acquired data which are continuously stored in the acquired data storing means 18 (STEP 16). When there are previously acquired data ("YES" in STEP 16), the previously acquired data which are continuously stored in the acquired data storing means 18 are displayed over the growth curve graphs displayed on thedisplay section 11 as shown in Fig. 5 (STEP 17). Thus, the graphs displayed on thedisplay section 11 represent correlations between the reference growth range data stored in the reference growth range data storing means 19 in advance and the previously acquired data stored in the acquired data storing means 18. - Meanwhile, when it has been determined in
STEP 16 that there are no previously acquired data ("NO" in STEP 16), only the newly acquired data which have been temporarily stored in the acquired data storing means 18 are displayed over the growth curve graphs displayed on thedisplay section 11. Further, afterSTEP 17, as shown in Fig. 5, the newly acquired data (body weight data d and height data c obtained in the latest measurements) are also displayed in addition to the previously acquired data displayed in STEP 17 (STEP 18). - Then, after
STEP 11 orSTEP 18, when a cursor P as shown in Fig. 5 which appears on the horizontal axis representing a period between birth and the current age of the subject is moved in a horizontal direction by means of the settingswitch 9, a screen of thedisplay section 11 which displays the graphs is scrolled not only in a horizontal direction according to the movement of the cursor P but also in a vertical direction so as to cause graph portions of body weights and heights which correspond to a position of the horizontally moved cursor P to fit in the screen. Further, as shown in Fig. 5, body weight data (10.1 kg) and height data (78 cm) at points on the graphs which correspond to a point on the horizontal axis where the cursor P appears are displayed near the points on the corresponding graphs, pointing at the points on the graphs. - Meanwhile, when there are no previously acquired data in the acquired data storing means 18 ("NO" in STEP 10), it is determined after
STEP 11 orSTEP 18 whether the acquisition time point of the newly acquired data stored in the acquired data storing means 18 falls on a growth administration time point (STEP 12). To be more specific, it is determined whether the acquisition time point of the newly acquired data which has been specified by the acquisition time point specifying means 17 matches a growth administration time point which is set on a weekly basis after birth when the subject is one year old or younger or on a monthly basis after birth when the subject is over one year old. - Then, when the acquisition time point of the newly acquired data, in other words, the age determined in
STEP 7, matches a growth administration time point ("YES" in STEP 12), the newly acquired data is stored in the acquired data storing means 18 subsequently to previously acquired data (STEP 13). - Meanwhile, when the acquisition time point of the newly acquired data does not match any growth administration time point ("NO" in STEP 12) or after
STEP 13, thesystem 1 ends the whole procedure (STEP 19). - As described above, the living body
data management system 1 with a function of displaying a growth process graph displays, as the growth curve graphs (H, W), the reference growth range data obtained as average growth ranges of body weights and heights of infants during a period spanning from birth until they reach under the age of seven based on body weight data and height data collected from a number of infants during a period spanning from birth until they reach under the age of seven, on thedisplay section 11 which is the graph display means 20 and further displays the acquired data stored in the acquired data storing means 18 over the growth curve graphs (H, W) displayed on thedisplay section 11. Thereby, an examiner can realize growth statuses of the acquired data by contrasting the acquired data with the growth curve graphs (H, W) at a glance. In particular, since the reference growth range data are obtained as average growth ranges of body weights and heights of infants during a period spanning from birth until they reach under the age of seven, an examiner can realize the growth statuses of the acquired data in an early stage of growth. - Further, when the acquisition time point of the newly acquired data which has been determined from the date and time of measurements entered and set by means of the setting
switch 9 as the acquisition time point specifying means 17 matches a growth administration time point which indicates how many weeks have just passed since birth when the subject is one year old or younger or indicates how many months have just passed since birth when the subject is over one year old, the newly acquired data is stored in the acquired data storing means 18 continuously. Thus, by setting intervals between growth administration time points to be short only during infancy which is a period between birth and the age of one, a large amount of acquired data can be stored, and a growth status of the subject particularly in the infancy in which growths of a body weight and height are significant can be realized clearly in an early stage. - Further, along with horizontal movement of the cursor P which appears on the horizontal axis representing a period between birth and the current age of the subject by means of the setting
switch 9, the graph displaying screen of thedisplay section 11 as the graph display means 20 is scrolled not only in a horizontal direction according to the movement of the cursor P but also in a vertical direction so as to cause graph portions of body weights and heights which correspond to a position of the horizontally moved cursor P to fit in the screen. Thereby, an examiner can view the graphs covering a whole period for administrating growth in a right size even if the screen for displaying the graphs is small. - Further, when the cursor P is moved, i.e., when a growth administration time point is specified, body weight data and height data at points on the graphs which correspond to a position of the cursor P, i.e., acquired data corresponding to the specified growth administration time point, are displayed near the points on the corresponding graphs, pointing at the points on the graphs. Thereby, an examiner can realize acquired data corresponding to a growth administration time point which is associated with the acquired data that the examiner wants to know, without reading a scale.
- Further, in the above embodiment, although the reference growth range data are average growth ranges of body weights and heights of infants during a period spanning from birth until they reach under the age of seven, the reference growth range data may be average growth ranges of body weights and heights of infants during a period spanning from birth until they reach the age of one. Thereby, an examiner can realize a growth status of the subject particularly in an early stage, i.e., in infancy in which growths of a body weight and height are significant, by contrasting the acquired data with the reference growth range data at a glance.
- Further, in the above embodiment, body weight data is acquired by measuring a body weight by means of the measuring
unit 2, and height data is acquired by entering and setting a height by means of the settingswitch 9. However, the body weight data may be acquired by entering and setting the body weight by means of the settingswitch 9, and the height data may be acquired by measuring the height by means of the measuringunit 2 . Alternatively, both the body weight data and the height data may be acquired by means of only the measuringunit 2 or only the settingswitch 9. In addition, only either one of the body weight data and the height data may be involved. - Further, in the above embodiment, the reference growth range data stored in the reference growth range data storing means 19 in advance are average growth ranges of body weights and heights of infants during a period spanning from birth until they reach under the age of seven based on body weight data and height data collected from a number of infants during a period spanning from birth until they reach under the age of seven. However, the reference growth range data may also be reference growth range data obtained as average growth ranges of body weights and heights of infants during a period with a low disease rate or other periods in a growth process.
- Further, in the above embodiment, acquired data corresponding to time points specified by the acquisition time point specifying means 17 are stored continuously in the acquired data storing means 18. However, it is also possible that all data acquired by each measurement are stored in the acquired data storing means 18 and displayed as graphs on the graph display means 20 with a horizontal axis representing the number of measurements after birth by limiting intervals between the measurements.
- Further, in the above embodiment, a growth administration time point is set on a weekly basis when a subject is one year old or younger or on a monthly basis when the subject is over one year old. However, the growth administration time point may be set on a biweekly basis when the subject is one year old or younger or on a bimonthly basis when the subject is over one year old. Alternatively, the growth administration time point may be set on a daily basis when the subject is one year old or younger or on a weekly basis or at other intervals when the subject is over one year old. Further, a selecting switch may be provided to switch between two different measurement modes, e.g., a weekly basis when the subject is one year old or younger and a monthly basis when the subject is over one year old, according the age of the subject.
- As described above, the living body data management system with a function of displaying a growth process graph according to the present invention displays graphs showing correlations between reference growth range data and acquired data on the graph display means. Thereby, an examiner can visually realize growth statuses of the acquired data by contrasting the acquired data with the reference growth range data at a glance.
- Further, since only acquired data corresponding to growth administration time points are stored in the acquired data storing means, a large amount of acquired data can be stored.
- Further, the reference growth range data covers a period spanning from birth until a subject reaches under the age of seven in a growth process. Thereby, an examiner can visually realize a growth status of the subject in an early stage of growth by contrasting acquired data with the reference growth range data at a glance.
- Alternatively, the reference growth range data may cover a period spanning from birth until the subject reaches the age of one in a growth process. Thereby, an examiner can visually realize a growth status of the subject particularly in infancy in which growths of a body weight and height are significant, by contrasting acquired data with the reference growth range data at a glance.
- Further, only during infancy which is a period between birth and the age of one, acquired data are stored continuously in the acquired data storing means at short intervals between growth administration time points. Thereby, a large amount of acquired data can be stored, and a growth status of the subject particularly in the infancy in which growths of a body weight and height are significant can be realized clearly in an early stage.
- Further, the graph display means displays graphs which are scrollable in directions of vertical and horizontal axes. Thereby, an examiner can view the graphs covering a whole period for administrating growth in a right size even if a display screen of the graph display means is small.
- Further, the graph display means displays acquired data corresponding to a specified growth administration time point. Thereby, an examiner can realize acquired data corresponding to a growth administration time point which is associated with the acquired data that the examiner wants to know, without reading a scale.
Claims (9)
- A living body data management system with a function of displaying a growth process graph, comprising:whereinbody weight data acquiring means,acquired data storing means,reference growth range data storing means, andgraph display means,
the body weight data acquiring means acquires body weight data of a subject who is in a process of growing,
the acquired data storing means continuously stores the body weight data acquired by the body weight data acquiring means as acquired data,
the reference growth range data storing means stores reference growth range data determined as a reference growth range of a body weight during a period in the growth process, and
the graph display means displays graphs showing a correlation between the reference growth range data stored in the reference growth range data storing means and the acquired data stored in the acquired data storing means. - A living body data management system with a function of displaying a growth process graph, comprising:whereinheight data acquiring means,acquired data storing means,reference growth range data storing means, andgraph display means,
the height data acquiring means acquires height data of a subject who is in a process of growing,
the acquired data storing means continuously stores the height data acquired by the height data acquiring means as acquired data,
the reference growth range data storing means stores reference growth range data determined as a reference growth range of a height during a period in the growth process, and
the graph display means displays graphs showing a correlation between the reference growth range data stored in the reference growth range data storing means and the acquired data stored in the acquired data storing means. - A living body data management system with a function of displaying growth process graphs, comprising:whereinbody weight data acquiring means,height data acquiring means,acquired data storing means,reference growth range data storing means, andgraph display means,
the body weight data acquiring means acquires body weight data of a subject who is in a process of growing,
the height data acquiring means acquires height data of the subject who is in a process of growing,
the acquired data storing means continuously stores the body weight data acquired by the body weight data acquiring means and the height data acquired by the height data acquiring means as acquired data,
the reference growth range data storing means stores reference growth range data determined as reference growth ranges of a body weight and height during a period in the growth process, and
the graph display means displays graphs showing correlations between the reference growth range data stored in the reference growth range data storing means and the acquired data stored in the acquired data storing means. - The system of any one of claims 1 to 3, wherein acquisition time point specifying means for specifying a time point at which the acquired data has been acquired is further provided, and the acquired data storing means continuously stores the acquired data if the acquisition time point of the acquired data which has been specified by the acquisition time point specifying means matches a growth administration time point.
- The system of any one of claims 1 to 4, wherein the period in the growth process to which the reference growth range data stored in the reference growth range data storing means belongs is a period spanning from birth until the subject reaches under the age of seven.
- The system of any one of claims 1 to 4, wherein the period in the growth process to which the reference growth range data stored in the reference growth range data storing means belongs is a period spanning from birth until the subject reaches the age of one.
- The system of claim 4, wherein the growth administration time point is set on a weekly basis during a period spanning from birth until the subject reaches the age of one and set on a monthly basis after the subject reaches the age of one.
- The system of any one of claims 1 to 7, wherein the graph display means displays graphs which are scrollable in directions of a vertical axis which represents acquired data and a horizontal axis which represents a period spanning from birth to a current age of the subject.
- The system of any one of claims 1 to 8, wherein the graph display means displays acquired data corresponding to a specified growth administration time point.
Applications Claiming Priority (2)
| Application Number | Priority Date | Filing Date | Title |
|---|---|---|---|
| JP2001259014A JP3874243B2 (en) | 2001-08-29 | 2001-08-29 | Biological information management device with growth process graph display function |
| JP2001259014 | 2001-08-29 |
Publications (1)
| Publication Number | Publication Date |
|---|---|
| EP1288639A1 true EP1288639A1 (en) | 2003-03-05 |
Family
ID=19086446
Family Applications (1)
| Application Number | Title | Priority Date | Filing Date |
|---|---|---|---|
| EP02017391A Withdrawn EP1288639A1 (en) | 2001-08-29 | 2002-08-02 | Living body data management system with function of displaying a growth process graph |
Country Status (3)
| Country | Link |
|---|---|
| US (1) | US6853949B2 (en) |
| EP (1) | EP1288639A1 (en) |
| JP (1) | JP3874243B2 (en) |
Cited By (3)
| Publication number | Priority date | Publication date | Assignee | Title |
|---|---|---|---|---|
| EP1990615A3 (en) * | 2007-05-09 | 2011-05-04 | Tanita Corporation | Biometric apparatus |
| EP2700915A1 (en) * | 2012-08-22 | 2014-02-26 | Seb Sa | Electronic scale |
| CN103968926A (en) * | 2014-05-14 | 2014-08-06 | 杭州云豆科技有限公司 | Intelligent height and weight measuring system |
Families Citing this family (14)
| Publication number | Priority date | Publication date | Assignee | Title |
|---|---|---|---|---|
| US20040238228A1 (en) * | 2003-06-02 | 2004-12-02 | Montague David S. | Scale that provides a display of an individual's weight history on a remote computer |
| KR20050079235A (en) * | 2004-02-04 | 2005-08-09 | 삼성전자주식회사 | System and method for managing growth and development of children |
| WO2006066144A2 (en) * | 2004-12-16 | 2006-06-22 | Conair Corporation | Remotely controlled weight scales |
| US7437781B2 (en) * | 2005-09-16 | 2008-10-21 | Pleo Originals, Llc | Toilet seat cover scale device |
| US8747310B2 (en) * | 2006-11-27 | 2014-06-10 | Rush University Medical Center | Method and apparatus for assessing the health of an infant by estimating average growth velocity using an exponential model |
| US7910840B2 (en) * | 2007-01-31 | 2011-03-22 | Fook Tin Technologies Ltd. | Apparatus and method for determining growth status of a human subject |
| US20100051353A1 (en) * | 2008-09-03 | 2010-03-04 | Graco Children's Products Inc. | Child Growth Monitoring |
| JP5223042B2 (en) * | 2013-01-04 | 2013-06-26 | 株式会社タニタ | Body composition meter |
| CN104061992A (en) * | 2013-03-20 | 2014-09-24 | 北京知康优美科技有限公司 | Intelligent weighing scale based on internet of things technology and realization method thereof |
| WO2015078939A1 (en) * | 2013-11-29 | 2015-06-04 | Nestec S.A. | Devices, systems and methods of assessing the risk of obesity later in life of an infant or a young child |
| CN104523238A (en) * | 2015-01-12 | 2015-04-22 | 重庆学童安科技有限公司 | Intelligent management system for kindergarten |
| JP6480812B2 (en) * | 2015-05-26 | 2019-03-13 | 公益財団法人ヒューマンサイエンス振興財団 | Weight scale and growth peak judgment method |
| WO2017099580A1 (en) * | 2015-12-11 | 2017-06-15 | N.V. Nutricia | Baby tracker |
| WO2017106320A1 (en) * | 2015-12-15 | 2017-06-22 | Romani Renato | Weight management system |
Citations (6)
| Publication number | Priority date | Publication date | Assignee | Title |
|---|---|---|---|---|
| US4113039A (en) * | 1975-08-11 | 1978-09-12 | Kubota, Ltd. | Body weight measuring apparatus |
| US4301879A (en) * | 1980-02-27 | 1981-11-24 | Dubow Arnold A | Body weight scale with historical record display |
| FR2708343A1 (en) * | 1993-07-26 | 1995-02-03 | Torralba Torres Manuel | Device for weighing and measuring babies |
| JPH09238926A (en) * | 1996-03-13 | 1997-09-16 | Shimadzu Corp | Health management apparatus |
| EP1076230A1 (en) * | 1999-08-12 | 2001-02-14 | Tanita Corporation | Weighing scale for determining the weight of a pregnant woman |
| EP1219937A1 (en) * | 2000-12-28 | 2002-07-03 | Tanita Corporation | Postpartum supporting apparatus |
Family Cites Families (2)
| Publication number | Priority date | Publication date | Assignee | Title |
|---|---|---|---|---|
| US5579782A (en) * | 1993-08-12 | 1996-12-03 | Omron Corporation | Device to provide data as a guide to health management |
| JP2998598B2 (en) | 1995-07-10 | 2000-01-11 | 松下電器産業株式会社 | Weight storage device |
-
2001
- 2001-08-29 JP JP2001259014A patent/JP3874243B2/en not_active Expired - Fee Related
-
2002
- 2002-08-02 EP EP02017391A patent/EP1288639A1/en not_active Withdrawn
- 2002-08-23 US US10/226,203 patent/US6853949B2/en not_active Expired - Fee Related
Patent Citations (6)
| Publication number | Priority date | Publication date | Assignee | Title |
|---|---|---|---|---|
| US4113039A (en) * | 1975-08-11 | 1978-09-12 | Kubota, Ltd. | Body weight measuring apparatus |
| US4301879A (en) * | 1980-02-27 | 1981-11-24 | Dubow Arnold A | Body weight scale with historical record display |
| FR2708343A1 (en) * | 1993-07-26 | 1995-02-03 | Torralba Torres Manuel | Device for weighing and measuring babies |
| JPH09238926A (en) * | 1996-03-13 | 1997-09-16 | Shimadzu Corp | Health management apparatus |
| EP1076230A1 (en) * | 1999-08-12 | 2001-02-14 | Tanita Corporation | Weighing scale for determining the weight of a pregnant woman |
| EP1219937A1 (en) * | 2000-12-28 | 2002-07-03 | Tanita Corporation | Postpartum supporting apparatus |
Non-Patent Citations (1)
| Title |
|---|
| PATENT ABSTRACTS OF JAPAN vol. 1998, no. 01 30 January 1998 (1998-01-30) * |
Cited By (5)
| Publication number | Priority date | Publication date | Assignee | Title |
|---|---|---|---|---|
| EP1990615A3 (en) * | 2007-05-09 | 2011-05-04 | Tanita Corporation | Biometric apparatus |
| US8457732B2 (en) | 2007-05-09 | 2013-06-04 | Tanita Corporation | Biometric apparatus |
| EP2700915A1 (en) * | 2012-08-22 | 2014-02-26 | Seb Sa | Electronic scale |
| FR2994738A1 (en) * | 2012-08-22 | 2014-02-28 | Seb Sa | ELECTRONIC WEIGHING APPARATUS |
| CN103968926A (en) * | 2014-05-14 | 2014-08-06 | 杭州云豆科技有限公司 | Intelligent height and weight measuring system |
Also Published As
| Publication number | Publication date |
|---|---|
| US20030046009A1 (en) | 2003-03-06 |
| US6853949B2 (en) | 2005-02-08 |
| JP3874243B2 (en) | 2007-01-31 |
| JP2003061934A (en) | 2003-03-04 |
Similar Documents
| Publication | Publication Date | Title |
|---|---|---|
| US6853949B2 (en) | Living body data management system with function of displaying growth process graph | |
| US9386955B2 (en) | Apparatus and method for monitoring blood glucose levels including convenient display of blood glucose value average and constituent values | |
| US8541700B2 (en) | Weight scale | |
| JP5923857B2 (en) | Activity meter | |
| US9060681B2 (en) | Trend monitoring system with multiple access levels | |
| US20040111034A1 (en) | System for measuring at least one body parameter, a blood pressure monitor and a medical thermometer | |
| US20040260192A1 (en) | Electrocardiograph and method of displaying electrocardiographic wave | |
| US20030225315A1 (en) | Data analysis system | |
| US20120221495A1 (en) | Digital weight loss aid | |
| CN103371807A (en) | Method and equipment for determining reference body temperature | |
| EP2458518A2 (en) | Remote healthcare system and healthcare method using the same | |
| ES2944565T3 (en) | Method and device method for analyzing continuously controlled physiological measurement values of a user, a system and a computer program product | |
| JP2002015068A (en) | Measurement/diagnosis system with the use of health care equipment, using communication network, and measurement/diagnosis method with the use of health care equipment, using communication network | |
| KR20080090552A (en) | Blood pressure meter where variation in blood pressure value can be known | |
| JP6733806B2 (en) | Urination information display device and urination information display system | |
| CN112927773A (en) | Biological data management method, system and computer-readable recording medium | |
| CN107320135A (en) | Natural family planning instruction device and method | |
| TWI627940B (en) | Physiological parameter monitoring system | |
| US20220047226A1 (en) | Health assistance system and wearable device | |
| EP3355311A1 (en) | Method, system, and computer program product for dynamic analysis of a physiological parameter | |
| US20230129975A1 (en) | Evaluation system based on analyte data | |
| CN116543903B (en) | Alcohol concentration prediction method and alcohol concentration prediction device | |
| KR101036298B1 (en) | Real-time game system and service using bio-sensor and communication terminal | |
| JP2024029812A (en) | Mental and physical health support system | |
| KR20230009551A (en) | A comprehensive AI health management system based on big data on the utilization and management of personal medical information based on blockchain |
Legal Events
| Date | Code | Title | Description |
|---|---|---|---|
| PUAI | Public reference made under article 153(3) epc to a published international application that has entered the european phase |
Free format text: ORIGINAL CODE: 0009012 |
|
| 17P | Request for examination filed |
Effective date: 20020829 |
|
| AK | Designated contracting states |
Kind code of ref document: A1 Designated state(s): AT BE BG CH CY CZ DE DK EE ES FI FR GB GR IE IT LI LU MC NL PT SE SK TR Designated state(s): AT BE BG CH CY CZ DE DK EE ES FI FR GB GR IE IT LI LU MC NL PT SE SK TR |
|
| AX | Request for extension of the european patent |
Extension state: AL LT LV MK RO SI |
|
| AKX | Designation fees paid |
Designated state(s): DE FR GB |
|
| 17Q | First examination report despatched |
Effective date: 20050315 |
|
| STAA | Information on the status of an ep patent application or granted ep patent |
Free format text: STATUS: THE APPLICATION IS DEEMED TO BE WITHDRAWN |
|
| 18D | Application deemed to be withdrawn |
Effective date: 20090703 |