EP1271129A2 - Depth and concentration estimation - Google Patents
Depth and concentration estimation Download PDFInfo
- Publication number
- EP1271129A2 EP1271129A2 EP02254092A EP02254092A EP1271129A2 EP 1271129 A2 EP1271129 A2 EP 1271129A2 EP 02254092 A EP02254092 A EP 02254092A EP 02254092 A EP02254092 A EP 02254092A EP 1271129 A2 EP1271129 A2 EP 1271129A2
- Authority
- EP
- European Patent Office
- Prior art keywords
- electromagnetic radiation
- opening
- fluid
- radiation
- chemical
- Prior art date
- Legal status (The legal status is an assumption and is not a legal conclusion. Google has not performed a legal analysis and makes no representation as to the accuracy of the status listed.)
- Withdrawn
Links
Images


Classifications
-
- G—PHYSICS
- G01—MEASURING; TESTING
- G01N—INVESTIGATING OR ANALYSING MATERIALS BY DETERMINING THEIR CHEMICAL OR PHYSICAL PROPERTIES
- G01N21/00—Investigating or analysing materials by the use of optical means, i.e. using sub-millimetre waves, infrared, visible or ultraviolet light
- G01N21/17—Systems in which incident light is modified in accordance with the properties of the material investigated
- G01N21/47—Scattering, i.e. diffuse reflection
- G01N21/49—Scattering, i.e. diffuse reflection within a body or fluid
- G01N21/53—Scattering, i.e. diffuse reflection within a body or fluid within a flowing fluid, e.g. smoke
- G01N21/534—Scattering, i.e. diffuse reflection within a body or fluid within a flowing fluid, e.g. smoke by measuring transmission alone, i.e. determining opacity
Definitions
- the invention relates to a method of estimating dimensions of an opening in a body. Additionally, the invention relates to a method of monitoring concentration of a chemical in a fluid filling an opening in a body.
- a known body is a chip-type micro-reactor used, for example, for performing chemical reactions.
- the micro-reactor is formed from a base plate and an upper block.
- a plurality of interconnected grooves are etched in an upper surface of the base plate and this upper surface is then thermally bonded to a lower surface of the upper block.
- the lower surface of the upper block closes the grooves so as to form a plurality of interconnected channels in the micro-reactor. Reagents are moved through, and react within, these channels.
- the dimensions of the channels can be determined by cutting the micro-reactor, so as to reveal the channels in cross-section. However, this clearly destroys the micro-reactor. Moreover, it is extremely difficult to obtain a clean cut without chipping the micro-reactor around the edges of the channels.
- a method of estimating dimensions of an opening in a body comprising, filling the opening with a fluid that absorbs an electromagnetic radiation, transmitting said electromagnetic radiation through the body and through the fluid in the opening, determining an intensity of the electromagnetic radiation, after transmission through the fluid, at an area corresponding to a radiation path through the fluid in the opening, and using said intensity to estimate the length of said radiation path.
- This method allows dimensions of openings in a body to be estimated in a nondestructive manner.
- a method of monitoring concentration of a chemical in a fluid filling an opening in a body, the chemical absorbing an electromagnetic radiation comprising transmitting said electromagnetic radiation through the body and through the fluid in the opening, determining respective intensities of the electromagnetic radiation, after transmission through the fluid, at a plurality of areas corresponding to respective radiation paths through the fluid in the opening, and using said intensities to estimate respective concentrations of the chemical in the radiation paths.
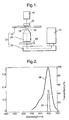
- the apparatus comprises a tungsten lamp 10, a microscope 12, a CCD camera 14 and a narrow bandpass filter 16.
- the tungsten lamp 10 has a power rating of 100W and emits light over the wavelength range from approximately 400nm to approximately 800nm.
- the microscope 12 includes a microscope stage 18 and an objective lens 20, which may have a magnification of, for example, 1.5X or greater. Additionally, the microscope 12 includes a structure 22 that houses optics allowing an image to be directed either to the camera 14 or to an eye-piece (not shown).
- the camera 14 is a digital monochrome CCD camera (Hamamatsu C4742-95-12NRB).
- the camera gives a digital output of 1024 x 1024 pixels with 12 bit resolution of the light intensity in each pixel.
- the camera is connected to a personal computer (not shown) and controlled by the digital image recording and analysis software AQM from Kinetic Imaging Ltd.
- the narrow bandpass filter 16 is an Edmund Scientific N43-136 filter having a transmission peak at 649nm and a full width at half maximum absorbance of 11nm.
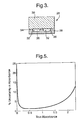
- the transmission spectra of the bandpass filter 16 is shown at 24 in Figure 2.
- the tungsten lamp 10, the microscope 12, the camera 14 and the bandpass filter 16 are covered by a hood (not shown) to exclude or reduce ambient light.
- the arrangement is such that light from the tungsten lamp 10 passes through an aperture 19 in the microscope stage 18 into the objective 20 of the microscope, and then through the narrow bandpass filter 16 and into the structure 22. Within the structure 22 light is directed into the camera 14 (or can be directed to the eye-piece if required). A sample can be positioned on the stage 18 in the light path between the tungsten lamp and the objective 20 so that an enlarged, transmission image of a sample can be recorded by the camera 14.
- the camera 14 and the digital image recording and analysis software are set up so that the camera output pixels are grouped into groups of 16 pixels (squares of 4 pixels x 4 pixels) so as to give a square output array of 256 x 256 groups. For each group, separate light intensities of the constituent 16 camera output pixels, measured by the camera 14, are averaged to give a single mean intensity value.
- This arrangement which is also known as "4 x 4 binning", provides a good compromise between rapid data acquisition, signal-to-noise ratio, spatial resolution and data file size.
- Scion Image software (Scion Corporation) is used to transfer the mean intensity value of each group of the 256 x 256 output array into Microsoft EXCEL, which is used for performing calculations utilising the values.
- the micro-reactor 26 is shown in Figures 1 and 3 and is of known type.
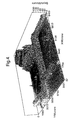
- the micro-reactor 26 has a base plate 28 that is formed of glass and that has a thickness of about 2mm (the height of the base plate 28 as shown in Figure 3).
- a plurality of interconnecting grooves (two of which are shown at 32 in Figure 3) have been etched into the upper surface of the base plate 28 using known methods.
- the grooves 32 have a width of approximately 450 ⁇ m and are exaggerated in size in Figures 1 and 3 for clarity.
- the micro-reactor 26 also has an upper block 30 having a lower surface 34 that has been thermally bonded to the upper surface of the base plate 28 in a known manner. Hence, the lower surface 34 of the upper block 30 closes the grooves 32 so as to form the channels 36. Additionally the upper block 30 has a plurality of cylindrical apertures (not shown) extending between its upper and lower surfaces. These apertures connect with the channels 36 and serve as reservoirs for liquids.
- the reference solution is simply the solvent (in the absence of any dye) in which the dye is dissolved in the dye solution.
- the reference solution consists of 30.2 weight % glycerol in m-cresol.
- the dye solution is a solution of the dye Patent Blue in the reference solution.
- the concentration of the Patent Blue in the dye solution is 0.8275mM. Factors that influence the choice of Patent Blue concentration in the dye solution are discussed below.
- the absorption spectrum of the dye solution is shown at 38 in Figure 2. As shown in Figure 2, the absorption maximum of the dye solution (approximately 647nm) corresponds closely to the transmission spectrum of the bandpass filter 16.
- the micro-reactor 26 is then clamped immovably to the stage 18 of the microscope 12 so that the channels 36 lie in the path 40 of light travelling from the tungsten lamp 10 to the objective 20.
- the micro-reactor 26 is positioned on the stage 18 with the upper block 30 above the base plate 28 and so that light from the tungsten lamp 10 passes through the micro-reactor 26 and generally normal to the lower surface 34 of the upper block 30.
- the position is such that the camera 14 together with the digital image recording and analysis software can record images of a portion (approximately 8 x 8mm) of the micro-reactor 26 - the portion containing a plurality of channels 36.
- each such image is made up of a 256 x 256 array of mean intensity values (each mean intensity value being the average intensity value of 16 camera output pixels, as described above).
- each mean intensity value corresponds to the intensity of light that has passed through a different part of the imaged portion of the micro-reactor 26.
- the reference solution is then introduced into the micro-reactor 26 so as to fill the channels 36 for which the dimensions are to be estimated.
- each mean intensity value (of a 16 pixel group as described above) is measured on a linear scale of zero to 4095 arbitary units. It is desirable, in this system, for the mean intensity values corresponding to light passing through the channels 36, when the channels 36 are filled with the reference solution, to be about 3500 on the above mentioned scale. Additionally, it is desirable for the mean intensity values to be about 100 on the above mentioned scale when the tungsten lamp 10 is switched off - the values of approximately 100 then largely correspond to system noise. The gain of the camera 14 and the intensity of the light emitted by the tungsten lamp 10 are adjusted so as to obtain the desired values of 3500 and 100. This serves the purpose of both standardising and maximising the resolution of the system.
- the camera 14 and the digital image recording and analysis software are then use to record an image of the micro-reactor 26 while the channels 36 are filled with the reference solution and while the micro-reactor 26 is illuminated by the tungsten lamp 10.
- This image is referred to below as the reference solution image.
- the tungstem lamp 10 is turned off and a further image is taken.
- This image is referred to below as the dark image and the mean intensity values that make up the dark image generally correspond to system noise.
- the reference solution is removed from the channels 36 of the micro-reactor 26 and the channels 36 are filled with the dye solution.
- the replacement of the reference solution with the dye solution takes place while the micro-reactor 26 remains clamped in the same position used for the reference solution image and for the dark image.
- the solutions can be changed using syringes.
- This third image is referred to below as the dye solution image.
- the camera 14 and the image recording and analysis software are used to obtain three images, the reference solution image, the dye solution image and the dark image.
- Each of these images is formed by a 256 x 256 array of mean intensity values.
- each mean intensity value is an average value of the light intensity that has fallen on a respective square (4 x 4 camera pixel) area of the camera 14.
- each mean intensity value is a measure of the intensity of light that has passed along a respective light path, through the micro-reactor 26, that is generally square in cross-section.
- corresponding mean intensity values in the dye solution and reference images give the intensity of light that has passed through identical light paths through the micro-reactor 26, when the channels 36 have been filled with either the dye solution or the reference solution respectively.
- the dark image also has mean intensity values that correspond, in terms of the different regions of the micro-reactor 26, to the mean intensity values of the dye and reference solution images, although clearly light does not pass through the micro-reactor 26 while the dark image is recorded.
- I ref is a mean intensity value from the reference solution image
- I sol is the corresponding mean light intensity value from the dye solution image
- I dark is the corresponding mean intensity value from the dark image
- C is the concentration of the dye in the dye solution in mol dm -3
- ⁇ is the extinction co-efficient in mol -1 dm 3 ⁇ m -1 .
- the value of d is the length in ⁇ m of the light path extending through the channel 36 - that is to say the light path extending between the lower surface 34 of the upper block 30 and the upper surface of the base plate 28.
- each of the images consists of an array of 256 x 256 mean intensity values (65,536 mean intensity values in total for each image). The same calculation is performed for each triplet of corresponding mean intensity values (i.e. corresponding mean intensity values from the dye solution image, from the reference solution image and from the dark image).
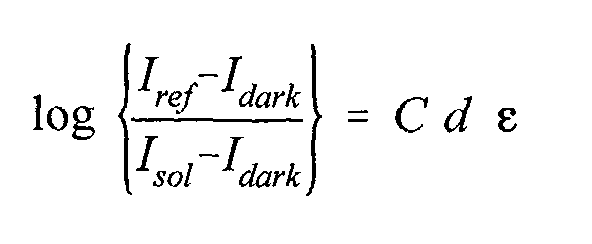
- Figure 4 shows the results of such an analysis.
- Figure 4 is an array of 256 x 256 depth values that have been determined as described above.
- the array corresponds to an area of the micro-reactor 26 that is approximately 8mm by 8mm. As can be seen in Figure 4, this area contains parts of five channels 36. As can be seen in Figure 4, the depths of the channels 36 at a plurality of positions in the channels 36 are determined.
- Figure 4 shows not only the depths at different regions of the channels 36, but also shows the shapes of the channels 36 (the planar base of the graph corresponding to the planar lower surface 34).
- Figure 5 shows the relationship between the percentage uncertainty in absorbance measurements, in the method described above, plotted against true absorbance. It will be seen that the minimum uncertainty, about 2%, is obtained with absorbance values of about 0.6. Accordingly, where the above method is to be used to estimate dimensions of a channel for which the dimensions are approximately known, the concentration of the dye in the dye solution can be adjusted to give absorbance readings near 0.6. This helps to increase the accuracy of dimensions estimated using the method described above.
- the dye solution and the reference solution were chosen so as to optimise the method, bearing in mind the following factors.
- the dye solution and the reference solution have a refractive index that is closely matched to the glass of the micro-reactor 26.
- dye and reference solutions can be chosen so that they are matched to the refractive index of the transparent body.
- the solutions are not volatile at room temperature.
- the dye, Patent Blue is highly soluble in the reference solution and this allows sufficiently high absorbances to be obtained, despite the relatively short dimensions (path lengths) of the channels 36.
- the dye solution described above obeys the Beer-Lambert Law closely.
- the dye and reference solutions are chemically stable.
- the absorbance of the reference solution is negligible compared to that of the dye solution at the optimum wavelength (about 649mm as described above).
- the micro-reactor 26 described above was also studied using a different combination of dye and reference solutions.
- the dye Rose Bengal was dissolved in water to form the dye solution.
- the reference solution was water alone.
- Figure 6 shows depth measurements obtained using this method with either the Patent Blue dye solution and the corresponding reference solution (open circles) and with the Rose Bengal dye solution and corresponding reference solution (solid circles), at the same cross-sectional position in a channel 36. As can be seen from Figure 6, the depth values obtained corresponded closely using the two pairs of solutions.
- the refractive index of the glass of the micro-reactor 26 is approximately 1.52.
- the refractive indices of the Patent Blue dye solution and the corresponding reference solution are the same.
- the refractive indices of the Rose Bengal dye solution and the corresponding reference solution are approximately 1.33.
- Figure 6 suggests that the difference in refractive indices between the aqueous solutions and the glass is not sufficient to distort the depth measurements obtained. However, it is possible that greater differences in refractive indices would cause distortion.
- Figure 7 shows three sets of depth measurements, corresponding to cross-sections through three separate channels in micro-reactors. As can be seen from Figure 7, the dimensions of the three channels are considerably different. Figure 7 also shows best fit lines obtained using a mathematical model of the etching process by which the channels are formed.
- etching proceeds at equal rates in all directions.
- the etching is isotropic.
- the etch depth d is controlled by the etch conditions and the etch time.
- Ideal isotropic etching through a channel mask of width m is expected to produce a channel profile comprising a rectangular shape of width m and depth d bounded by two quarter circle edges of radius equal to d.
- the expected channel width at the glass surface is equal to (m + 2d).
- either prolonged etching or thermal bonding may produce a "smoothing" of the channel edges away from the idealised quarter circle shape.
- the ideal isotropic etch profile is first calculated using the values of m and d.
- the “smoothing" of the profile is then parameterised by incorporation into the model of a variable smoothing length ⁇ .
- the channel depth at each X value is obtained by taking the depth calculated for the isotropic etch profile averaged over the range of X values corresponding to ⁇ . Fitting of the experiment channel profiles then yields the best-fit values of m, d and smoothing length ⁇ .
- a zero value of ⁇ corresponds to no distortion from the idealised isotropic etch profile whereas a high value indicates that significant smoothing has occurred during either the etching or thermal bonding processes.
- the method may be used to estimate dimensions of openings in any type of body (so long as the body is transparent to a suitable type of electromagnetic radiation).
- the visible light emitted from the tungsten lamp 10 may be used.
- the radiation will be in the range of UV to infra-red.
- the method can be used to measure dimensions in the range of 10 ⁇ m to 500 ⁇ m, which are the most common dimensions of channels in micro-reactors. Dimensions of less than 10 ⁇ m and greater than 500 ⁇ m may also be measured.
- the method can equally be performed by measuring the radiation intensity at a single area, so as to give a single depth. A series of such single depth determinations may be made sequentially, so as to determine a number of depths in a particular opening.
- the method can be adapted to determine concentrations of an absorbing chemical at different positions in the opening.
- concentrations of an absorbing chemical at different positions in the opening.
- intensity values determined as described above may be used to estimate concentration of the chemical.
- This alternative method may be particularly useful in that it may allow movement and reaction of chemical species in micro-reactors to be estimated. By taking a number of images over time, concentrations of chemical species can be determined, in different areas of the micro-reactor, over time.
- the micro-reactor 41 used in this example is formed from a base plate and an upper block (as for the micro-reactor 26) and has first 42 and second straight channels 44.
- a first end 46 of the second channel 44 opens into the midpoint of the first channel 42 so that the first and second channels 42,44 together form a "T"-shape.
- a first reservoir (not shown) lies at and opens into one end of the first channel 42 (at the left end of the first channel 42 as shown in Figure 8).
- a second reservoir (not shown) lies at and opens into the other end of the first channel 42 (at the right end of the first channel 42 as shown in Figure 8).
- a third reservoir lies at and opens into the other end of the second channel 44 (at the bottom of the second channel 44 as shown in Figure 8).
- the micro-reactor 41 also has two small marks (not shown) etched in the upper surface of the base plate (and covered by the upper block) and unconnected with the network of channels and reservoirs. These marks are used as reference marks so that any position within the channels 42,44 can be defined uniquely by its distance from both reference marks.
- the depths of the channels 42,44 are determined as described above.
- the images used to determine the depths also include the two reference marks and this allows the position of each depth measurement to be determined in relation to the two reference marks.
- This step of determining the depths and allocating positions to the depths need only be performed once for a given micro-reactor (and so when the depths are already known this step does not form part of the alternative method).
- the micro-reactor 41 is then clamped immovably to the stage 18 as described above, so that the camera 14 can record images of the portion of the micro-reactor that is of interest and so that the two reference marks are visable in those images.
- the channels 42,44 are then filled with a reference solution (methanol) and, after standardisation and optimisation of the resolution, a reference solution image and a dark image are recorded, as described above.
- a reference solution methanol
- a dye solution (Rose Bengal in methanol) is then introduced into the first reservoir of the micro-reactor 41. Methanol is introduced into the second and third reservoirs. Electrodes are then inserted into the reservoirs, in a known manner, and voltages are applied using the electrodes, also in a known manner. The voltages at the first and second reservoirs are 450V and 452V respectively relative to the third reservoir. The applied voltages cause the dye solution in the first reservoir and the methanol in the second reservoir to move towards the midpoint of the first channel 42 and then along the second channel 42 to the third reservoir. Mixing of the dye solution and the methanol occurs at the midpoint and in the second channel 44.
- the method involves the recording of a series of dye solution images, a reference solution image and a dark image.
- Each mean intensity value (as described above) of each dye solution image will have a corresponding mean intensity value in the reference solution image, the dark image and each other dye solution image.
- each mean intensity value (from each image) can be associated with a depth corresponding to the part of the channel 42,44 through which has passed the light that is measured, after passage through the micro-reactor, so as to give the mean intensity value in question.
- Figure 9 shows graphically the concentration of the dye, at different positions, in the portion of the micro-reactor 41 shown in Figure 8, at a particular moment in time.
- the alternative method described above can be adapted to measure concentration changes occuring due to reactions of chemicals.
- the alternative method can be used for micro-reactors having any channel layout. It can also be used for other bodies having openings.
Landscapes
- Physics & Mathematics (AREA)
- Health & Medical Sciences (AREA)
- Life Sciences & Earth Sciences (AREA)
- Chemical & Material Sciences (AREA)
- Analytical Chemistry (AREA)
- Biochemistry (AREA)
- General Health & Medical Sciences (AREA)
- General Physics & Mathematics (AREA)
- Immunology (AREA)
- Pathology (AREA)
- Investigating Or Analysing Materials By Optical Means (AREA)
Abstract
Description
C is concentration,
d is path length, and
ε is the extinction co-efficient of Patent Blue.
Isol is the corresponding mean light intensity value from the dye solution image;
Idark is the corresponding mean intensity value from the dark image;
C is the concentration of the dye in the dye solution in mol dm-3;
and
ε is the extinction co-efficient in mol-1 dm3 µm-1.

Claims (28)
- A method of estimating dimensions of an opening in a body comprising, filling the opening with a fluid that absorbs an electromagnetic radiation, transmitting said electromagnetic radiation through the body and through the fluid in the opening, determining an intensity of the electromagnetic radiation, after transmission through the fluid, at an area corresponding to a radiation path through the fluid in the opening, and using said intensity to estimate the length of said radiation path.
- A method according to claim 1, wherein respective intensities of the electromagnetic radiation, after transmission through the fluid, are determined at a plurality of areas, each area corresponding to a respective radiation path through the fluid in the opening, and using said intensities to estimate the lengths of said radiation paths.
- A method according to claim 2, wherein the intensities are determined substantially simultaneously.
- A method according to claim 3, wherein the intensities are measured by a single camera able to measure radiation intensities substantially simultaneously at a plurality of areas.
- A method according to claim 4, wherein the camera is a CCD camera.
- A method according to any preceding claim, wherein the electromagnetic radiation is in the range of UV to infrared, preferably visable light.
- A method according to any preceding claim, wherein the fluid has an absorption spectrum for said electromagnetic radiation that has a peak at a predetermined wavelength, a bandpass filter permitting passage of electromagnetic radiation over a wavelength range including said predetermined peak being used to filter said electromagnetic radiation before said determination of said intensity or intensities.
- A method according to any preceding claim wherein the fluid has a refractive index for the electromagnetic radiation that is substantially the same as the refractive index of the body for the electromagnetic radiation.
- A method according to any preceding claim wherein the fluid is a liquid.
- A method according to claim 9, wherein the liquid is not volatile at room temperature.
- A method according to claim 9 or claim 10, wherein the liquid absorbs the electromagnetic radiation substantially in accordance with the Beer-Lambert Law.
- A method according to any one of claims 9 to 11, wherein the liquid is a solution of a chemical in a solvent, the solvated chemical absorbing the electromagnetic radiation.
- A method according to claim 12, when claim 12 is dependent on claim 7, wherein the solvent substantially does not absorb the electromagnetic radiation at the predetermined wavelength.
- A method according to any preceding claim, wherein the body comprises a first member having a groove and a second member having a surface, the surface closing the groove to form a channel, the opening being the channel.
- A method according to any preceding claim, wherein the body is a chip-type micro-reactor.
- A method according to claim 4 or claim 5, wherein the fluid is a solution of a chemical in a solvent, the solvated chemical absorbing the electromagnetic radiation, the camera being used to obtain positionally identical images of the opening when the opening is filled with the solution, when the opening is filled with the solvent, and in the absence of electromagnetic radiation, the method including estimating the length of each of said radiation paths using the formula:wherein:
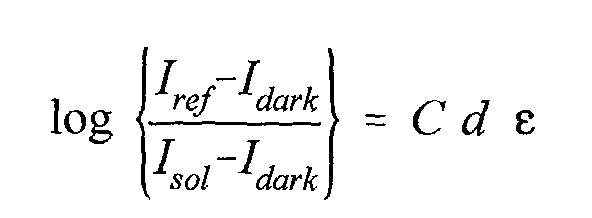 I ref is the intensity at an area corresponding to one of said radiation paths for the image when the opening is filled with solvent;I sol is the intensity at said area for the image when the opening is filled with the solution;I dark is the intensity at said area for the image in the absence of electromagnetic radiation;C is the concentration of the chemical in the solution;ε is an extinction coefficient of the solvated chemical for the electromagnetic radiation; andd is the length of said one radiation path.
 - A method of monitoring concentration of a chemical in a fluid filling an opening in a body, the chemical absorbing an electromagnetic radiation, comprising transmitting said electromagnetic radiation through the body and through the fluid in the opening, determining respective intensities of the electromagnetic radiation, after transmission through the fluid, at a plurality of areas corresponding to respective radiation paths through the fluid in the opening, and using said intensities to estimate respective concentrations of the chemical in the radiation paths.
- A method according to claim 17, wherein the intensities are determined substantially simultaneously.
- A method according to claim 18, wherein the intensities are measured by a single camera able to measure radiation intensities substantially simultaneously at a plurality of areas.
- A method according to claim 19, wherein the camera is a CCD camera.
- A method according to any one of claims 17 to 20, wherein the electromagnetic radiation is in the range of UV to infrared, preferably visable light.
- A method according to any one of claims 17 to 21, wherein the chemical has an absorption spectrum for said electromagnetic radiation that has a peak at a predetermined wavelength, a bandpass filter permitting passage of electromagnetic radiation over a wavelength range including said predetermined peak being used to filter said electromagnetic radiation before said determination of said intensities.
- A method according to any one of claims 17 to 22, wherein the fluid has a refractive index for the electromagnetic radiation that is substantially the same as the refractive index of the body for the electromagnetic radiation.
- A method according to any one of claims 17 to 23, wherein the fluid is a solution of the chemical in a solvent.
- A method according to claim 24, when claim 24 is dependent on claim 22, wherein the solvent substantially does not absorb the electromagnetic radiation at the predetermined wavelength.
- A method according to any one of claims 17 to 25, wherein the body comprises a first member having a groove and a second member having a surface, the surface closing the groove to form a channel, the opening being the channel.
- A method according to any one of claims 17 to 26, wherein the body is a chip-type micro-reactor.
- A method according to claim 19 or claim 20, wherein the fluid is a solution of the chemical in a solvent, the camera being used to obtain positionally identical images of the opening when the opening is at least partially filled with the solution, when the opening is filled with the solvent, and in the absence of electromagnetic radiation, the method including estimating the concentration of the chemical in each of said radiation paths using the formula:wherein:
 I ref is the intensity at an area corresponding to one of said radiation paths for the image when the opening is filled with solvent;I sol is the intensity at said area for the image when the opening is filled with the solution;I dark is the intensity at said area for the image in the absence of electromagnetic radiation;C is the concentration of the chemical in the solution;ε is an extinction coefficient of the solvated chemical for the electromagnetic radiation; andd is the length of said one radiation path.
Applications Claiming Priority (2)
| Application Number | Priority Date | Filing Date | Title |
|---|---|---|---|
| GB0115597 | 2001-06-26 | ||
| GB0115597A GB2378242B (en) | 2001-06-26 | 2001-06-26 | Depth and concentration estimation |
Publications (2)
| Publication Number | Publication Date |
|---|---|
| EP1271129A2 true EP1271129A2 (en) | 2003-01-02 |
| EP1271129A3 EP1271129A3 (en) | 2004-04-21 |
Family
ID=9917376
Family Applications (1)
| Application Number | Title | Priority Date | Filing Date |
|---|---|---|---|
| EP02254092A Withdrawn EP1271129A3 (en) | 2001-06-26 | 2002-06-12 | Depth and concentration estimation |
Country Status (3)
| Country | Link |
|---|---|
| US (1) | US7027167B2 (en) |
| EP (1) | EP1271129A3 (en) |
| GB (1) | GB2378242B (en) |
Families Citing this family (4)
| Publication number | Priority date | Publication date | Assignee | Title |
|---|---|---|---|---|
| US7100422B2 (en) | 2002-05-31 | 2006-09-05 | Drs Sustainment Systems, Inc. | Systems and methods for residue collection with improved letter handling capability |
| US8071035B2 (en) * | 2007-04-12 | 2011-12-06 | Siemens Medical Solutions Usa, Inc. | Microfluidic radiosynthesis system for positron emission tomography biomarkers |
| US8482733B2 (en) * | 2007-07-24 | 2013-07-09 | Kent State University | Measurement of the absorption coefficient of light absorbing liquids and their use for quantitative imaging of surface topography |
| CN106895787B (en) * | 2017-02-27 | 2019-04-26 | 武汉理工大学 | Deformation monitoring system and method based on visible light positioning technology |
Family Cites Families (16)
| Publication number | Priority date | Publication date | Assignee | Title |
|---|---|---|---|---|
| US3746864A (en) * | 1972-01-03 | 1973-07-17 | New Brunswick Scientific Co | Device for sensing and controlling optical density |
| JPS57156542A (en) * | 1981-03-23 | 1982-09-27 | Olympus Optical Co Ltd | Photometric device for automatic analyzing device |
| US4756884A (en) * | 1985-08-05 | 1988-07-12 | Biotrack, Inc. | Capillary flow device |
| US4938597A (en) * | 1988-04-21 | 1990-07-03 | Conoco Inc. | Light responsive motion sensing device |
| US5289267A (en) * | 1991-10-04 | 1994-02-22 | Kms Fusion, Inc. | Electro-optical system for gauging surface profile deviations |
| US5465153A (en) * | 1991-10-04 | 1995-11-07 | Kms Fusion, Inc. | Electro-optical system for gauging specular surface profile deviations |
| US5309213A (en) * | 1992-03-05 | 1994-05-03 | Analysts, Inc. | Optical determination of amount of soot in oil sample |
| JP3343156B2 (en) * | 1993-07-14 | 2002-11-11 | アークレイ株式会社 | Optical component concentration measuring apparatus and method |
| US5959738A (en) * | 1994-07-25 | 1999-09-28 | Molecular Devices Corporation | Determination of light absorption pathlength in a vertical-beam photometer |
| JPH08313429A (en) * | 1995-05-17 | 1996-11-29 | Hitachi Ltd | Cell for spectrophotometer |
| FI963388A7 (en) * | 1996-08-30 | 1998-03-01 | Instr Oy | Additional structure of a measuring sensor used in spectroscopic analysis of media |
| EP0938660B1 (en) * | 1996-11-18 | 2000-04-12 | Fraunhofer-Gesellschaft Zur Förderung Der Angewandten Forschung E.V. | Micromechanical transmission measuring cell |
| US5777731A (en) * | 1997-02-21 | 1998-07-07 | The Goodyear Tire & Rubber Company | Calibration of optical properties to measure depth of a liquid |
| US5963318A (en) * | 1998-08-07 | 1999-10-05 | Bio-Tek Holdings, Inc. | Method of and apparatus for performing fixed pathlength vertical photometry |
| US6455851B1 (en) * | 2000-03-28 | 2002-09-24 | Air Instruments And Measurement, Inc. | Spectroscopic remote sensing exhaust emission monitoring system |
| US6657726B1 (en) * | 2000-08-18 | 2003-12-02 | Applied Materials, Inc. | In situ measurement of slurry distribution |
-
2001
- 2001-06-26 GB GB0115597A patent/GB2378242B/en not_active Expired - Fee Related
-
2002
- 2002-06-12 EP EP02254092A patent/EP1271129A3/en not_active Withdrawn
- 2002-06-26 US US10/179,023 patent/US7027167B2/en not_active Expired - Fee Related
Also Published As
| Publication number | Publication date |
|---|---|
| GB0115597D0 (en) | 2001-08-15 |
| US20030016362A1 (en) | 2003-01-23 |
| US7027167B2 (en) | 2006-04-11 |
| GB2378242B (en) | 2005-08-03 |
| GB2378242A (en) | 2003-02-05 |
| EP1271129A3 (en) | 2004-04-21 |
Similar Documents
| Publication | Publication Date | Title |
|---|---|---|
| US8420025B2 (en) | Methods and systems for delivery of fluidic samples to sensor arrays | |
| US7889329B2 (en) | Analysis of optical data with the aid of histograms | |
| EP1219951B1 (en) | Apparatus for determining the volume of single red blood cells | |
| US6306347B1 (en) | Optical sensor and method of operation | |
| US20090262343A1 (en) | Infrared spectroscopy of media, including aqueous | |
| US7545494B2 (en) | Analytical system and method for analyzing nonlinear optical signals | |
| US10697954B2 (en) | Sample-holding element, analysis set, and method for analyzing a liquid, in particular a cooling lubricant emulsion | |
| CN111926064B (en) | POCT-based fluorescent quantitative PCR instrument calibration method and PCR instrument | |
| US20110217213A1 (en) | METHOD AND APPARATUS FOR MEASURING pH OF LOW ALKALINITY SOLUTIONS | |
| Durkin et al. | Comparison of methods to determine chromophore concentrations from fluorescence spectra of turbid samples | |
| US7027167B2 (en) | Depth and concentration estimation | |
| Broadwell et al. | Quantitative 3-dimensional profiling of channel networks within transparent ‘lab-on-a-chip’microreactors using a digital imaging method | |
| US8482733B2 (en) | Measurement of the absorption coefficient of light absorbing liquids and their use for quantitative imaging of surface topography | |
| Hudak et al. | Practical limits of spatial resolution in diffuse reflectance NIR chemical imaging | |
| EP1219950B1 (en) | Method for determining the volume of single red blood cells | |
| CN108120678B (en) | A detection device and method for biochemical quantification based on scattered light photothermal interference | |
| Lu | Optical absorption of pure water in the blue and ultraviolet | |
| EP1219963B1 (en) | Apparatus for measuring the volume of individual red blood cells | |
| WO1999058961A1 (en) | System and method for optical chemical sensing | |
| Fischer et al. | A novel planar optode setup for concurrent oxygen and light field imaging: Application to a benthic phototrophic community | |
| JP2018526644A (en) | Method and apparatus for determining substance concentration or substance in a liquid medium | |
| US8592781B2 (en) | Method and apparatus for quantitative evaluation of wall zeta-potential, and method and apparatus for quantitative visualization of surface modification pattern | |
| Plant et al. | Quantitative, depth-resolved imaging of oxygen concentration by phosphorescence lifetime measurement | |
| CN222671685U (en) | Water quality monitoring sensor and water quality monitoring equipment | |
| US20020118354A1 (en) | Method for measuring the volume of individual red blood cells |
Legal Events
| Date | Code | Title | Description |
|---|---|---|---|
| PUAI | Public reference made under article 153(3) epc to a published international application that has entered the european phase |
Free format text: ORIGINAL CODE: 0009012 |
|
| AK | Designated contracting states |
Kind code of ref document: A2 Designated state(s): AT BE CH CY DE DK ES FI FR GB GR IE IT LI LU MC NL PT SE TR |
|
| AX | Request for extension of the european patent |
Free format text: AL;LT;LV;MK;RO;SI |
|
| PUAL | Search report despatched |
Free format text: ORIGINAL CODE: 0009013 |
|
| AK | Designated contracting states |
Kind code of ref document: A3 Designated state(s): AT BE CH CY DE DK ES FI FR GB GR IE IT LI LU MC NL PT SE TR |
|
| AX | Request for extension of the european patent |
Extension state: AL LT LV MK RO SI |
|
| RIC1 | Information provided on ipc code assigned before grant |
Ipc: 7G 01N 21/03 B Ipc: 7G 01N 21/53 B Ipc: 7G 01N 21/31 B Ipc: 7G 01N 21/00 A |
|
| AKX | Designation fees paid | ||
| 17P | Request for examination filed |
Effective date: 20040506 |
|
| RBV | Designated contracting states (corrected) |
Designated state(s): DE FR |
|
| REG | Reference to a national code |
Ref country code: DE Ref legal event code: 8566 |
|
| RBV | Designated contracting states (corrected) |
Designated state(s): DE FR |
|
| RAP1 | Party data changed (applicant data changed or rights of an application transferred) |
Owner name: GLAXO GROUP LIMITED |
|
| 17Q | First examination report despatched |
Effective date: 20070117 |
|
| 111L | Licence recorded |
Free format text: 0100 THE UNIVERSITY OF HULL Effective date: 20070501 |
|
| GRAP | Despatch of communication of intention to grant a patent |
Free format text: ORIGINAL CODE: EPIDOSNIGR1 |
|
| STAA | Information on the status of an ep patent application or granted ep patent |
Free format text: STATUS: THE APPLICATION IS DEEMED TO BE WITHDRAWN |
|
| 18D | Application deemed to be withdrawn |
Effective date: 20090408 |