EP1256791A2 - System and method for measuring group delay based on zero-crossings - Google Patents
System and method for measuring group delay based on zero-crossings Download PDFInfo
- Publication number
- EP1256791A2 EP1256791A2 EP01129971A EP01129971A EP1256791A2 EP 1256791 A2 EP1256791 A2 EP 1256791A2 EP 01129971 A EP01129971 A EP 01129971A EP 01129971 A EP01129971 A EP 01129971A EP 1256791 A2 EP1256791 A2 EP 1256791A2
- Authority
- EP
- European Patent Office
- Prior art keywords
- optical
- dut
- zero
- crossings
- frequency
- Prior art date
- Legal status (The legal status is an assumption and is not a legal conclusion. Google has not performed a legal analysis and makes no representation as to the accuracy of the status listed.)
- Granted
Links
- 238000000034 method Methods 0.000 title claims abstract description 32
- 230000003287 optical effect Effects 0.000 claims abstract description 222
- 238000012360 testing method Methods 0.000 claims abstract description 62
- 238000005070 sampling Methods 0.000 claims description 21
- 238000005259 measurement Methods 0.000 abstract description 8
- 239000013307 optical fiber Substances 0.000 description 35
- 238000012545 processing Methods 0.000 description 24
- 238000013459 approach Methods 0.000 description 9
- 238000010586 diagram Methods 0.000 description 8
- 230000004044 response Effects 0.000 description 8
- 238000010408 sweeping Methods 0.000 description 7
- 230000010287 polarization Effects 0.000 description 5
- 238000012952 Resampling Methods 0.000 description 3
- 230000035559 beat frequency Effects 0.000 description 3
- 239000006185 dispersion Substances 0.000 description 3
- 230000002452 interceptive effect Effects 0.000 description 3
- 230000008569 process Effects 0.000 description 3
- 230000008901 benefit Effects 0.000 description 2
- 238000004364 calculation method Methods 0.000 description 2
- 230000008859 change Effects 0.000 description 2
- 239000000835 fiber Substances 0.000 description 2
- 238000012886 linear function Methods 0.000 description 2
- 230000003595 spectral effect Effects 0.000 description 2
- 235000008694 Humulus lupulus Nutrition 0.000 description 1
- 230000005540 biological transmission Effects 0.000 description 1
- 230000001419 dependent effect Effects 0.000 description 1
- 238000009795 derivation Methods 0.000 description 1
- 238000001514 detection method Methods 0.000 description 1
- 238000011161 development Methods 0.000 description 1
- 230000000694 effects Effects 0.000 description 1
- PCHJSUWPFVWCPO-UHFFFAOYSA-N gold Chemical compound [Au] PCHJSUWPFVWCPO-UHFFFAOYSA-N 0.000 description 1
- 239000010931 gold Substances 0.000 description 1
- 229910052737 gold Inorganic materials 0.000 description 1
- 230000007774 longterm Effects 0.000 description 1
- 238000000691 measurement method Methods 0.000 description 1
- 238000003012 network analysis Methods 0.000 description 1
- 230000010363 phase shift Effects 0.000 description 1
- 238000002834 transmittance Methods 0.000 description 1
Images




Classifications
-
- G—PHYSICS
- G01—MEASURING; TESTING
- G01M—TESTING STATIC OR DYNAMIC BALANCE OF MACHINES OR STRUCTURES; TESTING OF STRUCTURES OR APPARATUS, NOT OTHERWISE PROVIDED FOR
- G01M11/00—Testing of optical apparatus; Testing structures by optical methods not otherwise provided for
- G01M11/30—Testing of optical devices, constituted by fibre optics or optical waveguides
- G01M11/31—Testing of optical devices, constituted by fibre optics or optical waveguides with a light emitter and a light receiver being disposed at the same side of a fibre or waveguide end-face, e.g. reflectometers
- G01M11/3172—Reflectometers detecting the back-scattered light in the frequency-domain, e.g. OFDR, FMCW, heterodyne detection
Definitions
- the invention relates generally to the field of optical network analysis, and more particularly to a system and method for determining the phase response of an optical component under test.
- An optical network analyzer is a vital tool for determining optical characteristics of optical components, such as fiber Bragg gratings.
- the optical characteristics determined by an optical network analyzer may include reflectance and transmittance of a particular two port or multiport optical component under test.
- the reflection or transmission characteristics of an optical component under test are typically determined by measuring the amplitude and phase of optical signals that have been reflected by or transmitted through the component.
- the phase response characteristics of an optical component under test are often described by group delay or dispersion.
- a non-continuously tunable laser source is a laser source that can be tuned across a predefined range of frequencies in discrete frequency steps.
- a typical technique to measure group delay is to apply an electrical stimulus in the form of intensity or phase modulation to an optical signal, and then measure the electrical response of the transmitted or reflected optical signals using well known phase sensitive electrical detection device, e.g., a lock-in amplifier or an electrical network analyzer.
- phase sensitive electrical detection device e.g., a lock-in amplifier or an electrical network analyzer.
- the group delay measurement is indirect, which limits the accuracy of the measurement.
- the technique requires a long measurement time to obtain an accurate result. Consequently, a long-term stability of the test setup is required to effectively utilize the technique.
- continuously tunable laser sources have recently become available.
- a continuously tunable laser source can continuously sweep a predefined range of frequencies without frequency jumps or mode hops.
- the availability of continuously tunable laser sources has allowed for development of interferometric methods for measuring the group delay of optical components.
- the interferometric methods are based on direct measurements of phase differences between interfering optical signals.
- Fourier analysis of a heterodyne beat frequency directly related to the sweeping optical frequency of a continuously tunable laser source is used to measure the phase, and consequently, the group delay.
- a concern with the interferometric methods using Fourier analysis is that the frequency sweep of a continuously tunable laser source is non-uniform.
- the non-uniformity of the frequency sweep causes a similar non-uniformity in the resulting beat frequency, which introduces an uncertainty in the. calculation of the phase by means of the Fourier analysis.
- a system and method for measuring the group delay of an optical device under test utilizes an optical frequency counter in conjunction with a test interferometer to compensate for the non-uniform frequency changes of an input optical signal used by the test interferometer to measure the group delay.
- the group delay of the optical DUT is measured using the zero-crossings of an AC coupled heterodyne beat signal produced by the test interferometer from the input optical signal.
- phase changes in the heterodyne beat signal caused by the non-uniform frequency changes of the input optical signal are compensated by using the optical frequency counter.
- the optical frequency counter includes a reference interferometer.
- the zero-crossings of a reference AC coupled heterodyne beat signal produced by the reference interferometer from the input optical signal are used to detect the optical frequency of the input optical signal and to compensate for the non-uniform frequency changes of the input optical signal.
- the wavelengths of the reference heterodyne beat signal are measured by detecting the zero-crossings of the reference heterodyne beat signal.
- a method of analyzing an optical characteristic of an optical device under test (DUT) in accordance with the present invention includes the steps of generating an input optical signal having a frequency that varies with time into a test interferometer that includes the optical DUT, detecting DUT zero-crossings of a DUT heterodyne beat signal from the test interferometer, and computing the group delay of the optical DUT using a derivative of a DUT zero-crossings function defined by the DUT zero-crossings with respect to one of time and optical frequency of the DUT zero-crossings function.
- the computed group delay is indicative of a phase response of the optical DUT.
- the method may further include the steps of detecting the optical frequency of the input optical signal and compensating for the non-uniform frequency changes of the input optical signal. This step may further include detecting zero-crossings of a reference heterodyne beat signal from a reference interferometer.
- the step of computing the group delay includes calculating the derivative of the DUT zero-crossings function with respect to time, which provides information about changes in phase of the DUT heterodyne beat signal.
- the method may further include steps of detecting reference zero-crossings of a reference heterodyne beat signal from a reference interferometer, and calculating a derivative of a reference zero-crossings function defined by the reference zero-crossings with respect to time, which provides information about changes in optical frequency of the input optical signal in the DUT and reference interferometers.
- the group delay of the optical DUT is computed by dividing the derivative of DUT zero-crossing function by the derivative of the reference zero-crossings function.
- the step of computing the group delay includes calculating the derivative of the DUT zero-crossings function with respect to optical frequency.
- the derivative of the DUT zero-crossing function with respect to optical frequency may be calculated by sampling the DUT heterodyne beat signal in equal frequency increments.
- the DUT heterodyne beat signal may be sampled in equal frequency increments using a clocking signal, which may be derived by detecting the optical frequency of the input optical signal.
- reference zero-crossings of a reference interferometer are used as the clocking signal to sample the DUT heterodyne beat signal in equal frequency increments.
- a system for analyzing an optical characteristic of an optical DUT in accordance with the present invention includes a light source, a test interferometer, a DUT zero-crossing detector, and a processor.
- the light source is configured to generate an input optical signal having a frequency that varies with time.
- the DUT zero-crossing detector is configured to detect DUT zero-crossings of a DUT heterodyne beat signal from the test interferometer.
- the processor is configured to calculate a derivative of a DUT zero-crossings function defined by the DUT zero-crossings with respect to a variable of the DUT zero-crossings function.
- the processor is configured to compute the group delay of the optical DUT using the derivative of the DUT zero-crossings function.
- the system may further include an optical frequency counter that is configured to detect the optical frequency of the input optical signal.
- the detected optical frequency is used to compensate for the frequency sweep non-uniformity of the light source.
- the optical frequency counter may include a reference interferometer that generates a reference heterodyne beat signal from the input optical signal.
- the optical frequency counter may be configured to detect the zero-crossings of the reference heterodyne beat signal from the reference interferometer to measure the optical frequency of the input optical signal.
- the processor of the system is configured to calculate the derivative of the DUT zero-crossings function with respect to time.
- the system may include a reference interferometer and a reference zero-crossing detector.
- the reference zero-crossing detector is configured to detect reference zero-crossings of the reference heterodyne beat signal from the reference interferometer.
- the processor is configured to calculate a derivative of a reference zero-crossings function defined by the reference zero-crossings with respect to time.
- the group delay of the optical DUT is computed by dividing the derivative of DUT zero-crossings function by the derivative of the reference zero-crossings function.
- the processor of the system is configured to calculate the derivative of the DUT zero-crossings function with respect to optical frequency.
- the system may further include a wave converter that is coupled to a reference interferometer.
- the wave converter is configured to convert a reference beat signal from the reference interferometer from a sinusoidal waveform to a rectangular-like waveform.
- the converted signal is used as a clocking signal to sample the DUT heterodyne beat signal in equal frequency increment.
- An advantage of the invention is that fast Fourier transform is not required to compute the group delay, which simplifies the data processing when using a non-uniform tunable laser source.
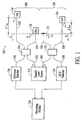
- an optical network analyzer 102 in accordance with the present invention is shown.
- the analyzer measures optical characteristics of an optical device under test (DUT) 104.
- the analyzer computes the group delay of the DUT.
- the optical DUT may be a fiber Bragg grating, although the optical DUT may be any optical component.
- the optical network analyzer computes the group delay of the optical DUT in an efficient manner using an interferometric method based on zero-crossings of AC coupled heterodyne beat signals.
- the optical network analyzer 102 includes a reference interferometer 106, a test interferometer 108, and a processing module 110.
- the reference and test interferometers are configured as Michelson interferometers to measure the reflective characteristics of the optical DUT 104.
- the interferometers 106 and 108 may be configured as Mach-Zehnder interferometers to measure the transmissive characteristics of the optical DUT.
- the reference interferometer and the test interferometer both utilize a continuously tunable laser source 112.
- the continuously tunable laser source is configured to generate an optical signal having a frequency that continuously sweeps across a predefined range of frequencies in a non-uniform manner. That is, the rate of change in frequency of the optical signal generated by the tunable laser source varies with time as the predefined range of frequencies is swept.
- the group delay of the optical DUT 104 is computed by measuring the phase changes of an AC coupled heterodyne beat signal from the test interferometer 108 caused by the optical DUT.
- the heterodyne beat signal is produced from an input optical signal generated by the continuously tunable laser source 112.
- the frequency changes of the input optical signal are non-uniform, which introduces undesired phase changes into the heterodyne beat signal.
- the reference interferometer 106 and the processing module 110 forms an optical frequency counter that measures the undesired phase changes caused by the non-uniform frequency changes of the input optical signal.
- the reference interferometer produces a reference heterodyne beat signal that includes only the phase changes caused by the frequency sweep non-uniformity of the tunable laser source.
- the reference heterodyne beat signal is then detected to measure the undesired phase changes. Since the measured phase changes are common to both interferometers, the distortions due to the non-uniform frequency sweep can be removed from the heterodyne beat signal produced by the test interferometer using the reference heterodyne beat signal.
- the reference interferometer 106 of the optical network analyzer 102 includes the continuously tunable laser source 112, an optical coupler 114, Faraday mirrors 116 and 118, and a reference detector 120. These components of the reference interferometer are connected to each other by optical fibers 122, 124, 126 and 128.
- the optical fiber 122 connects the tunable laser source to the optical coupler, while the optical fiber 126 connects the reference detector to the optical coupler.
- the optical fiber 124 connects the optical coupler to the Faraday mirror 118, while the optical fiber 128 connects the optical coupler to the Faraday mirror 116.
- the optical coupler 114 and the optical fibers 122, 124, 126 and 128 are single mode (SM) components.
- the length of the optical fiber 128 differs from the length of the optical fiber 124 by the distance ⁇ L R , which introduces delay into the reference interferometer and defines its free spectral range (FSR).
- FSR free spectral range
- the tunable laser source 112 continuously generates an optical signal in a sweeping range of frequencies.
- the tunable laser source may sweep approximately 140 nm wavelength range from 1470 nm wavelength or from 1510 nm wavelength.
- the optical signal generated by the tunable laser source is transmitted to the optical coupler 114 through the optical fiber 122.
- the optical coupler then divides the optical signal into two optical signals so that the divided optical signals are transmitted to the Faraday mirrors 116 and 118 through the optical fibers 128 and 124, respectively.
- the optical signal transmitted through the optical fiber 128 is reflected back to the optical coupler by the Faraday mirror 116 at the end of the optical fiber 128.
- the optical signal transmitted through the optical fiber 124 is reflected back to the optical coupler by the Faraday mirror 118 at the end of the optical fiber 124.
- the Faraday mirrors 116 and 118 always reflect light in an orthogonal polarization state, thereby ensuring that the returning optical signals have nearly the same polarization state.
- the frequency of the returning optical signal in the optical fiber 128 differs from the frequency of the returning optical signal in the optical fiber 124 at a given moment in time. As illustrated in Fig. 1, the frequency of the returning optical signal in the optical fiber 124 is denoted by ⁇ 1 , and the frequency of the returning optical signal in the optical fiber 128 is denoted by ⁇ 2 .
- the reference interferometer 106 is assumed to be non-dispersive, i.e., ⁇ does not depend on the optical frequency of the optical signals or ⁇ has been compensated for dispersion.
- the returning optical signals in the optical fibers 124 and 128 are combined at the optical coupler 114 and transmitted to the reference detector 120 through the optical fiber 126.
- the optical signal returning from the optical fiber 124 interferes with the optical signal returning from the optical fiber 128.
- the term I 0 cos(2 ⁇ t + ⁇ 0 ) defines the heterodyne beat signal produced by the returning optical signals.
- the heterodyne beat signal is AC coupled by removing the DC component of the signal.
- the AC coupled heterodyne beat signal is then transmitted to the processing module 110 for signal processing.
- the test interferometer 108 of the optical network analyzer 102 includes the continuously tunable laser source 112, an optical coupler 130, a mirror 132, the optical DUT 104 and a DUT detector 134. Similar to the reference interferometer 106, the components of the test interferometer are connected to each other by optical fibers 136, 138, 140 and 142.
- the optical fiber 140 connects the tunable laser source 112 to the optical coupler 130, while the optical fiber 136 connects the DUT detector 134 to the optical coupler.
- the optical fiber 142 connects the optical coupler to the mirror 132, which may be a gold mirror, while the optical fiber 138 connects the optical coupler to the optical DUT 104.
- An additional polarization controller may be used in one of the arms to match the polarization states of the returning optical signals.
- the optical coupler 130 and the optical fibers 136, 138, 140 and 142 are also single mode (SM) components.
- the length of the optical fiber 138 differs from the length of the optical fiber 142 by the distance ⁇ L D , which introduces delay into the test interferometer and defines its free spectral range.
- the operation of the test interferometer 108 is similar to the operation of the reference interferometer 106.
- the phase response of the optical DUT can be derived by measuring changes in phase of the heterodyne beat signal observed at the DUT detector 134.
- the heterodyne beat signal is produced by the returning optical signals in the optical fibers 138 and 142 when combined by the optical coupler 130 and detected at the DUT detector 134.
- the phase of the heterodyne beat signal of the test interferometer 108 is modified by the sweep non-uniformity of the tunable laser source 112. That is, the fact that the tunable laser source sweeps frequencies in a non-uniform manner with respect to time introduces additional phase shift into the phase of the heterodyne beat signal detected at the DUT detector 134 of the test interferometer 108. The same phenomenon-exists for the reference interferometer 106. Therefore, both interferometers contain information about the non-uniform frequency sweep of the tunable laser source 112. The effect of the non-uniform frequency sweep by the tunable laser source is described below with reference to Figs. 2, 3, 4, 5 and 6.
- the tunable laser source 112 is an ideal tunable laser source that continuously sweeps the predefined range of frequencies uniformly with respect to time
- the change of frequency with respect to time for the optical signals generated by the laser source is linear, as illustrated in Fig. 2. Consequently, the resulting AC coupled heterodyne beat signal is a pure sine wave with uniformly spaced, positive slope zero-crossings, e.g., zero-crossings z 0 , z 1 , and z 2 illustrated in Fig. 3.
- the present invention is described as using the positive slope zero-crossings, the negative slope zero-crossings can be alternatively used.
- a function z(t) can be defined, which identifies the phase of the heterodyne beat signal, as illustrated in Fig. 4.
- the positive slope zero-crossings of the heterodyne beat signal are non-uniform, as illustrated in Fig. 5. Consequently, the function z(t) defined by these non-uniform zero-crossings is non-linear, as illustrated in Fig. 6. Therefore, changes in phase of the heterodyne beat signal at the DUT detector 134 and at the reference detector 120 are strongly influenced by the sweep non-uniformity of the tunable laser source.
- the phase changes due to the dispersive DUT characteristics observed at the DUT detector 134 are indistinguishable from and dominated by phase changes induced by the sweep non-uniformity of the tunable laser source.
- the optical network analyzer 102 resolves this problem by using the positive slope zero-crossings from the reference interferometer 106 to effectively "compensate" for the non-uniformity of the tunable laser source 112.
- a non-linear function z(t) of Fig. 6 represent a typical behavior of the phase of the heterodyne beat signals from both the reference interferometer 106 and the test interferometer 108.
- the function for the test interferometer 108 is denoted herein as z D (t)
- the function for the reference interferometer 106 is denoted herein as z R (t).
- the processing module 110 of the optical network analyzer 102 computes the group delay of the optical DUT 104 directly from the positive slope zero-crossings of the reference heterodyne beat signal and the DUT heterodyne beat signal.
- the processing module includes a reference zero-crossing detector 702, a DUT zero-crossing detector 704, a processor 706, and sampling units 708 and 710, as shown in Fig. 7. These components of the processing module may be implemented in any combination of hardware, software and firmware.
- the sampling units 708 and 710 sample the heterodyne beat signals from the reference and DUT detectors 120 and 134, respectively, in equal time increments using a clock signal.
- the reference zero-crossing detector operates to detect positive slope zero-crossings of the sampled reference heterodyne beat signal.
- the DUT zero-crossing detector operates to detect positive slope zero-crossings of the sampled DUT heterodyne beat signal.
- the processor uses the detected zero-crossings from both the reference zero-crossing detector and DUT zero-crossing detector to compute the group delay of the optical DUT 104.
- the heterodyne beat signal from the reference detector 120 is sampled in equal time increments by the sampling unit 708 using a clock signal.
- the heterodyne beat signal from the DUT detector 134 is sampled in equal time increments by the sampling unit 710 using the same clock signal.
- positive slope zero-crossings of the sampled reference heterodyne beat signal are detected by the reference zero-crossing detector 702 of the processing module 110.
- positive zero-crossings of the sampled DUT heterodyne beat signal are detected by the DUT zero-crossing detector 704.
- a function z R (t) is derived by the processor 706 using the zero-crossings detected by the reference zero-crossing detector 702.
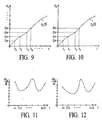
- a function z D (t) is derived by the processor. using the zero-crossings detected by the DUT zero-crossing detector 704. Examples of functions z R (t) and z D (t) that may be derived by the processor are shown in Figs. 9 and 10, respectively.
- the depicted function z R (t) includes zero-crossing points that are non-uniformly spaced in time, which reflects the non-uniformity of the frequency sweep of the tunable laser source 112.
- the depicted function z D (t) also includes zero-crossing points that are non-uniformly spaced in time.
- the non-uniform spacing of the zero-crossing points in the function z D (t) includes information about the phase response of the optical DUT 104, as well as information about the non-uniformity of the frequency sweep of the tunable laser source.
- the function z D (t) may be derived from the detected zero-crossings using various methods. One of the methods is to simply connect the detected zero-crossings to derive the function z D (t). Other methods include performing a polynomial fit or a least square fit of the detected zero-crossings to derive the function z D (t).
- a derivative of the function z R (t) with respect to time is calculated by the processor 706.
- a derivative of the function z D (t) with respect to time is calculated by the processor, at step 816.
- the time derivatives of the functions z R (t) and z D (t) may be estimated by resampling the functions z R (t) and z D (t) in equal time increments and then using known numerical algorithms for derivative calculations.
- An alternative numerical method is to calculate derivatives dt / dz D and dt / dz R , since adjacent positive slope zeros are spaced equally by 2 ⁇ , as previously described.
- ⁇ g dz D dt dz R dt ⁇ ⁇ .
- the processing module 110 of the optical network analyzer 102 operates to compute the group delay of the optical DUT 104 by using the positive slope zero-crossings of the reference interferometer 106 to clock the data acquisition of the beat frequency from the test interferometer in equal frequency increments.
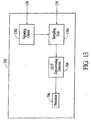
- the processing module includes the DUT zero-crossing detector 704, a squaring circuit 1302, a sampling unit 1304, and the processor 706, as shown in Fig. 13.
- the squaring circuit operates to convert the heterodyne beat signal received by the reference detector 120 of the reference interferometer 106 from a sinusoidal waveform to a rectangular waveform.
- the squaring circuit may be a Schmitt trigger.
- the edges of the resulting rectangular waveform are then used by the sampling unit 1304 to sample the heterodyne beat signal from the test interferometer 108. Since adjacent positive slope zero-crossings of the reference heterodyne signal by definition are separated by 2 ⁇ and the interferometer is non-dispersive, the sampled data points of the DUT heterodyne beat signal are equally spaced in optical frequency (wavelength).
- the DUT zero-crossing detector operates to detect positive slope zero-crossings of the sampled heterodyne beat signal.
- the processor 706 then operates to derive the function z D (v) from the positive slope zero-crossings detected by the DUT zero-crossing detector. Similar to the derivation of the function z D (t), the function Z D ( ⁇ ) may be derived from the detected zero-crossings using various methods.
- the processor uses the function z D (v) to compute the group delay for the optical DUT 104.
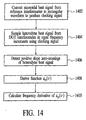
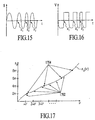
- a sinusoidal beat signal from the reference interferometer 106 is converted to a rectangular waveform by the squaring circuit 1302 to produce a clocking signal.
- the sinusoidal beat signal received by the squaring circuit is illustrated in Fig. 15.
- the zero-crossings of the sinusoidal beat signal are denoted by points z 1 , z 2 , z 3 , etc.
- the output signals of the squaring circuit is illustrated in Fig. 16.
- the output signal of Fig. 16 is the sinusoidal beat signal of Fig. 15 that has been converted by the squaring circuit.
- the sinusoidal waveform has been transformed to a signal with sharp edges z 1 ', z 2 ' and z 3 ' that can be used to clock a data acquisition system.
- positive slope zero-crossings of the heterodyne beat signal from the test interferometer are detected by the DUT zero-crossing detector 704 of the processing module 110.
- a function z D ( ⁇ ) is derived by the processor using the zero-crossings detected by the DUT zero-crossing detector.
- the function z D ( ⁇ ) is shown in Fig.17.
- the samples derived from step 1404 are illustrated in Fig. 17 as points 1702.
- the points 1704 are the positive slope zero-crossings of the heterodyne beat signal from the test interferometer detected in step 1406.
- the derivative of the function Z D ( ⁇ ) with respect to frequency can be calculated by computing d ⁇ / dz D , as adjacent positive slope zero-crossings are equally spaced by 2 ⁇ , as illustrated in Fig. 17.
- the processing module 110 includes the reference zero-crossing detector 702, DUT zero-crossing detector 704, the processor 706, sampling units 1802 and 1804, and a resampling unit 1806, as shown in Fig. 18.
- the sampling units 1802 and 1804 operate to sample the heterodyne beat signals from the reference and the DUT detectors 120 and 134, respectively, in equal time increment.
- the sampled reference heterodyne beat signal is transmitted to the reference zero-crossing detector, where positive slope zero-crossings of the reference heterodyne beat signal are detected.
- the detected zero-crossings are then transmitted to the resampling unit, where the sampled DUT heterodyne beat signal is resampled in equal optical frequency increments using the detected zero-crossings of the reference heterodyne beat signal.
- the sampled DUT heterodyne beat signal needs to be interpolated to obtain information between the sampled data points of the DUT heterodyne beat signal.
- adjacent positive slope zero-crossings of the reference heterodyne beat signal by definition are separated by 2 ⁇ , the sampled data points of the DUT heterodyne beat signal are equally spaced in frequency.
- the DUT zero-crossing detector 704 and the processor 706 operate in the same manner as described above for the hardware-based sampling approach to calculate the group delay.
- the laser source included in the optical network analyzers is a tunable laser source that continuously sweeps across a predefined range of frequencies in a non-uniform manner.
- the laser source can continuously sweep across a predefined range of frequencies in a uniform manner, then there is no need to compensate or adjust the heterodyne beat signal from the test interferometer to compute the group delay.
- the reference interferometer is no longer needed.
- the optical analyzer includes a test interferometer 1906 and a processing module 1908. Similar to the test interferometer 108 of the optical analyzer 102, the test interferometer 1906 includes the optical coupler 130, the mirror 132, the optical DUT 104 and the DUT detector 134. In addition, the test interferometer 1906 includes the uniformly sweeping tunable laser source. The-test interferometer 1906 operates to produce a heterodyne beat signal from the input optical signal, which is generated by the uniformly sweeping tunable laser source. Since the input optical signal is generated by the uniformly sweeping tunable laser source, the optical analyzer 1902 does not include an optical frequency counter, e.g., a reference interferometer, to compensate for the input optical signal.
- an optical frequency counter e.g., a reference interferometer
- the processing module 1908 of the optical analyzer 1902 includes the sampling unit 710, the DUT zero-crossing detector and the processor 706.
- the sampling unit 710 receives the heterodyne beat signal from the test interferometer 1906 and then samples the signal in equal time increments using a clock signal.
- the sampled heterodyne beat signal is transmitted to the DUT zero-crossing detector 704, which detects the positive zero-crossings of the sampled signal.
- the detected zero-crossings are then used by the processor 706 to derive a function z D (t).
- a derivative of the function z D (t) with respect to time is calculated by the processor to provide a group delay measurement of the DUT 104.
- a method of measuring the phase response of an optical DUT is described with reference to Fig. 20.
- an input optical signal having a frequency that varies with time is generated into a test interferometer that includes the optical DUT.
- the positive slope zero-crossings of an AC coupled heterodyne beat signal produced by the test interferometer from the input optical signal are detected.
- the group delay of the optical DUT is computed using a derivative of a DUT zero-crossings function defined by the positive slope zero-crossings with respect to a variable of the DUT zero-crossings function. The computed group delay is indicative of the phase response of the optical DUT.
- the method may further include steps of detecting the optical frequency of the input optical signal and compensating the heterodyne beat signal produced by the test interferometer for the non-uniform frequency variations of the input optical signal.
- the optical frequency of the input optical signal may be detected using a reference interferometer.
- the group delay is computed by dividing the derivative of the DUT zero-crossings function with respect to time by a derivative of a reference zero-crossings function with respect to time.
- the time derivatives of the reference zero-crossings function and the DUT zero-crossings function are calculated by detecting positive slope zero-crossings of the heterodyne beat signals resulting from the input optical signal that is transmitted into the reference interferometer 106 and into the test interferometer 108.
- the group delay is computed by approximating the derivative of the DUT zero-crossings function with respect to optical frequency.
- the positive slope zero-crossings from the reference interferometer are used to sample the DUT heterodyne beat signal in equal frequency increments to determine the DUT zero-crossings function and to calculate the frequency derivative of the DUT zero-crossings function.
Landscapes
- Physics & Mathematics (AREA)
- Optics & Photonics (AREA)
- Chemical & Material Sciences (AREA)
- Analytical Chemistry (AREA)
- General Physics & Mathematics (AREA)
- Instruments For Measurement Of Length By Optical Means (AREA)
- Testing Of Optical Devices Or Fibers (AREA)
- Spectrometry And Color Measurement (AREA)
Abstract
Description
Claims (10)
- A method of measuring a group delay of an optical device under test (DUT) (104) comprising:generating (2002) an input optical signal having a frequency that varies with time into a test interferometer (108), said test interferometer including said optical DUT;detecting (2004) DUT zero-crossings of a DUT heterodyne beat signal from said test interferometer; andcomputing (2006) a group delay of said optical DUT using a derivative of a DUT zero-crossings function defined by said DUT zero-crossings with respect to one of time and optical frequency of said DUT zero-crossings function.
- The method of claim 1 further comprising detecting (702) an optical frequency of said input optical signal and compensating (706) for non-uniform frequency changes of said input optical signal.
- The method of claim 2 wherein said detecting (702) of said optical frequency of said input optical signal includes detecting (806) zero-crossings of a reference heterodyne beat signal from a reference interferometer (106).
- The method of claim 1, 2 or 3 wherein said computing (2006) said group delay includes sampling (804) said DUT zero-crossings function in equal time increments.
- The method of claim 1, 2, 3 or 4 wherein said computing (2006) said group delay includes sampling (1404) said DUT heterodyne beat signal in equal frequency increments.
- A system for measuring a group delay of an optical device under test (DUT) (104) comprising:a light source (112) that generates an input optical having a frequency that varies with time;a test interferometer (108) optically coupled to said light source to receive said input optical signal, said test interferometer including said optical DUT;a DUT zero-crossing detector (704) coupled to said test interferometer to detect DUT zero-crossings of a DUT heterodyne beat signal from said test interferometer; anda processor (110) configured to calculate a derivative of a DUT zero-crossings function defined by said DUT zero-crossings with respect to one of time and optical frequency of said DUT zero-crossings function, said processor being further configured to compute a group delay of said optical DUT using said derivative of said DUT zero-crossings function.
- The system of claim 6 further comprising an optical frequency counter (106 and 110) that is configured to detect the optical frequency of said input optical signal, said optical frequency being used to compensate for the frequency sweep non-uniformity of said light source.
- The system of claim 7 wherein said optical frequency counter (106 and 110) includes a reference interferometer (108) that generates a reference heterodyne beat signal from said input optical signal, said reference heterodyne beat signal being associated with said optical frequency of said input optical signal.
- The system of claim 8 wherein said optical frequency counter (106 and 110) is configured to detect (702) zero-crossings of said reference heterodyne beat signal from said reference interferometer (106) to measure said optical frequency of said input optical signal.
- The system of claim 6, 7, 8 or 9 wherein said processor (110) is further configured to sample (710) said DUT zero-crossings function in equal time increments to approximate said derivative of said DUT zero-crossings function with respect to time.
Applications Claiming Priority (2)
| Application Number | Priority Date | Filing Date | Title |
|---|---|---|---|
| US851758 | 2001-05-08 | ||
| US09/851,758 US6486961B1 (en) | 2001-05-08 | 2001-05-08 | System and method for measuring group delay based on zero-crossings |
Publications (3)
| Publication Number | Publication Date |
|---|---|
| EP1256791A2 true EP1256791A2 (en) | 2002-11-13 |
| EP1256791A3 EP1256791A3 (en) | 2004-04-14 |
| EP1256791B1 EP1256791B1 (en) | 2006-10-18 |
Family
ID=25311606
Family Applications (1)
| Application Number | Title | Priority Date | Filing Date |
|---|---|---|---|
| EP01129971A Expired - Lifetime EP1256791B1 (en) | 2001-05-08 | 2001-12-17 | System and method for measuring group delay based on zero-crossings |
Country Status (4)
| Country | Link |
|---|---|
| US (1) | US6486961B1 (en) |
| EP (1) | EP1256791B1 (en) |
| JP (1) | JP2003028753A (en) |
| DE (1) | DE60123928T2 (en) |
Cited By (2)
| Publication number | Priority date | Publication date | Assignee | Title |
|---|---|---|---|---|
| JP2015504167A (en) * | 2012-01-17 | 2015-02-05 | フェムトレーザース プロドゥクシオンズ ゲゼルシャフト ミット ベシュレンクテル ハフツング | Apparatus and method for optical inspection of samples |
| EP3785615A1 (en) * | 2007-01-10 | 2021-03-03 | Lightlab Imaging, Inc. | Methods and apparatus for swept-source optical coherence tomography |
Families Citing this family (20)
| Publication number | Priority date | Publication date | Assignee | Title |
|---|---|---|---|---|
| AUPQ641500A0 (en) * | 2000-03-23 | 2000-04-15 | Defence Science And Technology Organisation | Method and apparatus for estimating chromatic dispersion in fibre bragg gratings |
| DE10125785A1 (en) * | 2001-05-26 | 2002-11-28 | Zeiss Carl | Absolute calibration of interferometer by measuring optical element in four positions and two angular positions, inter-focally and extra-focally |
| US6914681B2 (en) * | 2001-08-22 | 2005-07-05 | Agilent Technologies, Inc. | Interferometric optical component analyzer based on orthogonal filters |
| US6900895B2 (en) * | 2001-12-06 | 2005-05-31 | Agilent Technologies, Inc. | Phase noise compensation in an interferometric system |
| US6813027B2 (en) * | 2002-01-14 | 2004-11-02 | Agilent Technologies, Inc | Time difference synchronization for determination of a property of an optical device |
| US6825934B2 (en) * | 2002-03-14 | 2004-11-30 | Agilent Technologies, Inc. | Vibration noise mitigation in an interferometric system |
| TW555994B (en) * | 2002-06-12 | 2003-10-01 | Mediatek Inc | Group delay test method and device |
| CN100353172C (en) * | 2002-09-17 | 2007-12-05 | 联发科技股份有限公司 | Group delay testing method and device |
| US7526701B2 (en) * | 2002-10-02 | 2009-04-28 | Mediatek Inc. | Method and apparatus for measuring group delay of a device under test |
| DE60225023T2 (en) * | 2002-11-15 | 2008-05-15 | Agilent Technologies Inc., Santa Clara | Determination of an optical property using superimposed and delayed signals |
| CN1330948C (en) * | 2003-12-15 | 2007-08-08 | 中国科学院上海光学精密机械研究所 | Differential Interferometry Device and Measurement Method of Fiber Bragg Grating Group Delay Spectrum |
| US20050251353A1 (en) * | 2004-05-04 | 2005-11-10 | Zoltan Azary | System and method for analyzing an electrical network |
| JP2006266797A (en) * | 2005-03-23 | 2006-10-05 | Anritsu Corp | Optical heterodyne interferometer |
| JP4804820B2 (en) * | 2005-07-15 | 2011-11-02 | サンテック株式会社 | Optical tomographic image display system |
| JP5679686B2 (en) * | 2010-03-18 | 2015-03-04 | キヤノン株式会社 | Optical coherence tomography system |
| US8797541B2 (en) | 2011-07-11 | 2014-08-05 | Baker Hughes Incorporated | Optical network configuration with intrinsic delay for swept-wavelength interferometry systems |
| US10151827B2 (en) | 2014-07-25 | 2018-12-11 | DSCG Solutions, Inc. | Laser phase estimation and correction |
| CN105910709B (en) * | 2016-03-18 | 2017-08-25 | 华北理工大学 | The method that measurement semiconductor laser instantaneously tunes spectrum |
| JP7074311B2 (en) * | 2017-08-30 | 2022-05-24 | 国立研究開発法人産業技術総合研究所 | Optical distance measuring device and measuring method |
| WO2020261391A1 (en) * | 2019-06-25 | 2020-12-30 | 三菱電機株式会社 | Signal processing device, signal processing method, and radar device |
Family Cites Families (5)
| Publication number | Priority date | Publication date | Assignee | Title |
|---|---|---|---|---|
| US4842358A (en) * | 1987-02-20 | 1989-06-27 | Litton Systems, Inc. | Apparatus and method for optical signal source stabilization |
| JP3222562B2 (en) | 1992-08-25 | 2001-10-29 | 株式会社東芝 | Optical network analyzer |
| GB9615302D0 (en) * | 1996-07-20 | 1996-09-04 | Northern Telecom Ltd | Etalon arrangement |
| US5818585A (en) * | 1997-02-28 | 1998-10-06 | The United States Of America As Represented By The Secretary Of The Navy | Fiber Bragg grating interrogation system with adaptive calibration |
| US5978084A (en) * | 1997-08-26 | 1999-11-02 | The Texas A&M University System | Open loop signal processing circuit and method for a fiber optic interferometric sensor |
-
2001
- 2001-05-08 US US09/851,758 patent/US6486961B1/en not_active Expired - Fee Related
- 2001-12-17 DE DE60123928T patent/DE60123928T2/en not_active Expired - Fee Related
- 2001-12-17 EP EP01129971A patent/EP1256791B1/en not_active Expired - Lifetime
-
2002
- 2002-05-02 JP JP2002130478A patent/JP2003028753A/en active Pending
Cited By (2)
| Publication number | Priority date | Publication date | Assignee | Title |
|---|---|---|---|---|
| EP3785615A1 (en) * | 2007-01-10 | 2021-03-03 | Lightlab Imaging, Inc. | Methods and apparatus for swept-source optical coherence tomography |
| JP2015504167A (en) * | 2012-01-17 | 2015-02-05 | フェムトレーザース プロドゥクシオンズ ゲゼルシャフト ミット ベシュレンクテル ハフツング | Apparatus and method for optical inspection of samples |
Also Published As
| Publication number | Publication date |
|---|---|
| JP2003028753A (en) | 2003-01-29 |
| EP1256791B1 (en) | 2006-10-18 |
| DE60123928D1 (en) | 2006-11-30 |
| EP1256791A3 (en) | 2004-04-14 |
| US6486961B1 (en) | 2002-11-26 |
| US20020176089A1 (en) | 2002-11-28 |
| DE60123928T2 (en) | 2007-06-06 |
Similar Documents
| Publication | Publication Date | Title |
|---|---|---|
| US6486961B1 (en) | System and method for measuring group delay based on zero-crossings | |
| EP1286150B1 (en) | Interferometric optical component analyzer based on orthogonal filters | |
| US6900897B2 (en) | Apparatus and method for correcting errors generated by a laser with non-ideal tuning characteristics | |
| EP3540401B1 (en) | High resolution interferometric optical frequency domain reflectometry (ofdr) | |
| CN109186644B (en) | Spectral splicing optical frequency domain reflectometry distributed optical fiber sensor and signal demodulation method | |
| US7009691B2 (en) | System and method for removing the relative phase uncertainty in device characterizations performed with a polarimeter | |
| CA2509187C (en) | Optical wavelength determination using multiple measurable features | |
| US20100145648A1 (en) | System and method for correcting sampling errors associated with radiation source tuning rate fluctuations in swept-wavelength interferometry | |
| JP3337734B2 (en) | Infrared ellipsometer | |
| US6995848B2 (en) | Method and apparatus for calibrating a wavelength-tuning interferometer | |
| CN110207733B (en) | Optical fiber interferometer arm length difference measuring device and method based on sweep frequency laser | |
| US6900895B2 (en) | Phase noise compensation in an interferometric system | |
| US20050078315A1 (en) | Apparatus, method, and program for measuring optical characteristic using quantum interference, and recording medium for recording the program | |
| AU6022896A (en) | Measurement of polarization mode dispersion | |
| US7515275B2 (en) | Optical apparatus and method for distance measuring | |
| Zhao et al. | Nonlinear correction in the frequency scanning interferometry system by a fiber resonator | |
| Yao et al. | Fast optical frequency detection techniques for coherent distributed sensing and communication systems | |
| EP1329702B1 (en) | Polarization effect averaging | |
| US5946096A (en) | Heterodyne interferometry method for measuring physical parameters of medium | |
| US6654124B2 (en) | Signal modulation compensation for wavelength meter | |
| CN1330948C (en) | Differential Interferometry Device and Measurement Method of Fiber Bragg Grating Group Delay Spectrum | |
| JP3106443B2 (en) | Temperature distribution measuring method and device therefor | |
| CN104136912A (en) | Apparatus and method for optical inspection of samples | |
| Flavin et al. | Demodulation of polarimetric optical fibre sensors by dispersive Fourier transform spectroscopy | |
| Waagaard et al. | Spatial characterization of strong fiber Bragg gratings |
Legal Events
| Date | Code | Title | Description |
|---|---|---|---|
| PUAI | Public reference made under article 153(3) epc to a published international application that has entered the european phase |
Free format text: ORIGINAL CODE: 0009012 |
|
| AK | Designated contracting states |
Kind code of ref document: A2 Designated state(s): AT BE CH CY DE DK ES FI FR GB GR IE IT LI LU MC NL PT SE TR |
|
| AX | Request for extension of the european patent |
Free format text: AL;LT;LV;MK;RO;SI |
|
| PUAL | Search report despatched |
Free format text: ORIGINAL CODE: 0009013 |
|
| AK | Designated contracting states |
Kind code of ref document: A3 Designated state(s): AT BE CH CY DE DK ES FI FR GB GR IE IT LI LU MC NL PT SE TR |
|
| AX | Request for extension of the european patent |
Extension state: AL LT LV MK RO SI |
|
| RIC1 | Information provided on ipc code assigned before grant |
Ipc: 7G 01J 3/453 B Ipc: 7G 01B 9/02 B Ipc: 7G 01M 11/00 A |
|
| 17P | Request for examination filed |
Effective date: 20040802 |
|
| AKX | Designation fees paid |
Designated state(s): DE FR GB |
|
| GRAP | Despatch of communication of intention to grant a patent |
Free format text: ORIGINAL CODE: EPIDOSNIGR1 |
|
| GRAS | Grant fee paid |
Free format text: ORIGINAL CODE: EPIDOSNIGR3 |
|
| GRAA | (expected) grant |
Free format text: ORIGINAL CODE: 0009210 |
|
| AK | Designated contracting states |
Kind code of ref document: B1 Designated state(s): DE FR GB |
|
| REG | Reference to a national code |
Ref country code: GB Ref legal event code: FG4D |
|
| REF | Corresponds to: |
Ref document number: 60123928 Country of ref document: DE Date of ref document: 20061130 Kind code of ref document: P |
|
| PGFP | Annual fee paid to national office [announced via postgrant information from national office to epo] |
Ref country code: FR Payment date: 20061220 Year of fee payment: 6 |
|
| PGFP | Annual fee paid to national office [announced via postgrant information from national office to epo] |
Ref country code: GB Payment date: 20061222 Year of fee payment: 6 |
|
| RAP2 | Party data changed (patent owner data changed or rights of a patent transferred) |
Owner name: AGILENT TECHNOLOGIES, INC. |
|
| PGFP | Annual fee paid to national office [announced via postgrant information from national office to epo] |
Ref country code: DE Payment date: 20070131 Year of fee payment: 6 |
|
| ET | Fr: translation filed | ||
| PLBE | No opposition filed within time limit |
Free format text: ORIGINAL CODE: 0009261 |
|
| STAA | Information on the status of an ep patent application or granted ep patent |
Free format text: STATUS: NO OPPOSITION FILED WITHIN TIME LIMIT |
|
| 26N | No opposition filed |
Effective date: 20070719 |
|
| GBPC | Gb: european patent ceased through non-payment of renewal fee |
Effective date: 20071217 |
|
| PG25 | Lapsed in a contracting state [announced via postgrant information from national office to epo] |
Ref country code: DE Free format text: LAPSE BECAUSE OF NON-PAYMENT OF DUE FEES Effective date: 20080701 |
|
| REG | Reference to a national code |
Ref country code: FR Ref legal event code: ST Effective date: 20081020 |
|
| PG25 | Lapsed in a contracting state [announced via postgrant information from national office to epo] |
Ref country code: GB Free format text: LAPSE BECAUSE OF NON-PAYMENT OF DUE FEES Effective date: 20071217 |
|
| PG25 | Lapsed in a contracting state [announced via postgrant information from national office to epo] |
Ref country code: FR Free format text: LAPSE BECAUSE OF NON-PAYMENT OF DUE FEES Effective date: 20071231 |