EP1233366A2 - Verfahren zur herstellung und verwendung von Haplotype Daten - Google Patents
Verfahren zur herstellung und verwendung von Haplotype Daten Download PDFInfo
- Publication number
- EP1233366A2 EP1233366A2 EP02007045A EP02007045A EP1233366A2 EP 1233366 A2 EP1233366 A2 EP 1233366A2 EP 02007045 A EP02007045 A EP 02007045A EP 02007045 A EP02007045 A EP 02007045A EP 1233366 A2 EP1233366 A2 EP 1233366A2
- Authority
- EP
- European Patent Office
- Prior art keywords
- haplotype
- gene
- computer
- haplotypes
- clinical
- Prior art date
- Legal status (The legal status is an assumption and is not a legal conclusion. Google has not performed a legal analysis and makes no representation as to the accuracy of the status listed.)
- Withdrawn
Links
- 102000054766 genetic haplotypes Human genes 0.000 title claims abstract description 553
- 238000000034 method Methods 0.000 title claims abstract description 149
- 108090000623 proteins and genes Proteins 0.000 claims abstract description 366
- 230000004044 response Effects 0.000 claims abstract description 143
- 238000011282 treatment Methods 0.000 claims abstract description 40
- 239000003814 drug Substances 0.000 claims description 161
- 229940079593 drug Drugs 0.000 claims description 159
- 229940000406 drug candidate Drugs 0.000 claims 3
- 238000007619 statistical method Methods 0.000 claims 2
- 238000004590 computer program Methods 0.000 abstract description 16
- 239000002773 nucleotide Substances 0.000 description 89
- 125000003729 nucleotide group Chemical group 0.000 description 89
- 238000012360 testing method Methods 0.000 description 66
- 230000002068 genetic effect Effects 0.000 description 54
- 102000054765 polymorphisms of proteins Human genes 0.000 description 48
- 102000004169 proteins and genes Human genes 0.000 description 45
- 238000004458 analytical method Methods 0.000 description 43
- 238000005259 measurement Methods 0.000 description 42
- 201000010099 disease Diseases 0.000 description 41
- 208000037265 diseases, disorders, signs and symptoms Diseases 0.000 description 41
- 210000004027 cell Anatomy 0.000 description 39
- 230000008569 process Effects 0.000 description 36
- 238000009826 distribution Methods 0.000 description 34
- 238000003205 genotyping method Methods 0.000 description 32
- 238000004364 calculation method Methods 0.000 description 31
- 239000011159 matrix material Substances 0.000 description 27
- 108020004414 DNA Proteins 0.000 description 24
- 230000000694 effects Effects 0.000 description 23
- 238000004422 calculation algorithm Methods 0.000 description 21
- 230000006870 function Effects 0.000 description 21
- 210000000349 chromosome Anatomy 0.000 description 20
- 230000002596 correlated effect Effects 0.000 description 20
- 230000000875 corresponding effect Effects 0.000 description 16
- 102000004190 Enzymes Human genes 0.000 description 14
- 108090000790 Enzymes Proteins 0.000 description 14
- 230000002411 adverse Effects 0.000 description 14
- 108700028369 Alleles Proteins 0.000 description 13
- 238000013459 approach Methods 0.000 description 13
- 101150033809 ADRB2 gene Proteins 0.000 description 12
- 238000003556 assay Methods 0.000 description 12
- 108020004999 messenger RNA Proteins 0.000 description 12
- 108010001237 Cytochrome P-450 CYP2D6 Proteins 0.000 description 11
- 241000282414 Homo sapiens Species 0.000 description 11
- 108091028043 Nucleic acid sequence Proteins 0.000 description 11
- 208000006673 asthma Diseases 0.000 description 11
- 108700024394 Exon Proteins 0.000 description 10
- NDAUXUAQIAJITI-UHFFFAOYSA-N albuterol Chemical compound CC(C)(C)NCC(O)C1=CC=C(O)C(CO)=C1 NDAUXUAQIAJITI-UHFFFAOYSA-N 0.000 description 10
- 238000013507 mapping Methods 0.000 description 10
- 229960002052 salbutamol Drugs 0.000 description 10
- 231100000419 toxicity Toxicity 0.000 description 10
- 230000001988 toxicity Effects 0.000 description 10
- 102100021704 Cytochrome P450 2D6 Human genes 0.000 description 9
- 241000196324 Embryophyta Species 0.000 description 9
- 108091092195 Intron Proteins 0.000 description 9
- 230000008901 benefit Effects 0.000 description 9
- 238000013461 design Methods 0.000 description 9
- 238000005516 engineering process Methods 0.000 description 9
- 241001465754 Metazoa Species 0.000 description 8
- 150000001875 compounds Chemical class 0.000 description 8
- 238000002405 diagnostic procedure Methods 0.000 description 8
- 230000014509 gene expression Effects 0.000 description 8
- 230000000873 masking effect Effects 0.000 description 8
- 238000005457 optimization Methods 0.000 description 8
- 230000037361 pathway Effects 0.000 description 8
- 230000002829 reductive effect Effects 0.000 description 8
- 150000001413 amino acids Chemical class 0.000 description 7
- 230000008859 change Effects 0.000 description 7
- 239000003086 colorant Substances 0.000 description 7
- 239000002299 complementary DNA Substances 0.000 description 7
- 238000012217 deletion Methods 0.000 description 7
- 230000037430 deletion Effects 0.000 description 7
- 238000011161 development Methods 0.000 description 7
- 238000010586 diagram Methods 0.000 description 7
- 238000002474 experimental method Methods 0.000 description 7
- 206010067484 Adverse reaction Diseases 0.000 description 6
- 108091060211 Expressed sequence tag Proteins 0.000 description 6
- 108091026898 Leader sequence (mRNA) Proteins 0.000 description 6
- 108091036066 Three prime untranslated region Proteins 0.000 description 6
- 230000006838 adverse reaction Effects 0.000 description 6
- 238000004891 communication Methods 0.000 description 6
- -1 existing drugs) Chemical class 0.000 description 6
- 238000003780 insertion Methods 0.000 description 6
- 230000037431 insertion Effects 0.000 description 6
- 238000012417 linear regression Methods 0.000 description 6
- 238000000611 regression analysis Methods 0.000 description 6
- 108020004705 Codon Proteins 0.000 description 5
- 208000022602 disease susceptibility Diseases 0.000 description 5
- 239000003596 drug target Substances 0.000 description 5
- 238000007726 management method Methods 0.000 description 5
- 239000003550 marker Substances 0.000 description 5
- 238000009521 phase II clinical trial Methods 0.000 description 5
- 239000000902 placebo Substances 0.000 description 5
- 229940068196 placebo Drugs 0.000 description 5
- 210000002966 serum Anatomy 0.000 description 5
- 238000010561 standard procedure Methods 0.000 description 5
- 238000003860 storage Methods 0.000 description 5
- 230000000007 visual effect Effects 0.000 description 5
- 108091032973 (ribonucleotides)n+m Proteins 0.000 description 4
- 101150010738 CYP2D6 gene Proteins 0.000 description 4
- 108020004635 Complementary DNA Proteins 0.000 description 4
- 101150009243 HAP1 gene Proteins 0.000 description 4
- 108010029485 Protein Isoforms Proteins 0.000 description 4
- 102000001708 Protein Isoforms Human genes 0.000 description 4
- 230000009471 action Effects 0.000 description 4
- 210000004369 blood Anatomy 0.000 description 4
- 239000008280 blood Substances 0.000 description 4
- HVYWMOMLDIMFJA-DPAQBDIFSA-N cholesterol Chemical compound C1C=C2C[C@@H](O)CC[C@]2(C)[C@@H]2[C@@H]1[C@@H]1CC[C@H]([C@H](C)CCCC(C)C)[C@@]1(C)CC2 HVYWMOMLDIMFJA-DPAQBDIFSA-N 0.000 description 4
- 230000002860 competitive effect Effects 0.000 description 4
- 231100000673 dose–response relationship Toxicity 0.000 description 4
- 230000007614 genetic variation Effects 0.000 description 4
- 230000036541 health Effects 0.000 description 4
- 238000011835 investigation Methods 0.000 description 4
- 238000013178 mathematical model Methods 0.000 description 4
- 230000009467 reduction Effects 0.000 description 4
- 230000002441 reversible effect Effects 0.000 description 4
- 238000012163 sequencing technique Methods 0.000 description 4
- 241000894007 species Species 0.000 description 4
- 230000001225 therapeutic effect Effects 0.000 description 4
- 108010061846 Cholesterol Ester Transfer Proteins Proteins 0.000 description 3
- 102000012336 Cholesterol Ester Transfer Proteins Human genes 0.000 description 3
- 108010015742 Cytochrome P-450 Enzyme System Proteins 0.000 description 3
- 101150077031 DAXX gene Proteins 0.000 description 3
- 102000053602 DNA Human genes 0.000 description 3
- 229940121710 HMGCoA reductase inhibitor Drugs 0.000 description 3
- 238000004977 Hueckel calculation Methods 0.000 description 3
- WGZDBVOTUVNQFP-UHFFFAOYSA-N N-(1-phthalazinylamino)carbamic acid ethyl ester Chemical compound C1=CC=C2C(NNC(=O)OCC)=NN=CC2=C1 WGZDBVOTUVNQFP-UHFFFAOYSA-N 0.000 description 3
- 206010028980 Neoplasm Diseases 0.000 description 3
- 238000000692 Student's t-test Methods 0.000 description 3
- 230000007423 decrease Effects 0.000 description 3
- 238000001514 detection method Methods 0.000 description 3
- 210000004185 liver Anatomy 0.000 description 3
- 230000004060 metabolic process Effects 0.000 description 3
- 239000000203 mixture Substances 0.000 description 3
- 239000002547 new drug Substances 0.000 description 3
- 230000008520 organization Effects 0.000 description 3
- 230000002974 pharmacogenomic effect Effects 0.000 description 3
- 238000012545 processing Methods 0.000 description 3
- 230000001105 regulatory effect Effects 0.000 description 3
- 238000011160 research Methods 0.000 description 3
- 230000004083 survival effect Effects 0.000 description 3
- 238000002560 therapeutic procedure Methods 0.000 description 3
- 210000001519 tissue Anatomy 0.000 description 3
- 238000012546 transfer Methods 0.000 description 3
- 108700026220 vif Genes Proteins 0.000 description 3
- 108020005345 3' Untranslated Regions Proteins 0.000 description 2
- 108020003589 5' Untranslated Regions Proteins 0.000 description 2
- 102100031126 6-phosphogluconolactonase Human genes 0.000 description 2
- 108010029731 6-phosphogluconolactonase Proteins 0.000 description 2
- 102100039705 Beta-2 adrenergic receptor Human genes 0.000 description 2
- 102100025580 Calmodulin-1 Human genes 0.000 description 2
- 208000024172 Cardiovascular disease Diseases 0.000 description 2
- 108091026890 Coding region Proteins 0.000 description 2
- 102000003849 Cytochrome P450 Human genes 0.000 description 2
- 102100020756 D(2) dopamine receptor Human genes 0.000 description 2
- 102100028559 Death domain-associated protein 6 Human genes 0.000 description 2
- ULGZDMOVFRHVEP-RWJQBGPGSA-N Erythromycin Chemical compound O([C@@H]1[C@@H](C)C(=O)O[C@@H]([C@@]([C@H](O)[C@@H](C)C(=O)[C@H](C)C[C@@](C)(O)[C@H](O[C@H]2[C@@H]([C@H](C[C@@H](C)O2)N(C)C)O)[C@H]1C)(C)O)CC)[C@H]1C[C@@](C)(OC)[C@@H](O)[C@H](C)O1 ULGZDMOVFRHVEP-RWJQBGPGSA-N 0.000 description 2
- 241000206602 Eukaryota Species 0.000 description 2
- 108010018962 Glucosephosphate Dehydrogenase Proteins 0.000 description 2
- 241000282412 Homo Species 0.000 description 2
- 101000931901 Homo sapiens D(2) dopamine receptor Proteins 0.000 description 2
- 101000609949 Homo sapiens Rod cGMP-specific 3',5'-cyclic phosphodiesterase subunit beta Proteins 0.000 description 2
- 206010020772 Hypertension Diseases 0.000 description 2
- 101150017040 I gene Proteins 0.000 description 2
- 102000009438 IgE Receptors Human genes 0.000 description 2
- 108010073816 IgE Receptors Proteins 0.000 description 2
- 102000003816 Interleukin-13 Human genes 0.000 description 2
- 108090000176 Interleukin-13 Proteins 0.000 description 2
- 102000004388 Interleukin-4 Human genes 0.000 description 2
- 108090000978 Interleukin-4 Proteins 0.000 description 2
- 102000000585 Interleukin-9 Human genes 0.000 description 2
- 108010002335 Interleukin-9 Proteins 0.000 description 2
- 108091034117 Oligonucleotide Proteins 0.000 description 2
- 108700026244 Open Reading Frames Proteins 0.000 description 2
- 102000008108 Osteoprotegerin Human genes 0.000 description 2
- 108010035042 Osteoprotegerin Proteins 0.000 description 2
- TUZYXOIXSAXUGO-UHFFFAOYSA-N Pravastatin Natural products C1=CC(C)C(CCC(O)CC(O)CC(O)=O)C2C(OC(=O)C(C)CC)CC(O)C=C21 TUZYXOIXSAXUGO-UHFFFAOYSA-N 0.000 description 2
- 102100038280 Prostaglandin G/H synthase 2 Human genes 0.000 description 2
- 206010057190 Respiratory tract infections Diseases 0.000 description 2
- 102100039174 Rod cGMP-specific 3',5'-cyclic phosphodiesterase subunit beta Human genes 0.000 description 2
- 241000906446 Theraps Species 0.000 description 2
- 102000008200 Uncoupling Protein 3 Human genes 0.000 description 2
- 108010021098 Uncoupling Protein 3 Proteins 0.000 description 2
- 108091023045 Untranslated Region Proteins 0.000 description 2
- 238000007792 addition Methods 0.000 description 2
- 238000007844 allele-specific PCR Methods 0.000 description 2
- 229940127225 asthma medication Drugs 0.000 description 2
- 108010014499 beta-2 Adrenergic Receptors Proteins 0.000 description 2
- 201000011510 cancer Diseases 0.000 description 2
- 229960005110 cerivastatin Drugs 0.000 description 2
- SEERZIQQUAZTOL-ANMDKAQQSA-N cerivastatin Chemical compound COCC1=C(C(C)C)N=C(C(C)C)C(\C=C\[C@@H](O)C[C@@H](O)CC(O)=O)=C1C1=CC=C(F)C=C1 SEERZIQQUAZTOL-ANMDKAQQSA-N 0.000 description 2
- 238000006243 chemical reaction Methods 0.000 description 2
- 239000003795 chemical substances by application Substances 0.000 description 2
- 238000000546 chi-square test Methods 0.000 description 2
- OROGSEYTTFOCAN-DNJOTXNNSA-N codeine Chemical compound C([C@H]1[C@H](N(CC[C@@]112)C)C3)=C[C@H](O)[C@@H]1OC1=C2C3=CC=C1OC OROGSEYTTFOCAN-DNJOTXNNSA-N 0.000 description 2
- 230000000295 complement effect Effects 0.000 description 2
- 238000012790 confirmation Methods 0.000 description 2
- 238000005520 cutting process Methods 0.000 description 2
- 238000013499 data model Methods 0.000 description 2
- 238000003745 diagnosis Methods 0.000 description 2
- 238000009510 drug design Methods 0.000 description 2
- 238000007876 drug discovery Methods 0.000 description 2
- 230000037433 frameshift Effects 0.000 description 2
- 239000011521 glass Substances 0.000 description 2
- 230000003993 interaction Effects 0.000 description 2
- 229960003350 isoniazid Drugs 0.000 description 2
- 238000009533 lab test Methods 0.000 description 2
- 150000002632 lipids Chemical class 0.000 description 2
- 239000000463 material Substances 0.000 description 2
- 230000007246 mechanism Effects 0.000 description 2
- 238000002483 medication Methods 0.000 description 2
- 230000002503 metabolic effect Effects 0.000 description 2
- 238000012986 modification Methods 0.000 description 2
- 230000004048 modification Effects 0.000 description 2
- 231100000956 nontoxicity Toxicity 0.000 description 2
- 238000010606 normalization Methods 0.000 description 2
- 108020004707 nucleic acids Proteins 0.000 description 2
- 102000039446 nucleic acids Human genes 0.000 description 2
- 150000007523 nucleic acids Chemical class 0.000 description 2
- 230000009120 phenotypic response Effects 0.000 description 2
- 229960002965 pravastatin Drugs 0.000 description 2
- TUZYXOIXSAXUGO-PZAWKZKUSA-N pravastatin Chemical compound C1=C[C@H](C)[C@H](CC[C@@H](O)C[C@@H](O)CC(O)=O)[C@H]2[C@@H](OC(=O)[C@@H](C)CC)C[C@H](O)C=C21 TUZYXOIXSAXUGO-PZAWKZKUSA-N 0.000 description 2
- 230000004853 protein function Effects 0.000 description 2
- 238000003908 quality control method Methods 0.000 description 2
- 102000005962 receptors Human genes 0.000 description 2
- 108020003175 receptors Proteins 0.000 description 2
- 230000029058 respiratory gaseous exchange Effects 0.000 description 2
- 238000005070 sampling Methods 0.000 description 2
- 238000002864 sequence alignment Methods 0.000 description 2
- 238000004088 simulation Methods 0.000 description 2
- 239000000243 solution Substances 0.000 description 2
- 238000013125 spirometry Methods 0.000 description 2
- 238000006467 substitution reaction Methods 0.000 description 2
- AXOIZCJOOAYSMI-UHFFFAOYSA-N succinylcholine Chemical compound C[N+](C)(C)CCOC(=O)CCC(=O)OCC[N+](C)(C)C AXOIZCJOOAYSMI-UHFFFAOYSA-N 0.000 description 2
- 229940032712 succinylcholine Drugs 0.000 description 2
- 231100000331 toxic Toxicity 0.000 description 2
- 230000002588 toxic effect Effects 0.000 description 2
- 238000013519 translation Methods 0.000 description 2
- 238000010626 work up procedure Methods 0.000 description 2
- XMAYWYJOQHXEEK-ZEQKJWHPSA-N (2S,4R)-ketoconazole Chemical compound C1CN(C(=O)C)CCN1C(C=C1)=CC=C1OC[C@H]1O[C@](CN2C=NC=C2)(C=2C(=CC(Cl)=CC=2)Cl)OC1 XMAYWYJOQHXEEK-ZEQKJWHPSA-N 0.000 description 1
- QFLWZFQWSBQYPS-AWRAUJHKSA-N (3S)-3-[[(2S)-2-[[(2S)-2-[5-[(3aS,6aR)-2-oxo-1,3,3a,4,6,6a-hexahydrothieno[3,4-d]imidazol-4-yl]pentanoylamino]-3-methylbutanoyl]amino]-3-(4-hydroxyphenyl)propanoyl]amino]-4-[1-bis(4-chlorophenoxy)phosphorylbutylamino]-4-oxobutanoic acid Chemical compound CCCC(NC(=O)[C@H](CC(O)=O)NC(=O)[C@H](Cc1ccc(O)cc1)NC(=O)[C@@H](NC(=O)CCCCC1SC[C@@H]2NC(=O)N[C@H]12)C(C)C)P(=O)(Oc1ccc(Cl)cc1)Oc1ccc(Cl)cc1 QFLWZFQWSBQYPS-AWRAUJHKSA-N 0.000 description 1
- 101150028074 2 gene Proteins 0.000 description 1
- GJOHLWZHWQUKAU-UHFFFAOYSA-N 5-azaniumylpentan-2-yl-(6-methoxyquinolin-8-yl)azanium;dihydrogen phosphate Chemical compound OP(O)(O)=O.OP(O)(O)=O.N1=CC=CC2=CC(OC)=CC(NC(C)CCCN)=C21 GJOHLWZHWQUKAU-UHFFFAOYSA-N 0.000 description 1
- 102100022738 5-hydroxytryptamine receptor 1A Human genes 0.000 description 1
- 101710138638 5-hydroxytryptamine receptor 1A Proteins 0.000 description 1
- 102000017919 ADRB2 Human genes 0.000 description 1
- 208000024827 Alzheimer disease Diseases 0.000 description 1
- 229940124810 Alzheimer's drug Drugs 0.000 description 1
- 206010002091 Anaesthesia Diseases 0.000 description 1
- 108010025628 Apolipoproteins E Proteins 0.000 description 1
- XUKUURHRXDUEBC-KAYWLYCHSA-N Atorvastatin Chemical compound C=1C=CC=CC=1C1=C(C=2C=CC(F)=CC=2)N(CC[C@@H](O)C[C@@H](O)CC(O)=O)C(C(C)C)=C1C(=O)NC1=CC=CC=C1 XUKUURHRXDUEBC-KAYWLYCHSA-N 0.000 description 1
- XUKUURHRXDUEBC-UHFFFAOYSA-N Atorvastatin Natural products C=1C=CC=CC=1C1=C(C=2C=CC(F)=CC=2)N(CCC(O)CC(O)CC(O)=O)C(C(C)C)=C1C(=O)NC1=CC=CC=C1 XUKUURHRXDUEBC-UHFFFAOYSA-N 0.000 description 1
- 238000012935 Averaging Methods 0.000 description 1
- 206010055113 Breast cancer metastatic Diseases 0.000 description 1
- 101710164735 Calmodulin-1 Proteins 0.000 description 1
- 108010037462 Cyclooxygenase 2 Proteins 0.000 description 1
- 102000002004 Cytochrome P-450 Enzyme System Human genes 0.000 description 1
- 238000001712 DNA sequencing Methods 0.000 description 1
- 208000035240 Disease Resistance Diseases 0.000 description 1
- 208000025499 G6PD deficiency Diseases 0.000 description 1
- 108700039691 Genetic Promoter Regions Proteins 0.000 description 1
- 206010019663 Hepatic failure Diseases 0.000 description 1
- 208000028782 Hereditary disease Diseases 0.000 description 1
- 101000959437 Homo sapiens Beta-2 adrenergic receptor Proteins 0.000 description 1
- 101000984164 Homo sapiens Calmodulin-1 Proteins 0.000 description 1
- 101001033249 Homo sapiens Interleukin-1 beta Proteins 0.000 description 1
- 101001012157 Homo sapiens Receptor tyrosine-protein kinase erbB-2 Proteins 0.000 description 1
- 101000611183 Homo sapiens Tumor necrosis factor Proteins 0.000 description 1
- 101001052849 Homo sapiens Tyrosine-protein kinase Fer Proteins 0.000 description 1
- 101000934996 Homo sapiens Tyrosine-protein kinase JAK3 Proteins 0.000 description 1
- 206010020751 Hypersensitivity Diseases 0.000 description 1
- 206010021118 Hypotonia Diseases 0.000 description 1
- 102100039065 Interleukin-1 beta Human genes 0.000 description 1
- 102000010787 Interleukin-4 Receptors Human genes 0.000 description 1
- 108010038486 Interleukin-4 Receptors Proteins 0.000 description 1
- 102000015696 Interleukins Human genes 0.000 description 1
- 108010063738 Interleukins Proteins 0.000 description 1
- 238000007476 Maximum Likelihood Methods 0.000 description 1
- 108091092878 Microsatellite Proteins 0.000 description 1
- 101710202061 N-acetyltransferase Proteins 0.000 description 1
- RTHCYVBBDHJXIQ-UHFFFAOYSA-N N-methyl-3-phenyl-3-[4-(trifluoromethyl)phenoxy]propan-1-amine Chemical compound C=1C=CC=CC=1C(CCNC)OC1=CC=C(C(F)(F)F)C=C1 RTHCYVBBDHJXIQ-UHFFFAOYSA-N 0.000 description 1
- 206010028851 Necrosis Diseases 0.000 description 1
- 206010033799 Paralysis Diseases 0.000 description 1
- 108050003267 Prostaglandin G/H synthase 2 Proteins 0.000 description 1
- 102000004005 Prostaglandin-endoperoxide synthases Human genes 0.000 description 1
- 108090000459 Prostaglandin-endoperoxide synthases Proteins 0.000 description 1
- 206010060862 Prostate cancer Diseases 0.000 description 1
- 208000000236 Prostatic Neoplasms Diseases 0.000 description 1
- 108010076504 Protein Sorting Signals Proteins 0.000 description 1
- 102100030086 Receptor tyrosine-protein kinase erbB-2 Human genes 0.000 description 1
- 240000004808 Saccharomyces cerevisiae Species 0.000 description 1
- 101100017043 Saccharomyces cerevisiae (strain ATCC 204508 / S288c) HIR3 gene Proteins 0.000 description 1
- 102000019208 Serotonin Plasma Membrane Transport Proteins Human genes 0.000 description 1
- 108010012996 Serotonin Plasma Membrane Transport Proteins Proteins 0.000 description 1
- 108060008682 Tumor Necrosis Factor Proteins 0.000 description 1
- 102000000852 Tumor Necrosis Factor-alpha Human genes 0.000 description 1
- 102100040247 Tumor necrosis factor Human genes 0.000 description 1
- 102100033732 Tumor necrosis factor receptor superfamily member 1A Human genes 0.000 description 1
- 101710187743 Tumor necrosis factor receptor superfamily member 1A Proteins 0.000 description 1
- 102100024537 Tyrosine-protein kinase Fer Human genes 0.000 description 1
- 102100025387 Tyrosine-protein kinase JAK3 Human genes 0.000 description 1
- 210000001766 X chromosome Anatomy 0.000 description 1
- 241000607479 Yersinia pestis Species 0.000 description 1
- 238000009825 accumulation Methods 0.000 description 1
- 230000004913 activation Effects 0.000 description 1
- 208000026935 allergic disease Diseases 0.000 description 1
- 230000007815 allergy Effects 0.000 description 1
- 230000037005 anaesthesia Effects 0.000 description 1
- 208000007502 anemia Diseases 0.000 description 1
- 239000003242 anti bacterial agent Substances 0.000 description 1
- 230000003466 anti-cipated effect Effects 0.000 description 1
- 230000001430 anti-depressive effect Effects 0.000 description 1
- 230000003579 anti-obesity Effects 0.000 description 1
- 229940124350 antibacterial drug Drugs 0.000 description 1
- 229940088710 antibiotic agent Drugs 0.000 description 1
- 239000003529 anticholesteremic agent Substances 0.000 description 1
- 239000000935 antidepressant agent Substances 0.000 description 1
- 229940005513 antidepressants Drugs 0.000 description 1
- 239000003429 antifungal agent Substances 0.000 description 1
- 239000003430 antimalarial agent Substances 0.000 description 1
- 239000002246 antineoplastic agent Substances 0.000 description 1
- 229940041181 antineoplastic drug Drugs 0.000 description 1
- 101150010487 are gene Proteins 0.000 description 1
- 238000013528 artificial neural network Methods 0.000 description 1
- 229960005370 atorvastatin Drugs 0.000 description 1
- FQCKMBLVYCEXJB-MNSAWQCASA-L atorvastatin calcium Chemical compound [Ca+2].C=1C=CC=CC=1C1=C(C=2C=CC(F)=CC=2)N(CC[C@@H](O)C[C@@H](O)CC([O-])=O)C(C(C)C)=C1C(=O)NC1=CC=CC=C1.C=1C=CC=CC=1C1=C(C=2C=CC(F)=CC=2)N(CC[C@@H](O)C[C@@H](O)CC([O-])=O)C(C(C)C)=C1C(=O)NC1=CC=CC=C1 FQCKMBLVYCEXJB-MNSAWQCASA-L 0.000 description 1
- 230000003190 augmentative effect Effects 0.000 description 1
- 230000003115 biocidal effect Effects 0.000 description 1
- 229960000074 biopharmaceutical Drugs 0.000 description 1
- 230000015572 biosynthetic process Effects 0.000 description 1
- 239000000872 buffer Substances 0.000 description 1
- FAKRSMQSSFJEIM-RQJHMYQMSA-N captopril Chemical compound SC[C@@H](C)C(=O)N1CCC[C@H]1C(O)=O FAKRSMQSSFJEIM-RQJHMYQMSA-N 0.000 description 1
- 229960000830 captopril Drugs 0.000 description 1
- 150000001720 carbohydrates Chemical class 0.000 description 1
- 235000014633 carbohydrates Nutrition 0.000 description 1
- 230000001413 cellular effect Effects 0.000 description 1
- 208000015114 central nervous system disease Diseases 0.000 description 1
- 238000012512 characterization method Methods 0.000 description 1
- 235000012000 cholesterol Nutrition 0.000 description 1
- 238000010367 cloning Methods 0.000 description 1
- 238000012411 cloning technique Methods 0.000 description 1
- 229960004126 codeine Drugs 0.000 description 1
- 238000000205 computational method Methods 0.000 description 1
- 230000009133 cooperative interaction Effects 0.000 description 1
- 238000013523 data management Methods 0.000 description 1
- 238000007418 data mining Methods 0.000 description 1
- 238000013500 data storage Methods 0.000 description 1
- 230000002498 deadly effect Effects 0.000 description 1
- 230000003247 decreasing effect Effects 0.000 description 1
- 230000007812 deficiency Effects 0.000 description 1
- 230000001419 dependent effect Effects 0.000 description 1
- 238000009795 derivation Methods 0.000 description 1
- 206010012601 diabetes mellitus Diseases 0.000 description 1
- 239000012895 dilution Substances 0.000 description 1
- 238000010790 dilution Methods 0.000 description 1
- 230000024346 drought recovery Effects 0.000 description 1
- 238000009509 drug development Methods 0.000 description 1
- 238000003255 drug test Methods 0.000 description 1
- 238000002651 drug therapy Methods 0.000 description 1
- 239000012776 electronic material Substances 0.000 description 1
- 230000008030 elimination Effects 0.000 description 1
- 238000003379 elimination reaction Methods 0.000 description 1
- 229960003276 erythromycin Drugs 0.000 description 1
- 229940011871 estrogen Drugs 0.000 description 1
- 239000000262 estrogen Substances 0.000 description 1
- 238000011156 evaluation Methods 0.000 description 1
- 230000001747 exhibiting effect Effects 0.000 description 1
- 238000000556 factor analysis Methods 0.000 description 1
- 230000035558 fertility Effects 0.000 description 1
- 102000054767 gene variant Human genes 0.000 description 1
- 208000008605 glucosephosphate dehydrogenase deficiency Diseases 0.000 description 1
- 238000011478 gradient descent method Methods 0.000 description 1
- 239000001963 growth medium Substances 0.000 description 1
- 201000010235 heart cancer Diseases 0.000 description 1
- 208000019622 heart disease Diseases 0.000 description 1
- 208000024348 heart neoplasm Diseases 0.000 description 1
- 229940022353 herceptin Drugs 0.000 description 1
- OROGSEYTTFOCAN-UHFFFAOYSA-N hydrocodone Natural products C1C(N(CCC234)C)C2C=CC(O)C3OC2=C4C1=CC=C2OC OROGSEYTTFOCAN-UHFFFAOYSA-N 0.000 description 1
- 239000002471 hydroxymethylglutaryl coenzyme A reductase inhibitor Substances 0.000 description 1
- 230000008676 import Effects 0.000 description 1
- 238000000338 in vitro Methods 0.000 description 1
- 238000009399 inbreeding Methods 0.000 description 1
- 208000021005 inheritance pattern Diseases 0.000 description 1
- 229940028885 interleukin-4 Drugs 0.000 description 1
- 108040006852 interleukin-4 receptor activity proteins Proteins 0.000 description 1
- 229940118526 interleukin-9 Drugs 0.000 description 1
- 230000003834 intracellular effect Effects 0.000 description 1
- QRXWMOHMRWLFEY-UHFFFAOYSA-N isoniazide Chemical compound NNC(=O)C1=CC=NC=C1 QRXWMOHMRWLFEY-UHFFFAOYSA-N 0.000 description 1
- 238000005304 joining Methods 0.000 description 1
- 230000000670 limiting effect Effects 0.000 description 1
- 229940002661 lipitor Drugs 0.000 description 1
- 208000019423 liver disease Diseases 0.000 description 1
- 208000007903 liver failure Diseases 0.000 description 1
- 231100000835 liver failure Toxicity 0.000 description 1
- 210000004072 lung Anatomy 0.000 description 1
- 238000004949 mass spectrometry Methods 0.000 description 1
- 230000008774 maternal effect Effects 0.000 description 1
- 208000024191 minimally invasive lung adenocarcinoma Diseases 0.000 description 1
- 238000012544 monitoring process Methods 0.000 description 1
- 210000003205 muscle Anatomy 0.000 description 1
- 230000036640 muscle relaxation Effects 0.000 description 1
- 230000035772 mutation Effects 0.000 description 1
- 230000000869 mutational effect Effects 0.000 description 1
- LQWUGNODGKKHOP-UHFFFAOYSA-N n-pyren-1-ylhydroxylamine Chemical compound C1=C2C(NO)=CC=C(C=C3)C2=C2C3=CC=CC2=C1 LQWUGNODGKKHOP-UHFFFAOYSA-N 0.000 description 1
- 230000017074 necrotic cell death Effects 0.000 description 1
- 229940064438 nizoral Drugs 0.000 description 1
- 231100000252 nontoxic Toxicity 0.000 description 1
- 230000003000 nontoxic effect Effects 0.000 description 1
- 230000003287 optical effect Effects 0.000 description 1
- 230000036407 pain Effects 0.000 description 1
- 230000036961 partial effect Effects 0.000 description 1
- 230000008775 paternal effect Effects 0.000 description 1
- 238000002823 phage display Methods 0.000 description 1
- 230000000144 pharmacologic effect Effects 0.000 description 1
- 238000009520 phase I clinical trial Methods 0.000 description 1
- 238000009522 phase III clinical trial Methods 0.000 description 1
- 208000030683 polygenic disease Diseases 0.000 description 1
- 108091033319 polynucleotide Proteins 0.000 description 1
- 102000040430 polynucleotide Human genes 0.000 description 1
- 239000002157 polynucleotide Substances 0.000 description 1
- VWBQYTRBTXKKOG-IYNICTALSA-M pravastatin sodium Chemical compound [Na+].C1=C[C@H](C)[C@H](CC[C@@H](O)C[C@@H](O)CC([O-])=O)[C@H]2[C@@H](OC(=O)[C@@H](C)CC)C[C@H](O)C=C21 VWBQYTRBTXKKOG-IYNICTALSA-M 0.000 description 1
- 230000003449 preventive effect Effects 0.000 description 1
- 229960005179 primaquine Drugs 0.000 description 1
- 230000037452 priming Effects 0.000 description 1
- 238000012913 prioritisation Methods 0.000 description 1
- 238000000159 protein binding assay Methods 0.000 description 1
- 229940035613 prozac Drugs 0.000 description 1
- 208000020016 psychiatric disease Diseases 0.000 description 1
- 238000012552 review Methods 0.000 description 1
- 230000033764 rhythmic process Effects 0.000 description 1
- 150000003839 salts Chemical class 0.000 description 1
- 238000012216 screening Methods 0.000 description 1
- 238000007423 screening assay Methods 0.000 description 1
- 238000009589 serological test Methods 0.000 description 1
- 208000007056 sickle cell anemia Diseases 0.000 description 1
- 230000019491 signal transduction Effects 0.000 description 1
- 230000037432 silent mutation Effects 0.000 description 1
- 238000002922 simulated annealing Methods 0.000 description 1
- 150000003384 small molecules Chemical class 0.000 description 1
- 239000007787 solid Substances 0.000 description 1
- 238000013179 statistical model Methods 0.000 description 1
- 238000000528 statistical test Methods 0.000 description 1
- 238000001356 surgical procedure Methods 0.000 description 1
- 208000037369 susceptibility to malaria Diseases 0.000 description 1
- 208000024891 symptom Diseases 0.000 description 1
- 230000009897 systematic effect Effects 0.000 description 1
- YLJREFDVOIBQDA-UHFFFAOYSA-N tacrine Chemical compound C1=CC=C2C(N)=C(CCCC3)C3=NC2=C1 YLJREFDVOIBQDA-UHFFFAOYSA-N 0.000 description 1
- 229960001685 tacrine Drugs 0.000 description 1
- 230000004797 therapeutic response Effects 0.000 description 1
- 231100000041 toxicology testing Toxicity 0.000 description 1
- 238000013518 transcription Methods 0.000 description 1
- 230000035897 transcription Effects 0.000 description 1
- 230000002103 transcriptional effect Effects 0.000 description 1
- 238000012384 transportation and delivery Methods 0.000 description 1
- 201000008827 tuberculosis Diseases 0.000 description 1
- 238000010200 validation analysis Methods 0.000 description 1
- XLYOFNOQVPJJNP-UHFFFAOYSA-N water Substances O XLYOFNOQVPJJNP-UHFFFAOYSA-N 0.000 description 1
Images


Classifications
-
- G—PHYSICS
- G16—INFORMATION AND COMMUNICATION TECHNOLOGY [ICT] SPECIALLY ADAPTED FOR SPECIFIC APPLICATION FIELDS
- G16B—BIOINFORMATICS, i.e. INFORMATION AND COMMUNICATION TECHNOLOGY [ICT] SPECIALLY ADAPTED FOR GENETIC OR PROTEIN-RELATED DATA PROCESSING IN COMPUTATIONAL MOLECULAR BIOLOGY
- G16B20/00—ICT specially adapted for functional genomics or proteomics, e.g. genotype-phenotype associations
- G16B20/20—Allele or variant detection, e.g. single nucleotide polymorphism [SNP] detection
-
- G—PHYSICS
- G16—INFORMATION AND COMMUNICATION TECHNOLOGY [ICT] SPECIALLY ADAPTED FOR SPECIFIC APPLICATION FIELDS
- G16B—BIOINFORMATICS, i.e. INFORMATION AND COMMUNICATION TECHNOLOGY [ICT] SPECIALLY ADAPTED FOR GENETIC OR PROTEIN-RELATED DATA PROCESSING IN COMPUTATIONAL MOLECULAR BIOLOGY
- G16B20/00—ICT specially adapted for functional genomics or proteomics, e.g. genotype-phenotype associations
- G16B20/40—Population genetics; Linkage disequilibrium
-
- G—PHYSICS
- G16—INFORMATION AND COMMUNICATION TECHNOLOGY [ICT] SPECIALLY ADAPTED FOR SPECIFIC APPLICATION FIELDS
- G16B—BIOINFORMATICS, i.e. INFORMATION AND COMMUNICATION TECHNOLOGY [ICT] SPECIALLY ADAPTED FOR GENETIC OR PROTEIN-RELATED DATA PROCESSING IN COMPUTATIONAL MOLECULAR BIOLOGY
- G16B30/00—ICT specially adapted for sequence analysis involving nucleotides or amino acids
- G16B30/20—Sequence assembly
-
- G—PHYSICS
- G16—INFORMATION AND COMMUNICATION TECHNOLOGY [ICT] SPECIALLY ADAPTED FOR SPECIFIC APPLICATION FIELDS
- G16B—BIOINFORMATICS, i.e. INFORMATION AND COMMUNICATION TECHNOLOGY [ICT] SPECIALLY ADAPTED FOR GENETIC OR PROTEIN-RELATED DATA PROCESSING IN COMPUTATIONAL MOLECULAR BIOLOGY
- G16B40/00—ICT specially adapted for biostatistics; ICT specially adapted for bioinformatics-related machine learning or data mining, e.g. knowledge discovery or pattern finding
-
- G—PHYSICS
- G16—INFORMATION AND COMMUNICATION TECHNOLOGY [ICT] SPECIALLY ADAPTED FOR SPECIFIC APPLICATION FIELDS
- G16B—BIOINFORMATICS, i.e. INFORMATION AND COMMUNICATION TECHNOLOGY [ICT] SPECIALLY ADAPTED FOR GENETIC OR PROTEIN-RELATED DATA PROCESSING IN COMPUTATIONAL MOLECULAR BIOLOGY
- G16B50/00—ICT programming tools or database systems specially adapted for bioinformatics
-
- G—PHYSICS
- G16—INFORMATION AND COMMUNICATION TECHNOLOGY [ICT] SPECIALLY ADAPTED FOR SPECIFIC APPLICATION FIELDS
- G16B—BIOINFORMATICS, i.e. INFORMATION AND COMMUNICATION TECHNOLOGY [ICT] SPECIALLY ADAPTED FOR GENETIC OR PROTEIN-RELATED DATA PROCESSING IN COMPUTATIONAL MOLECULAR BIOLOGY
- G16B10/00—ICT specially adapted for evolutionary bioinformatics, e.g. phylogenetic tree construction or analysis
-
- G—PHYSICS
- G16—INFORMATION AND COMMUNICATION TECHNOLOGY [ICT] SPECIALLY ADAPTED FOR SPECIFIC APPLICATION FIELDS
- G16B—BIOINFORMATICS, i.e. INFORMATION AND COMMUNICATION TECHNOLOGY [ICT] SPECIALLY ADAPTED FOR GENETIC OR PROTEIN-RELATED DATA PROCESSING IN COMPUTATIONAL MOLECULAR BIOLOGY
- G16B30/00—ICT specially adapted for sequence analysis involving nucleotides or amino acids
-
- G—PHYSICS
- G16—INFORMATION AND COMMUNICATION TECHNOLOGY [ICT] SPECIALLY ADAPTED FOR SPECIFIC APPLICATION FIELDS
- G16B—BIOINFORMATICS, i.e. INFORMATION AND COMMUNICATION TECHNOLOGY [ICT] SPECIALLY ADAPTED FOR GENETIC OR PROTEIN-RELATED DATA PROCESSING IN COMPUTATIONAL MOLECULAR BIOLOGY
- G16B45/00—ICT specially adapted for bioinformatics-related data visualisation, e.g. displaying of maps or networks
-
- Y—GENERAL TAGGING OF NEW TECHNOLOGICAL DEVELOPMENTS; GENERAL TAGGING OF CROSS-SECTIONAL TECHNOLOGIES SPANNING OVER SEVERAL SECTIONS OF THE IPC; TECHNICAL SUBJECTS COVERED BY FORMER USPC CROSS-REFERENCE ART COLLECTIONS [XRACs] AND DIGESTS
- Y02—TECHNOLOGIES OR APPLICATIONS FOR MITIGATION OR ADAPTATION AGAINST CLIMATE CHANGE
- Y02A—TECHNOLOGIES FOR ADAPTATION TO CLIMATE CHANGE
- Y02A90/00—Technologies having an indirect contribution to adaptation to climate change
- Y02A90/10—Information and communication technologies [ICT] supporting adaptation to climate change, e.g. for weather forecasting or climate simulation
Definitions
- the invention relates to the field of genomics, and genetics, including genome analysis and the study of DNA variation.
- the invention relates to the fields of pharmacogenetics and pharmacogenenomics and the use of genetic haplotype information to predict an individual's susceptibility to disease and/or their response to a particular drug or drugs, so that drugs tailored to genetic differences of population groups may be developed and/or administered to the appropriate population.
- the invention also relates to tools to analyze DNA, catalog variations in DNA, study gene function and link variations in DNA to an individual's susceptibility to a particular disease and/or response to a particular drug or drugs.
- the invention may also be used to link variations in DNA to personal identity and racial or ethnic background.
- the invention also relates to the use of haplotype information in the veterinary and agricultural fields.
- cytochrome P450 family of enzymes (of which CYP 2D6 is a member) is involved in the metabolism of at least 20 percent of all commonly prescribed drugs, including the antidepressant Prozac TM, the painkiller codeine, and high-blood-pressure medications such as captopril. Ethnic variation is also seen in this instance. Due to genetic differences in cytochrome P450, for example, 6 to 10 percent of Whites, 5 percent of Blacks, and less than 1 percent of Asians are poor drug metabolizers.
- Another gene encodes a liver enzyme that causes side effects in some patients who used SeldaneTM, an allergy drug which was removed from the market.
- the drug SeldaneTM is dangerous to people with liver disease, on antibiotics, or who are using the antifungal drug Nizoral.
- the major problem with SeldaneTM is that it can cause serious, potentially fatal, heart rhythm disturbances when more than the recommended dose is taken.
- the real danger is that it can interact with certain other drugs to cause this problem at usual doses. It was discovered that people with a particular version of a CYP450 suffered serious side effects when they took SeldaneTM with the antibiotic erythromycin.
- G6PD glucose-6 -phosphate dehydrogenase
- Variations in certain genes can also determine whether a drug treats a disease effectively.
- a cholesterol-lowering drug called pravastatin won't help people with high blood cholesterol if they have a common gene variant for an enzyme called cholesteryl ester transfer protein (CETP).
- CETP cholesteryl ester transfer protein
- APOE4 cholesteryl ester transfer protein
- tacrine a poor response to an Alzheimer's drug called tacrine.
- the drug Herceptin TM a treatment for metastatic breast cancer, only works for patients whose tumors overproduce a certain protein, called HER2. A screening test is given to all potential patients to weed out those on whom the drug won't be effective.
- SNPs Single Nucleotide Polymorphisms
- a number of instances are known (Sickle Cell Anemia is a prototypical example) for which the nucleotide at a SNP is correlated with an individual's propensity to develop a disease.
- SNPs are linked to the causative gene, but are not themselves causative. These are often called surrogate markers for the disease.
- the SNP/surrogate marker approach suffers from at least three problems:
- a relatively low density SNP based map of the genome will have little likelihood of specifically identifying drug target variations that will allow for distinguishing responders from poor responders, non-responders, or those likely to suffer side-effects (or toxicity) to drugs.
- a relatively low density SNP based map of the genome also will have little likelihood of providing information for new genetically based drug design.
- knowing all the polymorphisms in the haplotypes will provide a firm basis for pursuing pharmacogenetics of a drug or class of drugs.
- the present invention by knowing which forms of the proteins an individual possesses, in particular, by knowing that individual's haplotypes (which are the most detailed description of their genetic makeup for the genes of interest) for rationally chosen drug target genes, or genes intimately involved with the pathway of interest, and by knowing the typical response for people with those haplotypes, one can with confidence predict how that individual will respond to a drug. Doing this has the practical benefit that the best available drug and/or dose for a patient can be prescribed immediately rather than relying on a trial and error approach to find the optimal drug. The end result is a reduction in cost to the health care system. Repeat visits to the physician's office are reduced, the prescription of needless drugs is avoided, and the number of adverse reactions is decreased.
- the Clinical Trials Solution (CTSTM) method described herein provides a process for finding correlation's between haplotypes and response to treatment and for developing protocols to test patients and predict their response to a particular treatment.
- the CTSTM method is partially embodied in the DecoGenTM Platform, which is a computer program coupled to a database used to display and analyze genetic and clinical information. It includes novel graphical and computational methods for treating haplotypes, genotypes, and clinical data in a consistent and easy-to-interpret manner.
- the basis of the present invention is the fact that the specific form of a protein and the expression pattern of that protein in a particular individual are directly and unambiguously coded for by the individual's isogenes, which can be used to determine haplotypes. These haplotypes are more informative than the typically measured genotype, which retains a level of ambiguity about which form of the proteins will be expressed in an individual. By having unambiguous information about the forms of the protein causing the response to a treatment, one has the ability to accurately predict individuals' responses to that treatment.
- Such information can be used to predict drug efficacy and toxic side effects, lower the cost and risk of clinical trials, redefine and/or expand the markets for approved compounds (i.e., existing drugs), revive abandoned drugs, and help design more effective medications by identifying haplotypes relevant to optimal therapeutic responses. Such information can also be used, e.g., to determine the correct drug dose to give a patient.
- the invention also relates to methods of making informative linkages between gene inheritance, disease susceptibility and how organisms react to drugs.
- the invention relates to methods and tools to individually design diagnostic tests, and therapeutic strategies for maintaining health, preventing disease, and improving treatment outcomes, in situations where subtle genetic differences may contribute to disease risk and response to particular therapies.
- the method and tools of the invention provide the ability to determine the frequency of each isogene, in particular, its haplotype, in the major ethno-geographic groups, as well as disease populations.
- the method and tools of the invention can be used to determine the frequency of isogenes responsible for specific desirable traits, e.g., drought tolerance and/or improved crop yields, and reduce the time and effort needed to transfer desirable traits.
- desirable traits e.g., drought tolerance and/or improved crop yields
- the invention includes methods, computer program(s) and database(s) to analyze and make use of gene haplotype information. These include methods, program, and database to find and measure the frequency of haplotypes in the general population; methods, program, and database to find correlation's between an individuals' haplotypes or genotypes and a clinical outcome; methods, program, and database to predict an individual's haplotypes from the individual's genotype for a gene; and methods, program, and database to predict an individual's clinical response to a treatment based on the individual's genotype or haplotype.
- the invention also relates to methods of constructing a haplotype database for a population, comprising:
- the invention also relates to methods of predicting the presence of a haplotype pair in an individual comprising, in order:
- the invention also relates to methods for identifying a correlation between a haplotype pair and a clinical response to a treatment comprising:
- the invention also relates to methods for identifying a correlation between a haplotype pair and susceptibility to a disease comprising the steps of:
- the invention also relates to methods of predicting response to a treatment comprising:
- the invention also provides computer systems which are programmed with program code which causes the computer to carry out many of the methods of the invention.
- a range of computer types may be employed; suitable computer systems include but are not limited to computers dedicated to the methods of the invention, and general-purpose programmable computers.
- the invention further provides computer-usable media having computer-readable program code stored thereon, for causing a computer to carry out many of the methods of the invention.
- Computer-usable media includes, but is not limited to, solid-state memory chips, magnetic tapes, or magnetic or optical disks.
- the invention also provides database structures which are adapted for use with the computers, program code, and methods of the invention.
- FIGURE System Architecture Schematic.
- FIGURE 2 Pathway/Gene Collection View. This screen shows a schematic of candidate genes from which a candidate gene may be selected to obtain further information. A menu on the left of the screen indicates some of the information about the candidate genes which may be accessed from a database.
- FIGURE 3 Gene Description View. This screen provides some of the basic information about the currently selected gene.
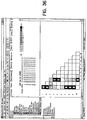
- FIGURE 4A Gene Structure View. This screen shows the location of features in the gene (such as promoter, introns, exons, etc.), the location of polymorphic sites in the gene for each haplotype and the number of times each haplotype was seen in various world population groups.
- FIGURE 4B Gene Structure View (Cont.). This screen shows a screen which results after a gene feature is selected in the screen of FIGURE 4A. An expanded view of the selected gene feature is shown at the bottom of the screen.
- FIGURE 5 Sequence Alignment View. This screen shows an alignment of the full DNA sequences for all the haplotypes (i.e., the isogenes) which appears in a separate window when one of the features in FIGURE 4A or 4B is selected. The polymorphic positions are highlighted.
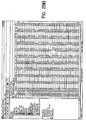
- FIGURE 6 mRNA Structure View. This screen shows the secondary structure of the RNA transcript for each isogene of the selected gene.
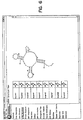
- FIGURE 7 Protein Structure View. This screen shows important motifs in the protein. The location of polymorphic sites in the protein is indicated by triangles. Selecting a triangle brings up information about the selected polymorphism at the top of the screen.
- FIGURE 8 Population View. This screen shows information about each of the members of the population being analyzed. PID is a unique identifier.
- FIGURE 10 Haplotype Frequencies (Summary View). This screen shows a summary of ethnic distribution as a function of haplotypes.
- FIGURE 11 Haplotype Frequencies (Detailed View). This screen shows details of ethnic distribution as a function of haplotype. Numerical data is provided.
- FIGURE 12 Polymorphic Position Linkage View. This screen shows linkage between polymorphic sites in the population.
- FIGURE 13 Genotype Analysis View (Summary View). This screen shows haplotyping identification reliability using genotyping at selected positions.
- FIGURE 14 Genotype Analysis View (Detailed View). This screen gives a number value for the graphical data presented in FIGURE 13.
- FIGURE 15 Genotype Analysis View (Optimization View). This screen gives the results of a simple optimization approach to finding the simplest genotyping approach for predicting an individual's haplotypes.
- FIGURES 16 and 17. Haplotype Phylogenetic Views. These screens show minimal spanning networks for the haplotypes seen in the population.
- FIGURE 18 Clinical Measurements vs. Haplotype View (Summary). This screen shows a matrix summarizing the correlation between clinical measurements and haplotypes.
- FIGURE 19 Clinical Measurements vs. Haplotype View (Distribution View). This screen shows the distribution of the patients in each cell of the matrix of FIGURE 18.
- FIGURE 20 Expanded view of one haplotype-pair distribution. This screen results when a user selects a cell in the matrix in FIGURE 19. The screen shows the number of patients in the various response bins indicated on the horizontal axis.
- FIGURE 21 Linear Regression Analysis View. This screen shows the results of a dose-response linear regression calculation on each of the individual polymorphisms
- FIGURE 22 Clinical Measurements vs. Haplotype View (Details). This screen gives the mean and standard deviation for each of the cells in FIGURE 18.
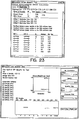
- FIGURE 23 Clinical Measurement ANOVA calculation. This screen shows the statistical significance between haplotype pair groups and clinical response.
- FIGURE 24 Interface to the DecoGen CTS Modeler.
- a genetic algorithm As described in the text, a genetic algorithm (GA) is used to find an optimal set of weights to fit a function of the subject haplotype data to the clinical response.
- the controls at the right of the page are used to set the number of GA generations, the size of the population of "agents" that coevolve during the GA simulation, and the GA mutation and crossover rates.
- the GA population, and population parameters with those of the real human subjects, should not be confused. These are simply terms used in the computational algorithm which is the GA.
- the GA is an error-minimizing approach, where the error is a weighted sum of differences between the predicted clinical response and that which is measured.
- the graph in the top-middle shows the residual error as a function of computational time, measured in generations.
- the bar graph at the bottom center shows the weights from Equation 6 for the best solution found so far in the GA simulation.
- FIGURE 25A Gene Repository data submodel.
- FIGURE 25B Population Repository data submodel.
- FIGURE 25C Polymorphism Repository data submodel.
- FIGURE 25D Sequence Repository data submodel.
- FIGURE 25E Assay Repository data submodel.
- FIGURE 25F Legend of symbols in FIGURES 25A-E.
- FIGURE 26 Pathway View. This screen shows a schematic of candidate genes relevant to asthma from which a candidate gene may be selected to obtain further information. This view is an alternative way of showing information similar to that described in the Pathway/Gene Collection View shown in FIGURE 2, with access to additional views, projects and other information, as well as additional tools.
- a menu on the left of the screen in FIGURE 26 indicates some of the information about the candidate genes which may be accessed from a database. The candidates genes shown are
- FIGURE 27 GeneInfo View. This screen provides some of the basic information about the currently selected ADRB2 gene. This screen is an alternative way of showing information similar to that described in the Gene Description View in FIGURE 3.
- FIGURE 28A GeneStructure View. This screen shows the location of features in the gene (such as promoter, introns, exons, etc.), the location of polymorphic sites in the gene for each haplotype and the number of times each haplotype was seen in various world population groups for the ADRB2 gene. This screen is an alternative way of showing information similar to that described in the Gene Structure View in FIGURE 4A.
- FIGURE 28B GeneStructure View (Cont). This screen shows a screen which results after a gene feature is selected in the screen of FIGURE 28A. This screen is an alternative way of showing information similar to that described in the Gene Structure View in FIGURE 4B. An expanded view of the nucleotide sequence flanking the selected polymorphic site is shown at the top of the screen. This portion of the screen provides access to some of the same information as shown in FIGURE 5 (Sequence Alignment View).
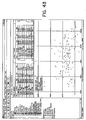
- FIGURE 29A Patient Table View/Patient Cohort View. This screen shows genotype and haplotype information about each of the members of the patient population being analyzed. Family relationships are also shown, when such information is present. Families 1333 and 1047 shown in FIGURE 29A are the families that were analyzed for this gene. In this particular screen, if other families had been analyzed, they would appear with those shown, but below, where one would scroll down. "Subject" is a unique identifier. The patients' genotypes are shown in the top right panel. At the far left of this panel (not seen until one scrolls over) are the indices for the two haplotypes that a patient has. These indices refer to the haplotype table at the bottom right.
- the left hand panel shows the haplotype Ids for families that have been analyzed as part of a cohort.
- the haplotypes must follow Mendelian inheritance pattern, i.e., one copy form his mother and one from his father. For instance if an individual's mother had haplotypes 1 and 2 and his father had haplotypes 3 and 4, then that individual must have one of the following pairs: (1,3), (1,4), (2,3) or (2,4). This panel is used to check the accuracy of the haplotype determination method used.
- FIGURE 29B Clinical Trial Data View. This screen shows gives the values of all of the clinical measurements for each individual in FIGURE 29A.
- FIGURE 30 HAPSNP View. This screen shows the genotype to haplotype resolution of the ADRB2 gene for each of the individuals in the population being examined. This view provides similar information as that shown in the SNP Distribution View of FIGURE 9.
- FIGURE 31 HAPPair View. This screen shows a summary of ethnic distribution of haplotypes of the ADRB2 gene. This view is an alternative way of showing information similar to that shown in the Haplotype Frequencies (Summary View) of FIGURE 10.
- the "V/D" (i.e., View Details) button in this view allows the user to toggle between the views shown in FIGURES 31 and 32.
- FIGURE 32 HAP Pair View (HAP Pair Frequency View). This screen shows details of ethnic distribution as a function of haplotypes of the ADRB2 gene. Numerical data is provided. This view is an alternative way of showing information similar to that shown in the Haplotype Frequencies (Detailed View) of FIGURE 11 for the CPY2D6 gene.
- the V/D button has the same function as in FIGURE 31.
- FIGURE 33 Linkage View. This screen shows linkage between polymorphic sites in the population for the ADRB2 gene. This view is an alternative way of showing information similar to that shown in FIGURE 12 for the CPY2D6 gene.
- FIGURE 34 HAPTyping View.
- This screen shows the reliability of haplotyping identification using genotyping at selected positions for the ADRB2 gene.
- This view is an alternative way of showing information similar to that shown in the Genotype Analysis Views of FIGURES 13, 14 and 15 for the CPY2D6 gene.
- This view is the interface to the automated method for determining the minimal number of SNPs that must be examined in order to determine the haplotypes for a population. See “Step 6", Section D(1) and Example 2, herein, for details of this method.
- the view shows all pairs of haplotypes and their corresponding genotypes and finally the frequency of the genotype.
- the inset (which one sees by scrolling to the right) shows the best scoring set of SNPs to score, along with a quality score (scores ⁇ 1) are acceptable.
- the pairs of numbers in brackets are the genotypes that are still indistinguishable given this SNP set.
- “Population” in the box in the top of the figure is equivalent to the "Subset” selection menu described above. Populations and subsets are the same. One subset is the total analyzed population.
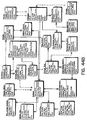
- FIGURE 35 Phylogenetic View. These screens show minimal spanning networks for the haplotypes seen in the population for the ADRB2 gene. This view is an alternative way of showing information similar to that shown in FIGURES 16 and 17 for the CPY2D6 gene. This view also provides a window containing haplotype and ethnic distribution information. The numbers next to the balls represent the haplotype number and the numbers inside the parentheses represent the number of people in the analyzed population that have that haplotype. The function of the calculator button (or a red/green flag button, not shown in this view) is the same as recalculate in FIGURES 16 and 17. In this case it arranges nodes according to evolutionary distance.
- FIGURE 36 Clinical Haplotype Correlations View (Summary). This screen shows a matrix summarizing the correlation between clinical measurements and haplotypes for the ADRB2 gene. This view is an alternative way of showing information similar to that shown in FIGURE 18 for the CPY2D6 gene.
- FIGURE 37 Clinical Measurements vs. Haplotype View (Distribution View). This screen shows the distribution of the patients in each cell of the matrix of FIGURE 36. This view is an alternative way of showing information similar to that shown in FIGURE 19 for the CPY2D6 gene. Drop-down menus and buttons are as described for FIGURE 36.
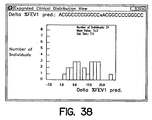
- FIGURE 38 Expanded Clinical Distribution View.
- This screen shows an expanded view of one haplotype-pair distribution. This screen results when a user selects a cell in the matrix in FIGURE 37. The screen shows the number of patients in the various response bins indicated on the horizontal axis.
- This view is an alternative way of showing information similar to that shown in FIGURE 20 for the CPY2D6 gene, and also displays additional information.
- FIGURE 39A DecoGen Single Gene Statistics Calculator (Linear Regression Analysis View). This screen shows the results of a dose-response linear regression calculation on each of the shown individual polymorphisms or subhaplotypes with respect to the clinical measure "Delta % FEV1 pred.” The SNPs and subhaplotypes shown are those selected as significant in the build-up procedure described below.
- This view is an alternative way of showing information similar to that shown in FIGURE 21 for the CPY2D6 gene and the "test" measurement, with additional information.
- the numbers in the boxes next to "Confidence" and "Fixed Site” in FIGURE 39A are default values for these parameters, but can be changed by the user.
- FIGURE 39B Regression for Delta %FEV1 Pred. View. This view shows the regression line response as a function of number of copies of haplotype **A*****A*G**.
- FIGURE 40 Clinical Measurements vs. Haplotype View (Details). This screen gives the mean and standard deviation for each of the cells in FIGURE 36. This view is an alternative way of showing some of the information similar to that shown in FIGURE 22 for the CPY2D6 gene and the "test" measurement.
- FIGURE 41 Clinical Measurement ANOVA calculation. This screen shows the statistical significance between haplotype pair groups and clinical response for the Hap pairs for the ADRB2 gene. This view is an alternative way of showing some of the information similar to that shown in FIGURE 23 for the CPY2D6 gene and the "test" measurement.
- FIGURE 42 Cinical Variables View. This figure simply shows histogram distributions for each of the clinical variables. This is the same as Figure 38, but not selected by haplotype pair. A clinical measurement is chosen by selecting one of the lines in the top list.
- FIGURE 43 Clinical Correlations View. This view allows one to see the correlation between any pair of clinical measurements. The user selects one measurement from the list on the left, which becomes the x-axis, and one from the list on the right, which becomes the y-axis. Each point on the bottom graph represents one individual in the clinical cohort.
- FIGURE 44A Genomic Repository data submodel. This is a preferred alternative model to the submodels shown in FIGURES 25A and 25D.
- FIGURE 44B Clinical Repository data submodel. This is a preferred alternative submodel to that shown in FIGURE 25B.
- FIGURE 44C Variation Repository data submodel. This is an alternative submodel to that shown in FIGURE 25C.
- FIGURE 44D Literature Repository data submodel. This incorporates some of the tables from the gene repository submodel shown in FIGURE 25A.
- FIGURE 44E Drug Repository data submodel. This is an alternative submodel to that shown in FIGURE 25E.
- FIGURE 44F Legend of symbols in FIGURES 44A-E.
- FIGURE 45 Flow Chart. This is a flow chart for a multi-SNP analysis method of associating phenotypes (such as clinical outcomes) with haplotypes (also called a "build-up" procedure).
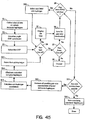
- FIGURE 46 Flow Chart. This is a flow chart for a reverse-SNP analysis method of associating phenotypes (such as clinical outcomes) with haplotypes (also called a "pare-down" procedure).
- FIGURE 47 Diagram of a process for assembling a genomic sequence by a human or a computer.
- FIGURE 48 Diagram of a process for generating and displaying a gene structure.
- FIGURE 49 Diagram of a process of generating and displaying a protein structure.
- the present invention may be implemented with a computer, an example of which is shown in FIGURE 1A.
- the computer includes a central processing unit (CPU) connected by a system bus or other connecting means to a communication interface, system memory (RAM), non-volatile memory (ROM), and one or more other storage devices such as a hard disk drive, a diskette drive, and a CD ROM drive.
- the computer may also include an internal or external modem (not shown).
- the computer also includes a display device, such as a CRT monitor or an LCD display, and an input device, such as a keyboard, mouse, pen, touch-screen, or voice activation system.
- the computer stores and executes various programs such as an operating system and application programs.
- the computer may be embodied, for example, as a personal computer, work station, laptop, mainframe, or a personal digital assistant.
- the computer may also be embodied as a distributed multi-processor system or as a networked system such as a LAN having a server and client terminals.
- the present invention uses a program, referred to as the "DecoGenTM application", that generates views (or screens) displayed on a display device and which the user can interact with to accomplish a variety of tasks and analyses.
- the DecoGenTM application may allow users to view and analyze large amounts of information such as gene-related data (e.g., gene loci, gene structure, gene family), population data (e.g., ethnic, geographical, and haplotype data for various populations), polymorphism data, genetic sequence data, and assay data.
- the DecoGenTM application is preferably written in the Java programming language. However, the application may be written using any conventional visual programming language such as C, C++, Visual Basic or Visual Pascal.
- the DecoGenTM application may be stored and executed on the computer. It may also be stored and executed in a distributed manner.
- the data processed by the DecoGenTM application is preferably stored as part of a relational database (e.g., an instance of an Oracle database or a set of ASCII flat files).
- This data can be stored on, for example, a CD ROM or on one or more storage devices accessible by the computer.
- the data may be stored on one or more databases in communication with the computer via a network.
- the data will be delivered to the user on any standard media (e.g., CD, floppy disk, tape) or can be downloaded over the internet.
- the DecoGenTM application and data may also be installed on a local machine. The DecoGenTM application and data will then be on the machine that the user directly accesses. Data can be transmitted in the form of signals.
- FIGURE 1B shows an implementation where a network interconnects one or more host computers with one or more user terminals.
- the communication network may, for example, include one or more local area networks (LANs), metropolitan area networks (MANs), wide area networks (WANs), or a collection of interconnected networks such as the Internet.
- the network may be wired, wireless, or some combination thereof.
- the host computer may, for example, be a world wide web server ("web server").
- the user terminal may, for example, be a client device such as a computer as shown in FIGURE 1A.
- a web server stores information documents called pages.
- a server process listens for incoming connections from clients (e.g., browsers running on a client device). When a connection is established, the client sends a request and the server sends a reply. The request typically identifies a page by its Uniform Resource Locator (URL) and the reply includes the requested page.
- This client-server protocol is typically performed using the hypertext transfer protocol ("http"). Pages are viewed using a browser program. They are written in a language called hypertext markup language ("html"). A typical page includes text and formatting comments called tags. Pages may also include links (pointers) to other pages. Strings of text or images that are links to other pages are called hyperlinks.
- Hyperlinks are highlighted (e.g., by shading, color, underlining) and may be invoked by placing the cursor on the highlighted area and selecting it (e.g., by clicking the mouse button).
- a page may also contain a URL reference to a portion of multimedia data such as an image, video segment, or audio file. Pages may also point to a Java program called an applet. When the browser connects to where the applet is stored, the applet is downloaded to the client device and executed there in a secure manner. Pages may also contain forms that prompt a user to enter information or that have active maps. Data entered by a user may be handled by common gateway interface (CGI) programs. Such programs may, for example, provide web users with access to one or more databases.
- CGI common gateway interface
- the host computer may include a CPU connected by a system bus or other connecting means to a communication interface, system memory (RAM), nonvolatile (ROM), and a mass storage device.
- the mass storage device may, for example, be a collection of magnetic disk drives in a RAID system.
- the mass storage device may, for example, store the aforementioned web pages, applets, and the like.
- the host computer may also include an input device, such as a keyboard, and a display device to allow for control and management by an administrator. Additionally, the host computer may be connected to additional devices such as printers, auxiliary monitors or other input/output devices.
- the input device and display device may also be provided on another computer coupled to the host computer.
- the host computer may be embodied, for example, as one or more mainframes, workstations, personal computers, or other specialized hardware platforms.
- the functionality of the host computer may be centralized or may be implemented as a distributed system.
- the host computer may communicate with one or more databases stored on any of a variety of hardware platforms.
- the DecoGenTM application will be web-based and will be delivered as an applet that runs in a web browser.
- the data will reside on a server machine and will be delivered to the DecoGen application using a standard protocol (e.g., HTTP with cgi-bin).
- a standard protocol e.g., HTTP with cgi-bin.
- the network connection could use a dedicated line.
- the network connection could use a secure protocol such as Secure Socket Layer (SSL) which only provides access to the server from a specified set of IP addresses.
- SSL Secure Socket Layer
- the DecoGenTM application can be installed on a user machine and the data can reside on a separate server machine. Communication between the two machines can be handled using standard client-server technology. An example would be to use TCP/IP protocol to communicate between the client and an oracle server.
- DecoGenTM application could be directly imported into the DecoGenTM application by the user. This import could be carried out by reading files residing on the user's local machine, or by cutting and pasting from a user document into the interface of the DecoGenTM application.
- some or all of the data or the results of analyses of the data could be exported from the DecoGenTM application to the user's local computer. This export could be carried out by saving a file to the local disk or by cutting and pasting to a user document.
- the CTSTM embodiment of present invention preferably includes the following steps:
- a candidate gene or genes (or other loci) for the disease/condition is determined.
- candidate gene(s) are a subset of all genes (or other loci) that have a high probability of being associated with the disease of interest, or are known or suspected of interacting with the drug being investigated. Interacting can mean binding to the drug during its normal route of action, binding to the drug or one of its metabolic products in a secondary pathway, or modifying the drug in a metabolic process.
- Candidate genes can also code for proteins that are never in direct contact with the drug, but whose environment is affected by the presence of the drug.
- candidate gene(s) (or other loci) may be those associated with some other trait, e.g., a desirable phenotypic trait.
- Such gene(s) may be, e.g., obtained from a human, plant, animal or other eukaryote.
- Candidate genes are identified by references to the literature or to databases, or by performing direct experiments. Such experiments include (1) measuring expression differences that result from treating model organisms, tissue cultures, or people with the drug; or (2) performing protein-protein binding experiments (e.g., antibody binding assays, yeast 2 hybrid assays, phage display assays) using known candidate proteins to identify interacting proteins whose corresponding nucleotide (genomic or cDNA) sequence can be determined.
- This information includes, for example, the gene name, genomic DNA sequence, intron-exon boundaries, protein sequence and structure, expression profiles, interacting proteins, protein function, and known polymorphisms in the coding and non-coding regions, to the extent known or of interest.
- This information can come from public sources (e.g. GenBank, OMIM (Online Inheritance of Man - a database of polymorphisms linked to inherited diseases), etc.)
- GenBank GenBank
- OMIM Online Inheritance of Man - a database of polymorphisms linked to inherited diseases
- a person may use a user terminal to view a screen which allows the user to see all of the candidate genes associated with the disease project and to bring up further information.
- This screen (as well as all the other screens described herein) may, for example, be presented as a web page, or a series of web pages, from a web server. This web based use may involve a dedicated phone line, if desired. Alternatively, this screen may be served over the network from a non-web based server or may simply be generated within the user terminal.
- An example of such a screen referred to herein as a "Pathways" or "Gene Collection” screen is illustrated in FIGURE 2.
- FIGURE 2 is an example of a screen showing the set of candidate genes whose polymorphisms potentially contribute to the response to a drug or to some other phenotype.
- the screen shows genes for which data is currently available in a database useful in the invention in green; those queued for processing (and for which data will appear in a database) would appear in one shade or color, e.g., yellow, and related but unqueued genes (those for which there is currently no plan to deposit data in a database) would appear in another shade or color, e.g., white.
- Drugs typically ones that interact with one or more of the genes of interest
- the user can select a gene to examine in detail by using the mouse (or other user-input device such as keyboard, roller ball, voice recognition, etc.) to select the corresponding icon.
- the mouse or other user-input device such as keyboard, roller ball, voice recognition, etc.
- CYP2D6 a cytochrome P 450 enzyme, is selected, as indicated by the extra black box around the CYP2D6 icon.
- a menu that allows the user to navigate through different screens of the data.
- a preferred embodiment of the present invention relates to situations in which patients have differential responses to the drug because they possess different forms of one or more of the candidate genes (or other loci).
- different forms of the candidate gene(s) mean that the patients have different genomic DNA sequences in the gene locus).
- the method does not rely on these differences being manifested in altered amino acids in any of the proteins expressed by any candidate gene(s) (e.g., it includes polymorphisms that may affect the efficiency of expression or splicing of the corresponding mRNA). All that is required is that there is a correlation between having a particular form(s) of one or more of the genes and a phenotypic trait (e.g. response to a drug). Examples of salient information about the candidate genes is given in FIGURES 3-8.
- FIGURE 3 is an example of a screen showing basic information about the currently selected gene such as its name, definition, function, organism, and length. These pieces of information typically come from GenBank or other public data sources. The figure will typically also show the number of "gene features" (e.g. exons, introns, promoters, 3' untranslated regions, 5' untranslated regions, etc.) in the database, the size of the analyzed population (group of people whose DNA has been examined for this gene), the number of haplotypes found for this gene in this population, and some measures of polymorphism frequency.
- the information is stored in a database such as the one described herein, or calculated from information stored in such a database. Most of the information shown in later figures is specific to this analyzed population.
- Theta and Pi are standard measures of polymorphism frequency, described in Ref. 1., Chapter 2.
- FIGURE 4A and 4B are examples of screens showing the genomic structure of the gene (generally showing the location of features of the gene, such as promoters, exons, introns, 5' and 3' untranslated regions), as well as haplotype information.
- the top view shows the nucleotides at the polymorphic sites, i.e., the haplotypes.
- the middle cartoon shows the features of the gene.
- the promoter is indicated by a dark shaded (or red) rectangular box and a line with an arrow, exons are shown by a gray shaded (or blue) rectangular box and introns are shown in white (or in yellow).
- the code in parenthesis (M22245) is the GenBank accession number for the selected feature.
- FIGURE 4B is the same screen as FIGURE 4A, after the user selects the gene feature.
- FIGURE 5 is an example of a screen showing the actual DNA sequence of the genomic locus for the different haplotypes seen in the population (i.e., the sequence of the isogenes). This view appears in a separate window when one of the features in the Gene Structure Screen (FIGURE 4A or 4B) is selected with the mouse or other input device. This shows an alignment between the full DNA sequences for all of the isogenes of the CYP2D6 gene in the database. The polymorphic positions are highlighted.
- FIGURE 6 is an example of a screen showing the predicted secondary structure of the mRNA transcript for each CYP2D6 isogene in the database.
- the secondary structure is predicted using a detailed thermodynamic model as implemented in the program RNA structure (REF. 2). This is useful because many of the polymorphisms detected do not change the amino acid composition of the resulting protein but still lie in the coding region of the gene.
- One result of such a silent mutation could be to alter the intermediate mRNA's structure in a way that could affect mRNA stability, or how (and if) the mRNA was spliced, transcribed or processed by the ribosome.
- Such a polymorphism could keep any of the protein from being expressed and from being available to carry out its functions.
- the user can see thumbnail views of the structures for all of the isogenes and can see a selected one of these structures expanded on the right hand side of the screen. Changes in this structure caused by the polymorphisms seen in the isogenes can affect the expression into protein of the gene.
- the information presented in this screen can serve as an aid to the user to detect possible effects of these polymorphisms.
- FIGURE 7 is an example of a screen showing a schematic of the structure of the protein expressed by the gene, including important domains and the sites of the coding polymorphisms.
- the user gets to this screen by selecting the "Protein Structure” link at the left hand side of the display.
- This screen shows various important motifs found in the protein, and places the polymorphic sites in the context of these motifs.
- the user can get information on each motif or polymorphism by selecting the appropriate icon for the polymorphic site.
- the result of selecting the first polymorphic site (as indicated by the red shadow behind the icon) is shown.
- the text above at the top shows the reference codon and amino acid (CCT, Pro) and the resulting altered codon and amino acid (TCT, Ser).
- the codon frequencies in parentheses are calculated by looking at 10,000 codons in a variety of human genes and calculating how often that particular codon shows up. (REF. 3).
- a reference population of healthy individuals with a broad and representative genetic background is defined.
- Analysis of the candidate gene(s) (or other loci) requires an approximate knowledge of what haplotypes exist for the candidate gene(s) (or other loci) and of their frequencies in the general population.
- a reference population is recruited, or cells from individuals of known ethnic origin are obtained from a public or private source.
- the population preferably covers the major ethnogeographic groups in the U.S., European, and Far Eastern pharmaceutical markets.
- An algorithm, such as that described below may be used to choose a minimum number of people in each population group.
- a subject blood samples are drawn, and, preferably, immortalized cell lines are produced.
- immortalized cell lines is preferred because it is anticipated that individuals will be haplotyped repeatedly, i.e., for each candidate gene (or other loci) in each disease project.
- a cell sample for a member of the population could be taken from the repository and DNA extracted therefrom. Genomic DNA or cDNA can be extracted using any of the standard methods.
- the 2 haplotypes for each of the subject's candidate gene(s) (or other loci) are determined.
- the most preferred method for haplotyping the reference population is that described in U.S. Application Serial No. 60/198,340 (inventors Stephens et al.), filed April 18, 2000, which is specifically incorporated by reference herein.
- Another, less preferred embodiment for haplotyping the reference population uses the CLASPER SystemTM technology (Ref. U.S. Patent Number 5,866,404), which is a technique for direct haplotyping.
- Other examples of the techniques for direct haplotyping include single molecule dilution (“SMD") PCR (Ref. 9) and allele-specific PCR (Ref. 10).
- SMD single molecule dilution
- Ref. 10 allele-specific PCR
- any technique for producing the haplotype information may be used.
- the information that is stored in a database includes (1) the positions of one or more, preferably two or more, most preferably all, of the sites in the gene locus (or other loci) that are variable (i.e. polymorphic) across members of the reference population and (2) the nucleotides found for each individuals' 2 haplotypes at each of the polymorphic sites. Preferably, it also includes individual identifiers and ethnicity or other phenotypic characteristics of each individual.
- the haplotypes and their frequencies are stored and displayed, preferably in the manner shown, e.g., in FIGUREs 4A and 4B.
- Haplotypes and other information about each of the members of the population being analyzed can be shown, for example, in the manner shown in FIGURE 8.
- the information shown in FIGURE 8 includes a unique identifier (PID), ethnicity, age, gender, the 2 haplotypes seen for the individual, and values of all clinical measurements available for the individual. Quantitative values of clinical measures would ordinarily be seen by scrolling to the right. However, for the subjects seen in this view, there is no clinical data. This is because this is the reference population of healthy individuals.
- the haplotype data may also be presented in the context of the entire DNA sequence. Examples of the sequences of the isogenes, with the polymorphisms highlighted, are shown in FIGURE 5.
- a genotype from an individual with haplotypes TAC and CAG would be (T/C),A,(C/G). This is consistent with the haplotypes TAC/CAG or TAG/CAC. The fact that we do not know which haplotypes gave rise to this genotype leads us to call this an "unphased genotype”. If we haplotype this individual we then determine the "phased genotype", which describes which particular nucleotides go together in the haplotypes.
- Phasing is the description of which nucleotide at one polymorphic site occurs with which nucleotides at other sites. This information is left ambiguous (i.e., unphased) in a genotyping measurement but is resolved (i.e., phased) in a haplotype measurement.
- FIGURE 9 is an example of a screen showing the genotype to haplotype resolution for each of the individuals in the population being examined.
- a shaded (or color) matrix showing the genotype information at each of the polymorphic sites for each individual (sites across the top, individuals going down the page).
- the most and least common nucleotide at each site is defined by looking at both haplotypes of all individuals in the population at that particular site.
- the nucleotide that shows up most often is called the most common nucleotide.
- the one that shows up less often is termed the least common.
- Unrelated individuals who are heterozygous at more than 1 site cannot be haplotyped without (1) using a direct molecular haplotyping method such as CLASPER SystemTM technology or (2) making use of knowledge of haplotype frequencies in the population, as described below or, preferably, as described in U.S. Application Serial No. 60/198,340 (inventors Stephens et al.), filed April 18, 2000.
- FIGURE 10 is an example of one of several screens showing information about the pair of haplotypes for the candidate gene(s) (or other loci) found in an individual.
- each cell of the matrix displays some information about the group of people who were found to have the haplotypes corresponding to the particular row and column.
- subjects can be grouped together by pairs of haplotypes or sub-haplotypes, where a sub-haplotype is made up of a subset of the total group of polymorphic sites.
- the screen in the figure shows checkboxes allowing the user to select the subset of polymorphic sites to be examined (here sites 2 and 8 are chosen).
- the + and - buttons are for zooming in and out, which increases and decreases the viewing size of the matrix.
- the "Recalculate” button causes the statistics for the groups to be recalculated after a new subset of polymorphic sites has been selected.
- the selected cell (outlined in green in this figure) displays information about subjects who are homozygous for C and G at sites 2 and 8.
- the text to the right gives summary numerical information about the subjects in that box.
- this screen shows the distribution of subjects in the different ethnogeographic groups with each of the haplotype pairs.
- FIGURE 11 is a more detailed view of the information that is available from the summary view shown in FIGURE 10.
- one row is shown for each haplotype pair found in the population being analyzed.
- Each row shows the corresponding 2 sub-haplotypes, the total number of individuals found with that sub-haplotype and the fraction of the total population represented by this number.
- the observed haplotype pair frequencies in the population in particular, the reference population are preferably corrected for finite-size samples. This is preferably done when the data is being used for predictive genotyping. If it is assumed that each of the major population groups will be in Hardy-Weinberg equilibrium, this allows one to estimate the underlying frequencies for haplotype pairs in the reference population that are not directly observed. It is necessary to have good estimates of the haplotype-pair frequencies in the reference population in order to predict subjects' haplotypes from indirect measurements that will be used in a diagnostic context ( see item 6).
- the reference population has been chosen to be representative of the population as a whole so that any haplotypes seen in a clinical population have already been seen in the reference population. Furthermore, it would be possible to determine whether certain haplotypes are enriched in the patient population relative to the reference population. This would indicate that those haplotypes are causative of or correlated with the disease state.
- Hardy-Weinberg equilibrium usually holds in a distinct ethnogeographic group unless there is significant inbreeding or there is a strong selective pressure on a gene.
- Actual observed population frequencies p Obs ( H 1 / H 2 ) and the corresponding Hardy-Weinberg predicted frequencies p H-W ( H 1 / H 2 ) are shown in FIGURE 11, discussed above.
- One of several methods to test subjects for the existence of a given pair of haplotypes in an individual can be used. These methods can include finding surrogate physical exam measurements that are found to correlate with haplotype pair; serum measurements (e.g., protein tests, antibody tests, and small molecule tests) that correlate with haplotype pair; or DNA-based tests that correlate with haplotype pair.
- An example that is used herein is to predict haplotype pair based on an (unphased) genotype at one or more of the polymorphic sites using an algorithm such as the one described further below.
- the genotyping information would only provide the information that the subject is heterozygous T/G at site 1, homozygous A at site 2 and heterozygous C/T at site 3.
- This genotype is consistent with the following haplotype pairs: TAC/GAT (the correct one) and GAC/TAT (the incorrect one).
- TAC/GAT the correct one
- GAC/TAT the incorrect one
- subjects may be randomly assigned to the first group with a probability p/(p+q) and to the second group with a probability q/(p+q).
- the ability to use genotypes to predict haplotypes is based on the concept of linkage. Two sites in a gene are linked if the nucleotide found at the first site tends to be correlated with the nucleotide found at the second site. Linkage calculations start with the linkage matrix, which gives the probabilities of finding the different combinations of nucleotides at the two sites. For instance, the following matrix connects 2 sites, one of which can have nucleotide A or T and the other of which can have nucleotide G or C. The fraction of individuals in the population with A at site 1 and G at site 2 is 0.15. A T G 0.15 0.40 C 0.40 0.05
- the matrix is given by Site 1- Allele 1 Site 1 - Allele 2 Site 2 - Allele 1 p 11 p 12 p 1+ Site 2 - Allele 2 p 21 p 22 p 2+ p +1 p +2
- FIGURE 12 is an example of a screen showing a measure of the linkage between different polymorphic sites in the gene. Measures of linkage tell how well we can predict the nucleotide at one polymorphic site given the nucleotide at another site. A high value of the linkage measure indicates a high level of predictive ability.
- This screen shows D'. The color of the square in the display at the intersection of site ⁇ and ⁇ indicates the value of the linkage measure. Red indicates strong linkage and blue indicates weak to non-existent linkage. White squares in a row indicate that the corresponding polymorphic site has no variation in the population being examined. Such sites are included because there is information about the presence of polymorphisms other than that provided by our haplotype analysis.
- I HAP is a measure of the information content of the single site and is given by where N HAP is the number of distinct haplotypes observed, P ( j ) is the probability of finding haplotype j , and P ( j
- i ) is the probability of finding haplotype j in the subset of all observations where nucleotide i is seen.
- High values of I HAP ( ⁇ 2.0) indicate that at least some pairs of observed haplotypes can be distinguished by looking at that single site.
- Small values (1.0) indicate that the particular site is not informative for distinguishing any pair of haplotypes. This same method can be used for subhaplotypes. These values are useful for choosing sites for genotyping, as described above.
- the + and - boxes are for zooming in and out.
- FIGURE 13, 14, and 15 show views of a tool for performing an analysis of which polymorphic sites may be genotyped in order to determine an individual's haplotypes by the method of predictive haplotyping, rather than using more expensive direct haplotyping methods, such as the CLASPER-SystemTM method of haplotyping.
- these screens one chooses a subset of polymorphic sites of interest (the entire haplotype or a sub-haplotype can be examined) and then a subset of sites at which the subject is to be genotyped.
- the colors in the haplotype-pair boxes then indicate the fraction of individuals in that box who are correctly haplotyped based on the statistical model described in the previous paragraph.
- FIGURE 14 gives the predicted values
- FIGURE 15 shows a tool for directly finding the optimal set of genotyping sites.
- the purpose of the three screens in FIGURE 13, 14 and 15 is to provide an example of the tools to find the simplest genotyping experiment that could detect an individual's haplotypes.
- the basic layout of the screen in FIGURE 13 is the same as described in FIGURE 10.
- the top row of checkboxes is used to the haplotype or subhaplotype which is desired to be determined.
- This second row, labeled "Genotype Loci” allows the user to select a subset of positions at which to genotype.
- the color of the square in the matrix indicates the fraction of individuals who are actually in that category who would be correctly categorized using this sub-genotype.
- this screen shows that individuals homozygous for TGG at positions 2, 3, and 8 would be correctly haplotyped by genotyping at positions 2 and 8.
- Selection of optimal genotyping sites is aided by information from the Linkage View (FIGURE 12). Typically one will only need to genotype one site of a pair of polymorphic sites that are in strong linkage.
- the screen in FIGURE 14 gives a numerical view of the data show in FIGURE 13.
- FIGURE 15 is an example of a screen showing the results of a tool for directly finding the optimal genotyping sites.
- This screen gives the results of a simple optimization approach to finding the simplest genotyping approach for predicting an individual's haplotypes. For each haplotype pair, the predictive abilities of all single site genotyping experiments are calculated. If any of these has a predictive ability of greater than some cutoff (say 90%), then that single-site genotype test is shown.
- a single-site genotype test is one in which an individual's nucleotide(s) is found at that single site. This can be done using any of several standard methods including DNA sequencing, single-base extension, allele-specific PCR, or TOF-mass spec.
- FIGUREs 16 and 17 are examples of screens demonstrating another tool for analyzing linkage.
- This tool is a minimal spanning network which shows the relatedness of the haplotypes seen in the population (Ref. 8).
- Haplotypes are amenable to modes of analysis that are not available for isolated variants (e.g., SNPs).
- a sample of haplotypes reflects the actual phylogenetic history of the genetic locus. This history includes the divergence patterns among the haplotypes, the order of mutational and recombinational events, and a better understanding of the actual variation among the different populations comprising the sample.
- the phylogenetic algorithms included in the DecoGenTM application are both exploratory and analytical tools, in that they allow consideration of partial haplotypes as well as those based on the full set of haplotypes in the context of clinical data.
- the checkboxes and recalculate button shown in FIGURES 16 and 17 serve the purpose of selecting sub-haplotypes as described under FIGURE 10.
- the results of the calculations are shown in real time, i.e., the sizes and positions of the balls, as well as the length of the lines, change as the calculation progresses.
- a circle represents a haplotype.
- the distance between haplotypes is a rough measure of the number of nucleotides that would have to be flipped to change one haplotype into the other. Pairs of haplotypes separated by one nucleotide flip are connected with black lines. Pairs connected by 2 flips are connected with light blue lines. The size of the haplotype ball increases with the frequency of that haplotype in the population. Each haplotype or subhaplotype ball is labeled with the relevant nucleotide string. The user can toggle the labels off and on by selecting the haplotype ball, e.g., with a mouse. The + and - boxes are for zooming in and out. The "View Hap Pairs" box serve the purpose of showing the pairing information for haplotypes.
- the lines shown in this figure are replaced with lines connecting pairs of haplotypes seen in each individual.
- the colors in the balls, and the pie shaped pieces, represent the fraction of that haplotype found in the major ethnogeographic group. Red represents Caucasian, blue African-American, Light Blue Asian, Green Hispanic/Latino.
- the Minimum Size checkbox allows the user to select sub-haplotypes as in earlier Figures ( see FIGURE 10).
- This aspect of the invention relates to a graphical display of the haplotypes (including sub-haplotypes) of a gene grouped according to their evolutionary relatedness.
- "evolutionary relatedness" of two haplotypes is measured by how many nucleotides have to be flipped in one of the haplotypes to produce the other haplotype.
- the display is a minimal spanning network in which a haplotype is represented by a symbol such as a circle, square, triangle, star and the like.
- Symbols representing different haplotypes of a gene may be visually distinguished from each other by being labeled with the haplotype and/or may have different colors, different shading tones, cross-hatch patterns and the like.
- Any two haplotype symbols are separated from each other by a distance, referred to as the ideal distance, that is proportional to the evolutionary relatedness between their represented haplotypes. For example, if displaying a group of haplotypes related by one, two or three nucleotide flips, the proportional distances between the haplotype symbols could be one inch, two inches, and three inches, respectively.
- the haplotype symbols may be connected by lines, which may have different appearances, i.e., different colors, solid vs. dotted vs. dashed, and the like, to help visually distinguish between one nucleotide flip, two nucleotide flips, three nucleotide flips, etc.
- the method is implemented by a computer and the graphical display is produced by an algorithm that connects haplotype symbols by springs whose equilibrium distance is proportional to the ideal distance.
- the size of a particular haplotype symbol is proportional to the frequency of that haplotype in the population.
- the haplotype symbol may be divided into regions representing different characteristics possessed by members of the population, such as ethnicity, sex, age, or differences in a phenotype such as height, weight, drug response, disease susceptibility and the like.
- the different regions in a haplotype symbol may be represented by different colors, shading tones, stippling, etc.
- generation of the graphical display is shown in real time, i.e., the positions and sizes of haplotype symbols, as well as the lengths of their connecting springs, change as the algorithm-directed organization of the haplotypes of a particular gene proceeds.
- the resulting display provides a visual impression of the phylogenetic history of the locus, including the divergence patterns among the haplotypes for that locus, as well as providing a better understanding of the actual variation among the different populations comprising the sample. These considerations are important in the assessment of the encoded protein's involvement in a particular phenotype (e.g., differential response to a drug or adverse side effects).
- a spanning network generated for haplotypes in a clinical population using the same algorithm may be superimposed on the spanning network for the reference population to analyze whether the haplotype content of the clinical population is representative of the reference population.
- a trial population of individuals who suffer from the condition of interest is recruited.
- the end result of the CTS method is the correlation of an underlying genetic makeup (in the form of haplotype or sub-haplotype pairs for one or more genes or other loci) and a treatment outcome.
- an underlying genetic makeup in the form of haplotype or sub-haplotype pairs for one or more genes or other loci
- a treatment outcome In order to deduce this correlation it is necessary to run a clinical trial or to analyze the results of a clinical trial that has already been run. Individuals who suffer from the condition of interest are recruited. Standard methods may be used to define the patient population and to enroll subjects.
- This grading of potential patients could employ a standard physical exam or one or more lab tests. It could also use haplotyping for situations where there was a strong correlation between haplotype pair and disease susceptibility or severity.
- Correlations may be produced in several ways. In one method averages and standard deviations for the haplotype-pair groups may be calculated. This can also be done for sub-haplotype-pair groups. These can be displayed in a color coded manner with low responding groups being colored one way and high responding groups colored another way (see, e.g., FIGURE 18). Distributions in the form of bar graphs can also be displayed (see, e.g., FIGURE 19), as can all group means and standard deviations (see, e.g., FIGURE 20).
- FIGURES 18-24 may be used to determine whether haplotype information for the gene being examined can be used to predict clinical response to the treatment.
- One question that can be answered is whether there is a significant difference in response between groups of individuals with different haplotype pairs.
- FIGURES 18-22 show screens of the data that connect haplotypes with clinical outcomes. The example shown in FIGURE 18 and the next several screens gives the results of a simulated clinical trial run to test the link between patients' haplotypes for CYP2D6 and a phenotypic response called "Test".
- the main layout of this page is the same as described in FIGURE 10.
- At the left side of this view is a list of the clinical measurements performed on the patients. This list is completely generic as far as the invention is concerned.
- the color in a cell of the matrix indicates the mean value of the measurement for the individuals in that haplotype-pair group.
- text appears at the right, giving the 2 haplotypes, the number of patients in the cell, the mean value and standard deviation for individuals in the cell.
- a slide bar is present below the color boxes near the top of the screen indicating 0% to 100% so that moving, e.g., one or both of the ends of the bar will change the color scale in the color boxes at the top of the screen as well as the colors in the matrix.
- FIGURE 19 is a screen showing the distribution of the patients in each cell of the clinical measurement matrix of FIGURE 18. In this case, the histograms are collectively normalized so that the user can directly compare frequencies from one cell to the next.
- the screen in FIGURE 20 is brought up when the user selects any of the cells in the haplotype-pair matrix in FIGURE 19. This shows the number of patients in the various response bins indicated on the horizontal axis. A response bin simply counts the number of individuals whose response is within a particular interval. For instance, there are 7 individuals in the response bin from 0.2 to 0.25 in FIGURE 20.
- FIGURE 22 shows that groups having different 2/8 sub-haplotypes can have very different mean values of the Test phenotype. To see if this group-to-group variation is significant, the user could ask the DecoGenTM application to perform an ANOVA (Analysis of Variation) calculation. The results of an ANOVA calculation are shown in FIGURE 23. Selecting the ANOVA button on any of the earlier Clinical Measurements views brings up this display.
- FIGURE 23 shows that the variation between different 2/8 subhaplotype groups is statistically significant at the 99% confidence level.
- r the response
- r 0 a constant called the "intercept”
- S the slope
- d the dose.
- the most-common nucleotide at the site and the least common nucleotide are defined.
- his "dose” as the number of least-common nucleotides he has at the site of interest. This value can be 0 (homozygous for the least-common nucleotide), 1 (heterozygous), or 2 (homozygous for the most common nucleotide).
- An individual's "response” is the value of the clinical measurement. Standard linear regression methods are then used to fit all of the individuals' dose and response to a single model. The outputs of the regression calculation are the intercept r 0 , the slope S , and the variance (which measures how well the data fits this simple linear model). The Students t-test value and the level of significance can then be calculated. This figure shows the relevant variables (site, slope S, intercept r 0 , variance, Student's t-test value and level of significance) for each of the sites.
- Test 0.231 + 0.154 x (number of T's at site 2).
- an individual homozygous for C at site 2 will have a response of 0.231.
- Heterozygous individuals have an average response of 0.385, and individuals homozygous for T have an average response of 0.539, This trend is significant at the 99.9% confidence level.
- the calculation of significance is based on the assumption that the distribution of responses for individuals (such as seen in FIGURE 20) are normally distributed.
- the present invention can incorporate any of the standard methods for calculating statistical significance for non-normal distributions.
- the present invention can include more complex dose-response calculations that examine multiple sites simultaneously. See , e.g., Ref. 4.
- a second method for finding correlations uses predictive models based on error-minimizing optimization algorithms.
- One of many possible optimization algorithms is a genetic algorithm. (Ref. 5). Simulated annealing (Ref. 6, Chapter 10), neural networks (Ref. 7, Chapter 18), standard gradient descent methods (Ref. 6, Chapter 10), or other global or local optimization approaches (See discussion in Ref. 5) could also be used.
- Simulated annealing (Ref. 6, Chapter 10), neural networks (Ref. 7, Chapter 18), standard gradient descent methods (Ref. 6, Chapter 10), or other global or local optimization approaches (See discussion in Ref. 5) could also be used.
- a genetic algorithm approach is described herein. This method searches for optimal parameters or weights in linear or non-linear models connecting haplotype loci and clinical outcome.
- C is the measured clinical outcome, i goes over all polymorphic sites, ⁇ over all candidate genes, C 0 , w i , ⁇ and w' i , ⁇ are variable weight values, R i , ⁇ is equal to 1 if site i in gene ⁇ in the first haplotype takes on the most common nucleotide and -1 if it takes on the less common nucleotide.
- L i , ⁇ is the same as R i , ⁇ except for the second haplotype.
- the constant term C 0 and the weights w i , ⁇ and w ' i , ⁇ are varied by the genetic algorithm during a search process that minimizes the error between the measured value of C and the value calculated from Equation 6. Models other than the one given in Equation 6 can be easily incorporated.
- the genetic algorithm is especially suited for searching not only over the space of weights in a particular model but also over the space of possible models. (Ref. 5)
- Correlations can also be analyzed using ANOVA techniques to determine how much of the variation in the clinical data is explained by different subsets of the polymorphic sites in the candidate genes.
- the DecoGenTM application has an ANOVA function that uses standard methods to calculate significance (Ref. 4, Chapter 10).
- An example of an interface to this tool is shown in FIGURE 23.
- ANOVA is used to test hypotheses about whether a response variable is caused by or correlated with one or more traits or variable that can be measured. These traits or variables are called the independent variables.
- the independent variable(s) are measured and people are placed into groups or bins based on their values of the variables. In this case, each group contains those individuals with a given haplotype (or sub-haplotype) pair. The variation in response within the groups and also the variation between groups is then measured. If the within-group variation is large (people in a group have a wide range of responses) and the variation between groups is small (the average responses for all groups are about the same) then it can be concluded that the independent variables used for the grouping are not causing or correlated with the response variable.
- each haplotype-pair group is made up of the individuals in the population who have that haplotype pair.
- the table at the bottom shows the number of individuals in the group, the average response ("Test") of those individuals, and the standard deviation of that response.
- At the top is a table showing information comparing the "Between Group” calculation and the "Within Group” calculations. The details are given in the reference. [Ref.
- the user may would see that grouping by haplotype-pair for sites 2 and 8 for CYP2D6 gives significant probability at the 99% confidence level.
- the conclusion from this is that an individual's haplotypes at these positions in this gene is at least partially responsible for, or is at least strongly correlated with the value of Test.
- FIGURE 24 shows a screen which is an example interface to the modeling tool (i.e., the CTSTM Modeler) described herein.
- the modeling tool i.e., the CTSTM Modeler
- At the right are controls to set the parameters for the genetic algorithm (Ref. 5).
- In the center is a graph showing the residual error of the model as a function of the number of genetic algorithm generations.
- At the bottom is a bar graph showing the current best weights for Eq. 6.
- the linear model described in Eq. 4 is used to find optimal weights for the polymorphic sites.
- Test 0.1 + [.15 x (Number of Cs in position z) + 0.1 x (Number of As in position 8)] x 2 where "number” refers to the number in the two haplotypes for an individual.
- follow-up trials are designed to test and validate the haplotype-response mathematical model.
- Step 9 The outcome of Step 9 is a hypothesis that people with certain haplotype pairs or genotypes are more likely or less likely on average to respond to a treatment. This model is preferably tested directly by running one or more additional trials to see if this hypothesis holds.
- a diagnostic method is designed (using one or more of haplotyping, genotyping, physical exam, serum test, etc.) to determine those individuals who will or will not respond to the treatment.
- the final outcome of the CTSTM method is a diagnostic method to indicate whether a patient will or will not respond to a particular treatment.
- This diagnostic method can take one of several forms - e.g., a direct DNA test, a serological test, or a physical exam measurement. The only requirement is that there is a good correlation between the diagnostic test results and the underlying haplotypes or sub-haplotypes that are in turn correlated with clinical outcome. In the preferred embodiment, this uses the predictive genotyping method described in item 6.
- Figure 26 is the opening screen for the Asthma project. This screen appears after the "Asthma” folder has been selected from among the projects shown at the left. Selecting a folder causes the genes associated with that project to become active. Genes known or suspected of being involved in asthma are shown in the screen in "Extracellular” and “Intracellular” compartments. The text “Active Gene: DAXX” is a default value; “DAXX” will be replaced with the name of whatever gene is selected from this window. Selecting ADRB2, and then "Geneinfo" from the menu at left, brings up Figure 27.
- Figure 27 presents data and statistics related to the ADBR2 gene. Selecting "GeneStructure" from the menu at left brings up Fig. 28A.
- Figure 28A is a screen showing the genomic structure of the ADBR2 gene (showing the location of features of the gene, such as promoters, exons, introns, 5' and 3' untranslated regions), polymorphism and haplotype information, and the number of times each haplotype was seen in the representatives of each of 4 world population groups.
- the column “Wild” contains the number of individuals homozygous for the more common nucleotide at each polymorphic site, "Mut” contains the number homozygous for the less common nucleotide, and "Het” is the number of heterozygous individuals.
- Overlaid on the two graphical gene representations at the upper part of the screen are vertical bars, indicating the positions of the polymorphic sites elaborated in the middle box. The user may scroll through the lower boxes to bring different portions of the polymorphism and haplotype data into view. Selecting row 6 in the middle window results in Figure 28B.
- Figure 28B is a screen where a particular polymorphic site has been selected in the middle box.
- the upper graphical representation of the gene has been replaced by a textual representation, presented as a nucleotide sequence aligned with the lower graphical representation at the point of the selected polymorphic site (indicated by the black triangles).
- T and C the two observed nucleotides
- Figure 29A presents genealogical information and diplotype and haplotype data for individuals within the database. Shaded rectangles within the table represent missing data. Within the rectangles and ovals are the ID numbers of the individuals; below each of these in the upper genealogical chart are the two haplotypes of the ADBR2 gene present in that individual, identified by number. The nucleotides comprising these haplotypes are displayed in the box at the lower right. Selecting "Clinical Trial Data" from the menu at left brings up Fig. 29B.
- Figure 29B presents the clinical data sorted by individual patient. Severity scores, Skin Test results, and the clinically measured parameters described elsewhere are set out in columns. "NP” stands for “No data Point”, and represents data missing for any reason. Selecting "HAPSNP” from the menu at left brings up Fig. 30.
- Figure 30 presents, for each patient, a row of color-coded (or shaded) squares representing the heterozygosity of the patient at each polymorphic site. These are adjacent to a row of split squares, where the same information is presented in a two-color (or shaded) format. Selecting the HAPPair command from the menu at the left brings up Fig. 31.
- Figure 31 presents the "HAP Pair Frequency View" in which the world population distribution of haplotype or sub-haplotype pairs can be investigated.
- polymorphic sites 3, 9, and 11 have been selected by checking the corresponding boxes above the haplotypes.
- Each cell in the matrix below corresponds to a haplotype pair identified by the HAP numbers on the x and y axes.
- the height of the color-coded (or shaded) bars within each cell corresponds to the number of individuals of each population group having that haplotype pair. Clicking on the V/D button at the top of the screen toggles between Fig. 31 and 32.
- Figure 32 shows the same data in tabular form.
- the haplotypes being evaluated consist of thirteen polymorphic sites.
- Each row in the table corresponds to a haplotype pair (the two haplotypes which comprise the pair are identified in the first two columns), followed by the number of individuals in the database having that pair, and the percentage of the total population this number represents.
- Under each population group three columns presenting the number of individuals in the population group with that pair, the percentage of the population group that has that pair, and the percentage predicted by Hardy-Weinberg equilibrium. Selecting "Linkage" from the menu at left brings up Fig. 33.
- Figure 33 displays separate matrices for the total population and for each population group. Each cell is color-coded (or shaded) to indicate the extent to which the two haplotypes occur together in individuals, i.e., the degree to which they are linked. Selecting "HAPTyping" from the menu at left brings up the screen in Fig. 34.
- Figure 34 presents the ambiguity scores that result from masking one or more SNPs or polymorphisms in the genotype.
- the ambiguity scores are calculated by taking the sum of the geometric means of all pairs of genotypes rendered ambiguous by the mask, and multiplying by ten. All population groups have been chosen for inclusion in this figure by checking off the boxes at the upper left of the screen. The list of haplotype pairs has been sorted by the calculated Hardy-Weinberg frequency, and the pairs have been numbered consecutively, as shown in the first column.
- a mask that causes SNP 8 to be ignored in all cases has been imposed by deselecting the appropriate box in the "Choose SNP" row above the haplotype list. Additional masking has been imposed by deselecting the appropriate boxes in the mask to the right of the Genotype table. (The mask is to the right of the table and may be accessed by scrolling horizontally; in the figure it has been relocated to bring it into view.)
- the first mask only SNP 8 is ignored, which results in haplotype pairs 4 and 73 both being consistent with the genotype observed. (In other words, the genotypes derived from haplotype pairs 4 and 73 differ only at SNP 8, and cannot be distinguished if it is not measured). An ambiguity score of 0.016 is associated with this first mask.
- haplotype pair 4 is much greater than that of haplotype pair 73 (recall that the list is sorted by frequency), so one could resolve this ambiguity with some confidence simply by choosing haplotype pair 4. (In an alternative embodiment, the probability of each choice being the correct one could be displayed.)
- the mask with the largest number of ignored SNPs that retains an ambiguity score of about 1.0 or less will be preferred.
- the ambiguity score cut-off that is chosen may vary depending on the intended use of the inferred haplotypes. For example, if haplotype pair information is to be used in prescribing a drug, and certain haplotype pairs are associated with severe side effects, the acceptable ambiguity score may be reduced. In such a situation masks that do not render the haplotype pairs of interest ambiguous would be preferred as well. Selecting "Phylogenetic" from the menu at left brings up Fig. 35.
- Figure 35 presents haplotype data in a phylogenetic minimal spanning network.
- Each disk corresponds to a haplotype, the haplotype number is to the immediate right of each disk.
- the size of each disk is proportional to the number of individuals having that haplotype; that number is displayed in parentheses to the right of each disk.
- Haplotypes that are closely related, that is they differ at only one polymorphic site are connected by solid lines.
- Haplotypes that differ at two sites are connected by light lines, and are spaced farther apart.
- the colored (or shaded) wedges represent the fraction of individuals having that haplotype that are from different population groups. Selecting "Clinical Haplotype Correlation" brings up the screen in Fig. 36.
- Figure 36 presents the association between a clinical outcome value (in this case, "delta %FEV1 pred” which is the change in FEV1 observed after administration of albuterol, corrected for size, age, and gender.
- the SNPs one wishes to test for association may be selected by checking off the appropriate box above the HAP list table.
- the value of delta %FEV1 is represented in grayscale or by a color scale.
- Each cell in the matrix corresponds to a given haplotype pair, defined by the haplotype numbers on the x and y axes. The number in each cell is the number of patients having that haplotype pair, and the color (or shading) of each cell reflects the response of those patients to albuterol.
- Fig. 37 displays a collection of histograms, one in each cell of a haplotype pair matrix. Selecting the 1,1 cell enlarges it, bringing up Fig. 38.
- Figure 38 is a histogram showing the number of individuals having the 1,1 haplotype pair who exhibited the response to albuterol shown on the x axis.
- the bars in the histogram are color-coded (or shaded) as well, as an additional indication of the degree of response.
- Fig. 36 In either Fig. 36 or Fig. 37, there is a button with an icon of a small scatter plot (just below the Help menu at the top of the screen.) Selecting this button brings up Fig. 39A.
- This figure displays the regression calculations employed in the multi-SNP analysis, or "Build-up" process.
- the program Given the confidence values shown, which are the default values for the "tight cutoff” and "loose cutoff", the program generates pairwise combinations of SNPs, tests their p-values for correlation with "delta %FEV1 pred” against the cutoff values, and, from those subhaplotypes that pass the cut-offs, re-calculates and tests new pairwise combinations, until the number of SNPs in the subhaplotypes reaches the limit shown in the "Fixed Site” box. In the example shown, no four-SNP subhaplotype passed the loose cutoff, thus there are only 1-, 2-, and 3-SNP sub-haplotypes shown in this screen. New values may be entered in the Confidence and Fixed site fields; clicking on the calculator button (under the File menu) re-executes the Build-up and Build-down processes with the entered values.
- a reverse SNP analysis, or "Build down” process may also be carried out; the presence of the minus sign in the "Fixed Site” box indicates that this process is being requested. (In the example given, only a single “Build-down” round was executed, so as to ensure that the full haplotype is present for comparison.)
- Figure 39B presents in a graphic form the calculation of the regression parameters displayed in Fig. 39A.
- the values of "delta %FEV1 pred" for patients with 0, 1, and 2 copies of the **A*****A*G** subhaplotype are plotted vertically at three ordinates.
- a line is drawn through the three means, and the slope of the line is taken as an indication of the degree of correlation.
- the intercept, slope, slope range, R and R 2 values, and the p value associated with this line, are all listed in Fig. 39A.
- the "slope range” is a pair of limits, reflecting the standard deviation in the values of "delta %FEV1 pred".
- the p value listed in Fig. 39A is the probability that the slope is actually zero, i . e . it is the probability that there is in fact no correlation. A lower value of p thus indicates greater reliability.
- Fig. 40 (reached through the "Clinical Mode” menu) displays the observed haplotype pairs, their distribution in the population, and the mean clinical response (delta %FEV1 pred.) of the patients having those haplotype pairs. Selecting the "normal" button (to the right of the scatter plot button) brings up Fig. 41.
- Figure 41 shows a screen that displays the results of an ANOVA calculation in which patients were grouped according to haplotype pairs, and the average value of "delta %FEV1 pred.” was analyzed both within the groups and between the groups. This permits one to determine which pairs of haplotypes are associated with the observed clinical response. All SNPs in the ADBR2 gene have been selected in the row of boxes labeled "Choose SNPs", thus the groups are the same as the cells in the matrix in Fig. 36. Groups containing one patient were ignored, leaving the seven groups listed at the bottom of the screen. This left six degrees of freedom (the parameter "DF") for inter-group comparisons.
- DF degrees of freedom
- Figure 42 is arrived at by selecting the "ClinicalVariables" command from the menu to the left of most of the previous screens. This is the same information displayed in Fig. 38, except that it is for the entire cohort rather than for a selected haplotype pair. The number of patients is plotted against the value of "delta %FEV1 pred”. Note the outliers at 50% and 65% response. Selecting "ClinicalCorrelations" from the menu to the left brings up Fig. 43.
- Figure 43 is a plot of each patient's "FEV1% PRE” (the normalized value of FEV1 prior to administration of albuterol) against “delta %FEV1 pred”. These variables are selected in the upper part of the screen. It is seen in this example that the response does not correlate with the initial value of FEV1.
- This aspect of the invention provides a method for determining an individual person's haplotypes for any gene with reduced cost and effort.
- a haplotype is the specific form of the gene that the individual inherited from either mother or father.
- the 2 copies of the gene usually differ at a few positions in the DNA locus of the gene. These positions are called polymorphisms or Single Nucleotide Polymorphisms (SNPs).
- SNPs Single Nucleotide Polymorphisms
- the minimal information required to specify the haplotype is the reference sequence, and the set of sites where differences occur among people in a population, and nucleotides at those sites for a given copy of the gene possessed by the individual.
- haplotype can be represented as a string of 1s and 0s such as 001010100.
- one may make use of known methods for discovering a representative set of the haplotypes that exist in a population, as well as their frequencies. One begins by sequencing large sections of the gene locus in a representative set of members in the population.
- the mixed genotypes could be: Individual Genotype site 1 Genotype site 2 Genotype site 3 Haplotype of 1 st allele Haplotype of 2 nd allele 1 1/1 1/0 1/0 3 4 2 0/0 0/0 0/0 1 1 3 1/0 1/0 0/0 1 2 4 1/1 0/0 1/0 3 5
- This mixed set of genotypes could be derived from the following haplotypes: Haplotype No. Haplotype Frequency in population 1 000 3 2 110 1 3 100 2 4 111 1 5 101 1
- haplotypes are a fundamental unit of human evolution and their relationships can be described in terms of phylogenetics.
- One consequence of this phylogenetic relationship is the property of linkage disequilibrium. Basically this means that if one measures a nucleotide at one site in a haplotype, one can often predict the nucleotide that will exist at another site without having to measure it. This predictability is the basis of this aspect of the invention. Elimination of sites that do not need to be measured results in a reduced set of sites to be measured.
- Information from a previously measured set of individuals may be used to determine the minimum number (or a reduced number) of sites that need to be measured in a new individual in order to predict the new individual's haplotypes with a desired level of confidence. Since the measurement at each site is expensive, the invention can lead to great cost reduction in the haplotyping process.
- Step 1 Measure the full genotypes of a representative cohort of individuals.
- Step 2 Determine their haplotypes directly, or indirectly )( e.g ., using one of several algorithms.
- Step 3 Tabulate the frequencies for each of these haplotypes.
- Steps 1-3 are optional. The remaining steps only require that a database of haplotypes with frequencies exists. There are several ways to achieve this, but the above set of steps is the preferred route.
- Step 4 Construct the list of all full genotypes that could come from the observed haplotypes. Note that only a subset of these will actually be observed in a typical sample, for example 100-200 individuals.
- Step 5 Predict the frequency of these genotypes from the Hardy-Weinberg equilibrium. If two haplotypes Hap1 and Hap2 have frequencies f1 and f2, the expected frequency of the mix is 2 x f1 x f2, or f1 x f2 if Hap1 and Hap2 are identical.
- Step 6 Go through this list and find all sites that, if they were not measured, would still allow one to correctly determine each pair of haplotypes. For example, take the case where the three haplotypes A (1111), B (1110), and C (0000) exist in a population.
- the six genotypes that could be observed are derived from the six different pairs that are possible: Hap Polymorphic Site Pair 1 2 3 4 1.
- any one of the sites 1-3 would still permit one to correctly assign a haplotype pair to an individual. From this we can see that any one of the first three positions, together with the fourth, carries all of the information required to determine which pair of haplotypes an individual has.
- Step 7 Extend the analysis of Step 6 as follows. Create a set of masks of the same length as the haplotype.
- a mask may be represented by a series of letters, e.g ., Y for yes and N for no, to indicate whether the marked site is to be measured. For example, using the mask YNNY in the previous example, one would measure only sites 1 and 4, and one could use the information that only haplotypes 1111, 1110, and 0000 exist to infer the haplotypes for the individuals.
- Masks NYNY and NNYY would give equivalent information. If there are n sites, all combinations of Y and N produce 2 n masks, of which 2 n -1 need to be examined (the all-N mask provides no information).
- Step 8 For each mask, evaluate how much ambiguity exists from this measurement of incomplete information. For example, one measure of ambiguity would be to take all pairs of genotypes that are identical when using the mask, and multiply their frequencies. The product may be converted to the geometric mean. Then, for each mask, add up all such products for all ambiguous pairs to obtain an ambiguity score, which is used as a penalty factor in evaluating the value of the mask. The consequence of this would be to highly penalize masks that fail to resolve likely-to-be-seen genotypes into correct haplotypes, and masks that leave large numbers of genotypes ambiguous, such as the mask NNNY in the above example. This would give greater weight to masks that only confuse low frequency, low probability genotypes. A variety of other scoring schemes could be devised for this purpose.
- Step 8 Genotype new individuals using the optimal set of m sites (the optimal mask).
- the optimal mask there are three equivalent optimal masks, YNNY, NYNY and NNYY, which require that only two of the four polymorphic sites be measured. (These masks have zero ambiguity.)
- Step 9 Derive these individuals' full n-site haplotypes by matching their m-site genotypes to the appropriate m-site genotypes derived from the n-site haplotypes of the initial cohort. If there is an ambiguity in the choice, the more common haplotype may be chosen, but preferably a haplotype pair will be chosen based on a weighted probability method as follows:
- the following methods are described for correlating haplotypes, or haplotype pairs, with a clinical outcome variable. However, these methods are applicable to correlating haplotypes, and/or haplotype pairs, to any phenotype of interest, and is not limited to a clinical population or to applications in a clinical setting.
- the first step (S1) is the collection of haplotype information and clinical data from a cohort of subjects.
- Clinical data may be acquired before, during, or after collection of the haplotype information.
- the clinical data may be the diagnosis of a disease state, a response to an administered drug, a side-effect of an administered drug, or other manifestation of a phenotype of interest for which the practitioner desires to determine correlated haplotypes.
- the data is referred to as "clinical outcome values.” These values may be binary (e.g., response/no response, survival at 5 months, toxicity/no toxicity, etc.) or may be continuous (e.g. liver enzyme levels, serum concentrations, drug half-life, etc.)
- the collection of haplotype information is the determination (e.g., by direct sequencing or by statistical inference) of a pattern of SNPs for each allele of a pre-selected gene or group of genes, for each individual in the cohort.
- the gene or group of genes selected may be chosen based on any criteria the practitioner desires to employ. For example, if the haplotype data is being collected in order to build a general-purpose haplotype database, a large number of clinically and pharmacologically relevant genes are likely to be selected. Where a retrospective analysis of a cohort from an ongoing or completed clinical study is being carried out, a smaller number of genes judged to be relevant might be selected.
- the next step (S2) is the finding of single SNP correlations.
- Each individual SNP is statistically analyzed for the degree to which it correlates with the phenotype of interest.
- the analysis may be any of several types, such as a regression analysis (correlating the number of occurrences of the SNP in the subject's genome, i . e . 0, 1, or 2, with the value of the clinical measurement), ANOVA analysis (correlating a continuous clinical outcome value with the presence of the SNP, relative to the outcome value of individuals lacking the SNP), or case-control chi-square analysis (correlating a binary clinical outcome value with the presence of the SNP, relative to the outcome value of individuals lacking the SNP).
- a "tight cut-off" criterion is next applied to each SNP in turn.
- a first SNP is selected (S3) and its correlation with the clinical outcome is tested against a tight cut-off (S4).
- cut-off values may be chosen if desired for any reason.
- User-selected tight and loose cut-off values are entered in the two boxes labeled "confidence" in Fig. 39a.
- a SNP whose correlation meets the loose cut-off is stored for later combination (S6). Any SNP whose correlation does not meet either cut-off is discarded (S8), i . e ., it is not considered further in the process. If there are SNPs remaining to be tested against the cut-offs (S9) they are selected (S10) and tested (S4) in turn.
- a tight cut-off is not applied, and each SNP's correlation is tested directly against the loose cut-off, and the SNP is either saved or discarded.
- correlations of pair-wise generated sub-haplotypes are also tested directly against the loose cut-off. If desired, SNPs and sub-haplotypes which are saved at the end of this alternative process may be measured against a tight cut-off, and those that pass may be displayed.
- the next step of the process consists of generating all possible pair-wise combinations (subhaplotypes) of the saved SNPs. If novel (i . e . untested) sub-haplotypes are possible (S11), which will be the case on the first iteration, they are generated by pair-wise combination of all saved SNPs (S12). The correlations of the newly generated subhaplotypes with the clinical outcome values are calculated (S13), as was done for the SNPs. A first sub-haplotype is selected (S15) and its correlation is tested against the tight and loose cut-offs (S4, S7) as described above for the SNP correlations. Each sub-haplotype is tested in turn, as described above, discarding any subhaplotypes that do not pass the cut-off criteria and saving those that do pass.
- the process When all sub-haplotypes have been examined, the process generates new pair-wise combinations among the originally saved SNPs and the newly saved sub-haplotypes, and among all saved sub-haplotypes as well.
- the process may be iterated until no new combinations are being generated; alternatively the practitioner may interrupt the process at any time.
- complex redundant subhaplotypes are removed from the pair-wise generated sub-haplotypes (S14).
- Complex redundant sub-haplotypes are those which are constructed from smaller sub-haplotypes, where the smaller sub-haplotypes have correlation values that are at least as significant as that of the complex sub-haplotype, i . e . they have correlation values that account for the correlation value of the complex redundant subhaplotype.
- the complex haplotype provides no additional information beyond what the component sub-haplotypes provide, which makes it redundant.
- the non-redundant haplotypes and sub-haplotypes that remain are those that have the strongest association with the clinical outcome values. These are saved for future use (S16).
- This aspect of the invention provides a method for discovering which particular SNPs or sub-haplotypes correlate with a phenotype of interest, when one has in hand single gene haplotype correlation values. The process is outlined in the flow chart illustrated in Fig. 46.
- the first step (S17) is the collection of haplotype information and clinical data from a cohort of subjects.
- Clinical data may be acquired before, during, or after collection of the haplotype information.
- the clinical data may be the diagnosis of a disease state, a response to an administered drug, a side-effect of an administered drug, or other manifestation of a phenotype of interest for which the practitioner desires to determine correlated haplotypes.
- the data is referred to as "clinical outcome values.” These values may be binary ( e . g ., response/no response, survival at 5 months, toxicity/no toxicity, etc.) or may be continuous ( e.g. liver enzyme levels, serum concentrations, drug half-life, etc.)
- the collection of haplotype information is the determination ( e . g ., by direct sequencing or by statistical inference) of a pattern of SNPs for each allele of each of a pre-selected group of genes, for each individual in the cohort.
- the group of genes selected may be chosen based on any criteria the practitioner desires to employ. For example, if the haplotype data is being collected in order to build a general-purpose haplotype database, a large number of clinically and pharmacologically relevant genes are likely to be selected. Where a retrospective analysis of a cohort from an ongoing or completed clinical study is being carried out, a smaller number of genes judged to be relevant might be selected.
- the next step (S18) is the finding of single-gene haplotype correlations.
- Each individual haplotype of each gene is statistically analyzed for the degree to which it correlates with the phenotype or clinical outcome value of interest.
- the analysis may be any of several types, such as a regression analysis (correlating the number of occurrences of the haplotype in the subject's genome, i . e . 0, 1, or 2, with the value of the clinical measurement), ANOVA analysis (correlating a continuous clinical outcome value with the presence of the haplotype, relative to the outcome value of individuals lacking the haplotype), or case-control chi-square analysis (correlating a binary clinical outcome value with the presence of the haploptype, relative to the outcome value of individuals lacking the haplotype).
- a "tight cut-off" criterion is next applied to each haplotype in turn.
- a first haplotype is selected (S19) and its correlation with the clinical outcome value is tested against a tight cut-off (S20).
- a haplotype meeting the loose cut-off is stored for later combination (S22). Any haplotype whose correlation does not meet either cut-off is discarded (S24), i.e., it is not considered further in the process. If there are haplotypes remaining to be tested against the cut-offs (S25) they are selected (S26) and tested (S20) in turn.
- a tight cut-off is not applied.
- the correlation of each haplotype is tested directly against the loose cut-off, and the haplotype is either saved or discarded.
- correlations of subhaplotypes generated by masking are also tested directly against the loose cut-off. If desired, sub-haplotypes which are saved at the end of this alternative process may be measured against a tight cut-off, and those that pass may be displayed.
- the next step of the process consists of generating all possible sub-haplotypes in which a single SNP is masked, i . e . its identity is disregarded. If novel (i . e . untested) subhaplotypes are possible (S27), which will be the case on the first iteration, they are generated by systematically masking each SNP of all saved haplotypes (S28). The correlations of the newly generated sub-haplotypes with the clinical outcome value are calculated (S29), as was done for the haplotypes themselves.
- a first subhaplotype is selected (S30) and its correlation is tested against the tight and loose cut-offs (S20, S23) as described above for the haplotype correlations.
- Each subhaplotype is tested in turn, as described above, discarding any sub-haplotypes that do not pass the cut-off criteria and saving those that do pass.
- complex redundant haplotypes and sub-haplotypes are discarded after correlations are calculated for the sub-haplotypes and SNPs generated by the masking step (S31).
- Complex redundant haplotypes and sub-haplotypes are those which are constructed from smaller subhaplotypes or SNPs, where the smaller sub-haplotypes or SNPs have correlation values that are at least as significant as that of the complex sub-haplotype, i . e . they have correlation values that account for the correlation value of the complex redundant sub-haplotype.
- the complex haplotype or sub-haplotype provides no additional information beyond what its component sub-haplotypes or SNPs provide, which makes it redundant.
- the process When all sub-haplotypes have been examined, the process generates new sub-haplotypes by masking SNPs among the newly saved subhaplotypes.
- the process is preferably iterated until no new sub-haplotypes are being generated; this may occur only when the sub-haplotypes have been reduced to individual SNPs. Alternatively the practitioner may interrupt the process at any time.
- the non-redundant sub-haplotypes and SNPs that remain are those that have the strongest association with the clinical outcome values. These are saved for future use (S32).
- the methods of the invention preferably use a tool called the DecoGenTM Application.
- the tool consists of:
- the present invention uses a relational database which provides a robust, scalable and releasable data storage and data management mechanism.
- the computing hardware and software platforms with 7x24 teams of database administration and development support, provide the relational database with advantageous guaranteed data quality, data security, and data availability.
- the database models of the present invention provide tables and their relationships optimized for efficiently storing and searching genomic and clinical information, and otherwise utilizing a genomics-oriented database.
- a data model (or database model) describes the data fields one wishes to store and the relationships between those data fields.
- the model is a blueprint for the actual way that data is stored, but is generic enough that it is not restricted to a particular database implementation (e.g., Sybase or Oracle).
- the model stores the data required by the DecoGen application.
- the database comprises 5 submodels which contain logically related subsets of the data. These are described below.
- a model or sub-model is a collection of database tables.
- a table is described by its columns, where there is one column for each data field.
- COMPANY contains the following 3 columns: COMPANY_ID, COMPANY_NAME, and DESCR.
- COMPANY_ID is a unique number (1, 2, 3, etc.) assigned to the company.
- COMPANY_NAME holds the name (e.g., "Genaissance") and DESCR holds extra descriptive information about the company (e.g., "The HAP Company"). There will be one row in this table for each company for which data exists in the database.
- COMPANY_ID is the "primary key" which requires that no two companies have the same value of COMPANY_ID, i.e., that it is unique in the table. Tables are connected together by "relationships". To understand this, refer to Figure 25E which shows the table COMPANYADDRESS. It has fields COMPANY_ID, STREET, CITY, etc. In this table the field COMPANY_ID refers back to the table COMPANY. If a company has several locations, there will be several rows in the table COMPANYADDRESS, each with the same value of COMPANY_ID. For each of these we can get the name and description of the company by referring back to the COMPANY TABLE.
- FIGURES 25A-E The following abbreviations are used in FIGURES 25A-E and the tables describing the database model depicted therein:
- the database contains 76 tables as follows:
- Additional tables may include Allele, FeatureMapLocation, PubImage, TherapCompound
- Figures 25A-E show the fields of each table in the database. The following are descriptions of the fields found in the database as well as for fields and tables that could be added to the database:
- FIG. 25F describes the relational symbols used in FIGS. 25A-E.
- a relational symbol such as indicated by reference numeral 2 represents an identifying parent/child relationship. It depicts the not nullable 1-to-0-or-many relationship. Not nullable means that one cannot create a record in the child unless a corresponding record (indicated by the particular relating field) exists or is created in the parent.
- a relational symbol such as indicated by reference numeral 4 represents a non-identifying parent/child relationship. It represents the nullable 0-or-1-to-many relationship.
- a relational symbol such as indicated by reference numeral 6 represents an identifying parent/child relationship. It depicts the not nullable 1-to-1-or-many relationship.
- a relational symbol such as indicated by reference 8 represents a non-identifying parent/child relationship. It represents the not nullable 1-to-1-or-many relationship.
- a relational symbol such as indicated by reference numeral 10 represents an identifying parent/child relationship. It depicts the not nullable 1-to-exact-1 relationship.
- a relational symbol such as indicated by reference numeral 12 represents a non-identifying parent/child relationship. It represents the nullable 0-or-1-to-exact-1 relationship.
- a relational symbol such as indicated by reference numeral 14 represents a non-identifying parent/child relationship. It depicts the not nullable 0-or-1-to-many relationship.
- a preferred embodiment of the database model of the invention contains 5 sub-models and 83 tables. This model is organized at three levels of detail: sub-model, table and fields of tables.
- FIGURES 44A-E The five submodels of this preferred embodiment are depicted in FIGURES 44A-E and are described below.
- Genomic Repository (Fig. 44A): This submodel organizes genomic information by spatial relationships.
- the central element of the genomic repository submodel is the Genetic_Feature object, which is an abstract template for any object having a nucleotide sequence that can be mapped to the nucleotide sequence of other objects by providing a start and stop position.
- Genetic objects also referred to herein as genetic features
- Genetic features include, but are not limited to, chromosomes, genomic regions, genes, gene regions, gene transcripts and polymorphisms.
- Genetic_Feature is the base class from which these other objects are extended from.
- the primary keys for each of these genetic objects are foreign keys to the primary key of the Genetic_Feature table.
- Each genetic feature is represented by a unique Feature_ID that is generated by the database management system's sequence generator.
- the principal properties of a genetic feature are start position, stop position and reference. The start and stop positions indicate the extent of that genetic feature relative to another given genetic feature, which is the reference and is represented by another unique Feature_ID generated by the database management system's sequence generator.
- the reference serves as the parent in this table by the self pointing foreign key of Ref_ID.
- the Feature_Type attribute gives the database model the possibility to determine what type of spatial relationship is legal among what types of genetic features at a given time in a given context. For example, the system will allow a gene to map on to a sequence assembly by defining the start and end position of the gene in the assembly. A gene region is mapped on to a gene through a similar mechanism. The mapping of the gene region onto the assembly will therefore be made possible through the transverse of links between the Seq_Assembly and Gene tables and between the Gene and Gene_Region tables. Similarly, a polymorphism is mapped on to a sequence that will be a building block for the assembly, which in turn determines the reference sequence for the gene being analyzed for genetic variation.
- This centralized organization of the positional relationships of various genetic features through one parent table is believed to be novel and offers significant advantages over known database designs by reducing the cost of maintaining the database and increasing the efficiency of querying the database.
- organization of genetic features by this novel relative positional referencing approach allows this information to readily be organized into genomic sequences, gene and gene transcript structures and also into diagrams mapping genetic features to the assembled genomic and gene sequences. The design and use of the genomic repository submodel are described in more detail below.
- Genome The ultimate root feature for all genetic features. Its reference link is always null, i.e. it is itself not mapped to anything. As long as there is not a complete genomic sequence, there is little reason to actually have a table for this.
- Chromosome The highest unit of contiguous genomic sequence. The reference for chromosomes would be the genome. Because there is no overlap between chromosomes, the genome is a disjoint assembly of all the chromosomes, in a particular order, with gaps between all neighboring chromosomes.
- Assembly An assembly is defined as a set of one or more contigs, ordered in a certain way. In the absence of genome or chromosome features, the assembly will be the root of the genomic sequence mapping tree. Its reference is then null.
- Contig A contiguous assembly of overlapping sequences that are ordered 5' to 3'. A contig is preferably referenced to its assembly.
- Unordered Contig A collection of contiguous sequences that are not ordered and may or may not have gaps between them.
- An unordered contig which is represented by an external accession number, is broken down and used in building the sequence assembly as a normal contig.
- Sequence (Genetic_Accession): A stretch of nucleotide sequence data. This data is represented by a unique accession number and a version number. Sequence data can include YACs, BACs, Gene sequences and ESTs. Typically, the source of sequence data will be GenBank and other sequence databases, but any piece of sequence is allowed. A sequence is normally referenced to its contig.
- Gap The gap is a zero length feature which indicates that there is an unknown amount of additional sequence to be inserted at this point. It is merely an indication of lack of knowledge and has no physical counterpart. Gaps are usually referenced to the Assembly in which they separate the contigs. They would also be used with the genome as reference to separate the chromosomes.
- Gene This defines the gene locus in terms of base pairs. The start and stop positions of the gene are not usually well defined. A gene starts somewhere between the end of the previous gene and the beginning of the first recognized promoter element. A gene ends somewhere between the end of the last exon and the beginning of the next gene. In practice, including at least four kilobase pairs of promoter region are desirable. A gene is preferably referenced to an assembly.
- Gene Region A particular region of the gene. Gene regions are classified according to their transcriptional or translational roles. For a gene sequence, there are promoters, introns and exons. In a transcribed sequence, different gene regions include 5' and 3' untranslated regions (UTRs) as well as protein-coding regions.
- Polymorphism A part of the genome that is polymorphic across different individuals in a population. The most common polymorphisms are SNPs, the length of which is one base pair. All polymorphisms are preferably referenced to the sequence with respect to which they were found.
- Primer A short region of about 20 base pairs corresponding to an oligonucleotide for priming PCR reactions and/or primer extension reactions in a variety of polymorphism detection assays. Primers are preferably referenced to the sequence they were designed from.
- Transcript The result of a splice operation of the gene sequence. There can be several transcripts per gene, to indicate splice variants. The transcript is mapped to genetic features via the Splice table, but does not map to anything the conventional way, i.e., its reference is always null. The transcript starts another branch of positional mapping of genetic features related to protein sequences.
- start and stop positions are preferably given in nucleotide positions, even for protein features. This retains the uniformity of the mapping scheme, and the translation to amino acid positions is trivial.
- the first position in a sequence has the position 1.
- the stop position can be less than the start position, in which case a reverse complement needs to be taken on the reference sequence to get the feature sequence.
- a different physical map could be generated that would be expressed in something other than base pair positions, e.g. centimorgans.
- Another level of hierarchy could be added to the genomic repository submodel by implementing each gene region type as its own subclass extending the Gene_Region (i.e., creating separate tables for different gene region types with the primary key linked as foreign key to the Gene_Region table).
- the hierarchy could be flattened by eliminating the Gene_Region object and have individual gene region types directly subclassing Genetic_Feature.
- an additional useful genetic feature is a secondary structure region of a protein, e.g., alpha-helix, beta-sheet, turn and coil regions.
- a new genetic feature type needs to be created, and a table to contain information specific to the new genetic feature type needs to be added.
- Some genetic features will not have additional information (Gap, for example), and thus no table is necessary in such cases.
- the primary key of the genetic feature type specific table always needs to double as a foreign key to the Genetic_Feature table. This design enables the database submodel to be flexible and extendable enough to accommodate the rapid evolution and increase in volume of genomic information.
- Assembly of a genomic sequence typically starts with a gene name and comprises performance of the following steps by a human and/or computer operator:
- the assembly may be used in conjunction with additional information on the location of gene regions, i.e., promoters, exons and introns and the like, to generate a gene structure.
- Information on gene regions may be private or found in the public domain.
- information on the gene regions is stored in the database and the gene structure is displayed to the user. An example of how such a display would typically appear is shown in Figure 48.
- the corresponding additions to Table A are shown in Table B below.
- Feature Id Feature Name Feature Type Reference Start Stop 15
- the genomic repository database submodel of the present invention also allows referencing of gene transcripts to other genetic features.
- the relationship between a transcript and a genomic sequence is not a simple start/stop mapping, but requires the concatenation of separate regions of the genomic sequence into one combined sequence, the gene transcript.
- this is represented by a Splice table, which provides an ordered list of splice elements (usually exon regions) for each splice product (usually a transcript).
- the splice product is a feature, it is not mapped to anything else, i.e. it is the root of its own mapping tree. Components of this tree can be 5' and 3' UTRs, a protein, and features related to that protein such as secondary structure or signal sequences.
- the diagram in Figure 49 shows the full mapping example down to the protein regions.
- the Splice table for this example is set forth in Table C below, which incorporates the EXAMPLE information from Table B: Splice Id Order No Region Id Product Id 1 1 17 20 1 2 19 20 Also, Table A would have the following additions: Feature Id Feature Name Feature Type Reference Start Stop 20 EXAMPLE trans Transcript - - - 21 5' UTR Region 20 1 40 22 CETP prot Protein 20 40 240 23 3' UTR Region 20 240 280
- Clinical Repository (FIGURE 44B): This submodel encapsulates polymorphism and clinical information about subjects and reference individuals used in clinical trials.
- the Subject_Hap table associates a given haplotype (identified by the field of Hap_Id) with each patient subject having that haplotype (identified by the field of Sub_ID (Subject ID)). Associations between polymorphisms in a locus (including SNPs and haploytpes ) and different clinical phenotypes (such as disease association and drug response) are captured by the Measure_ID and Measure_Result fields in the Subject_Measurement table.
- Variation Repository (FIGURE 44C): This submodel covers the haplotypes and the polymorphisms associated with genes and patient cohorts used in clinical trial studies. Polymorphisms may include SNPs, small insertions/deletions, large insertions/deletions, repeats, frame shifts and alternative splicing.
- the Haplotype table has the basic fields of Hap_ID, Hap_Locus_ID and Hap_Name that identify a unique haplotype of a given gene or locus.
- a haplotype is further defined by the set of SNPs that it comprises, which are listed in the Hap_SNP table.
- This association table uses data fields named Hap_ID (haplotype ID) and Poly_ID (polymorphism ID) to allow the mapping of the many-to-many relationship between haplotype and the polymorphism(s) that constitute the specific haplotype.
- Haplotype ID haplotype ID
- Poly_ID polymorphism ID
- Literature Repository (FIGURE 44D): This submodel enables annotation of the genetic features in the genomic repository and the variation information in the variation repository with public domain information relating to these objects.
- Annotation information useful in the invention may be found in peer-reviewed scientific publications, patent documents, or by searching on-line electronic databases. The relationship between the annotated objects and their referencing information are linked through the various association tables.
- Drug Repository (FIGURE 44E): This submodel captures client companies, contact information, compounds used in different disease areas and assay results for such compounds in regards to polymorphisms and haplotypes of target genes. Associations between polymorphisms in a drug target and activity of a candidate drug are captured by the following data fields: Hap_ID (Hap_Locus table); Compound_ID (Compound table), and the Assay_ID (Assay, Assay_Experiment, and Assay_Result tables).
- Hap_ID Hap_Locus table
- Compound_ID Compound table
- Assay_ID Assay, Assay_Experiment, and Assay_Result tables.
- This preferred embodiment of a database of the present invention contains 83 tables as follows:
- Figures 44A-E show the fields of each of the tables in the currently used database. The following are descriptions of the fields in the database:
- the haplotype and other data developed using the methods and/or tools described herein may be used in a partnership of two or more companies (referred to herein as the Partnership) to integrate knowledge of human population and evolutionary variation into the discovery, development and delivery of pharmaceuticals.
- the partners in the partnership may be classified as pharmaceutical, biopharmaceutical, biotechnology, genomics, and/or combinatorial chemistry companies.
- One of the partners, referred to herein as the HAPTM Company will provide the other partner(s) with the tools needed to address drug response problems that are attributable to human diversity.
- the HAPTM Company will focus on identifying polymorphisms in genes and/or other loci found in a diverse set of individuals, information on which will be stored in a database (referred to herein as the IsogenomicsTM Database).
- the database is designed to store polymorphism information for at least 2000 genes and/or other loci that are important to the pharmaceutical process.
- the polymorphisms identified are gene specific haplotypes and the genes chosen for analysis will be prioritized by the HAPTM Company by pharmaceutical relevance.
- Analyzed genes may include, while not being limited to, known drug targets, G-coupled protein receptors, converting enzymes, signal transduction proteins and metabolic enzymes.
- the database will be accessible through an informatics computer program for epidemiological correlation and evaluation, a preferred embodiment of which is the DecoGenTM application described above.
- the partners will have non-exclusive access to the IsogenomicsTM Database, which contains the frequencies, sequences and distribution of the polymorphisms, e.g., gene haplotypes, found in a diverse set of individuals, referred to herein as the index repository, which preferably represents all the ethnogeographic groups in the world.
- Haplotypes in the database preferably include polymorphisms found in the promoter, exons, exon/intron boundaries and the 5' and 3' untranslated regions.
- the number of individuals examined in the index repository allows the detection of any haplotype whose frequency is 10% or higher with a 99% certainty.
- the information within the IsogenomicsTM Database is part of the HAPTM Company's informatics computer program which is accessible through an intuitive and logical user interface.
- the informatics program contains algorithms for the reconstruction of relationships among gene haplotypes and is capable of abstracting biological and evolutionary information from the IsogenomicsTM Database.
- the informatics program is designed to analyze whether genes in the IsogenomicsTM Database are relevant to a clinical phenotype, e.g., whether they correlate with an effective, inadequate or toxic drug response.
- the program also contains algorithms designed for detecting clinical outcomes that are dependent upon cooperative interactions among gene products.
- the computer system has the capability to simulate gene interactions that are likely to cause polygenic diseases and phenotypes such as drug response.
- the informatics computer program will be installed at a site selected by each partner(s).
- the information in the IsogenomicsTM database will be of immediate use to drug discovery teams for target validation and lead prioritization and optimization, to drug development specialists for design and interpretation of clinical trials, and to marketing groups to address problems encountered by an approved drug in the marketplace.
- partner(s) can use the genotyping and/or haplotyping capabilities of the HAPTM Company to stratify their clinical cohorts, which will enable the partner(s) to separate cohorts by drug response.
- the HAPTM Company will genotype and/or haplotype Phase II, Phase III, and Phase IV patient cohorts under good laboratory conditions (GLP) conditions that will allow submittal of the data to clinical regulatory authorities.
- GLP good laboratory conditions
- the clinical genotype and/or haplotype data is deposited within a component of the informatics computer program that is proprietary to the partner to allow the partner to correlate polymorphisms such as gene haplotypes with drug response.
- Partner(s) will have access to the physical clones that correspond to each of the haplotypes for a given gene or other locus. These isogene clones can be used in primary or secondary screening assays and will provide useful information on such pharmacological properties as drug binding, promoter strength, and functionality.
- the partners can select genes (or other loci) of their choosing for haplotyping in the index repository.
- the genes selected can be in the public domain or proprietary to the partner(s).
- haplotyping results for a proprietary gene will only be accessible by the owner of that gene until sequence information for the gene enters the public domain.
- the IsogenomicsTM Database also contains public patent information that is available for each gene in the database. This feature provides the partner(s) with an understanding of the potential proprietary status of any gene in the database.
- the HAPTM Company will assign a Ph.D. level scientist as a liaison to a partner to facilitate communication, technology transfer, and informatics support.
- the HAPTM Company will also provide, at an extra charge, special molecular, biological and genomics services to partner(s) who submit cDNAs or ESTs to be haplotyped.
- cDNAs or ESTs will be utilized to retrieve genomic loci and to create special haplotyping assays that will allow the gene locus at the chromosome level to be haplotyped in the index repository.
- Genomic intervals containing possible genes of high significance for phenotypic correlations stemming from positional cloning programs can also be submitted by partner(s) for haplotyping.
- Each partner(s) will pay the HAPTM Company a fee for membership in the Partnership, preferably for a period of at least two or three years.
- Companies joining the Partnership may utilize the resources of the informatics computer program and IsogenomicsTM Database on a company wide basis, including groups in drug discovery, medicinal chemistry, clinical development, regulatory affairs, and marketing.
- novel isogenes will be isolated and characterized by the HAPTM Company, as well as methods for the detection of novel SNP's or haplotypes encompassed by the isogenes.
- haplotype association associations between clinical outcome and haplotypes (hereinafter “haplotype association”) for many of the genes in the IsogenomicsTM Database will be discovered. Therefore, it is also contemplated that methods of using the haplotypes and/or isogenes for diagnostic or clinical purposes relating to disease indications supported by the particular association will be discovered.
- Phase I-clinical pharmacology investigations with attention to pharmacokinetics, metabolism, and both single dose and dose-range safety
- Phase II-limited size closely monitored investigations designed to assess efficacy and relative safety
- Phase III-full scale clinical investigations designed to provide an assessment of safety, efficacy, optimum dose and more precise definition of drug-related adverse effects in a given disease or condition.
- Phase I and Phase II are the early stages of the drug's development, when the safety and the dosing level are tested in a small number of patients.
- Phase III the drug's developer then proceeds to Phase III.
- Phase III many more patients, usually several hundred, are given the new drug to see whether the early findings that demonstrated safety and effectiveness, will be borne out in a larger number of patients.
- Phase III is pivotal to learning hard statistical facts about a new drug. Larger numbers of patients reveal the percentage of patients in which the drug is effective, as well as give doctors a clearer understanding about the side effects which may occur.
- a Partner's discovery personnel may desire haplotype information for isogenes of a gene, and/or one or more clones containing isogenes of the gene, regardless of whether or not clinical trials (or field trials, in the case of plants) are planned, in progress, or completed.
- the Partner may be studying a gene (or its encoded protein) and by be interested in obtaining information concerning, e.g., protein structure or mRNA structure, in particular information concerning the location of polymorphisms in the mRNA structure and their possible effect on mRNA transcription, translation or processing, as well as their possible effect on the structure and function of the encoded protein.
- Such information may be useful in designing and/or interpreting the results of laboratory test results, such as in vitro or animal test results. Such information may be useful in correlating polymorphisms with a particular result or phenotype which may indicate that the gene is likely to be responsible for certain diseases, drug response or other trait. Such information could aid in drug design for pharmaceutical use in humans and animals, or aid in selecting or augmenting plants or animals for desired traits such as increased disease or pest resistance, or increased fertility, for agricultural or veterinary use. The Partner may also be interested in knowing the frequency of the haplotypes.
- Such information may be used by the Partner to determine which haplotypes are present in the population below a certain frequency, e.g., less than 5%, and the Partner may use this information to exclude studying the isogenes, mRNAs and encoded proteins for these haplotypes and may also use this information to weed out individuals containing these haplotypes from their proposed clinical trials.
- the HAPTM Company may give access to the Partner to all or part of the data and/or analytical tools exemplified herein by the DecoGenTM Informatics Platform.
- the Partner may also be given access to one or more clones containing isogenes, e.g., a genome anthology clone (see, e.g., US Patent Application Ser. No. 60/032,645, filed December 10, 1996 and US Patent Application Ser. No. 08/987,966, filed December 10, 1997).
- a Partner may desire haplotype information for haplotypes of a gene, and/or one or more clones containing isogenes of the gene, in particular when toxicity or adverse reactions to the drug are observed in at least some of the people taking the drug.
- the Partner may request that the HAPTM Company obtain, for each person experiencing toxicity or other adverse effect, the haplotypes for one or more genes which are suspected to be associated with the observed toxicity or adverse effect (e.g., a gene or genes associated with liver failure) and determine whether there is a correlation between haplotype and the observed toxicity or adverse effect.
- the Partner may decide to keep all people having the haplotype correlated with toxicity or other adverse effect out of Phase II clinical trials, or to allow such people to enter Phase II clinical trials, but be monitored more closely and/or given conjunctive therapy to modify the toxicity or other adverse effect.
- the HAPTM Company may provide a diagnostic test, or have such a test prepared, which will detect the people which have, or lack, the haplotype correlated with toxicity or other adverse effect.
- a Partner may desire haplotype information for haplotypes of a gene, and/or one or more clones containing isogenes of the gene, in particular when the results of the trial are ambiguous.
- the results of a Phase II clinical trial might indicate that 50% of the people given a drug were responders (e.g., they lost weight in a trial for an anti-obesity drug, albeit to different degrees), 49.9% of people were non-responders (e.g., they did not lose any weight) and 0.1% had adverse effects.
- the Partner may, for example, request that the HAPTM Company obtain, for each of person in the Phase II clinical trial, the haplotypes for one or more genes which are suspected to be associated with the drug response. (In general, such gene(s) will be different from the gene associated with the adverse effect, but not necessarily.) A correlation may then be obtained between various haplotypes and the observed level of response to the drug. If a correlation is found, this information may be used to determine those individuals in which the drug will or will not be effective and, therefore, identify who should or should not get the drug. In addition, the information may also be used to develop a model (or test) which will predict, as a function of haplotype, how .
- the HAPTM Company may provide a diagnostic test, or have such a test prepared, which will detect the people which have, or lack, the haplotype correlated with the efficacy or non-efficacy of the drug.
- a Partner may desire haplotype information for isogenes of a gene, and/or one or more clones containing isogenes of the gene, in particular to use at the beginning of the trial to design cohorts of patients (i.e., a group of individuals which will be treated the same).
- the drug or placebo can be given to a group of people who have the same haplotype which is expected to be correlated with a good drug response
- the drug or placebo can be given to a group of people who have the same haplotype which is expected to be correlated with no drug response.
- the results of the trial will confirm whether or not the expected correlation between haplotype and drug response is correct.
- a Partner may desire haplotype information for a gene, and/or one or more clones containing isogenes of the gene, in particular if additional adverse events (or hidden side effects) become apparent.
- the methods described above can be used to identify people who are likely to experience such adverse events.
- a Partner may desire haplotype information for isogenes of a gene, and/or one or more isogene clones, in particular in the situation where the drug is what is known as a "me too" drug, i.e., there are already a number of drugs on the market used to treat the disease or other condition which the Partner's drug is designed to treat. This can be used, e.g., as a marketing or business development tool for the Partner and/or help health care providers, such as doctors and HMOs, to keep drug costs down.
- the haplotype information and analytical tools of the invention may be used to identify the patients for which the Partner's drug will work and/or for whom the Partner's drug will be superior to (or cheaper than) the other drugs on the market.
- a test can be developed to identify the target patients. This test can be diagnostic for the condition (e.g., it could distinguish asthma from a respiratory infection) or it could be diagnostic for response to the drug.
- the doctor. can perform the test in his office or other clinical setting and be able to prescribe the appropriate drug immediately, or after access to part or all of the database or analytical tools of the invention. This will also aid the doctor in that it may provide information about which drugs not to give, since they will not be effective in the patient.
- a Partner may desire haplotype information for isogenes, and/or one or more isogene clones containing isogenes of the gene, to correlate drug response with haplotype and to use as an aid in designing an additional clinical trial (or trials), as discussed elsewhere herein.
- the database and analytical tools of the invention are envisioned to be useful in a variety of settings, including various research settings, pharmaceutical companies, hospitals, independent or commercial establishments. It is expected users will include physicians (e.g., for diagnosing a particular disease or prescribing a particular drug) pharmaceutical companies, generics companies, diagnostics companies, contract research organizations and managed care groups, including HMOs, and even patients themselves.
- the MednosticsTM program is a program in which one company, i.e., the HAPTM Company, uses HAP Technology to analyze variation in response to drugs currently marketed by third parties, in the hope of conferring a competitive advantage on these companies. It is expected that this technology will provide pharmaceutical companies with information that could lead to the development of new indications for existing drugs, as well as second generation drugs designed to replace existing drugs nearing the end of their patent life. As a result, the Mednostics program will benefit pharmaceutical companies by allowing them to extend the patent life of existing drugs, revitalize drugs facing competition and expand their existing market. Entities such as HMOs and other third-party payers, as well as pharmacy benefit management organizations, may also benefit from the Mednostics program.
- An example of the MednosticsTM program involves the statin class of drugs, which are used to treat patients with high cholesterol and lipid levels and who are therefore at risk for cardiovascular disease.
- This is a highly competitive market with multiple approved products seeking to gain increased market share.
- three of the most commonly prescribed statins are pravastatin (sold by Bristol-Myers Squibb Company as Pravacol), atorvastatin (sold by Parke-Davis as Lipitor), and cerivastatin (sold by Bayer AG as Baycol).
- the statin market is currently approximately $11 billion worldwide and is forecasted to at least double in size by 2005. Identification of genetic markers that would allow the right drug to reach the right patient would allow a company to boost its market share and improve patient compliance, which are both particularly important factors when maximizing profit from drugs that are taken over the course of a lifetime.
- Step 1 Identify candidate genes.
- CYP2D6 is the sample candidate gene.
- Step 2 Define a Reference Population.
- a standard population is used.
- An example is the CEPH families and unrelated individuals whose cell lines are commercially available.
- Coriell sells cell lines from the CEPH families (a standard set of families from the United States and France for which cells lines are available for multiple members from several generations from several families) and from individuals from other ethnogeographic groups.
- the CEPH families have been widely studied.
- the cell lines were originally collected by Foundation Jean DAUSSET (http://landru.cephb.fr/).
- Step 3 DNA from this reference population is obtained.
- Step 4 Haplotype individuals in the reference population. We use either direct or indirect haplotyping methods, or a combination of both, to obtain haplotypes for the CYP2D6 gene in the reference population. The polymorphic sites and nucleotide positions for these individuals are given in FIGUREs 4A and 4B.
- Step 5 Get population averages and other statistics.
- the haplotypes and population distributions are shown using the DecoGenTM application in FIGURES 4A, 4B, 10, and 11. They are determined by the methods and equations described in Item 5 above.
- Step 6 Determine genotyping markers.
- Step 7 recruit a trial population.
- the reference population as the clinical population, having only added the simulated values of Test.
- Step 8 Treat, test and haplotype patients. All patients are measured for the Test variable. All of the patients were then genotyped at sites 2 and 8 (i.e. unphased haplotypes were found at these sites). Next their haplotypes are found directly (for those individuals who were totally homozygous or heterozygous at any one site) or inferred using maximum likelihood methods based on the observed haplotype frequencies in the reference population.
- Step 9 Find correlation's between haplotype pair and clinical outcome. We measure the value of Test.
- FIGURES 18, 19, and 22 The statistics for each of the sub-haplotype pair groups (using sites 2 and 8) is shown in FIGURES 18, 19, and 22. From this we see that individuals homozygous for TA at sites 2 and 8 have a high value of Test (average of 0.93). One conclusion we can make from this data is that patients homozygous for TA are likely to have an adverse reaction. A typical haplotype pair distribution is shown in detail in FIGURE 20.
- haplotype-pair or sub-haplotype-pair helps explain the observed variation in response in a statistically significant way. If ANOVA indicates that there is a significant group-to-group variation, then we can investigate this correlation further using the regression and clinical modeling tools. From FIGURE 23, we see that there is a significant level of group-to-group variation even at the 99% confidence level. This says that the haplotype-pair (or sub-haplotype-pair) that an individual has for this gene does have a significant impact on that individual's value of Test.
- Step 10 Follow-up trials are run. Additional trials should be run to accomplish 2 goals.
- the first would attempt to prove the correlation between being homozygous for haplotype TA and the high value of Test. One way to do this would be to enroll a group of subjects and break them into 4 cohorts.
- the first and second would be homozygous for TC.
- the second and third would have no copies of TC.
- the first and third group should take the medication causing the high value of Test and the second and fourth should take a placebo.
- Step 11 Design a genotyping method to identify a relevant set of patients. Using the Genotype view tool in the DecoGen browser, we found that by genotyping individuals at sites 2 and 8 we could classify the group with high value of Test with 100% certainty. The results are shown in FIGURE 14.
- DNA sequence information for a cohort of normal subjects was obtained and entered into the database as described previously. For this example, 134 patients, all of whom came to the clinic having an asthmatic attack, were recruited. Each patient had a standard spirometry workup upon entering the clinic, was given a standard dose of albuterol, and was given a followup spirometry workup 30 minutes later. Blood was drawn from each patient, and DNA was extracted from the blood sample for use in genotyping and haplotyping. Clinical data, in the form of the response of the asthmatic patients to a single dose of nebulized albuterol, was obtained from the asthmatic patients, as described previously (Yan, L., Galinsky, R.E., Bernstein, J.A., Liggett, S.B. & Weinshilboum, R.M. Pharmacogenetics , 2000, 10 :261-266)The clinical data was entered into the database, and displayed as in Fig. 29B.
- Haplotypes for ADBR2 were determined using a molecular genotyping protocol, followed by the computational HAPBuilder procedure (See U.S. patent application serial No. 60/198,340 (inventors: Stephens, et al.), filed April 18, 2000). Comparison of the sequences resulted in the identification of thirteen polymorphic sites.
- the ADBR2 gene was selected from the screen shown in Fig. 26.
- the polymorphism and haplotype data for the ADBR2 gene among normal subjects was as displayed in Fig. 28. Only twelve different haplotypes were observed and/or inferred.
- Diplotype and haplotype data for the ADBR2 gene among the asthmatic patients was as displayed in Fig. 29A.
- each patient has zero, one, or two copies of a given nucleotide.
- SNP polymorphic site
- combinations of SNPs for any collection of two or more SNPs (i.e., a haplotype or sub-haplotype), a patient will have zero, one, or two alleles having that particular combination of SNPs.
- the measure of delta %FEV1 pred. was chosen as the clinical outcome value for which correlations with ADBR2 haplotypes were to be sought.
- Each individual SNP was statistically analyzed for the degree to which it correlated with "delta %FEV1 pred.”
- the analysis was a regression analysis, correlating the number of occurrences of the SNP in each subject's genome ( i . e . 0, 1, or 2), with the value of "delta %FEV1 pred.”
- the SNP and associated correlation data were stored without being displayed. Any SNP whose p value was greater than 0.1 was discarded, i . e ., it was not considered further in the process. All thirteen ADBR2 SNPs were selected and tested in turn. The individual SNPs at positions 3 and 9 passed the tight cut-off; these were saved for display in Fig. 39A. In addition, the SNP at position 11 passed the loose cut-off and was saved without display.
- Fig. 39A The results of the build-up process are shown in Fig. 39A, where the SNPs and sub-haplotypes that passed the tight cut-off are displayed along with the results of the regression analyses. It was discovered that the three-SNP subhaplotype **A*****A*G** has a p-value nearly identical to that of the full haplotype.
- Figure 21b shows the regression line (response as a function of number of copies of haplotype **A*****A*G**), indicating that the more copies of this marker a patient has, the lower the response.
- Each of the twelve haplotypes observed for the ADBR2 gene is analyzed for the degree to which it correlates with the value of delta %FEV1 pred. by a regression analysis, correlating the number of occurrences of the haplotype in the subject's genorne, i . e . 0, 1, or 2, with the value of the clinical measurement.
- a "tight cut-off" criterion is then applied to each haplotype in turn.
- a first haplotype is selected, and its correlation with delta %FEV1 pred. is tested against the tight cut-off of 0.05. If the value is .05 or less, the haplotype and associated correlation data are stored for later calculations and for display in the screen shown in Fig. 39A. If the p value is between .05 and 0.1, the haplotype and associated correlation data are stored as well but are not displayed. Any haplotype whose p value is greater than 0.1 is discarded, i . e ., it is not considered further in the process. All twelve ADBR2 haplotypes are selected and tested in turn.
- all possible sub-haplotypes in which a single SNP is masked are generated by systematically masking each SNP of all saved haplotypes.
- the correlations of the newly generated sub-haplotypes with the clinical outcome value are calculated by regression, as was done for the haplotypes themselves.
- Each newly generated sub-haplotype is tested against the tight and loose cut-offs as described above for the haplotype correlations, discarding sub-haplotypes that do not pass the cut-off criteria and saving those that do pass.
- a second generation of sub-haplotypes having a two SNPs masked is generated from those of the first generation whose p-values passed the cut-offs. This is done, as before, by systematically masking each of the remaining SNPs.
- the p-values of the second generation of sub-haplotypes, having two SNPs masked, are tested, and from those that pass the cut-offs a third generation having three SNPs masked is generated.
- Fig. 28A The frequencies for each of the twelve haplotypes of the ADBR2 gene were calculated and were found to be as shown in Fig. 28A (eleven of the twelve haplotypes are visible).
- an ambiguity score was calculated as follows: all pairs of genotypes [i,j] that were rendered identical by imposition of the mask were noted, and the geometric mean of their Hardy-Weinberg frequencies ( f i and f j ) was calculated. For each mask, all the geometric means of the frequencies of all the ambiguous pairs were added together, and the sum was multiplied by 10 to obtain the ambiguity score for that mask:
- Fig. 34 Ambiguity scores calculated in this manner are shown in Fig. 34 to the right of each of the displayed masks, along with the genotype pairs rendered ambiguous by the mask. (The genotype numbers refer to the row numbers in the first column of the sorted genotype list.)
- Fig. 34 From the data visible in Fig. 34, it may be seen that one can mask sites 1, 6, 7, 8, and 10 (five of the thirteen polymorphic sites in the ADBR2 gene) with an ambiguity score of only 0.072. This mask (sixteenth mask from the top) renders four genotypes (sets of haplotype pairs) ambiguous, and three of the four ambiguities are between common and rare haplotype pairs. It is thus discovered that a savings of about 38% in the variable cost of haplotyping this gene can be achieved, simply by measuring eight rather than all thirteen known polymorphic sites, and that the complete haplotype can be inferred with high confidence from this smaller data set.
Landscapes
- Life Sciences & Earth Sciences (AREA)
- Health & Medical Sciences (AREA)
- Physics & Mathematics (AREA)
- Engineering & Computer Science (AREA)
- Bioinformatics & Cheminformatics (AREA)
- Medical Informatics (AREA)
- Spectroscopy & Molecular Physics (AREA)
- Biophysics (AREA)
- Theoretical Computer Science (AREA)
- Evolutionary Biology (AREA)
- General Health & Medical Sciences (AREA)
- Bioinformatics & Computational Biology (AREA)
- Biotechnology (AREA)
- Genetics & Genomics (AREA)
- Proteomics, Peptides & Aminoacids (AREA)
- Analytical Chemistry (AREA)
- Chemical & Material Sciences (AREA)
- Molecular Biology (AREA)
- Bioethics (AREA)
- Databases & Information Systems (AREA)
- Data Mining & Analysis (AREA)
- Computer Vision & Pattern Recognition (AREA)
- Artificial Intelligence (AREA)
- Epidemiology (AREA)
- Evolutionary Computation (AREA)
- Public Health (AREA)
- Software Systems (AREA)
- Ecology (AREA)
- Physiology (AREA)
- Measuring Or Testing Involving Enzymes Or Micro-Organisms (AREA)
- Management, Administration, Business Operations System, And Electronic Commerce (AREA)
- Information Retrieval, Db Structures And Fs Structures Therefor (AREA)
Applications Claiming Priority (3)
| Application Number | Priority Date | Filing Date | Title |
|---|---|---|---|
| US14152199P | 1999-06-25 | 1999-06-25 | |
| US141521 | 1999-06-25 | ||
| EP00941722A EP1208421A4 (de) | 1999-06-25 | 2000-06-26 | Verfahren für erhaltung und anwendung von haplotype daten |
Related Parent Applications (1)
| Application Number | Title | Priority Date | Filing Date |
|---|---|---|---|
| EP00941722.1 Division | 2000-06-26 |
Publications (2)
| Publication Number | Publication Date |
|---|---|
| EP1233366A2 true EP1233366A2 (de) | 2002-08-21 |
| EP1233366A3 EP1233366A3 (de) | 2004-10-13 |
Family
ID=26075235
Family Applications (3)
| Application Number | Title | Priority Date | Filing Date |
|---|---|---|---|
| EP02007038A Withdrawn EP1233364A3 (de) | 1999-06-25 | 2000-06-26 | Verfahren zur herstellung und verwendung von Haplotype Daten |
| EP02007045A Withdrawn EP1233366A3 (de) | 1999-06-25 | 2000-06-26 | Verfahren zur herstellung und verwendung von Haplotype Daten |
| EP02007044A Withdrawn EP1233365A3 (de) | 1999-06-25 | 2000-06-26 | Verfahren zur herstellung und verwendung von Haplotype Daten |
Family Applications Before (1)
| Application Number | Title | Priority Date | Filing Date |
|---|---|---|---|
| EP02007038A Withdrawn EP1233364A3 (de) | 1999-06-25 | 2000-06-26 | Verfahren zur herstellung und verwendung von Haplotype Daten |
Family Applications After (1)
| Application Number | Title | Priority Date | Filing Date |
|---|---|---|---|
| EP02007044A Withdrawn EP1233365A3 (de) | 1999-06-25 | 2000-06-26 | Verfahren zur herstellung und verwendung von Haplotype Daten |
Country Status (1)
| Country | Link |
|---|---|
| EP (3) | EP1233364A3 (de) |
Cited By (1)
| Publication number | Priority date | Publication date | Assignee | Title |
|---|---|---|---|---|
| CN104881582A (zh) * | 2015-05-28 | 2015-09-02 | 象辑知源(武汉)科技有限公司 | 空气质量的预测方法和装置 |
Families Citing this family (4)
| Publication number | Priority date | Publication date | Assignee | Title |
|---|---|---|---|---|
| US20040265874A1 (en) * | 2000-10-17 | 2004-12-30 | Bio-Rad Laboratories, Inc. | Pattern recognition method for diagnosis of systemic autoimmune diseases |
| WO2004097712A2 (en) * | 2003-04-28 | 2004-11-11 | Applera Corporation | Methodology and graphical user interface to visualize genomic information |
| EP1880332A4 (de) * | 2005-04-27 | 2010-02-17 | Emiliem | Neuartige verfahren und einrichtungen zur einstufung von giftstoffen |
| CN110444251B (zh) * | 2019-07-23 | 2023-09-22 | 中国石油大学(华东) | 基于分支定界的单体型格局生成方法 |
Family Cites Families (2)
| Publication number | Priority date | Publication date | Assignee | Title |
|---|---|---|---|---|
| AU2734197A (en) * | 1996-04-19 | 1997-11-12 | Spectra Biomedical, Inc. | Correlating polymorphic forms with multiple phenotypes |
| EP0892068A1 (de) * | 1997-07-18 | 1999-01-20 | Genset Sa | Verfahren zur Herstellung einer genetischen Karte des menschlichen Genoms mit hoher Dichte, basierend auf Linkage Disequilibrium |
-
2000
- 2000-06-26 EP EP02007038A patent/EP1233364A3/de not_active Withdrawn
- 2000-06-26 EP EP02007045A patent/EP1233366A3/de not_active Withdrawn
- 2000-06-26 EP EP02007044A patent/EP1233365A3/de not_active Withdrawn
Non-Patent Citations (3)
| Title |
|---|
| BELL R ET AL: "Systematic screening of the LDL-PLA2 gene for polymorphic variants and case-control analysis in schizophrenia." BIOCHEMICAL AND BIOPHYSICAL RESEARCH COMMUNICATIONS. 29 DEC 1997, vol. 241, no. 3, 29 December 1997 (1997-12-29), pages 630-635, XP002292316 ISSN: 0006-291X * |
| LAYTON M A ET AL: "The therapeutic response to D-penicillamine in rheumatoid arthritis: influence of glutathione S-transferase polymorphisms" RHEUMATOLOGY, OXFORD UNIVERSITY PRESS, LONDON, GB, vol. 38, no. 1, January 1999 (1999-01), pages 43-47, XP002223865 ISSN: 1462-0324 * |
| WALLENSTEIN S ET AL: "LOGISTIC REGRESSION MODEL FOR ANALYZING EXTENDED HAPLOTYPE DATA" GENETIC EPIDEMIOLOGY, LISS, NEW YORK, NY, US, vol. 15, no. 2, 1998, pages 173-181, XP008033332 ISSN: 0741-0395 * |
Cited By (2)
| Publication number | Priority date | Publication date | Assignee | Title |
|---|---|---|---|---|
| CN104881582A (zh) * | 2015-05-28 | 2015-09-02 | 象辑知源(武汉)科技有限公司 | 空气质量的预测方法和装置 |
| CN104881582B (zh) * | 2015-05-28 | 2017-10-24 | 象辑知源(武汉)科技有限公司 | 空气质量的预测方法和装置 |
Also Published As
| Publication number | Publication date |
|---|---|
| EP1233365A2 (de) | 2002-08-21 |
| EP1233364A2 (de) | 2002-08-21 |
| EP1233366A3 (de) | 2004-10-13 |
| EP1233365A3 (de) | 2004-11-17 |
| EP1233364A3 (de) | 2004-11-10 |
Similar Documents
| Publication | Publication Date | Title |
|---|---|---|
| US7058517B1 (en) | Methods for obtaining and using haplotype data | |
| US6931326B1 (en) | Methods for obtaining and using haplotype data | |
| US20050191731A1 (en) | Methods for obtaining and using haplotype data | |
| US20040267458A1 (en) | Methods for obtaining and using haplotype data | |
| Taliun et al. | Sequencing of 53,831 diverse genomes from the NHLBI TOPMed Program | |
| CA3018186C (en) | Genetic variant-phenotype analysis system and methods of use | |
| US20200327956A1 (en) | Methods of selection, reporting and analysis of genetic markers using broad-based genetic profiling applications | |
| Mulligan et al. | GeneNetwork: a toolbox for systems genetics | |
| Denisov et al. | Consensus generation and variant detection by Celera Assembler | |
| Li et al. | Genotype imputation | |
| AU2002359549B2 (en) | Methods for the identification of genetic features | |
| US20030104453A1 (en) | System for pharmacogenetics of adverse drug events | |
| O’Daniel et al. | Whole-genome and whole-exome sequencing in hereditary cancer: impact on genetic testing and counseling | |
| WO2001080156A1 (en) | Method and system for determining haplotypes from a collection of polymorphisms | |
| US20030211501A1 (en) | Method and system for determining haplotypes from a collection of polymorphisms | |
| EP1233366A2 (de) | Verfahren zur herstellung und verwendung von Haplotype Daten | |
| Schaid et al. | Discovery of cancer susceptibility genes: study designs, analytic approaches, and trends in technology | |
| Young et al. | Recursive partitioning analysis of complex disease pharmacogenetic studies. I. Motivation and overview | |
| Zhu et al. | The analysis of ethnic mixtures | |
| Gampawar et al. | Analysis of Genome-Wide Association Studies | |
| Hoehe et al. | Genetic variation and pharmacogenomics: concepts, facts, and challenges | |
| Kazemi | Phenome-Wide and Genome-Wide Analyses in CLSA Biobank and Interactive Web-Based Platform for the Results Sharing | |
| Liao et al. | VarXOmics: a versatile web server for genomic data querying, analysis, and variant prioritization with multi-omics insights | |
| Leppert et al. | Nonsyndromic seizure disorders: epilepsy and the use of the internet to advance research | |
| Bhattacharya | GWAS as the Detective to Find Genetic Contribution |
Legal Events
| Date | Code | Title | Description |
|---|---|---|---|
| PUAI | Public reference made under article 153(3) epc to a published international application that has entered the european phase |
Free format text: ORIGINAL CODE: 0009012 |
|
| AC | Divisional application: reference to earlier application |
Ref document number: 1208421 Country of ref document: EP |
|
| AK | Designated contracting states |
Kind code of ref document: A2 Designated state(s): AT BE CH CY DE DK ES FI FR GB GR IE IT LI LU MC NL PT SE |
|
| AX | Request for extension of the european patent |
Free format text: AL;LT;LV;MK;RO;SI |
|
| RIN1 | Information on inventor provided before grant (corrected) |
Inventor name: XU, CHUANBO Inventor name: WINDEMUTH, ANDREAS K. Inventor name: JUDSON, RICHARD S. |
|
| TCNL | Nl: translation of patent claims filed |
Inventor name: XU, CHUANBO Inventor name: WINDEMUTH, ANDREAS K. |
|
| EL | Fr: translation of claims filed | ||
| DET | De: translation of patent claims | ||
| PUAL | Search report despatched |
Free format text: ORIGINAL CODE: 0009013 |
|
| AK | Designated contracting states |
Kind code of ref document: A3 Designated state(s): AT BE CH CY DE DK ES FI FR GB GR IE IT LI LU MC NL PT SE |
|
| AX | Request for extension of the european patent |
Extension state: AL LT LV MK RO SI |
|
| AKX | Designation fees paid | ||
| REG | Reference to a national code |
Ref country code: DE Ref legal event code: 8566 |
|
| STAA | Information on the status of an ep patent application or granted ep patent |
Free format text: STATUS: THE APPLICATION IS DEEMED TO BE WITHDRAWN |
|
| 18D | Application deemed to be withdrawn |
Effective date: 20050103 |