EP1145149B1 - Methods and system for efficient collection and storage of experimental data - Google Patents
Methods and system for efficient collection and storage of experimental data Download PDFInfo
- Publication number
- EP1145149B1 EP1145149B1 EP99958879A EP99958879A EP1145149B1 EP 1145149 B1 EP1145149 B1 EP 1145149B1 EP 99958879 A EP99958879 A EP 99958879A EP 99958879 A EP99958879 A EP 99958879A EP 1145149 B1 EP1145149 B1 EP 1145149B1
- Authority
- EP
- European Patent Office
- Prior art keywords
- database
- data
- container
- sub
- feature
- Prior art date
- Legal status (The legal status is an assumption and is not a legal conclusion. Google has not performed a legal analysis and makes no representation as to the accuracy of the status listed.)
- Expired - Lifetime
Links
- 238000000034 method Methods 0.000 title claims abstract description 99
- 238000000018 DNA microarray Methods 0.000 claims abstract description 26
- 150000001875 compounds Chemical class 0.000 claims abstract description 20
- 210000004027 cell Anatomy 0.000 claims description 134
- 238000004458 analytical method Methods 0.000 claims description 39
- 238000013500 data storage Methods 0.000 claims description 27
- 238000003556 assay Methods 0.000 claims description 26
- 238000012545 processing Methods 0.000 claims description 19
- 239000000499 gel Substances 0.000 claims description 15
- 230000003287 optical effect Effects 0.000 claims description 7
- 238000012552 review Methods 0.000 claims description 2
- 210000000805 cytoplasm Anatomy 0.000 claims 4
- 238000012216 screening Methods 0.000 abstract description 31
- 238000013480 data collection Methods 0.000 abstract description 8
- 239000002547 new drug Substances 0.000 abstract description 5
- 238000010200 validation analysis Methods 0.000 abstract description 4
- 238000010586 diagram Methods 0.000 description 24
- 238000005259 measurement Methods 0.000 description 10
- 238000013537 high throughput screening Methods 0.000 description 8
- 108090000623 proteins and genes Proteins 0.000 description 8
- 108020004414 DNA Proteins 0.000 description 6
- 230000001413 cellular effect Effects 0.000 description 6
- 238000007726 management method Methods 0.000 description 6
- 239000002773 nucleotide Substances 0.000 description 6
- 125000003729 nucleotide group Chemical group 0.000 description 6
- 239000008186 active pharmaceutical agent Substances 0.000 description 5
- 230000000694 effects Effects 0.000 description 5
- 230000004044 response Effects 0.000 description 5
- 238000003491 array Methods 0.000 description 4
- 230000031018 biological processes and functions Effects 0.000 description 4
- 238000013523 data management Methods 0.000 description 4
- 238000005516 engineering process Methods 0.000 description 4
- 102000004169 proteins and genes Human genes 0.000 description 4
- 238000007405 data analysis Methods 0.000 description 3
- 239000003814 drug Substances 0.000 description 3
- 229940079593 drug Drugs 0.000 description 3
- 238000007876 drug discovery Methods 0.000 description 3
- 230000006870 function Effects 0.000 description 3
- 238000003672 processing method Methods 0.000 description 3
- 238000012827 research and development Methods 0.000 description 3
- 230000008901 benefit Effects 0.000 description 2
- 230000004071 biological effect Effects 0.000 description 2
- 238000000423 cell based assay Methods 0.000 description 2
- 210000003850 cellular structure Anatomy 0.000 description 2
- 239000003153 chemical reaction reagent Substances 0.000 description 2
- 238000011161 development Methods 0.000 description 2
- 230000018109 developmental process Effects 0.000 description 2
- 238000009826 distribution Methods 0.000 description 2
- 239000000975 dye Substances 0.000 description 2
- 230000007613 environmental effect Effects 0.000 description 2
- 238000002474 experimental method Methods 0.000 description 2
- 238000001506 fluorescence spectroscopy Methods 0.000 description 2
- 239000007850 fluorescent dye Substances 0.000 description 2
- 230000003993 interaction Effects 0.000 description 2
- 150000002500 ions Chemical class 0.000 description 2
- 238000013507 mapping Methods 0.000 description 2
- 239000002207 metabolite Substances 0.000 description 2
- 238000002493 microarray Methods 0.000 description 2
- 230000002123 temporal effect Effects 0.000 description 2
- 238000012360 testing method Methods 0.000 description 2
- 230000000007 visual effect Effects 0.000 description 2
- 108091032973 (ribonucleotides)n+m Proteins 0.000 description 1
- 102000053602 DNA Human genes 0.000 description 1
- 102000004190 Enzymes Human genes 0.000 description 1
- 108090000790 Enzymes Proteins 0.000 description 1
- 239000002250 absorbent Substances 0.000 description 1
- 230000002745 absorbent Effects 0.000 description 1
- 238000013096 assay test Methods 0.000 description 1
- 239000005441 aurora Substances 0.000 description 1
- 239000000090 biomarker Substances 0.000 description 1
- 150000001720 carbohydrates Chemical class 0.000 description 1
- 235000014633 carbohydrates Nutrition 0.000 description 1
- 230000023402 cell communication Effects 0.000 description 1
- 238000007418 data mining Methods 0.000 description 1
- 238000013461 design Methods 0.000 description 1
- 238000012912 drug discovery process Methods 0.000 description 1
- 238000011156 evaluation Methods 0.000 description 1
- 230000005284 excitation Effects 0.000 description 1
- 238000000605 extraction Methods 0.000 description 1
- 102000034287 fluorescent proteins Human genes 0.000 description 1
- 108091006047 fluorescent proteins Proteins 0.000 description 1
- 125000000524 functional group Chemical group 0.000 description 1
- 239000007789 gas Substances 0.000 description 1
- 230000014509 gene expression Effects 0.000 description 1
- 238000003709 image segmentation Methods 0.000 description 1
- 238000003384 imaging method Methods 0.000 description 1
- 238000002955 isolation Methods 0.000 description 1
- 150000002632 lipids Chemical class 0.000 description 1
- 238000012423 maintenance Methods 0.000 description 1
- 239000012528 membrane Substances 0.000 description 1
- 238000000386 microscopy Methods 0.000 description 1
- 210000003463 organelle Anatomy 0.000 description 1
- 230000008569 process Effects 0.000 description 1
- 230000033300 receptor internalization Effects 0.000 description 1
- 230000009467 reduction Effects 0.000 description 1
- 238000011160 research Methods 0.000 description 1
- 229920002477 rna polymer Polymers 0.000 description 1
- 230000003595 spectral effect Effects 0.000 description 1
- 239000000126 substance Substances 0.000 description 1
- 230000009897 systematic effect Effects 0.000 description 1
- 231100000331 toxic Toxicity 0.000 description 1
- 230000002588 toxic effect Effects 0.000 description 1
- 230000009466 transformation Effects 0.000 description 1
Images


Classifications
-
- G—PHYSICS
- G06—COMPUTING; CALCULATING OR COUNTING
- G06V—IMAGE OR VIDEO RECOGNITION OR UNDERSTANDING
- G06V20/00—Scenes; Scene-specific elements
- G06V20/60—Type of objects
- G06V20/69—Microscopic objects, e.g. biological cells or cellular parts
-
- G—PHYSICS
- G01—MEASURING; TESTING
- G01N—INVESTIGATING OR ANALYSING MATERIALS BY DETERMINING THEIR CHEMICAL OR PHYSICAL PROPERTIES
- G01N15/00—Investigating characteristics of particles; Investigating permeability, pore-volume or surface-area of porous materials
- G01N15/10—Investigating individual particles
- G01N15/14—Optical investigation techniques, e.g. flow cytometry
- G01N15/1429—Signal processing
- G01N15/1433—Signal processing using image recognition
-
- G—PHYSICS
- G01—MEASURING; TESTING
- G01N—INVESTIGATING OR ANALYSING MATERIALS BY DETERMINING THEIR CHEMICAL OR PHYSICAL PROPERTIES
- G01N15/00—Investigating characteristics of particles; Investigating permeability, pore-volume or surface-area of porous materials
- G01N15/10—Investigating individual particles
- G01N15/14—Optical investigation techniques, e.g. flow cytometry
- G01N2015/1477—Multiparameters
-
- G—PHYSICS
- G01—MEASURING; TESTING
- G01N—INVESTIGATING OR ANALYSING MATERIALS BY DETERMINING THEIR CHEMICAL OR PHYSICAL PROPERTIES
- G01N15/00—Investigating characteristics of particles; Investigating permeability, pore-volume or surface-area of porous materials
- G01N15/10—Investigating individual particles
- G01N15/14—Optical investigation techniques, e.g. flow cytometry
- G01N2015/1497—Particle shape
-
- G—PHYSICS
- G01—MEASURING; TESTING
- G01N—INVESTIGATING OR ANALYSING MATERIALS BY DETERMINING THEIR CHEMICAL OR PHYSICAL PROPERTIES
- G01N35/00—Automatic analysis not limited to methods or materials provided for in any single one of groups G01N1/00 - G01N33/00; Handling materials therefor
- G01N35/00029—Automatic analysis not limited to methods or materials provided for in any single one of groups G01N1/00 - G01N33/00; Handling materials therefor provided with flat sample substrates, e.g. slides
- G01N2035/00099—Characterised by type of test elements
- G01N2035/00158—Elements containing microarrays, i.e. "biochip"
Definitions
- This invention relates to collecting and storing experimental data. More specifically, it relates to methods and system for efficient collection and storage of experimental data from automated feature-rich, high-throughput experimental data collection systems.
- feature-rich data includes data wherein one or more individual features of an object of interest (e.g., a cell) can be collected.
- object of interest e.g., a cell
- Identification, selection, validation and screening of new drug compounds is often completed at a nucleotide level using sequences of Deoxyribonucleic Acid ("DNA”), Ribonucleic Acid (“RNA”) or other nucleotides.
- DNA Deoxyribonucleic Acid
- RNA Ribonucleic Acid
- Genes are regions of DNA
- proteins are the products of genes. The existence and concentration of protein molecules typically help determine if a gene is “expressed” or “repressed” in a given situation.
- Responses of genes to natural and artificial compounds are typically used to improve existing drugs, and develop new drugs. However, it is often more appropriate to determine the effect of a new compound on a cellular level instead of a nucleotide level.
- Cells are the basic units of life and integrate information from DNA, RNA, proteins, metabolites, ions and other cellular components. New compounds that may look promising at a nucleotide level may be toxic at a cellular level. Florescence-based reagents can be applied to cells to determine ion concentrations, membrane potentials, enzyme activities, gene expression, as well as the presence of metabolites, proteins, lipids, carbohydrates, and other cellular components.
- live cell screening There are two types of cell screening methods that are typically used: (1) fixed cell screening; and (2) live cell screening.
- fixed cell screening initially living cells are treated with experimental compounds being tested. No environmental control of the cells is provided after application of a desired compound and the cells may die during screening.
- Live cell screening requires environmental control of the cells (e.g., temperature, humidity, gases, etc.) after application of a desired compound, and the cells are kept alive during screening.
- Fixed cell assays allow spatial measurements to be obtained, but only at one point in time. Live cell assays allow both spatial and temporal measurements to be obtained.
- the spatial and temporal frequency of chemical and molecular information present within cells makes it possible to extract feature-rich cell information from populations of cells. For example, multiple molecular and biochemical interactions, cell kinetics, changes in sub-cellular distributions, changes in cellular morphology, changes in individual cell subtypes in mixed populations, changes and sub-cellular molecular activity, changes in cell communication, and other types of cell information can be obtained.
- the disclosed cell screening system in particular comprises a computer means for receiving and processing digital data from a digital camera wherein the computer means includes a digital frame grabber for receiving the images from the camera, a display for user interaction and display of assay results, digital storage media for data storage and archiving and a means for control, acquisition, processing and display of results.
- Photographic images are typically collected using a digital camera.
- a single photographic image may take up as much as 512 Kilobytes ("KB") or more of storage space as is explained below. Collecting and storing a large number of photographic.images adds to the data problems encountered when using high throughput systems.
- KB Kilobytes
- Such automated feature-rich cell screening systems and other systems known in the art typically include microplate scanning hardware, fluorescence excitation of cells, fluorescence captive emission optics, a photographic microscopic with a camera, data collection, data Storage and data display capabilities.
- feature-rich cell screening see "High content fluorescence-based screening,” by Kenneth A. Guiliano, et al., Journal of Biomolecular Screening, Vol. 2, No. 4, pp. 249-259, Winter 1997, ISSN 1087-0571, "PTH receptor internalization,” Bruce R. Conway, et al., Journal of Biomolecular Screening, Vol. 4, No. 2, pp.
- ISSN 1087-0571 "Fluorescent-protein biosensors: new tools for drug discovery," Kenneth A. Giuliano and D. Lansing Taylor, Trends in Biotechnology, (“TIBTECH”), Vol. 16, No. 3, pp. 99-146. March 1998, ISSN 0167-7799.
- An automated feature-rich cell screening system typically automatically scans a microplate plate with multiple wells and acquires multi-color fluorescence data of cells at one or more instances of time at a pre-determined spatial resolution.
- Automated feature-rich cell screen systems typically support multiple channels of fluorescence to collect multi-color fluorescence data at different wavelengths and may also provide the ability to collect cell feature information on a cell-by-cell basis including such features as the size and shape of cells and sub-cellar measurements of organelles within a cell.
- bioinformatic techniques are used to address problems related to the collection, processing, storage, retrieval and analysis of biological information including cellular information.
- Bioinformatics is defined as the systematic development and application of information technologies and data processing techniques for collecting; analyzing and displaying data obtained by experiments, modeling, database searching, and instrumentation to make observations about biological processes.
- the need for efficient data management is not limited to feature-rich cell screening systems or to cell based arrays. Virtually any instrument that runs High Throughput Screening ("HTS”) assays also generate large amounts of data.
- HTS High Throughput Screening
- bio-chip is a stratum with hundreds or thousands of absorbent micro-gels fixed to its surface.
- a single bio-chip may contain 10,000 or more micro-gels.
- each micro-gel on a bio-chip is like a micro-test tube or a well in a microplate.
- a bio-chip provides a medium for analyzing known and unknown biological (e.g., nucleotides, cells, etc.) samples in an automated, high-throughput screening system.
- a microplate plate used for feature-rich screening typically includes 96 to 1536 individual wells.
- a "microplate” is a flat, shallow dish that stores multiple samples for analysis.
- a "well” is a small area in a microplate used to contain an individual sample for analysis.
- Each well may be divided into multiple fields.
- a "field” is a sub-region of a well that represents a field of vision (i.e., a zoom level) for a photographic microscope.
- Each well is typically divided into one to sixteen fields.
- Each field typically will have between one and six photographic images taken of it, each using a different light filter to capture a different wavelength of light for a different fluorescence response for desired cell components.
- a pre-determined number of cells are selected to analyze. The number of cells will vary (e.g., between ten and one hundred).
- For each cell multiple cell features are collected.
- the cell features may include features such as size, shape, etc. of a cell. Thus, a very large amount of data is typically collected for just one well on a single microplate.
- the data to be saved for a well can be estimated by number of cell feature records collected and the number of images collected.
- the number of images collected can be typically estimated by: (number of wells x number of fields x images per field).
- the current size of an image file is approximately 512 Kilobytes ("KB") of uncompressed data.
- KB Kilobytes
- the number of cell feature records can typically be estimated by: (number of wells x number of fields x cells per field x features per cell).
- Data collected from multiple wells on a microplate is typically formatted and stored on a computer system. The collected data is stored in format that can be used for visual presentation software, and allow for data mining and archiving using bioinformatic techniques.
- a megabyte is 2 20 or 1,048,576 bytes and is commonly interpreted as "one million bytes.”
- disk storage on a typical computer network may be in the range from about ten gigabytes ("GB") to about one-hundred GB of data storage.
- GB gigabyte
- 1024 MB 1024 MB
- microplate scan results information for one microplate can easily exceed about 1,000 database records per plate, and cell feature data and image data can easily exceed about 6,000,000 database records per plate.
- Most conventional databases used on personal computers can not easily store and manipulate such a large number of data records.
- waiting relatively long periods of time to open such a large database on a conventional computer personal computer to query and/or display data may severely affect the performance of a network and may quickly lead to user frustration or user dissatisfaction.
- the data storage system should provide a flexible and scalable repository of cell data that can be easily managed and allows data to be analyzed, manipulated and archived.
- One aspect of the present invention includes a method for collecting experimental data.
- the method includes collecting image and feature data from desired sub-containers within a container.
- the image and feature data is stored in multiple image and feature databases.
- Summary data calculated for the desired sub-containers and the container are stored in sub-container and container databases.
- Another aspect of the present invention includes a method for storing experimental data on a computer system.
- the method includes collecting image data and feature data from desired sub-containers in a container.
- the image and feature data is stored in multiple third databases comprising multiple database tables.
- Summary data calculated for desired sub-containers and the container is stored in a second database comprising multiple database tables.
- a first database is created that is a "pass-through" database.
- the first database includes a pass-through database table with links to the second database and links to the multiple third databases, but does not include any data collected from the container.
- Another aspect of the present invention includes a method for spooling experimental data off devices that collect the data to a number of different remote storage locations. Links in a pass-through database table in a first database are updated to reflect the new locations of second database and multiple third databases.
- Another aspect of the invention includes presenting the experimental data from a display application on a computer.
- the data presented by the display application is obtained from multiple databases obtained from multiple locations remote to the computer.
- the data displayed appears to be obtained from databases on local storage on the computer instead of from the remote locations.
- Another aspect of the invention includes a data storage system that provides virtually unlimited amounts of "virtual" disk space for data storage at multiple local and remote storage locations for storing experimental data that is collected.
- these methods and system may allow experimental data from high-throughput data collection systems to be efficiently collected, stored, managed and displayed.
- the methods and system can be used for, but is not limited to, storing managing and displaying cell image data and cell feature data collected from microplates including multiple wells or bio-chips including multiple micro-gels in which an experimental compound has been applied to a population of cells.
- the methods and system may provide a flexible and scalable repository of experimental data that can be easily managed and allows the data to be analyzed, manipulated and archived.
- the methods and system may improve the identification, selection, validation and screening of new experimental compounds (e.g., drug compounds).
- the methods and system may also be used to provide new bioinformatic techniques used to make observations about experimental data.
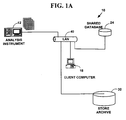
- FIG. 1A illustrates an exemplary data storage system 10 for preferred embodiments of the present invention.
- the exemplary data storage system 10 includes an analysis instrument 12, connected to a client computer 18, a shared database 24 and a data store archive 30 with a computer network 40.
- the analysis instrument 12 includes any scanning instrument capable of collecting feature-rich experimental data, such as nucleotide, cell or other experimental data, or any analysis instrument capable of analyzing feature-rich experimental data.
- feature-rich data includes data wherein one or more individual features of an object of interest (e.g., a cell) can be collected.
- the client computer 18 is any conventional computer including a display application that is used to lead a scientist or lab technician through data analysis.
- the shared database 24 is a multi-user, multi-view relational database that stores data from the analysis instrument 12.
- the data archive 30 is used to provide virtually unlimited amounts of "virtual" disk space with a multi-layer hierarchical storage management system.
- the computer network 40 is any fast Local Area Network ("LAN") (e.g., capable of data rates of 100 Mega-bit per second or faster).
- LAN Local Area Network
- Data storage system 10 can be used for virtually any system capable of collecting and/or analyzing feature-rich experimental data from biological and non-biological experiments.
- FIG. 1B illustrates an exemplary data storage system 10' for one preferred embodiment of the present invention with specific components.
- the data storage system 10' includes one or more analysis instruments 12, 14, 16, for collecting and/or analyzing feature-rich experimental data, one or more data store client computers, 18, 20, 22, a shared database 24, a data store server 26, and a shared database file server 28.
- a data store archive 30 includes any of a disk archive 32, an optical jukebox 34 or a tape drive 36.
- the data store archive 30 can be used to provide virtually unlimited amounts of "virtual" disk space with a multi-layer hierarchical storage management system without changing the design of any databases used to stored collected experimental data as is explained below.
- the data store archive 30 can be managed by an optional data archive server 38.
- Data storage system 10' components are connected by a computer network 40. However, more or fewer data store components can also be used and the present invention is not limited to the data storage system 10' components illustrated in FIG. 1B.
- data storage system 10' includes the following specific components. However, the present invention is not limited to these specific components and other similar or equivalent components may also be used.
- Analysis instruments 12, 14, 16, comprise a feature-rich array scanning system capable of collecting and/or analyzing experimental data such as cell experimental data from microplates, DNA arrays or other chip-based or bio-chip based arrays.
- Bio-chips include any of those provided by Motorola Corporation of Schaumburg, Illinois, Packard Instrument, a subsidiary of Packard BioScience Co. of Meriden, Connecticut, Genometrix, Inc. of Woodlands, Texas, and others.
- the one or more data store client computers, 18, 20, 22, are conventional personal computers that include a display application that provides a Graphical User Interface ("GUI") to a local hard disk, the shared database 24, the data store server 26 and/or the data store archive 30.
- GUI Graphical User Interface
- the GUI display application is used to lead a scientist or lab technician through standard analyses, and supports custom and query viewing capabilities.
- the display application GUI also supports data exported into standard desktop tools such as spreadsheets, graphics packages, and word processors.
- the data store client computers 18, 20, 22 connect to the store server 26 through an Open Data Base Connectivity ("ODBC") connection over network 40.
- ODBC Open Data Base Connectivity
- computer network 40 is a 100 Mega-bit (“Mbit”) per second or faster Ethernet, Local Area Network (“LAN”).
- Mbit Mega-bit
- LAN Local Area Network
- other types of LANs could also be used (e.g., optical or coaxial cable networks).
- the present invention is not limited to these specific components and other similar components may also be used.
- OBDC is an interface providing a common language for applications to gain access to databases on a computer network.
- the store server 26 controls the storage based functions plus an underlying Database Management System ("DBMS").
- DBMS Database Management System
- the shared database 24 is a multi-user, multi-view relational database that stores summary data from the one or more analysis instruments 12, 14, 16.
- the shared database 24 uses standard relational database tools and structures.
- the data store archive 30 is a library of image and feature database files.
- the data store archive 30 uses Hierarchical Storage Management ("HSM”) techniques to automatically manage disk space of analysis instruments 12, 14, 16 and the provide a multi-layer hierarchical storage management system.
- HSM Hierarchical Storage Management
- An operating environment for components of the data storage system 10 and 10' for preferred embodiments of the present invention include a processing system with one or more high-speed Central Processing Unit(s) (“CPU”) and a memory.
- CPU Central Processing Unit
- a memory for storing program code.
- acts and symbolically represented operations or instructions include the manipulation of electrical signals by the CPU.
- An electrical system represents data bits which cause a resulting transformation or reduction of the electrical signals, and the maintenance of data bits at memory locations in a memory system to thereby reconfigure or otherwise alter the CPU's operation, as well as other processing of signals.
- the memory locations where data bits are maintained are physical locations that have particular electrical, magnetic, optical, or organic properties corresponding to the data bits.
- the data bits may also be maintained on a computer readable medium including magnetic disks, optical disks, organic memory, and any other volatile (e.g., Random Access Memory (“RAM”)) or non-volatile (e.g., Read-Only Memory (“ROM”)) mass storage system readable by the CPU.
- RAM Random Access Memory
- ROM Read-Only Memory
- the computer readable medium includes cooperating or interconnected computer readable medium, which exist exclusively on the processing system or be distributed among multiple interconnected processing systems that may be local or remote to the processing system.
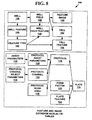
- FIG. 2 is a block diagram illustrating an exemplary array scan module 42 architecture.
- the array scan module 42 such as one associated with analysis instrument 12, 14, 16 (FIG. 1B) includes software/hardware that is divided into four functional groups or modules. However, more of fewer functional modules can also be used and the present invention is not limited to four functional modules.
- the Acquisition Module 44 controls a robotic microscope and digital camera, acquires images and sends the images to the Assay Module 46.
- the Assay Module 46 "reads" the images, creates graphic overlays, interprets the images collects feature data and returns the new images and feature data extracted from the images back to the Acquisition Module 44.
- the Acquisition Module 44 passes the image and interpreted feature data to the Data Base Storage Module 48.
- the Data Base Storage Module 48 saves the image and feature information in a combination of image files and relational database records.
- the store clients 18, 20, 22 use the Data Base Storage Module 48 to access feature data and images for presentation and data analysis by the Presentation Module 50.
- the Presentation Module 50 includes a display application with a GUI as was discussed above.
- a user can select a desired sub-set of the sub-containers in a container for analysis.
- image data is collected from the sub-container.
- the image data is stored in an image database.
- feature data is collected from the image data.
- the feature data is stored in a feature database.
- the image database and feature databases are combined into a single database comprising multiple tables including the image and feature data.
- the image database and feature databases are maintained as separate databases.
- sub-container summary data is calculated.
- the sub-container summary data is stored in a sub-container database.
- the sub-container database and the container database are combined into a single database comprising multiple tables including the sub-container and container summary data.
- the sub-container and container databases are maintained as separate databases.
- the loop continues at Step 58 (FIG. 3A) until the desired sub-containers within a container have been analyzed. After the desired sub-containers have been processed in the container, the loop at Step 58 ends.
- container summary data is calculated using sub-container summary data from the sub-container database.
- the container summary data is stored in the container database.
- Step 66 features from any imaging-based analysis system can be used.
- a digitized image including one or more objects (e.g., cells)
- object isolation in which a desired object is isolated from the rest of the image.
- feature extraction typically a function of one or more measurements, calculated so that it quantifies a significant characteristic of an object. Typical object measurements include size, shape, intensity, texture, location, and others.
- the "size” of an object can be represented by its area, perimeter, boundary definition, length, width, etc.
- the "shape” of an object can be represented by its rectangularity (e.g., length and width aspect ratio), circularity (e.g., perimeter squared divided by area, bounding box, etc.), moment of inertia, differential chain code, Fourier descriptors, etc.
- the "intensity” of an object can be represented by a summed average, maximum or minimum grey levels of pixels in an object, etc.
- the "texture” of an object quantifies a characteristic of grey-level variation within an object and can be represented by statistical features including standard deviation, variance, skewness, kurtosis and by spectral and structural features, etc.
- the "location" of an object can be represented by an object's center of mass, horizontal and vertical extents, etc. with respect to a pre-determined grid system.
- Each field typically will have between one and six photographic images taken of it, each using a different light filter to capture a different wavelength of light for a different fluorescence response for desired cell components.
- the present invention is not limited to such an embodiment, and other containers (e.g., varieties of biological chips, such as DNA chips, micro-arrays, and other containers with multiple sub-containers), sub-containers can also be used to collect image data and feature data from other than cells.
- a microplate with multiple wells is initialized using configuration information.
- the configuration information used for the microplate is stored in a microplate database.
- a loop is entered to repeat Steps 60, 62, 64, 66, 68, 70 and 72 for desired wells in the microplate.
- a well in the microplate is selected.
- cell image data is collected from the well.
- the cell image data includes digital photographic images collected with a digital camera attached to a robotic microscope. However, other types of cameras can also be used and other types of image data can also be collected.
- the cell image data is stored in an image database.
- the image database is a collection of individual image files. stored in a binary format (e.g., Tagged Image File Format ("TIFF"), Device-Independent Bit map (“DIB”) and others).
- TIFF Tagged Image File Format
- DIB Device-Independent Bit map
- the collection of individual image files may or may not be included in a formal database framework.
- the individual image files may exist as a collection of individual image files in specified directories that can be accessed from another database (e.g., a pass-through database).
- Step 66 cell feature data is collected from the cell image data.
- Step 66 includes collecting any of the cell feature data illustrated in Table 1.
- other feature data and other cell feature can also be collected and the present invention is not limited to the cell feature data illustrated in Table 1.
- Virtually any feature data can be collected from the image data.
- the cell feature data is stored in a cell feature database.
- the image database and cell feature databases are combined into a single database comprising multiple tables including the cell image and cell feature data.
- the image database (or image files) and feature databases are maintained as separate databases.
- well summary data is calculated using the image data and the feature data collected from the well.
- the well summary data calculated at Step 72 includes calculating any of the well summary data illustrated in Table 2.
- the present invention is not limited to the well summary data illustrated in Table 2, and the other sub-containers and other sub-container summary data can also be calculated. Virtually any sub-container summary data can be calculated for desired sub-containers.
- a "SPOT" indicates a block of fluorescent response intensity as a measure of biological activity.
- the well summary data is stored in a well database.
- the well database and the microplate database are combined into a single database comprising multiple tables including the well and microplate data.
- the well and microplate databases are maintained as separate databases.
- Step 58 After the desired wells have been processed in the microplate, the loop at Step 58 ends.
- summary data is calculated using well summary data from the microplate database.
- the microplate summary data is stored in the well database.
- the microplate summary data calculated at Step 74 includes calculating any of the microplate summary data illustrated in Table 3.
- the present invention is not limited to the microplate summary data illustrated in Table 3, and other container and other container summary data can also be calculated. Virtually any container summary data can be calculated for a container.
- "MEAN” indicates a statistical mean
- “STDEV” indicates a statistical standard deviation, known in the art
- a "SPOT” indicates a block of fluorescent response intensity as a measure of biological activity.
- cell assays are created using selected entries from Tables 1-3.
- a "cell assay” is a specific implementation of an image processing method used to analyze images and return results related to biological processes being examined. For more information on the image processing methods used in cell assays targeted to specific biological processes, see co-pending applications 09/031,217 and 09/352,171, assigned to the same Assignee as the present application.
- the microplate and well databases are stored in a single database comprising multiple tables called “SYSTEM.MDB.”
- the image and feature data for each well is stored in separate databases in the format "ID.MDB,” where ID is a unique identifier for a particular scan.
- ID.MDB the format "ID.MDB”
- the present invention is not limited to this implementation, and other types, and more or fewer databases can also be used.
- FIG. 4 is a flow diagram illustrating a Method 78 for storing collected experimental data.
- image data and feature data is collected from desired sub-containers in a container (e.g., with Method 52 of FIG. 3).
- a first database is created.
- the first database includes links to other databases but does not include any data collected from the container.
- the first database is used as a "pass-through" database by a display application to view data collected from a container.
- a first entry is created in the first database linking the first database to a second database.
- the second database includes configuration data used to collect data from the container, summary data for the container calculated from the desired sub-containers and summary data for the desired sub-containers in the container calculated from the image data and feature data.
- the information is organized in multiple database tables in the second database.
- multiple second entries are created in the first database linking the first database to multiple third databases.
- the multiple third databases include image data and feature data collected from the desired sub-containers in the container.
- the data is organized in multiple database tables in the third database.
- image data and feature data is collected from desired wells in a microplate using Method 52 of FIG. 3.
- Method 52 to collect experimental data and other methods can also be used.
- the present invention is not limited to collecting image data and feature data from wells in a microplate and other sub-containers and containers can also be used (e.g., bio-chips with multiple micro-gels).
- an application database is created.
- the application database includes links to other databases but does not include any data collected from the microplate.
- the application database is used by a display application to view data collected from a microplate.
- the application database may include actual data.
- FIG. 5 is a block diagram illustrating an exemplary database system 88 for Method 78 of FIG. 4.
- the database system 88 includes an application database 90, a system database 92 and multiple image and feature databases 94, 96, 98, 100.
- FIG. 5 illustrates only four image and feature databases numbered 1-N. However, the present invention is not limited to four image and features databases and typically hundreds or thousands of individual image and feature databases may actually be used. In addition the present invention is not limited to the databases or database names illustrated in FIG. 5 and more or fewer databases and other database names may also be used.
- a display application used to display and analyze collected experimental does not access over a few thousand records at one time. This is because there is no need for evaluation of microplate detail data information (e.g., image or cell feature database data) across microplates. Summary microplate information is stored in microplate, well, microplate feature and well feature summary tables to be compared across microplates. Detailed information about individual cells is accessed within the context of evaluating one microplate test. This allows a display application to make use of pass-through tables in the application database 90.
- microplate detail data information e.g., image or cell feature database data
- the application database 90 does not contain any actual data, but is used as a "pass-through" database to other databases that do contain actual data.
- a pass-through database includes links to other databases, but a pass-through database typically does not contain any actual database data.
- the application database 90 uses links to the system database 92 and the multiple image and feature databases 94, 96, 98, 100 to pass-through data requests to the application database 90 to these databases.
- the application database 90 may include some of the actual data collected, or summaries of actual data collected.
- the application database 90 is a Microsoft Access database, a Microsoft Structured Query Language ("SQL") database or Microsoft SQL Server by Microsoft of Redmond, Washington.
- SQL Microsoft Structured Query Language
- other databases such as Oracle databases by Oracle Corporation of Mountain View, California, could also be used for application database 90, and the present invention is not limited to Microsoft databases.
- a first pass-through database is not used at all.
- the first pass-through database is replaced by computer software that dynamically "directs" queries to/from the second and third databases without actually creating or using a first pass-through database.
- FIG. 6 is a block diagram illustrating an exemplary database table layout 102 for the application database 90 of FIG. 5.
- the database table layout 102 of FIG. 6 includes a first pass-through database entry 104 linking the application database 90 to the system database 92.
- the database table layout also includes multiple second pass through database entries 106, 108, 110, 112 linking the application database to multiple image and feature databases 94, 96, 98, 100.
- more or fewer types of database entries can also be used in the application database, and the present invention is not limited to two types of pass-through databases entries.
- the application database 92 may also include experimental data (not illustrated in FIG. 6).
- system database 92 is called "SYSTEM.MDB.”
- system database 92 may also be linked to other databases including microplate configuration and microplate summary data and is used in a pass-through manner as was described above for the application database.
- system database 92 is not linked to other databases, but instead includes actual microplate configuration and microplate summary data in multiple internal tables.
- the name of the system database 92 is not changed from microplate-to-microplate. In another preferred embodiment of the present invention, the name of the system database 92 is changed from microplate-to-microplate.
- a display application will refer to the system database 92 using its assigned name (e.g., SYSTEM.MDB) for microplate configuration and microplate summary data. Data stored in the system database 92 may be stored in linked databases so that the actual microplate container configuration and microplate summary data can be relocated without changing the display application accessing the system database 92.
- the actual database engine could be changed to another database type, such as a Microsoft SQL Server or Oracle databases by Oracle, or others without modifying the display application accessing the system database 92.
- FIG. 7 is a block diagram illustrating exemplary database tables 114 for the system database 92 of FIG. 5.
- the database table, 114 of FIG. 7 includes a plate table 116 that includes a list of plates being used.
- the plate table 116 is linked to a protocol table 118, a form factor table 122, a plate feature table 124 and a well table 126.
- the protocol table 118 includes protocol information.
- a protocol specifies a series of system settings including a type of analysis instrument, an assay, dyes used to measure biological markers cell identification parameters and other parameters used to collect experimental data. An assay is described below.
- the form factor table 122 includes microplate layout geometry.
- a standard 96-well microplate includes 12 columns of wells labeled 1 through 12 and 8 rows of wells labeled A through H for a total of 96.
- the plate feature table 124 includes a mapping of features to microplates.
- the form factor table 122 is liked to the manufacturer table 120.
- the manufacturer table 120 includes a list microplate manufactures and related mircoplate information.
- the well table 126 includes details in a well.
- a well is a small area (e.g., a circular area) in a microplate used to contain cell samples for analysis.
- the protocol table 118 is linked to a protocol assay parameters table 128.
- an "assay” is a specific implementation of an image processing method used to analyze images and return results related to biological processes being examined.
- the protocol assay parameters table 128 is linked to an assay parameters table 130.
- the assay parameters table 130 include parameters for an assay in use.
- the protocol table 118 is also linked to a protocol channel table 132.
- a protocol channel table 132 typically an assay will have two or more channels.
- a "channel" is a specific configuration of optical filters and channel specific parameters and is used to acquire an image.
- different fluorescent dyes are used to label different cell structures. The fluorescent dyes emit light at different wavelengths. Channels are used to acquire photographic images for different dye emission wavelengths.
- the protocol channel table 132 is linked to a protocol channel reject parameters table 134.
- the protocol channel reject parameters table 134 includes channel parameters used to reject images that do not meet the desired channel parameters.
- the protocol table 118 is also linked to a protocol scan area table 136.
- the protocol scan area table 136 includes methods used to scan a well.
- the protocol scan area table 136 is linked to a system table 138.
- the system table 138 includes information configuration information and other information used to collect experimental data.
- the well table 126 is linked to a well feature table 140.
- the well feature table 140 includes mapping of cell features to wells.
- the well feature table 140 is linked to a feature type table 142.
- the feature type table 142 includes a list of features (e.g., cell features) that will be collected.
- features e.g., cell features
- more or fewer tables can also be used, more or fewer links can be used to link the tables, and the present invention is not limited to the tables described for the system database 92.
- multiple second entries are created in the application database 92 linking the application database 92 to multiple image and feature databases 94, 96, 98, 100.
- the multiple image and feature databases include image data and feature data collected from the desired wells in the microplate. The data is organized in multiple database tables in the image and feature databases.
- names of image and feature databases 94, 96, 98, 100 that contain the actual image and feature data are changed dynamically from microplate-to-microplate. Since the image and feature data will include many individual databases, an individual image and feature database is created when a microplate record is created (e.g., in the plate table 116 (FIG. 7) in the system database 92 (FIG. 5)) and has a name that is created by taking a plate field value and adding ".MDB" to the end.
- a record in a plate table 116 with a field identifier of "1234569803220001" will have it's data stored in a image and feature database with the name "1234569803220001.MDB").
- other names can also be used for the image and feature databases and the present invention is not limited to the naming scheme using a field identifier from the plate table 116.
- FIG. 8 is a block diagram illustrating exemplary database tables 144 for image and feature databases 94, 96, 98, 100 of FIG. 5.
- the image and feature databases for a microplate include tables to hold image and feature data and a copy of the tables It 6-142 (FIG. 7) excluding the manufacturer table 120 and the system table 138 used for the system database 92.
- the image and feature databases 94, 96, 98, 100 include a copy or all of the tables 116-142 (FIG. 7).
- the image and feature databases 94, 96, 98, 100 do not include a copy of the tables 116-142 (FIG. 7) used for the system database 92.
- having a copy of the system database 92 tables in the image and feature databases allows individual image and feature databases to be archived and copied to another data storage system for later review and thus aids analysis.
- the image and feature databases 94, 96, 98, 100, tables 144 include a well field table 146 for storing information about fields in a well.
- the well field table 146 is linked to a well feature table 148 that includes information a list of features that will be collected from a well.
- the well field table 146 is also linked to a feature image table 150 that includes a list of images collected from a well and a cell table 152 that includes information to be collected about a cell.
- the cell table 152 is linked to a cell feature table 154 that includes a list of features that will be collected from a cell.
- more or fewer tables can also be used, more or fewer links can be used to link the tables, and the present invention is not limited to the tables described for the image and feature databases.
- the analysis instruments modules 12, 14, 16 generate a large amount of data including image data, feature data, and summary data for sub-containers and containers.
- the raw feature data values are stored as database files with multiple tables described above (e.g., FIG. 8).
- database files are managed using a hierarchical data management system.
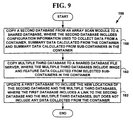
- FIG. 9 is a flow diagram illustrating a Method 156 for spooling experimental data.
- a second database is copied from an analysis instrument to a shared database.
- the second database includes configuration data used to collect data from a container, summary data for the container calculated from one or more sub-containers in the container and summary data for sub-containers in the container calculated from image data and feature data collected from desired sub-containers.
- the data in the second database is organized into one or more database tables.
- multiple third databases are copied to a shared database file server.
- the multiple third databases include image data and a feature data collected from the desired sub-containers in the container.
- the data in the third database is organized into one or more database tables.
- a location of the second database and the one or more third databases is updated in a first database on the analysis instrument to reflect new storage locations for the second database on the shared database and one or more third databases on the shared database file server.
- the first database includes links to the second database and the one or more third databases but does not include any data collected from the container.
- the first database is used by a display application to view data collected from a container.
- Method 156 further comprises copying the first database from the analysis instruments 12, 14, 16 to a store client computers 18, 20, 22.
- Such an embodiment allows a display application on the store client computers 18, 20, 22 to view the data collected from the container using the first database copied to local storage on the client computers 18, 20, 22.
- Method 156 further comprises locating the first database on the analysis instruments 12, 14, 16 from store client computers 18, 20, 22.
- Such an embodiment allows a display application on the store client computers 18, 20, 22 to view the data collected from the container at a remote location on the exemplary data storage system 10' from the store client computers 18, 20, 22.
- the data collected is viewed from the display application on the store client computers 18, 20, 22 by retrieving container and sub-container data from the second database on the shared database 24 and image and feature data from the multiple third databases on the shared database file server 28.
- a location of the system database 92 and the one or more image and feature databases 94, 96, 98, 100 is updated in an application database 90 (FIG. 6) on the analysis instrument 12, 14, 16 to reflect new storage locations for the system database 92 on the store database 24 and one or more image and feature databases 94, 96, 98, 100 on the store archive 28.
- the application database 90 is a pass-through database that includes links (e.g., FIG. 6) to the system database 92 and the one or more image and feature databases 94, 96, 98, 100 but does not include any data collected from the microplate.
- the application database 90 includes data from the microplate.
- the application database 92 is used by a display application to view data collected from a microplate.
- the present invention is not limited to this embodiment and other containers, sub-containers, (e.g., bio-chips with multiple micro-gels) and databases can also be used.
- an analysis instrument 12, 14, 16 can generate a huge amount of experimental data. To be useful, the experimental data has to be visually presented to a scientist or technician for analysis.
- FIG. 11 is a flow diagram illustrating a Method 178 for presenting experimental data.
- a list including one or more containers is displayed using a first database from a display application on a computer.
- the containers include multiple sub-containers. Image data and feature data was collected from the one or more containers.
- the first database is a pass-through database including links to other databases with experimental data.
- a first selection input is received on the display application for a first container from the list.
- a second database is obtained for the first container from a first remote storage location. The first remote location is remote to the computer running the display application.
- the second database includes configuration data used to collect data from the first container, summary data for the first container calculated from the sub-containers in the first container and summary data for desired sub-containers in the first container calculated from image data and feature data collected from desired sub-containers.
- a second selection input is received on the display application for one or more sub-containers in the first container.
- multiple third databases are obtained from a second remote storage location. The multiple third databases include image data and feature data collected from the one or more sub-containers in the first container.
- a graphical display is created from the display application including container and sub-container data from the second database, image data and feature data from the multiple third databases collected from the one or more sub-containers. Data displayed on the graphical display will appear to be obtained from local storage on the computer instead of the first remote storage location and the second remote storage location.
- Method 178 is used for displaying experimental data collected from microplates with multiple wells.
- the present invention is not limited to this embodiment and can be used for other containers and sub-containers besides microplates with multiple wells (e.g., bio-chips with multiple micro-gels).
- a list including multiple microplates is displayed from a display application on a computer.
- the microplates include multiple wells. Cell image data and cell feature data were collected from the multiple microplates.
- the display application uses an application database 90 to locate other databases, including experimental data.
- the application database 90 is located on the exemplary data storage system 10' at a location remote from the computer including the display application.
- the application database 90 is used from the computer including the display application without copying the application database 90 from a remote location on the exemplary data storage system 10'.
- the application database 90 is copied from a location on the exemplary data storage system 10' to local storage on the computer including the display application.
- the application database 90 is copied to, and exists on the computer including the display application.
- a first selection input is received on the display application for a first microplate from the list.
- a system database 92 is obtained for the first microplate from a first remote storage location.
- the first remote storage location is remote to the computer running the display application.
- the system database 92 includes configuration data used to collect data from the first microplate summary data for the first microplate calculated from the wells in the first microplate and summary data for desired wells in the first microplate calculated from image data and feature data collected from desired wells.
- a second selection input is received on the display application for one or more wells in the first microplate.
- multiple image and feature databases 94, 96, 98, 100 are obtained from a second remote storage location.
- the multiple image and feature databases 94, 96, 98, 100 include image data and feature data collected from the one or more wells in the first microplate.
- a graphical display is created from the display application including microplate and well summary data from the system database 92, image data and feature data from the multiple image and feature databases 94, 96, 98, 100 collected from the one or more wells. Data displayed on the graphical display appears to be obtained from local storage on the computer instead of the first remote storage location and the second remote storage location.
- FIG. 12 is a block diagram illustrating an exemplary screen display 192 for visually displaying experimental data from a display application.
- the screen display 192 includes a display of multiple sub-containers 194 in a container 196.
- the screen display 192 also includes container summary data 198, sub-container summary data 200, image data 202, and feature data 204.
- the screen display 192 is capable of displaying the data in both graphical formats and textual formats depending on user preferences. A user can select his/her display preferences from menus created by the display application (Not illustrated in FIG. 12).
- Screen display 192 illustrates exemplary data for sub-container A-3 illustrated by the blacked sub-container 206 in the container 196.
- Experimental data collected from a container is visually presented to a scientist or lab technician for analysis using Method 178 and screen display 192 with a pass-through database with multiple links to multiple databases from multiple remote locations.
- a Store Application Programming Interface (“API") is provided to access and use the methods and system described herein.
- API is set of interface routines used by an application program to access a set of functions that perform a desired task.
- the store API is stored in a Dynamic Link Library ("DLL") used with the Windows 95/98/NT/2000 operating system by Microsoft.
- the DLL is called "mvPlateData.DLL”
- the present invention is not limited to storing an API in a Window's DLL or using the described name of the DLL and other methods and names can also be used to store and use the API.
- a DLL is library that allows executable routines to be stored and to be loaded only when needed by an application.
- the Store API in a DLL is registered with the Window's "REGSVR32.EXE” application to make it available to other applications.
- the Store API provides an interface access to plate, well image and cell feature information and provides a facility to enter desired well feature information that will be collected.
- the methods and system described herein may allow experimental data from high-throughput data collection/analysis systems to be efficiently collected, stored, managed and displayed.
- the methods and system can be used for, but is not limited to storing managing and displaying cell image data and cell feature data collected from microplates including multiple wells or bio-chips including multiple micro-gels in which an experimental compound has been applied to a population of cells. If bio-chips are used, any references to microplates herein, can be replaced with bio-chips, and references to wells in a microplate can be replaced with micro-gels on a bio-chip and used with the methods and system described.
- the methods and system may provide a flexible and scalable repository of cell data that can be easily managed and allows cell data to be analyzed, manipulated and archived.
- the methods and system may improve the identification, selection, validation
Landscapes
- Engineering & Computer Science (AREA)
- Multimedia (AREA)
- Biomedical Technology (AREA)
- Theoretical Computer Science (AREA)
- General Health & Medical Sciences (AREA)
- Molecular Biology (AREA)
- Physics & Mathematics (AREA)
- General Physics & Mathematics (AREA)
- Health & Medical Sciences (AREA)
- Life Sciences & Earth Sciences (AREA)
- Information Retrieval, Db Structures And Fs Structures Therefor (AREA)
- Apparatus Associated With Microorganisms And Enzymes (AREA)
- Automatic Analysis And Handling Materials Therefor (AREA)
- Management, Administration, Business Operations System, And Electronic Commerce (AREA)
- Medical Treatment And Welfare Office Work (AREA)
- Measuring Or Testing Involving Enzymes Or Micro-Organisms (AREA)
- Monitoring And Testing Of Transmission In General (AREA)
- Investigating Or Analysing Biological Materials (AREA)
- Recording Measured Values (AREA)
Abstract
Description
The need for efficient data management is not limited to feature-rich cell screening systems or to cell based arrays. Virtually any instrument that runs High Throughput Screening ("HTS") assays also generate large amounts of data. For example, with the growing use of other data collection techniques such as DNA arrays, bio-chips, microscopy, micro-arrays, gel analysis, the amount of data collected, including photographic image data is also growing exponentially. As is known in the art, a "bio-chip" is a stratum with hundreds or thousands of absorbent micro-gels fixed to its surface. A single bio-chip may contain 10,000 or more micro-gels. When performing an assay test, each micro-gel on a bio-chip is like a micro-test tube or a well in a microplate. A bio-chip provides a medium for analyzing known and unknown biological (e.g., nucleotides, cells, etc.) samples in an automated, high-throughput screening system.


Claims (43)
- A method of collecting experimental data on a computer system, comprising the steps of :initializing a container, using configuration information wherein the container includes a plurality of sub-containers;storing configuration information used for the container in a container database;repeating steps (a)-(g) for desired sub-containers in the container:(a) selecting an individual sub-container in the container,(b) collecting a plurality of image data from the sub-container,(c) storing the plurality of image data in an image database,(d) collecting a plurality of feature data from the image data,(e) storing the plurality of feature data in a feature database,(f) calculating a plurality of sub-container summary data using the plurality of image data and the plurality of feature data collected from the sub-container, and(g) storing the plurality of sub-container summary data in a sub-container database;(h) calculating a plurality of container summary data using the plurality of sub-container summary data from the sub-container database;(i) storing the plurality of container summary data in the container database;(j) storing the container database data and the sub-container database data in a second database on a shared database;(k) storing the image database and the feature database data in a plurality of third databases on a shared database file server; and(l) creating links in a first database to the second database and the plurality of third databases, wherein the first database includes links to the second database and the plurality of third databases but does not include any data collected from the container, and wherein the first database is used by a display application to view data collected from a container.
- A computer readable medium having stored therein instructions for causing a central processing unit to execute the method of Claim 1.
- The method of Claim 1 wherein the plurality of sub-containers include a plurality of cells treated with an experimental compound
- The method of Claim 1 wherein the container includes a microplate, and the plurality of sub-containers includes wells in a microplate.
- The method of Claim 1 wherein the container database includes microplate data, the sub-container database includes well data, the image database includes photographic image data and the feature database includes cell feature data.
- The method of Claim 1 wherein the step of collecting a plurality of feature data from the image data includes collecting any of size, shape, intensity, texture, location, area, perimeter, shape factor, equivalent diameter, length, width, integrated fluorescence intensity, mean fluorescence intensity, variance, skewness, kurtosis, minimum fluorescence intensity, maximum fluorescence intensity, geometric center, an X-coordinate of a geometric center or a Y-coordinate of a geometric center for cells.
- The method of claim 1 wherein the step of calculating a plurality of sub-container summary data includes calculating any of: sizes, shapes, intensities, textures locations, nucleus area, spot count, aggregate spot area, average spot area, minimum spot area, maximum spot area, aggregate spot intensity, average spot intensity, minimum spot intensity, maximum spot intensity, normalized average spot intensity, normalized spot count, number of nuclei, nucleus aggregate intensity dye area, dye aggregate intensity, nucleus intensity, cytoplasm intensity, difference between nucleus intensity and cytoplasm intensity, nucleus area, cell count, nucleus box-fill ration, nucleus perimeter squared area or nucleus height/width ratio.
- The method of claim 1 wherein the step of calculating a plurality of container summary data includes calculating any of: mean size, mean shape, mean intensity, mean texture, locations of cells, number of cells, number of valid fields, standard deviation of nucleus area, mean spot count, standard deviation of spot count, mean aggregate spot area, standard deviation of aggregate spot area, mean average spot area, standard deviation of average spot area, mean nucleus area, mean nucleus aggregate intensity, standard deviation of nucleus intensity, mean dye area, standard deviation of dye area, mean dye aggregate intensity, standard deviation of aggregate dye intensity, mean of minimum spot area, standard deviation of minimum spot area, mean of maximum spot area, standard deviation of maximum spot area, mean aggregate spot intensity, standard deviation of aggregate spot intensity, mean average spot intensity, nuclei intensities, cytoplasm intensities, difference between nuclei intensities and cytoplasm intensities, nuclei areas, nuclei box-fill ratios, nuclei perimeter squared areas, nucleus height/width ratios, well cell counts.
- The method of Claim 1 wherein the container includes a bio-chip and the plurality of sub-containers include selected micro-gels on the bio-chip.
- The method of Claim 1 wherein the shared database includes faster access local storage.
- The method of Claim 1 wherein the shared database file server includes slower access remote storage.
- The method of Claim 1 further comprising the steps of:creating a first entry in the first database linking the first database to a second database, wherein the first database is used as a pass-through database by a display application to view data collected from a container, wherein the second database includes configuration data used to collect data from the container, summary data for the container calculated from the plurality of sub-containers and summary data for sub-containers in the container calculated from the plurality of image data and plurality of feature data, and wherein the data in the second database is organized in a plurality of tables; andcreating a plurality of second entries in the first database linking the first database to a plurality of third databases, wherein the plurality of third databases include a plurality of image data and a plurality of feature data collected from the plurality of sub-containers in the container, and wherein the data in the plurality of third databases is organized in a plurality of tables.
- A computer readable medium having stored therein instructions for causing a central processing unit to execute the method of Claim 12.
- The method of Claim 12 wherein the plurality of sub-containers include a plurality of cells treated with an experimental compound.
- The method of Claim 12 wherein the container includes a microplate, and the plurality of sub-containers include wells in the microplate.
- The method of Claim 12 wherein the container includes a bio chip and the plurality of sub-containers include selected micro-gels on the bio-chip.
- The method of Claim 12 wherein the plurality of feature data includes a plurality of cell feature data for a plurality of cells in the sub-container and the plurality of image data includes a plurality of photographic images collected from the plurality of cells in a sub-container.
- The method of Claim 12 wherein the first database is a pass-through database and does not include any data collected from the container.
- The method of Claim 12 wherein the first database includes an application database comprising a plurality of pass-through tables Including a plurality of entries linking the application database to other databases.
- The method of Claim 12 wherein the second database includes a system database comprising a plurality of database tables including any of plate, protocol, protocol assay parameter, protocol scan area, assay parameters, protocol channel protocol channel reject parameters, manufacturer, form factor, plate feature, well, well feature, system or feature type database tables.
- The method of Claim 12 wherein a third database from the plurality of third databases is a plate database comprising a plurality of database tables including any of:well, well feature, feature type well field, well field feature, well field feature image, cell or cell feature tables.
- The method of Claim 21 wherein the third database from the plurality of third databases further includes any of plate, protocol, protocol assay parameter, protocol scan area, assay parameter, protocol channel, protocol channel reject parameter, manufacturer, form factor, plate feature, well system or feature type database tables so the third database can be archived and copied to another computer system for review without copying the second database to another computer system.
- The method of Claim 12 wherein the step of collecting a plurality of image data and a plurality of feature data from a plurality of sub-containers in a container comprises the steps of:initializing a container using configuration information;storing configuration information used for the container in the second database;repeating steps (a)-(g) for desired sub-containers in the container:(a) selecting an individual sub-container in the container,(b) collecting a plurality of image data from the image data,(c) storing the plurality of image data in one of a plurality of third databases,(d) collecting a plurality of feature data from the image data,(e) storing the plurality of feature data in one of the plurality of third databases,(f) calculating a plurality of sub-container summary data using the plurality of image data and the plurality of feature data collected from the sub-container,(g) storing the plurality of sub-container summary data in the second database,(h) calculating a plurality of container summary data for the container using the plurality of sub-container information from the second database; and(i) storing the plurality of container summary data in the second database.
- The method of Claim 12 wherein the first database is stored on a personal computer, the second database is stored on a database server and the plurality of third databases are stored on a shared database file server.
- The method of Claim 12 wherein the step of collecting a plurality of image data and a plurality of feature data from a plurality of sub-containers in a container includes collecting a plurality of photographic image data and a plurality of cell feature data for a plurality of cells from a plurality of wells in a microplate for a pre-determined assay for an experimental compound.
- A method for spooling experimental data on a computer system, the method comprising the steps of:copying a second database from an analysis instrument to a shared database, wherein the second database includes configuration data used to collect data from a container, summary data for the container calculated from a plurality of sub-containers in the container and summary data for sub-containers in the container calculated from a plurality of image data and a plurality of feature data collected from desired sub-containers, and wherein the data in the second database is organized into a plurality of database tables;copying a plurality of third databases from an analysis instrument to a shared database file server, wherein the plurality of third databases include a plurality of image data and a plurality of feature data collected from the plurality of sub-containers in the container, and wherein the data is organized in a plurality of database tables; andupdating the location of the second database and the plurality of third databases in a first database on the analysis instrument to reflect new storage locations for the second database on the shared database and the plurality of third databases on the shared database file server, wherein the first database is a pass-through database that includes links to the second database and the plurality of third databases but does not include any data collected from the container, and wherein the first database is used by a display application to view data collected from a container.
- A computer readable medium having stored therein instructions for causing a central processing unit to execute instructions for the method of Claim 26.
- The method of Claim 26 further comprising:copying the first database from the analysis instrument to a local storage location on a store client computer to allow a display application on the store client computer to view the data collected from the container; andviewing the data collected from the display application on the store client computer by using the first database to retrieve container and sub-container data from the second database on the shared database and image and feature data from the plurality of third databases on the shared database file server.
- The method of Claim 26 further comprising:locating the first database from a store client computer at a remote location to allow a display application on the store client computer to view the data collected from the container; andviewing the data collected from the display application on the store client computer by using the first database at the remote location to retrieve container and sub-container data from the second database on the shared database and image and feature data from the plurality of third databases on the shared database file server.
- The method of Claim 26 wherein the container includes a microplate, and the plurality of sub-containers included wells in the microplate.
- The method of Claim 26 wherein the container includes a bio-chip and the plurality of sub-containers include selected micro-gels on the bio-chip.
- The method of Claim 26 wherein the plurality of sub-containers include a plurality of cells treated with an experimental compound.
- The method of claim 26 wherein the shared database includes faster access local storage.
- The method of Claim 26 wherein the shared database file server includes slower access remote storage.
- A method for presenting experimental data from a plurality of databases, comprising the steps of:wherein data displayed on the graphical display will appear to be obtained from local storage on the computer instead of the remote shared database or remote shared database file server.displaying a list including a plurality of containers using a first database from a display application on a computer, wherein the first database is a pass-through database that includes links to a second database and a plurality of third databases but does not include any data collected from the container, wherein the containers include a plurality of sub-containers, and wherein a plurality of image data and a plurality of feature data were collected from the plurality of containers;receiving a first selection input on the display application for a first container from the list including a plurality of containers;obtaining a second database for the first container from a remote shared database with the display application using links from the first database to the second database, wherein the second database includes configuration data used to collect data from the first container, summary data for the first container calculated from a plurality of sub-containers in the first container and summary data for desired sub-containers in the first container calculated from a plurality of image data and plurality of feature data collected from desired sub-containers;receiving a second selection input on the display application for one or more sub-containers in the first container;obtaining a plurality of third databases from a remote shared database file server with the display application using links from the first database to the plurality of third databases, wherein the plurality of third databases include a plurality of image data and a plurality of feature data collected from the one or more sub-containers in the first container;creating a graphical display from the display application including container and sub-container data from the second database, image data and feature data from the plurality of third databases collected from the one or more sub-containers,
- A computer readable medium having stored therein instructions for causing a central processing unit to execute the method of Claim 35.
- The method of Claim 35 wherein the container includes a microplate, and the plurality of sub-containers include wells in the microplate.
- The method of Claim 35 wherein the container includes a bio-chip and the plurality of sub-containers include selected micro-gels on the bio-chip.
- The method of Claim 35 wherein the plurality of sub-containers include a plurality of cells treated with an experimental compound.
- The method of claim 35 wherein the first remote storage location and the second remote storage location include any of: a shared database, a shared database file server, a disk archive, an optical jukebox, or a digital linear tape in a location remote to the computer including the display application.
- The method of Claim 35 wherein the second database includes a system database and wherein the plurality of third databases include a plurality of image and feature databases.
- The method of Claim 35 wherein the step of displaying a list including a plurality of containers using a first database from a display application on a computer includes locating the first database at a location remote to the computer and displaying a list from the display application on the computer using the first database at the remote location.
- A data storage system, comprising in combination:a shared database on a local area network for storing configuration data used for a microplate, summary data collected for a plurality of wells in a microplate and summary data for a microplate;a shared database file server on a local area network for storing image data and feature data collected from a plurality of wells in a microplate;a pass-through database with multiple links providing access to database files stored on the shared database, and the shared database file server, wherein the pass-through database does not include any data collected from the microplate and is used by a display application, on a computer to display experimental data from the database files;a second database, which includes configuration data used to collect data from a container, summary data for the container calculated from a plurality of sub-containers in the container and summary data for sub-containers in the container calculated from a plurality of image data and a plurality of feature data collected from desired sub-containers, wherein the data in the second database is organized into a plurality of database tables;a plurality of third databases, which include a plurality of image data and a plurality of feature data collected from the plurality of sub-containers in the container, wherein the data is organized in a plurality of database tables; andan application programming interface for providing a programming interface to the shared database, and the shared database file server.
Priority Applications (1)
| Application Number | Priority Date | Filing Date | Title |
|---|---|---|---|
| EP05002417.3A EP1533720A3 (en) | 1998-11-13 | 1999-11-10 | Methods and system for efficient collection and storage of experimental data |
Applications Claiming Priority (11)
| Application Number | Priority Date | Filing Date | Title |
|---|---|---|---|
| US10829198P | 1998-11-13 | 1998-11-13 | |
| US108291P | 1998-11-13 | ||
| US11064398P | 1998-12-01 | 1998-12-01 | |
| US110643P | 1998-12-01 | ||
| US14024099P | 1999-06-21 | 1999-06-21 | |
| US140240P | 1999-06-21 | ||
| US14264699P | 1999-07-06 | 1999-07-06 | |
| US14237599P | 1999-07-06 | 1999-07-06 | |
| US142646P | 1999-07-06 | ||
| US142375P | 1999-07-06 | ||
| PCT/US1999/026562 WO2000029984A2 (en) | 1998-11-13 | 1999-11-10 | Methods and system for efficient collection and storage of experimental data |
Related Child Applications (1)
| Application Number | Title | Priority Date | Filing Date |
|---|---|---|---|
| EP05002417.3A Division EP1533720A3 (en) | 1998-11-13 | 1999-11-10 | Methods and system for efficient collection and storage of experimental data |
Publications (2)
| Publication Number | Publication Date |
|---|---|
| EP1145149A2 EP1145149A2 (en) | 2001-10-17 |
| EP1145149B1 true EP1145149B1 (en) | 2005-04-06 |
Family
ID=27537209
Family Applications (1)
| Application Number | Title | Priority Date | Filing Date |
|---|---|---|---|
| EP99958879A Expired - Lifetime EP1145149B1 (en) | 1998-11-13 | 1999-11-10 | Methods and system for efficient collection and storage of experimental data |
Country Status (9)
| Country | Link |
|---|---|
| US (3) | US7467153B2 (en) |
| EP (1) | EP1145149B1 (en) |
| JP (3) | JP2002530748A (en) |
| AT (1) | ATE292822T1 (en) |
| AU (1) | AU1615600A (en) |
| CA (1) | CA2350587C (en) |
| DE (1) | DE69924645T2 (en) |
| IL (1) | IL142765A0 (en) |
| WO (1) | WO2000029984A2 (en) |
Cited By (1)
| Publication number | Priority date | Publication date | Assignee | Title |
|---|---|---|---|---|
| CN111372075A (en) * | 2020-02-28 | 2020-07-03 | 钱秀华 | Network image diagnosis method and device and image processing equipment |
Families Citing this family (40)
| Publication number | Priority date | Publication date | Assignee | Title |
|---|---|---|---|---|
| GB9722550D0 (en) * | 1997-10-24 | 1997-12-24 | Univ Southampton | Fabrication of optical waveguide gratings |
| US7151847B2 (en) | 2001-02-20 | 2006-12-19 | Cytokinetics, Inc. | Image analysis of the golgi complex |
| US6743576B1 (en) | 1999-05-14 | 2004-06-01 | Cytokinetics, Inc. | Database system for predictive cellular bioinformatics |
| US6651008B1 (en) | 1999-05-14 | 2003-11-18 | Cytokinetics, Inc. | Database system including computer code for predictive cellular bioinformatics |
| GB2365556B (en) * | 2000-08-04 | 2005-04-27 | Hewlett Packard Co | Gateway device for remote file server services |
| US7218764B2 (en) | 2000-12-04 | 2007-05-15 | Cytokinetics, Inc. | Ploidy classification method |
| WO2002065334A1 (en) * | 2001-02-14 | 2002-08-22 | Tibotec Bvba | Method and apparatus for providing an automated information management for high throughput screening |
| US7016787B2 (en) | 2001-02-20 | 2006-03-21 | Cytokinetics, Inc. | Characterizing biological stimuli by response curves |
| GB2389692B (en) | 2001-02-20 | 2005-06-29 | Cytokinetics Inc | Method and apparatus for automated cellular bioinformatics |
| US6956961B2 (en) | 2001-02-20 | 2005-10-18 | Cytokinetics, Inc. | Extracting shape information contained in cell images |
| US7751628B1 (en) * | 2001-12-26 | 2010-07-06 | Reisman Richard R | Method and apparatus for progressively deleting media objects from storage |
| US20050170356A1 (en) * | 2002-05-28 | 2005-08-04 | Fareed Kureshy | Multi-reagent pack |
| US20050014217A1 (en) | 2003-07-18 | 2005-01-20 | Cytokinetics, Inc. | Predicting hepatotoxicity using cell based assays |
| US7235353B2 (en) | 2003-07-18 | 2007-06-26 | Cytokinetics, Inc. | Predicting hepatotoxicity using cell based assays |
| GB2423988A (en) | 2003-07-18 | 2006-09-13 | Cytokinetics Inc | Characterizing biological stimuli by response curves |
| US7627617B2 (en) * | 2004-02-11 | 2009-12-01 | Storage Technology Corporation | Clustered hierarchical file services |
| EP1574988B1 (en) * | 2004-03-08 | 2014-06-18 | Siemens Product Lifecycle Management Software Inc. | Determining and using geometric feature data |
| WO2006001397A1 (en) * | 2004-06-25 | 2006-01-05 | National Institute Of Advanced Industrial Science And Technology | Cell network analysis system |
| US7323318B2 (en) | 2004-07-15 | 2008-01-29 | Cytokinetics, Inc. | Assay for distinguishing live and dead cells |
| US7697755B2 (en) * | 2004-09-29 | 2010-04-13 | Drvision Technologies Llc | Method for robust analysis of biological activity in microscopy images |
| US20060235741A1 (en) * | 2005-04-18 | 2006-10-19 | Dataforensics, Llc | Systems and methods for monitoring and reporting |
| US9274765B2 (en) * | 2005-05-12 | 2016-03-01 | Drawing Management, Inc. | Spatial graphical user interface and method for using the same |
| JP5037511B2 (en) | 2005-09-21 | 2012-09-26 | ルミネックス コーポレーション | Image data processing method and system |
| US20080155539A1 (en) * | 2006-12-20 | 2008-06-26 | Darland Edward J | Automated Data Processing Reconstruction System And Method |
| US8537165B2 (en) * | 2008-06-18 | 2013-09-17 | Roblox Corporation | Method and apparatus for automatic coalescence of connected rigid bodies |
| JP5346506B2 (en) * | 2008-06-30 | 2013-11-20 | 株式会社日立ソリューションズ | File management device |
| KR101268574B1 (en) * | 2009-11-03 | 2013-05-28 | 한국전자통신연구원 | Apparatus and method for estimating tag location |
| US9183255B1 (en) * | 2009-12-30 | 2015-11-10 | Teradata Us, Inc. | Spool management and checkpointing in a multi-database system |
| US8959300B2 (en) * | 2010-05-18 | 2015-02-17 | International Business Machines Corporation | Cascade ordering |
| US9665956B2 (en) * | 2011-05-27 | 2017-05-30 | Abbott Informatics Corporation | Graphically based method for displaying information generated by an instrument |
| US9432402B1 (en) * | 2011-09-06 | 2016-08-30 | Utility Associates, Inc. | System and method for uploading files to servers utilizing GPS routing |
| CA2852915C (en) | 2011-10-18 | 2018-05-15 | Luminex Corporation | Methods and systems for image data processing |
| US9268619B2 (en) | 2011-12-02 | 2016-02-23 | Abbott Informatics Corporation | System for communicating between a plurality of remote analytical instruments |
| US10776606B2 (en) * | 2013-09-22 | 2020-09-15 | The Regents Of The University Of California | Methods for delineating cellular regions and classifying regions of histopathology and microanatomy |
| US20150227463A1 (en) * | 2014-02-07 | 2015-08-13 | Cisco Technology, Inc. | Precaching of responsive information |
| JP6920220B2 (en) | 2015-06-30 | 2021-08-18 | エメラルド クラウド ラボ、インコーポレイテッド | Systems, methods and computer programs for managing, executing and analyzing laboratory experiments |
| WO2019122971A1 (en) * | 2017-12-20 | 2019-06-27 | Telefonaktiebolaget Lm Ericsson (Publ) | Datafall: a policy-driven algorithm for decentralized placement and reorganization of replicated data |
| CN109344722B (en) * | 2018-09-04 | 2020-03-24 | 阿里巴巴集团控股有限公司 | User identity determination method and device and electronic equipment |
| US11294928B1 (en) * | 2018-10-12 | 2022-04-05 | Palantir Technologies Inc. | System architecture for relating and linking data objects |
| JP7143743B2 (en) * | 2018-11-30 | 2022-09-29 | 株式会社島津製作所 | Analysis system, analysis device and information processing method |
Family Cites Families (99)
| Publication number | Priority date | Publication date | Assignee | Title |
|---|---|---|---|---|
| FR2050251A1 (en) | 1969-07-08 | 1971-04-02 | Inst Francais Du Petrole | Sulphonated polyimides (i) used as ion ex- - changes and in electrodialysis |
| US4857549A (en) * | 1984-02-01 | 1989-08-15 | Smithkline Beckman Corporation | Antitumor compounds |
| US4942231A (en) | 1984-05-24 | 1990-07-17 | Mallinckrodt, Inc. | Method of preparing a chlorinated, brominated, radio-brominated, iodinated and/or radioiodinated aromatic or heteroaromatic compound |
| JPH083815B2 (en) | 1985-10-25 | 1996-01-17 | 株式会社日立製作所 | Natural language co-occurrence relation dictionary maintenance method |
| JP2679972B2 (en) * | 1986-02-10 | 1997-11-19 | 株式会社日立製作所 | Information service processing method |
| US5185809A (en) * | 1987-08-14 | 1993-02-09 | The General Hospital Corporation | Morphometric analysis of anatomical tomographic data |
| JPH0242572A (en) | 1988-08-03 | 1990-02-13 | Hitachi Ltd | Preparation/maintenance method for co-occurrence relation dictionary |
| US5025388A (en) | 1988-08-26 | 1991-06-18 | Cramer Richard D Iii | Comparative molecular field analysis (CoMFA) |
| EP0367544A3 (en) | 1988-10-31 | 1990-12-19 | International Development Research Centre | Process control using intelligence-based systems |
| ATE150879T1 (en) | 1989-10-17 | 1997-04-15 | Perkin Elmer Corp | ROBOTIC INTERFACE |
| US5048109A (en) * | 1989-12-08 | 1991-09-10 | Xerox Corporation | Detection of highlighted regions |
| US5276867A (en) | 1989-12-19 | 1994-01-04 | Epoch Systems, Inc. | Digital data storage system with improved data migration |
| US5276860A (en) | 1989-12-19 | 1994-01-04 | Epoch Systems, Inc. | Digital data processor with improved backup storage |
| US5218695A (en) | 1990-02-05 | 1993-06-08 | Epoch Systems, Inc. | File server system having high-speed write execution |
| US5375606A (en) | 1990-02-28 | 1994-12-27 | Zynaxis, Inc. | Bio-analytical separation method |
| ATE154981T1 (en) | 1990-04-06 | 1997-07-15 | Perkin Elmer Corp | AUTOMATED MOLECULAR BIOLOGY LABORATORY |
| EP0471650B1 (en) | 1990-08-17 | 1995-05-03 | Ciba-Geigy Ag | Copolyimides, process for their preparation and their use |
| US5235522A (en) | 1990-10-10 | 1993-08-10 | Cell Analysis Systems, Inc. | Method and apparatus for automated analysis of biological specimens |
| US5340719A (en) | 1990-11-23 | 1994-08-23 | Corporation Coulter | Method and apparatus for optically screening microscopic cells |
| JPH06503171A (en) | 1990-11-23 | 1994-04-07 | クールター コーポレイション | Microscopic cell optical screening method and device |
| US5218965A (en) | 1990-12-03 | 1993-06-15 | Becton, Dickinson And Company | Apparatus for carrying a sensor in a connector for a catheter adapter |
| EP0496902A1 (en) | 1991-01-26 | 1992-08-05 | International Business Machines Corporation | Knowledge-based molecular retrieval system and method |
| JPH04260132A (en) | 1991-02-15 | 1992-09-16 | Hitachi Ltd | Problem solving system |
| US5287497A (en) | 1991-03-15 | 1994-02-15 | Unisys Corporation | Image statement printing system with document storage/retrieval using optical media |
| CA2065473C (en) | 1991-04-25 | 1999-08-10 | Kouichi Shibao | Knowledge base management system for an information reasoning apparatus |
| US5239591A (en) * | 1991-07-03 | 1993-08-24 | U.S. Philips Corp. | Contour extraction in multi-phase, multi-slice cardiac mri studies by propagation of seed contours between images |
| US5548661A (en) | 1991-07-12 | 1996-08-20 | Price; Jeffrey H. | Operator independent image cytometer |
| US5418943A (en) | 1991-10-23 | 1995-05-23 | At&T Corp. | Information system with knowledge base and data base |
| US5670113A (en) | 1991-12-20 | 1997-09-23 | Sibia Neurosciences, Inc. | Automated analysis equipment and assay method for detecting cell surface protein and/or cytoplasmic receptor function using same |
| US5332968A (en) * | 1992-04-21 | 1994-07-26 | University Of South Florida | Magnetic resonance imaging color composites |
| US5263126A (en) | 1992-09-10 | 1993-11-16 | Chang Hou Mei H | Automatic expert system |
| US5355215A (en) | 1992-09-30 | 1994-10-11 | Environmental Research Institute Of Michigan | Method and apparatus for quantitative fluorescence measurements |
| US5659724A (en) | 1992-11-06 | 1997-08-19 | Ncr | Interactive data analysis apparatus employing a knowledge base |
| US5511186A (en) | 1992-11-18 | 1996-04-23 | Mdl Information Systems, Inc. | System and methods for performing multi-source searches over heterogeneous databases |
| US5379366A (en) | 1993-01-29 | 1995-01-03 | Noyes; Dallas B. | Method for representation of knowledge in a computer as a network database system |
| US5615112A (en) | 1993-01-29 | 1997-03-25 | Arizona Board Of Regents | Synthesized object-oriented entity-relationship (SOOER) model for coupled knowledge-base/database of image retrieval expert system (IRES) |
| JP3315754B2 (en) | 1993-04-27 | 2002-08-19 | 株式会社東芝 | Medical database device |
| US5596744A (en) * | 1993-05-20 | 1997-01-21 | Hughes Aircraft Company | Apparatus and method for providing users with transparent integrated access to heterogeneous database management systems |
| US5435310A (en) * | 1993-06-23 | 1995-07-25 | University Of Washington | Determining cardiac wall thickness and motion by imaging and three-dimensional modeling |
| US5434796A (en) | 1993-06-30 | 1995-07-18 | Daylight Chemical Information Systems, Inc. | Method and apparatus for designing molecules with desired properties by evolving successive populations |
| US6415048B1 (en) * | 1993-10-12 | 2002-07-02 | Schneider Medical Technologies, Inc. | Compositional analysis system |
| JP3212787B2 (en) * | 1993-12-02 | 2001-09-25 | 日本電気株式会社 | Transfer data management method and data transfer method between host and terminal |
| US5537585A (en) | 1994-02-25 | 1996-07-16 | Avail Systems Corporation | Data storage management for network interconnected processors |
| US5675819A (en) | 1994-06-16 | 1997-10-07 | Xerox Corporation | Document information retrieval using global word co-occurrence patterns |
| US5577239A (en) | 1994-08-10 | 1996-11-19 | Moore; Jeffrey | Chemical structure storage, searching and retrieval system |
| US5463564A (en) | 1994-09-16 | 1995-10-31 | 3-Dimensional Pharmaceuticals, Inc. | System and method of automatically generating chemical compounds with desired properties |
| US5930154A (en) | 1995-01-17 | 1999-07-27 | Intertech Ventures, Ltd. | Computer-based system and methods for information storage, modeling and simulation of complex systems organized in discrete compartments in time and space |
| WO1996022575A1 (en) | 1995-01-17 | 1996-07-25 | Intertech Ventures, Ltd. | Control systems based on simulated virtual models |
| US5980096A (en) | 1995-01-17 | 1999-11-09 | Intertech Ventures, Ltd. | Computer-based system, methods and graphical interface for information storage, modeling and stimulation of complex systems |
| US5914891A (en) | 1995-01-20 | 1999-06-22 | Board Of Trustees, The Leland Stanford Junior University | System and method for simulating operation of biochemical systems |
| US5740428A (en) | 1995-02-07 | 1998-04-14 | Merge Technologies, Inc. | Computer based multimedia medical database management system and user interface |
| US5819266A (en) | 1995-03-03 | 1998-10-06 | International Business Machines Corporation | System and method for mining sequential patterns in a large database |
| US5657255C1 (en) | 1995-04-14 | 2002-06-11 | Interleukin Genetics Inc | Hierarchic biological modelling system and method |
| US5867118A (en) | 1995-06-07 | 1999-02-02 | Lockheed Martin Corporation | Apparatus for and method of classifying patterns |
| US5725633A (en) | 1995-06-30 | 1998-03-10 | Praxair Technology, Inc. | Sulfonated polyimide gas separation membranes |
| US5732150A (en) | 1995-09-19 | 1998-03-24 | Ihc Health Services, Inc. | Method and system for multiple wavelength microscopy image analysis |
| US5742811A (en) | 1995-10-10 | 1998-04-21 | International Business Machines Corporation | Method and system for mining generalized sequential patterns in a large database |
| US6035298A (en) | 1995-10-19 | 2000-03-07 | British Telecommunications Public Limited Company | Accessing plural independent databases having plural database schemas |
| US5689698A (en) | 1995-10-20 | 1997-11-18 | Ncr Corporation | Method and apparatus for managing shared data using a data surrogate and obtaining cost parameters from a data dictionary by evaluating a parse tree object |
| JP2960340B2 (en) | 1995-10-20 | 1999-10-06 | 富士ゼロックス株式会社 | Data search method and device |
| US5809499A (en) | 1995-10-20 | 1998-09-15 | Pattern Discovery Software Systems, Ltd. | Computational method for discovering patterns in data sets |
| US5970482A (en) | 1996-02-12 | 1999-10-19 | Datamind Corporation | System for data mining using neuroagents |
| US5978804A (en) | 1996-04-11 | 1999-11-02 | Dietzman; Gregg R. | Natural products information system |
| FR2748485B1 (en) | 1996-05-07 | 1998-08-07 | Commissariat Energie Atomique | SULPHONATED POLYIMIDES, MEMBRANES PREPARED THEREWITH, AND FUEL CELL DEVICE COMPRISING SUCH MEMBRANES |
| US5884315A (en) * | 1996-05-09 | 1999-03-16 | Philips Electronics North America Corporation | System and method for handling technical hardware related information |
| US5989835A (en) | 1997-02-27 | 1999-11-23 | Cellomics, Inc. | System for cell-based screening |
| US6103479A (en) | 1996-05-30 | 2000-08-15 | Cellomics, Inc. | Miniaturized cell array methods and apparatus for cell-based screening |
| US5901214A (en) * | 1996-06-10 | 1999-05-04 | Murex Securities, Ltd. | One number intelligent call processing system |
| US5892838A (en) | 1996-06-11 | 1999-04-06 | Minnesota Mining And Manufacturing Company | Biometric recognition using a classification neural network |
| US7013298B1 (en) * | 1996-07-30 | 2006-03-14 | Hyperphrase Technologies, Llc | Method and system for automated data storage and retrieval |
| US5751605A (en) | 1996-08-15 | 1998-05-12 | Tripos, Inc. | Molecular hologram QSAR |
| US5873080A (en) | 1996-09-20 | 1999-02-16 | International Business Machines Corporation | Using multiple search engines to search multimedia data |
| AU4976797A (en) | 1996-10-07 | 1998-05-05 | Irori | Matrices with memories in automated drug discovery and units therefor |
| US6023659A (en) | 1996-10-10 | 2000-02-08 | Incyte Pharmaceuticals, Inc. | Database system employing protein function hierarchies for viewing biomolecular sequence data |
| US5862514A (en) | 1996-12-06 | 1999-01-19 | Ixsys, Inc. | Method and means for synthesis-based simulation of chemicals having biological functions |
| US5970500A (en) | 1996-12-12 | 1999-10-19 | Incyte Pharmaceuticals, Inc. | Database and system for determining, storing and displaying gene locus information |
| US5966712A (en) | 1996-12-12 | 1999-10-12 | Incyte Pharmaceuticals, Inc. | Database and system for storing, comparing and displaying genomic information |
| US6021220A (en) | 1997-02-11 | 2000-02-01 | Silicon Biology, Inc. | System and method for pattern recognition |
| JP3683591B2 (en) * | 1997-02-27 | 2005-08-17 | セロミックス インコーポレイテッド | Cell-based screening system |
| US5977890A (en) | 1997-06-12 | 1999-11-02 | International Business Machines Corporation | Method and apparatus for data compression utilizing efficient pattern discovery |
| ATE264523T1 (en) | 1997-07-25 | 2004-04-15 | Affymetrix Inc A Delaware Corp | METHOD FOR CREATING A BIO-INFORMATICS DATABASE |
| US6134558A (en) * | 1997-10-31 | 2000-10-17 | Oracle Corporation | References that indicate where global database objects reside |
| US6681227B1 (en) * | 1997-11-19 | 2004-01-20 | Ns Solutions Corporation | Database system and a method of data retrieval from the system |
| US6192165B1 (en) | 1997-12-30 | 2001-02-20 | Imagetag, Inc. | Apparatus and method for digital filing |
| US6199059B1 (en) * | 1998-04-22 | 2001-03-06 | International Computex, Inc. | System and method for classifying and retrieving information with virtual object hierarchy |
| US5965352A (en) | 1998-05-08 | 1999-10-12 | Rosetta Inpharmatics, Inc. | Methods for identifying pathways of drug action |
| US6094652A (en) | 1998-06-10 | 2000-07-25 | Oracle Corporation | Hierarchical query feedback in an information retrieval system |
| NL1009376C1 (en) | 1998-06-11 | 1998-07-06 | Boardwalk Ag | Data system for providing relationship patterns between people. |
| JP2000082064A (en) * | 1998-09-04 | 2000-03-21 | Casio Comput Co Ltd | Data access device |
| AU6244099A (en) | 1998-09-11 | 2000-04-03 | Gene Logic, Inc. | Genomic knowledge discovery |
| US20030028501A1 (en) * | 1998-09-17 | 2003-02-06 | David J. Balaban | Computer based method for providing a laboratory information management system |
| US6654736B1 (en) * | 1998-11-09 | 2003-11-25 | The United States Of America As Represented By The Secretary Of The Army | Chemical information systems |
| US6605120B1 (en) * | 1998-12-10 | 2003-08-12 | International Business Machines Corporation | Filter definition for distribution mechanism for filtering, formatting and reuse of web based content |
| GB2348005A (en) * | 1999-03-13 | 2000-09-20 | Marconi Electronic Syst Ltd | NMR apparatus with additional RF receive coil to reduce aliasing |
| US6743576B1 (en) * | 1999-05-14 | 2004-06-01 | Cytokinetics, Inc. | Database system for predictive cellular bioinformatics |
| US6523035B1 (en) | 1999-05-20 | 2003-02-18 | Bmc Software, Inc. | System and method for integrating a plurality of disparate database utilities into a single graphical user interface |
| US6453060B1 (en) * | 1999-06-29 | 2002-09-17 | Tri Path Imaging, Inc. | Method and apparatus for deriving separate images from multiple chromogens in a branched image analysis system |
| US6529705B1 (en) * | 1999-07-12 | 2003-03-04 | Paracomp, Inc. | Computerized scientific method educational system for collecting and analyzing data from prerecorded experiments |
| US7054833B1 (en) * | 2000-10-27 | 2006-05-30 | Mcdonald Patrick D | Method and system for processing unclaimed property information |
-
1999
- 1999-11-10 CA CA002350587A patent/CA2350587C/en not_active Expired - Lifetime
- 1999-11-10 EP EP99958879A patent/EP1145149B1/en not_active Expired - Lifetime
- 1999-11-10 AT AT99958879T patent/ATE292822T1/en not_active IP Right Cessation
- 1999-11-10 DE DE69924645T patent/DE69924645T2/en not_active Expired - Lifetime
- 1999-11-10 JP JP2000582925A patent/JP2002530748A/en active Pending
- 1999-11-10 WO PCT/US1999/026562 patent/WO2000029984A2/en active IP Right Grant
- 1999-11-10 IL IL14276599A patent/IL142765A0/en unknown
- 1999-11-10 AU AU16156/00A patent/AU1615600A/en not_active Abandoned
-
2003
- 2003-08-27 US US10/649,323 patent/US7467153B2/en not_active Expired - Lifetime
-
2005
- 2005-09-07 JP JP2005259850A patent/JP4405951B2/en not_active Expired - Lifetime
-
2008
- 2008-08-08 US US12/189,035 patent/US8024293B2/en not_active Expired - Fee Related
- 2008-08-08 US US12/188,967 patent/US8090748B2/en not_active Expired - Fee Related
-
2009
- 2009-09-10 JP JP2009209367A patent/JP4581025B2/en not_active Expired - Lifetime
Cited By (2)
| Publication number | Priority date | Publication date | Assignee | Title |
|---|---|---|---|---|
| CN111372075A (en) * | 2020-02-28 | 2020-07-03 | 钱秀华 | Network image diagnosis method and device and image processing equipment |
| CN111372075B (en) * | 2020-02-28 | 2021-03-05 | 上海营湾医疗科技有限公司 | Network image diagnosis method and device and image processing equipment |
Also Published As
| Publication number | Publication date |
|---|---|
| US20040139103A1 (en) | 2004-07-15 |
| US8090748B2 (en) | 2012-01-03 |
| JP4581025B2 (en) | 2010-11-17 |
| ATE292822T1 (en) | 2005-04-15 |
| EP1145149A2 (en) | 2001-10-17 |
| CA2350587C (en) | 2004-04-27 |
| IL142765A0 (en) | 2002-03-10 |
| US20080306989A1 (en) | 2008-12-11 |
| WO2000029984A2 (en) | 2000-05-25 |
| DE69924645T2 (en) | 2006-03-02 |
| WO2000029984A3 (en) | 2000-11-30 |
| JP2010020789A (en) | 2010-01-28 |
| US20080301202A1 (en) | 2008-12-04 |
| US8024293B2 (en) | 2011-09-20 |
| AU1615600A (en) | 2000-06-05 |
| JP2002530748A (en) | 2002-09-17 |
| JP4405951B2 (en) | 2010-01-27 |
| JP2006107472A (en) | 2006-04-20 |
| US7467153B2 (en) | 2008-12-16 |
| CA2350587A1 (en) | 2000-05-25 |
| DE69924645D1 (en) | 2005-05-12 |
Similar Documents
| Publication | Publication Date | Title |
|---|---|---|
| EP1145149B1 (en) | Methods and system for efficient collection and storage of experimental data | |
| US11066689B2 (en) | Analysis and screening of cell secretion profiles | |
| US8428887B2 (en) | Method for automated processing of digital images of tissue micro-arrays (TMA) | |
| US20050108197A1 (en) | System, method and computer program product for managing genomic data | |
| US7451047B2 (en) | System and method for programatic access to biological probe array data | |
| AU768732B2 (en) | Method and system for general purpose analysis of experimental data | |
| US20230196720A1 (en) | Computer-implemented method, computer program product and system for data analysis | |
| US20020059326A1 (en) | System, method, and computer program product for management of biological experiment information | |
| WO2005114578A1 (en) | Method and system for automated quantitation of tissue micro-array (tma) digital image analysis | |
| EP1533720A2 (en) | Methods and system for efficient collection and storage of experimental data | |
| Bearer | Overview of image analysis, image importing, and image processing using freeware | |
| Zwolinski et al. | 1Click1View: Interactive Visualization Methodology for RNAi Cell‐Based Microscopic Screening | |
| Cooke et al. | Acquisition and management of high content screening, light-sheet microscopy and mass spectrometry imaging data at AstraZeneca, GlaxoSmithKline and NPL: a survey report | |
| Kozak et al. | SIB: Database and Tool for the Integration and Browsing of Large Scale Image Hhigh-Throughput Screening Data | |
| WO2023094625A1 (en) | Cytometric analysis method | |
| Perkel | Tissue microarrays: advancing clinical genomics: inspired by DNA biochips, an NIH postdoc opens the door to" pathomics".(Lab Consumer). | |
| Leary | Listmode data processing |
Legal Events
| Date | Code | Title | Description |
|---|---|---|---|
| PUAI | Public reference made under article 153(3) epc to a published international application that has entered the european phase |
Free format text: ORIGINAL CODE: 0009012 |
|
| 17P | Request for examination filed |
Effective date: 20010509 |
|
| AK | Designated contracting states |
Kind code of ref document: A2 Designated state(s): AT BE CH CY DE DK ES FI FR GB GR IE IT LI LU MC NL PT SE |
|
| XX | Miscellaneous (additional remarks) |
Free format text: DERZEIT SIND DIE WIPO-PUBLIKATIONSDATEN A3 NICHT VERFUEGBAR. |
|
| 17Q | First examination report despatched |
Effective date: 20020108 |
|
| GRAP | Despatch of communication of intention to grant a patent |
Free format text: ORIGINAL CODE: EPIDOSNIGR1 |
|
| RAP1 | Party data changed (applicant data changed or rights of an application transferred) |
Owner name: CELLOMICS, INC. |
|
| GRAS | Grant fee paid |
Free format text: ORIGINAL CODE: EPIDOSNIGR3 |
|
| GRAA | (expected) grant |
Free format text: ORIGINAL CODE: 0009210 |
|
| AK | Designated contracting states |
Kind code of ref document: B1 Designated state(s): AT BE CH CY DE DK ES FI FR GB GR IE IT LI LU MC NL PT SE |
|
| PG25 | Lapsed in a contracting state [announced via postgrant information from national office to epo] |
Ref country code: NL Free format text: LAPSE BECAUSE OF FAILURE TO SUBMIT A TRANSLATION OF THE DESCRIPTION OR TO PAY THE FEE WITHIN THE PRESCRIBED TIME-LIMIT Effective date: 20050406 Ref country code: IT Free format text: LAPSE BECAUSE OF FAILURE TO SUBMIT A TRANSLATION OF THE DESCRIPTION OR TO PAY THE FEE WITHIN THE PRESCRIBED TIME-LIMIT;WARNING: LAPSES OF ITALIAN PATENTS WITH EFFECTIVE DATE BEFORE 2007 MAY HAVE OCCURRED AT ANY TIME BEFORE 2007. THE CORRECT EFFECTIVE DATE MAY BE DIFFERENT FROM THE ONE RECORDED. Effective date: 20050406 Ref country code: FI Free format text: LAPSE BECAUSE OF FAILURE TO SUBMIT A TRANSLATION OF THE DESCRIPTION OR TO PAY THE FEE WITHIN THE PRESCRIBED TIME-LIMIT Effective date: 20050406 Ref country code: BE Free format text: LAPSE BECAUSE OF FAILURE TO SUBMIT A TRANSLATION OF THE DESCRIPTION OR TO PAY THE FEE WITHIN THE PRESCRIBED TIME-LIMIT Effective date: 20050406 Ref country code: AT Free format text: LAPSE BECAUSE OF FAILURE TO SUBMIT A TRANSLATION OF THE DESCRIPTION OR TO PAY THE FEE WITHIN THE PRESCRIBED TIME-LIMIT Effective date: 20050406 |
|
| REG | Reference to a national code |
Ref country code: GB Ref legal event code: FG4D |
|
| XX | Miscellaneous (additional remarks) |
Free format text: DERZEIT SIND DIE WIPO-PUBLIKATIONSDATEN A3 NICHT VERFUEGBAR. |
|
| REG | Reference to a national code |
Ref country code: CH Ref legal event code: EP |
|
| REG | Reference to a national code |
Ref country code: IE Ref legal event code: FG4D |
|
| REF | Corresponds to: |
Ref document number: 69924645 Country of ref document: DE Date of ref document: 20050512 Kind code of ref document: P |
|
| REG | Reference to a national code |
Ref country code: SE Ref legal event code: TRGR |
|
| PG25 | Lapsed in a contracting state [announced via postgrant information from national office to epo] |
Ref country code: GR Free format text: LAPSE BECAUSE OF FAILURE TO SUBMIT A TRANSLATION OF THE DESCRIPTION OR TO PAY THE FEE WITHIN THE PRESCRIBED TIME-LIMIT Effective date: 20050706 Ref country code: DK Free format text: LAPSE BECAUSE OF FAILURE TO SUBMIT A TRANSLATION OF THE DESCRIPTION OR TO PAY THE FEE WITHIN THE PRESCRIBED TIME-LIMIT Effective date: 20050706 |
|
| PG25 | Lapsed in a contracting state [announced via postgrant information from national office to epo] |
Ref country code: ES Free format text: LAPSE BECAUSE OF FAILURE TO SUBMIT A TRANSLATION OF THE DESCRIPTION OR TO PAY THE FEE WITHIN THE PRESCRIBED TIME-LIMIT Effective date: 20050717 |
|
| REG | Reference to a national code |
Ref country code: CH Ref legal event code: NV Representative=s name: RITSCHER & PARTNER AG |
|
| NLV1 | Nl: lapsed or annulled due to failure to fulfill the requirements of art. 29p and 29m of the patents act | ||
| PG25 | Lapsed in a contracting state [announced via postgrant information from national office to epo] |
Ref country code: IE Free format text: LAPSE BECAUSE OF NON-PAYMENT OF DUE FEES Effective date: 20051110 Ref country code: CY Free format text: LAPSE BECAUSE OF FAILURE TO SUBMIT A TRANSLATION OF THE DESCRIPTION OR TO PAY THE FEE WITHIN THE PRESCRIBED TIME-LIMIT Effective date: 20051110 |
|
| PG25 | Lapsed in a contracting state [announced via postgrant information from national office to epo] |
Ref country code: MC Free format text: LAPSE BECAUSE OF NON-PAYMENT OF DUE FEES Effective date: 20051130 Ref country code: LU Free format text: LAPSE BECAUSE OF NON-PAYMENT OF DUE FEES Effective date: 20051130 |
|
| PLBE | No opposition filed within time limit |
Free format text: ORIGINAL CODE: 0009261 |
|
| STAA | Information on the status of an ep patent application or granted ep patent |
Free format text: STATUS: NO OPPOSITION FILED WITHIN TIME LIMIT |
|
| ET | Fr: translation filed | ||
| 26N | No opposition filed |
Effective date: 20060110 |
|
| REG | Reference to a national code |
Ref country code: IE Ref legal event code: MM4A |
|
| PG25 | Lapsed in a contracting state [announced via postgrant information from national office to epo] |
Ref country code: PT Free format text: LAPSE BECAUSE OF NON-PAYMENT OF DUE FEES Effective date: 20050906 |
|
| REG | Reference to a national code |
Ref country code: CH Ref legal event code: PCAR Free format text: RITSCHER & PARTNER AG;RESIRAIN 1;8125 ZOLLIKERBERG (CH) |
|
| REG | Reference to a national code |
Ref country code: CH Ref legal event code: PFA Owner name: CELLOMICS, INC., US Free format text: FORMER OWNER: CELLOMICS, INC., US |
|
| PUAK | Availability of information related to the publication of the international search report |
Free format text: ORIGINAL CODE: 0009015 |
|
| PG25 | Lapsed in a contracting state [announced via postgrant information from national office to epo] |
Ref country code: CY Free format text: LAPSE BECAUSE OF FAILURE TO SUBMIT A TRANSLATION OF THE DESCRIPTION OR TO PAY THE FEE WITHIN THE PRESCRIBED TIME-LIMIT Effective date: 20050406 |
|
| REG | Reference to a national code |
Ref country code: FR Ref legal event code: PLFP Year of fee payment: 17 |
|
| REG | Reference to a national code |
Ref country code: FR Ref legal event code: PLFP Year of fee payment: 18 |
|
| REG | Reference to a national code |
Ref country code: FR Ref legal event code: PLFP Year of fee payment: 19 |
|
| REG | Reference to a national code |
Ref country code: FR Ref legal event code: PLFP Year of fee payment: 20 |
|
| REG | Reference to a national code |
Ref country code: DE Ref legal event code: R079 Ref document number: 69924645 Country of ref document: DE Free format text: PREVIOUS MAIN CLASS: G06F0017300000 Ipc: G06F0016000000 |
|
| PGFP | Annual fee paid to national office [announced via postgrant information from national office to epo] |
Ref country code: SE Payment date: 20181113 Year of fee payment: 20 Ref country code: DE Payment date: 20181030 Year of fee payment: 20 |
|
| PGFP | Annual fee paid to national office [announced via postgrant information from national office to epo] |
Ref country code: CH Payment date: 20181115 Year of fee payment: 20 Ref country code: FR Payment date: 20181011 Year of fee payment: 20 Ref country code: GB Payment date: 20181107 Year of fee payment: 20 |
|
| REG | Reference to a national code |
Ref country code: DE Ref legal event code: R071 Ref document number: 69924645 Country of ref document: DE |
|
| REG | Reference to a national code |
Ref country code: CH Ref legal event code: PL |
|
| REG | Reference to a national code |
Ref country code: GB Ref legal event code: PE20 Expiry date: 20191109 |
|
| PG25 | Lapsed in a contracting state [announced via postgrant information from national office to epo] |
Ref country code: GB Free format text: LAPSE BECAUSE OF EXPIRATION OF PROTECTION Effective date: 20191109 |
|
| REG | Reference to a national code |
Ref country code: SE Ref legal event code: EUG |