The invention relates to a method and apparatus for determining properties
of a transmission line or channel, for instance a channel for transmitting electric or
acoustic signals. It concerns also a time domain reflectometry method and an
equipment for implementing this method.
In the field of telecommunications, the density of transmitted information
increases regularly. This increase is not always compatible with the existing equipment,
more particularly with the existing transmission lines. In order to cope with this
problem, several technologies are known, for instance ADSL which means
"Asymmetric Digital Subscriber Line" (or other DSL services such as HDSL and VDSL).
This technology provides the possibility to transmit, with ordinary telephone lines,
high data rate from the network (a central office) to the subscriber and lower data
rates from the subscriber to the network.
ADSL is adapted for distances, between a central station or office and the
subscriber, which are comprised between 1.5 and 6 km. HDSL is adapted for distances
greater than 6 km, and VDSL is adapted for distances comprised between 0.3
and 1.5 km.
In order to be able to comply with ADSL services, the telephone line must
satisfy standards of quality which are not necessarily fulfilled by all telephone lines.
Before implementing ADSL services, it is therefore necessary to evaluate a
priori the line quality at the lowest cost as possible and with the highest accuracy as
possible. The present invention relates to a method and an apparatus which
determine, from a central office, the transmission characteristics of a transmission line
with a high signal to noise ratio and a high accuracy.
The invention thus contributes to the line qualification.
Up to now an a priori line qualification requires to make tests at both ends
of the line. This means that one operator must be present at the central office and
another operator at the subscriber's location. Although accurate, this a priori line
testing is expensive.
The method according to the invention is characterized in that, for testing a
line, use is made of time domain reflectometry wherein, at one end of the line, a
plurality of pulses covering different bandwidths are transmitted in the line and the
corresponding echoes are processed, more particularly filtered and reconstructed, at
the same end, the echoes providing information about the whole length of the line.
Up to now, time domain reflectometry has been used only for detecting the
first defect on a line. Time domain reflectometry is known to use only one pulse of
narrow or wide frequency band at one time and the transmitted pulse provides only
one echo. With the wide band "multifocal" (multi echoes) time domain reflectometry
according to the invention, several echoes are provided which give information about
the entire length of the line. In fact, with the invention, which makes use of pulses at
different bandwidths, it is possible to optimize both the time accuracy and, with an
appropriate filtering, the signal to noise ratio along the whole line, at any distance
from the central office.
The plurality of pulses, called here "multifocality", allows to partially compensate
for limited dynamics of the A/D (analog to digital) converters. In fact, with
only one wide band pulse, it would be necessary to use a pulse of very high amplitude
in comparison to the A/D converter ability.
In a preferred embodiment, the pulses are analytical complex pulses and
contribute to a high signal to noise ratio.
Preferably the bandwidths of the transmitted pulses are overlapping and are
such that the reconstructed echoes present a flat spectrum, i.e. a perfect line. In other
words, without defects and without attenuation, the response has practically a
constant amplitude over the whole useful frequency spectrum. In this way, the method
provides directly the reflectometric impulse response of a line, for instance of a
copper pair, generally a twisted pair.
As the pulses cover different bandwidths, in order to obtain this flat spectrum,
it is necessary that, after reflection and processing, the modulus of the sum of
the complex responses of the overlapping regions equals the modulus (for instance
one) in the non-overlapping region.
In a preferred embodiment, the spectrum amplitude on one side of a bandwidth
is decreasing according to a sine function and the overlapping part of the
neighboring bandwidth is increasing according to a cosine function and the detected
signal is the sum of squares of all components.
With this embodiment, after reflection, the first end of the first bandwidth will
vary as sin2 and the overlapping adjoining beginning of the following bandwidth will
vary as a cosin2. Therefore, in the overlapping region: sin2 + cos2 = 1.
With this embodiment, it is also possible to provide a given gain (or
attenuation) to each bandwidth in order that, for each of these bandwidths, the pulse
be compatible with the power limitations imposed by standards. For instance, ADSL
requests that the power be limited to -40 dbm/hertz (10-4 mwatt/hertz) and VDSL
requests a limitation to -60 dbm/hertz (10-6 mwatt/hertz) for frequencies higher than
1 MHz.
Therefore, in order to obtain a flat spectrum, for each bandwidth, the
transmitted pulse has a given amplification (or attenuation) and the received echo is
provided with a complementary attenuation (or amplification).
The echoes provide in the time domain, and/or in the frequency domain, an
information about the properties, generally the defects, of the line. Moreover, the
positions in time of the echoes represent the locations of the defects.
In an embodiment, the frequency bandwidth and the amplitude of the low
frequency pulses are selected according to the line attenuation and its compliancy in
terms of egress. An egress compliant line is a line which does not disturb neighbouring
services. In other word means are provided for selecting the frequency
bandwidth and the amplitude of the low frequency pulses.
The time domain reflectometry method according to the invention is not
limited to the estimation of the attenuation of telephone lines. More generally, this
method may be used for estimating transmission channels which are dispersive, and
subject to attenuation and noise.
These channels are not necessarily channels for transmitting electric signals;
the signals may be of a different nature, for instance acoustic signals. The method
provides the reflectometric impulse response with a good accuracy and a good
signal-to-noise ratio at any distance.
In brief, the invention concerns a time domain reflectometry method for
estimating properties of a transmission channel, for instance a channel for transmitting
electric or acoustic signals, which is characterized in that it comprises the steps of
generating, at one end of the channel, a plurality of pulses covering different frequency
bands, and of processing the echoes provided by these pulses at the same
end of the channel . The invention therefore determines a priori the reflectometric
impulse response of this transmission line since it is to be noted that a spectrum over
a wide bandwidth is equivalent to a Dirac function.
The invention relates also to a method for testing the properties, such as the
attenuation, of telephone lines comprising copper pairs, for instance twisted pairs,
between a central office and a subscriber, which is characterized in that it makes use
of the time domain reflectometry.
The invention provides an apparatus for testing the properties, such as the
attenuation, of telephone lines comprising copper pairs, for instance twisted pairs,
between a central office and a subscriber, which is characterized in that it comprises
time domain reflectometry means.
Other features and advantages of the invention will appear with the following
description of certain of its embodiments, this description being made in connection
with the following drawings, wherein:
The time domain reflectometry method according to the invention was
developed in order to test copper lines 10 between a central office 12 of a telephone
operator and subscribers 14. The goal of the test is to check whether the copper pair
10 is able to comply with ADSL services, i.e. whether its attenuation is inferior to a
maximum attenuation imposed by standards. Moreover, this method provides the
possibility to localize defects of the line 10.
In the schematic example shown on figure 1, a part 16 of the line 10 which
is relatively close to the central office or station 12 is subject to humidity; after this
defect 16, in the direction from the office 12 to the subscriber 14, the line presents a
defect 18 corresponding to a bridge tap, i.e. a derivation.
In the preferred embodiment of the method according to the invention, a set
of pulses are simultaneously or sequentially generated (sequentially in the example)
at the central station 12, each pulse covering a given bandwidth and the bandwidths
of all the pulses are overlapping. The whole bandwidth formed by these pulses is
wide, for instance, from 20 kHz to 6 MHz.
The set of pulses generated sequentially are transmitted from the office 12
on the line 10 and they are reflected by the defects 16, 18, as well as by the line end
21, i.e. by subscriber 14. In fact, it is known that a telephone set which is not in
operation is a pure reflector.
The reflections or echoes are detected and processed at the central office 12
according to the equipment and method represented on figures 2-8 and these
processed echoes provide information about the line 10 and its defects.
In the simplified example represented on figure 2, the vertical line 22 on the
left represents the frequency and the diagram is, in the horizontal direction, separated
in five zones 24, 26, 28, 30, and 32 from the left to the right. The zone 24 corresponds
to the transmission of pulses at the central office 12. The zone 26 represents
the path of the pulses from the central office 12 to the subscriber 14 and back
from the subscriber 14 to the central office 12. The zone 28 represents the processing
of the received echoes, each processing corresponding to a given bandwidth. The
zone 30 represents the sum of the echoes which are processed in zone 28 and the
zone 32 represents the spectrum of the transmitted, filtered and reconstructed pulses.
In the simplified example, three pulses 40, 42, 44 are provided. The pulse
40 has a spectrum which covers the low frequencies, the pulse 42 has a spectrum
which covers the medium frequencies and the pulse 44 has a spectrum which covers
the high frequencies. For instance, the pulse 40 covers 12.5 kHz to 960 kHz, the
pulse 42 covers 512 KHz to 2.6 MHz and the pulse 44 covers 1.65 MHz to 6.3 MHz.
The frequency bands of these pulses are overlapping. More precisely, the higher part
of the frequency band of pulse 40 overlaps with the lower part of the frequency band
of pulse 42 and the higher part of the frequency band of the pulse 42 overlaps with
the lower part of the frequency band of pulse 44.
Moreover, the overlapping portions of the spectra of the pulses are such
that, after reflection, reception and processing, the amplitude of the added overlapped
parts equals the amplitude of the non-overlapping parts. In other words, after
reception, the spectrum of all the pulses is practically flat, as shown on zone 32 of
figure 2.
For instance, the higher part 401 of the frequency band of pulse 40 varies
as a sine function and the overlapping part of the lowest portion 421 of the frequency
band of pulse 42, varies as a cosine function. As in zone, or step, 30, as explained
herein after, the squares of the amplitudes of the spectra are added, the overlapping
regions 401, 421 provide after the final processing: sin2 + cos2 = 1.
The method provides also, on the transmission side, a gain (amplification or
attenuation) for each pulse. For the sake of simplicity of the drawing, only the amplification
and attenuation for pulse 42 have been represented. To the pulse 42 corresponds
a gain represented by an amplifier 48, and on the receiving side (zone 28),
the inverse gain 50 is provided in order that the resulting spectra (zone 32) be flat as
explained herein above.
Each gain may be different from one bandwidth to another bandwidth, in
order to comply with the requirements of the standard which may impose different
constraints on the admissible maximum power for different bandwidths.
On the receiving side, for each bandwidth, a processing is performed to
drastically reduce the noise: a synchronous averaging 52, followed by a matched
filtering 54 and a
denoising 56. Each signal at the corresponding bandwidth, after
having been processed by the synchronous averaging 52, the matched
filtering 54
and the
denoising 56, is submitted to a reconstruction step (zone 30) 60 which sums
the outputs of the processing steps. Because of the matched filter properties, the
summation of the outputs of the processing steps is equivalent in the frequency
domain, to the following equation:
where Pi(f) is the transfer function for each pulse.
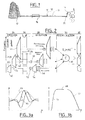
Figure 3a shows the variation with time (in abscissa) of the pulse 40. The
curve 62 corresponds to the real part of the pulse, the curve 64 represents the
variation of the imaginary part, and the curve 66 represents the envelope of the
pulse.
The diagram of figure 3b shows the spectrum of the pulses 62 and 64, i.e.
the Fourier transform of said pulses. As shown, the spectrum, which extends from 20
kHz to 200 kHz presents a flat part 68, a raising edge 70 and a falling edge 72. As
mentioned before, the falling edge has, for instance, the shape of a sine function.
The diagrams of figure 4 represent the signals obtained after synchronous
averaging 52 and before matched filtering 54.
Figure 4a represents the variation with time of the real part of the signal for
the pulses 44 at high frequencies, and figure 4b represents the variation with time of
the imaginary part for the signal at the output of a synchronous averaging corresponding
to the same high frequency pulses 44.
The diagrams of figure 4c and figure 4d correspond, respectively, to the real
and imaginary parts of the complex signal obtained after synchronous averaging for
the medium frequency pulses and figure 4e and figure 4f are diagrams
corresponding also to the real and imaginary parts of the signal obtained at the
output of the synchronous averaging 52 for the low frequency pulses.
Figure 4a and figure 4b show that, for high frequencies, the echoes present
a pulse 80. This pulse corresponds to a defect 16 close to the central office 12,
because the attenuation on the line increases sharply with the frequency and the
distance.
For medium frequencies (figure 4c and figure 4d), the diagram shows two
echoes 82 and 84 corresponding to defects 16 and 18 and, for low frequencies
(figure 4e and figure 4f), the diagram shows several echoes corresponding to defects
16, 18, and to the line end 21. It is recalled that, in this example, the load coil defect
20 is not present.
The diagrams of figure 5 are similar to the diagrams of figure 4, but they
represent the echoes obtained after the matched filtering 54. The matched filtering
comprises a step of correlating the received pulse with the transmitted pulse. This
matched filtering provides a further sharp decrease of the noise, as shown by comparison
of the diagrams of figure 4a to figure 4f with the corresponding diagrams of
figures 5a to 5f.
A further reduction of noise, more particularly for the high frequency pulses
is obtained with the denoising 56. This further noise suppression comprises a step of
determining a threshold below which the values of signal and noise are set to zero,
only the echoes which are above this threshold being taken into account.
The threshold is, in an example, determined by an estimation of the noise at
the end (on the right of diagrams of figure 5) of the signals obtained after matched
filtering. In fact, the ending time corresponds to the end of the line, at the subscriber's
location, for which no signal can be detected in medium and high frequencies;
therefore, the signal end corresponds, in practice, exclusively to noise for high and
medium frequencies. The noise is estimated by the variance of the signal at said
signal end and the threshold is determined by multiplying the square root of this
variance by a predetermined factor, for instance 2. More precisely, the noise variance
is estimated after the line end echo, i.e. on a noise alone segment.
It is to be noted that the denoising is limited to the signals which appear
after the last echo. No denoising is performed on signals appearing before the last
echo.
The result of the denoising appears on the diagrams of figure 6a to figure 6f
which are similar to the diagrams of figure 4a to figure 4f.
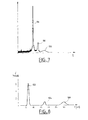
Figure 7 is a diagram showing the variation with time of the signal after the
summing of the outputs of the processing step for the three frequency bands (output
of adder 60).
This diagram shows that the time domain reflectometry method of the
invention provides, in this example, three echoes 96, 98 and 100. The first echo
corresponds mainly to defect 16, the second echo to defect 18 and the third to the
line end 21.
On the diagram of figure 8, the abscissa is the time t and the ordinate is the
frequency f. It can be seen that, to the three lines 96, 98, 100, correspond lines 102,
104 and 106. The line 102 extends on the whole frequency band, the line 104 corresponds
to the medium frequencies and the last line 106 is limited to low frequencies.
Therefore, the diagrams obtained with figure 7 and figure 8 show that the
method according to the invention provides, with only one measurement, information
about the properties of the line and the defects, more particularly about the location
of such defects.
More generally, the method according to the invention provides directly an
estimation of the reflectometric impulse response of a line, with a good time accuracy
and a high signal-to-noise ratio at any distance.