EP1083576A1 - Nuclear reactor core performance data visualization system - Google Patents
Nuclear reactor core performance data visualization system Download PDFInfo
- Publication number
- EP1083576A1 EP1083576A1 EP00307235A EP00307235A EP1083576A1 EP 1083576 A1 EP1083576 A1 EP 1083576A1 EP 00307235 A EP00307235 A EP 00307235A EP 00307235 A EP00307235 A EP 00307235A EP 1083576 A1 EP1083576 A1 EP 1083576A1
- Authority
- EP
- European Patent Office
- Prior art keywords
- reactor core
- data
- time
- files
- core performance
- Prior art date
- Legal status (The legal status is an assumption and is not a legal conclusion. Google has not performed a legal analysis and makes no representation as to the accuracy of the status listed.)
- Withdrawn
Links
- 238000013079 data visualisation Methods 0.000 title claims abstract description 13
- 238000012800 visualization Methods 0.000 claims abstract description 28
- 238000010586 diagram Methods 0.000 claims abstract description 15
- 238000000034 method Methods 0.000 claims abstract description 9
- 238000004891 communication Methods 0.000 claims abstract description 5
- 239000000446 fuel Substances 0.000 claims description 13
- 238000004590 computer program Methods 0.000 claims 1
- 239000003758 nuclear fuel Substances 0.000 claims 1
- 238000003491 array Methods 0.000 abstract description 6
- 230000000007 visual effect Effects 0.000 abstract description 5
- 238000013500 data storage Methods 0.000 abstract description 3
- 230000036962 time dependent Effects 0.000 abstract description 3
- 239000000284 extract Substances 0.000 abstract 1
- 238000013461 design Methods 0.000 description 6
- 238000012544 monitoring process Methods 0.000 description 4
- 238000012545 processing Methods 0.000 description 3
- 239000003086 colorant Substances 0.000 description 2
- 238000004886 process control Methods 0.000 description 2
- 238000012552 review Methods 0.000 description 2
- 230000003068 static effect Effects 0.000 description 2
- 238000013459 approach Methods 0.000 description 1
- 230000006399 behavior Effects 0.000 description 1
- 230000005540 biological transmission Effects 0.000 description 1
- 230000001419 dependent effect Effects 0.000 description 1
- 238000011156 evaluation Methods 0.000 description 1
- 230000020169 heat generation Effects 0.000 description 1
- 238000005259 measurement Methods 0.000 description 1
- 230000001105 regulatory effect Effects 0.000 description 1
- 238000004088 simulation Methods 0.000 description 1
- 230000002123 temporal effect Effects 0.000 description 1
Images


Classifications
-
- G—PHYSICS
- G21—NUCLEAR PHYSICS; NUCLEAR ENGINEERING
- G21D—NUCLEAR POWER PLANT
- G21D3/00—Control of nuclear power plant
- G21D3/001—Computer implemented control
-
- G—PHYSICS
- G21—NUCLEAR PHYSICS; NUCLEAR ENGINEERING
- G21C—NUCLEAR REACTORS
- G21C17/00—Monitoring; Testing ; Maintaining
-
- G—PHYSICS
- G21—NUCLEAR PHYSICS; NUCLEAR ENGINEERING
- G21D—NUCLEAR POWER PLANT
- G21D3/00—Control of nuclear power plant
- G21D3/008—Man-machine interface, e.g. control room layout
-
- Y—GENERAL TAGGING OF NEW TECHNOLOGICAL DEVELOPMENTS; GENERAL TAGGING OF CROSS-SECTIONAL TECHNOLOGIES SPANNING OVER SEVERAL SECTIONS OF THE IPC; TECHNICAL SUBJECTS COVERED BY FORMER USPC CROSS-REFERENCE ART COLLECTIONS [XRACs] AND DIGESTS
- Y02—TECHNOLOGIES OR APPLICATIONS FOR MITIGATION OR ADAPTATION AGAINST CLIMATE CHANGE
- Y02E—REDUCTION OF GREENHOUSE GAS [GHG] EMISSIONS, RELATED TO ENERGY GENERATION, TRANSMISSION OR DISTRIBUTION
- Y02E30/00—Energy generation of nuclear origin
-
- Y—GENERAL TAGGING OF NEW TECHNOLOGICAL DEVELOPMENTS; GENERAL TAGGING OF CROSS-SECTIONAL TECHNOLOGIES SPANNING OVER SEVERAL SECTIONS OF THE IPC; TECHNICAL SUBJECTS COVERED BY FORMER USPC CROSS-REFERENCE ART COLLECTIONS [XRACs] AND DIGESTS
- Y02—TECHNOLOGIES OR APPLICATIONS FOR MITIGATION OR ADAPTATION AGAINST CLIMATE CHANGE
- Y02E—REDUCTION OF GREENHOUSE GAS [GHG] EMISSIONS, RELATED TO ENERGY GENERATION, TRANSMISSION OR DISTRIBUTION
- Y02E30/00—Energy generation of nuclear origin
- Y02E30/30—Nuclear fission reactors
Definitions
- the invention relates generally to nuclear reactor and, more particularly, to a method and apparatus for extracting and visually displaying core performance data from either a nuclear reactor core simulator or an operating nuclear reactor.
- reactor core performance parameters such as Minimum Critical Power Ratio (MCPR) and Linear Heat Generation Rate (LHGR)
- MPR Minimum Critical Power Ratio
- LHGR Linear Heat Generation Rate
- Access to performance parameter data is important because these parameters reflect the continually changing thermal-hydraulic and thermal-mechanical conditions of the various elements which make up a reactor core -- such as, for example, the many fuel rod bundles and control blades.
- MCPR Minimum Critical Power Ratio
- LHGR Linear Heat Generation Rate
- measured (or simulated) reactor core performance parameter data is printed or displayed as numerical values in the form of tables and simple two-dimensional graphs. Due to the complexity of the engineering concepts involved, the examination and interpretation of time-varying, dynamic, multi-dimensional reactor performance data presented in this static form requires highly trained technical personnel having extensive knowledge and experience with nuclear reactor design, licensing requirements and operational limits. Moreover, partially due to the large amount of information, it is often an extremely laborious and time-consuming endeavor that can easily consume hundreds of costly man-hours. In addition, because of the traditional dependence on static numeric tables and non-animated two-dimensional graphs to portray information relating to time-varying three-dimensional parameters, reactor core performance is both difficult to analyze and prone to misinterpretation.
- the present invention attempts to accomplish these objectives and overcome the inefficiencies of traditional approaches toward presenting and reviewing reactor performance data by providing specific data visualization tools that will enable nuclear engineers and reactor plant operators to view selected time-varying reactor core parameters as three-dimensional animation sequences, dynamic two-dimensional contour plots and manipulatable three-dimensional objects in a virtual reality environment.
- a reactor core performance visualization system that allows plant operators and engineers to view selected time-varying core parameters as three-dimensional animation sequences, dynamic two-dimensional contour plots or as a manipulatable image object in a virtual reality environment. Consequently, the present disclosure is directed toward a method and system for acquiring, extracting and visually displaying core performance data obtained from either an operating nuclear reactor core or a nuclear reactor core simulator.
- the reactor core performance visualization system of the present invention includes a data processor (which may be, for example, an Intel PentiumTM type processor found in conventional desktop personal computer systems) having a large data storage capacity and a color monitor or other display device capable of handling multi-color graphics.
- the performance visualization system acquires pertinent reactor core performance data from, for example, a reactor process control computer or a nuclear reactor core simulator via a communications link.
- the method and apparatus of the present invention could be incorporated as a part of a reactor process control computer or a reactor core simulation computer.
- Different types of reactor core performance data are identified, separated and organized into two separate data arrays stored in the visualization system computer memory.
- a first data array is constructed of spatially-related time-varying performance parameter data corresponding to reactor elements in two dimensions and organized, for example, according to its associated two-dimensional core location coordinate information (x, y).
- a second data array is constructed of spatially-related reactor core performance parameter data corresponding to performance of reactor elements in three dimensions at one or more selected point(s) in time and organized, for example, according to its associated three-dimensional spacial location coordinate (x, y, z) within the core.
- the visualization system then utilizes data from the first array to create digital animation display files for illustrating the time-wise evolution of the reactor core performance parameters.
- These files are preferably formatted using a conventional digital protocol for creating digital image animation files such as, for example, Microsoft Corporation's audio visual interleave (AVI) file protocol.
- AVI audio visual interleave
- the three-dimensional spatially-related information stored in the second data array is used to generate virtual reality modeling language (VRML) protocol files.
- VRML virtual reality modeling language
- These VRML files are used by the visualization system to display a three-dimensional (3-D)model of a portion of a reactor core, portraying the 3-D configuration of fuel and control elements within the core, the viewing perspective of which may be manipulated by the viewer.
- AVI and VRML protocol files in the present invention further allows for the easy and convenient transmission and exchange of reactor core performance information between parties using computers having conventional World Wide Web browser software (with the appropriate VRML and AVI software plug-ins), and communicating either over a local network or over larger distances via the internet.
- a reactor plant operator or engineer can view 2-D animated color-coded diagrams that both illustrate the positional configuration of elements within the core and indicate the value of the selected performance parameter for each element. Information is displayed for indicating the current burn cycle "exposure" time of a particular core element and the location in the core where operational or regulatory limits have been or will be exceeded. In this manner, any actual or potential violation of predetermined core operating limits can be easily and quickly identified visually.
- a reactor plant operator or engineer can control the view and orientation of a displayed 3-D virtual reality model of a reactor core to examine performance parameters of multiple core elements simultaneously.
- the virtual reality 3-D display feature of the visualization system can be operated so as to provide a simulated visual "fly-through” or "fly-around" tour of the reactor core.
- the data visualization system is configured to run as a software application under MicroSoft's Windows95 or 98TM operating system. In this manner, a user may enter various performance parameter selection criterion and visualization system commands for manipulating displayed images via keyboard or, for example, a point-and-click desk-top mouse input device.
- the core performance data visualization system of the present invention is described in the context of communicating with an operational nuclear reactor.
- sensors and instrumentation located in an operational nuclear reactor core provide real-time measurement data to some sort of reactor control computer or, for example, to a reactor core monitoring system computer 101.
- Numerical core performance data acquired by core monitoring system computer 101 is provided to the data visualization system of the present invention via a digital communications channel 102.
- the visualization system apparatus includes a digital computer or central processing unit 103, preferably having a large data storage capacity including both working RAM and archival storage, input devices such as a keyboard and a mouse (not shown), and a high resolution color display device 108.
- visualization system computer 103 Upon acquiring all pertinent core performance data from core monitoring system computer 101, visualization system computer 103 constructs two distinct data arrays, 104 and 105, in memory from temporal and spatially-related core performance data. These two data arrays are then used in creating specially formatted files for generating different types of visual displays viewable on system monitor 108.
- the data visualization system uses VRML and creates AVI files. Both VRML programs and the AVI file protocol are well known. Likewise, VRML and AVI authoring/viewing software is commonly available from commercial software developers, either as shareware or as packaged products. Moreover, although the data visualization system of the present invention uses conventional AVI and VRML file protocols, other multimedia file protocols could be employed in the present invention for constructing and viewing the animation and 3-D image files.
- data array 104 is constructed in computer memory by visualization system computer 103 from 2-D (two-dimensional) spatially-related time-varying core performance parameter data, P(x,y,t), received from core monitoring computer 101.
- This data includes various different performance parameter values associated with each element in the core and is indexed within array 104 according to a time value (elapsed real or exposure time) and a two-dimensional location coordinate for the particular core element.
- Visualization system computer 103 uses the P(x,y,t) data to create AVI digital image animation files 106 for displaying a variety of dynamic color-coded graphics, such as reactor core element diagrams and multi-ordinate graphs.
- Conventional AVI file viewing software resident in the visualization system computer memory, is used to access animation files 106 and display the animated 2-D color coded graphics on display device 108.
- the animated graphics allow the user, for example, to simultaneously view the time-wise numerical evolution of core performance parameter values (and/or other multiple variable-dependent data) for one or more elements in the reactor core.
- the visualization system of the present invention utilizes the conventional MicroSoft WindowsTM operating system environment to provide a user-friendly interface having parameter and display selection menus (not shown) to allow the viewer to select from a variety of display arrangements.
- a user may select a display arrangement having multiple animated graphics for tracking several performance parameters simultaneously or a display arrangement showing only a single animated graphic of a 1 ⁇ 4-core diagram illustrating the time-wise evolution of a selected parameter.
- Another data array 105 is formed in system memory from 3-D (three-dimensional) spatially-related core performance parameter information, P(x,y,z), that was or is indicative of the state of the reactor core at a selected point(s) in time.
- This information includes performance parameter data and/or core configuration information indexed within array 105 according to its three-dimensional spacial location coordinate of origin within the core.
- the P(x,y,z) data in array 105 is then formatted by visualization system computer 103 into virtual reality modeling language (VRML) files 107.
- VRML virtual reality modeling language
- Conventional VRML file viewing software resident in the visualization system computer memory, is used to access VRML files 107 and display a virtual 3-D color-coded reactor core model image that can be manipulated in three dimensions by the viewer.
- the AVI and VRML files of the present invention can be viewed using a computer running a conventional memory-resident World Wide Web browser (e.g., Netscape Communicator4.51TM) with the appropriate AVI or VRML "plug-in” (e.g., Netscape's avi plug-in DLL NPAVI32 or VRML World's Cosmo Player 1.0).
- a conventional memory-resident World Wide Web browser e.g., Netscape Communicator4.51TM
- the appropriate AVI or VRML "plug-in” e.g., Netscape's avi plug-in DLL NPAVI32 or VRML World's Cosmo Player 1.0.
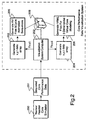
- FIGURE 2 an alternate embodiment of the reactor core performance visualization system of the present invention is shown in the context of obtaining performance data from a reactor core simulator.
- a nuclear reactor core simulator computer, 200 provides simulated core performance parameter data via data channel 201 to the core performance data visualization system.
- visualization computer 202 selects and organizes this data into two separate arrays, 203 and 204, which are then used to respectively create AVI animation files 205 and VRML files 206 for producing a visual image(s) on display device 208.
- FIGURE 3 shows a single frame of an example animation sequence generated by the reactor core performance visualization system computer.
- spatially-related time-varying data, P(x,y,t) for one or more selected reactor core performance parameters (e.g., MAPLHGR, MFLPD and CPR) are displayed as animated color-coded graphics in which colors and indicia change during the animation sequence to reflect the changing conditions within the core over a predetermined passage of time or sequence of events.
- the animated display images include one or more color-coded reactor core configuration diagrams, 301, one or more two-dimensional graphs/contour plots, 302, and a two-dimensional color-coded perspective image of the reactor core 303.
- Each core configuration diagram 301 consists of a 1 ⁇ 4-core representation of the arrangement of fuel bundles and control blades as viewed from the top of the reactor looking down into the core.
- the range of colors used by the visualization system in displaying the various diagrams and graphics are set to correspond to the range of numerical values possible for the particular performance parameter(s) selected for display.
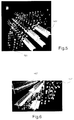
- FIGURES 4 through 6 show several example computer display screen images of a 3-D virtual reality model of a nuclear reactor core created from VRML files containing P(x,y,z) core performance data.
- control blades are represented by cross-beam figures 402, 502, 602 and fuel bundles are represented by vertical strings of color-coded cubes or blocks 401, 501, 601.
- the displayed color of each block is indicative of a numerical value or range for a selected performance parameter.
- the color of a particular block is indicative of the power being produced at a corresponding physical portion of the fuel bundle, e.g., "hotter" high-power portions are represented by red shades and "cooler" low-power portions by blue shades.
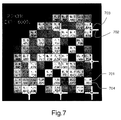
- FIGURE 7 shows an enlarged view of a portion of the display screen image of Figure 3 showing a 1 ⁇ 4-core diagram illustrating one of the dynamic performance parameters for the reactor core.
- a color-coded multi-square diagram represents the physical configuration (as viewed from above) of fuel bundles and control blades within a one-quarter section of a reactor core.
- Indicia identifying the particular performance parameter data selected for display by the viewer e.g., CPR
- CPR a numerical value indicative of the elapsed "exposure” (or "burn") time of the represented elements within the reactor core is displayed, e.g., a value representing units of elapsed time in the current burn cycle.
- Square color-coded boxes 700 represent fuel bundles and cross-like symbols 702 represent control blades.
- the color of each box or block is representative of the power produced by the fuel bundle at the current exposure time.
- Each box 700 also contains x and y location indicia 701 indicative of its position relative to other bundles in the core.
- Another (larger) numerical indicia 704 indicates the value of the currently selected performance parameter (e.g. CPR) associated with the particular fuel bundle.
- the cross-like symbols 702 representing control blades include central numeric indicia 703 that represent the vertical height of the control blade within the reactor core. Since the numerical values for various characteristics are time dependent, the displayed indicia are dynamic and will change during the animation sequence.
- the above described visualization system and method for presenting nuclear reactor core performance data is believed to be applicable to a wide range of reactors and core lading arrangements for reducing the man-hours of decision-making time required in determining core operational limits and evaluating nuclear core designs.
- the visualization system of the present invention is not intended to be limited solely to the use of the AVI protocol or VRML for creating animation of 3-D virtual reality modeling files from the acquired performance parameter data.
- any other conventional animation file protocol and/or 3-D virtual reality modeling software could be used in conjunction with the present invention by creating files of the appropriate protocol and format from the data stored in arrays 104/203 and 105/206.
Landscapes
- Engineering & Computer Science (AREA)
- Physics & Mathematics (AREA)
- General Engineering & Computer Science (AREA)
- Plasma & Fusion (AREA)
- High Energy & Nuclear Physics (AREA)
- Monitoring And Testing Of Nuclear Reactors (AREA)
- Processing Or Creating Images (AREA)
Abstract
A nuclear reactor core performance data visualization system provides a method and
apparatus for extracting and visually displaying large amounts of numerical
performance data (102) acquired from an operational nuclear reactor (100) or from a
nuclear reactor core simulator. The visualization system apparatus includes a color
display device (108), a digital computer (103) having a data storage memory, and one
or more data communications links for communicating with reactor core sensors
and/or other computers (101). After acquiring performance parameter data, the
visualization system computer (103) extracts selected performance data and
constructs two distinct data arrays (104,105) in memory that are used in creating
formatted files for generating specific types of visual displays. A first data array
(104), containing time-varying reactor performance parameter data corresponding to
the performance of reactor core elements in two dimensions over a predetermined
duration of time, is used to create digital image animation files (106) for displaying
dynamic color-coded graphics, including reactor core element diagrams and
mufti-ordinate graphs. Once animated, the displayed graphics allow the user to view a
time-wise evolution of the changing numerical values for selected core parameters
and other timedependent variables. A second data array (105), containing
spatially-related core performance parameter data corresponding to performance of
reactor core elements in three dimensions at one or more selected points) in time, is
used to create virtual reality modeling language (VRML) files (107) for displaying a
virtual 3-D color-coded reactor core model that can be manipulated in three
dimensions by the viewer.
Description
- The invention relates generally to nuclear reactor and, more particularly, to a method and apparatus for extracting and visually displaying core performance data from either a nuclear reactor core simulator or an operating nuclear reactor.
- In the process of making key decisions concerning the design, licensing and operation of nuclear power plants many reactor core performance parameters, such as Minimum Critical Power Ratio (MCPR) and Linear Heat Generation Rate (LHGR), must be carefully examined and studied by engineers and nuclear plant operators. Access to performance parameter data is important because these parameters reflect the continually changing thermal-hydraulic and thermal-mechanical conditions of the various elements which make up a reactor core -- such as, for example, the many fuel rod bundles and control blades. However, due to the dynamic nature of these parameters throughout a typical 18-month core cycle (one core "cycle" being the period of time after which one-third of the fuel bundles are due to be replaced), review of a vast amount of time-dependent performance parameter data may be required to adequately identify potential design or operational problems for any particular reactor core.
- Traditionally, measured (or simulated) reactor core performance parameter data is printed or displayed as numerical values in the form of tables and simple two-dimensional graphs. Due to the complexity of the engineering concepts involved, the examination and interpretation of time-varying, dynamic, multi-dimensional reactor performance data presented in this static form requires highly trained technical personnel having extensive knowledge and experience with nuclear reactor design, licensing requirements and operational limits. Moreover, partially due to the large amount of information, it is often an extremely laborious and time-consuming endeavor that can easily consume hundreds of costly man-hours. In addition, because of the traditional dependence on static numeric tables and non-animated two-dimensional graphs to portray information relating to time-varying three-dimensional parameters, reactor core performance is both difficult to analyze and prone to misinterpretation.
- Consequently, it would be desirable to be able to efficiently present complex nuclear engineering problems involving the review of large amounts of nuclear reactor performance data using a more intuitive manner of data presentation. In addition, it would be desirable to perform time-consuming evaluations of reactor core operating parameters using a more intuitive manner of data presentation. It would also be desirable to have an efficient and intuitive means for evaluating both the efficiency and quality of design of newly proposed and/or existing nuclear reactor core element configurations. In this regard, the present invention attempts to accomplish these objectives and overcome the inefficiencies of traditional approaches toward presenting and reviewing reactor performance data by providing specific data visualization tools that will enable nuclear engineers and reactor plant operators to view selected time-varying reactor core parameters as three-dimensional animation sequences, dynamic two-dimensional contour plots and manipulatable three-dimensional objects in a virtual reality environment.
- Since the operational parameters of a reactor core vary over time, the use of digital animation and three-dimensional representations to display the time-varying behavior of multiple nuclear core performance parameters can significantly reduce the decision-making time required in determining core operational limits or in evaluating new core designs. In an exemplary embodiment of the invention, a reactor core performance visualization system is provided that allows plant operators and engineers to view selected time-varying core parameters as three-dimensional animation sequences, dynamic two-dimensional contour plots or as a manipulatable image object in a virtual reality environment. Consequently, the present disclosure is directed toward a method and system for acquiring, extracting and visually displaying core performance data obtained from either an operating nuclear reactor core or a nuclear reactor core simulator.
- The reactor core performance visualization system of the present invention includes a data processor (which may be, for example, an Intel Pentium™ type processor found in conventional desktop personal computer systems) having a large data storage capacity and a color monitor or other display device capable of handling multi-color graphics. Initially, the performance visualization system acquires pertinent reactor core performance data from, for example, a reactor process control computer or a nuclear reactor core simulator via a communications link. Alternatively, the method and apparatus of the present invention could be incorporated as a part of a reactor process control computer or a reactor core simulation computer. Different types of reactor core performance data are identified, separated and organized into two separate data arrays stored in the visualization system computer memory. A first data array is constructed of spatially-related time-varying performance parameter data corresponding to reactor elements in two dimensions and organized, for example, according to its associated two-dimensional core location coordinate information (x, y). A second data array is constructed of spatially-related reactor core performance parameter data corresponding to performance of reactor elements in three dimensions at one or more selected point(s) in time and organized, for example, according to its associated three-dimensional spacial location coordinate (x, y, z) within the core.
- The visualization system then utilizes data from the first array to create digital animation display files for illustrating the time-wise evolution of the reactor core performance parameters. These files are preferably formatted using a conventional digital protocol for creating digital image animation files such as, for example, Microsoft Corporation's audio visual interleave (AVI) file protocol. In a similar manner, the three-dimensional spatially-related information stored in the second data array is used to generate virtual reality modeling language (VRML) protocol files. These VRML files are used by the visualization system to display a three-dimensional (3-D)model of a portion of a reactor core, portraying the 3-D configuration of fuel and control elements within the core, the viewing perspective of which may be manipulated by the viewer. The use of AVI and VRML protocol files in the present invention further allows for the easy and convenient transmission and exchange of reactor core performance information between parties using computers having conventional World Wide Web browser software (with the appropriate VRML and AVI software plug-ins), and communicating either over a local network or over larger distances via the internet.
- Utilizing one feature of the present invention, a reactor plant operator or engineer can view 2-D animated color-coded diagrams that both illustrate the positional configuration of elements within the core and indicate the value of the selected performance parameter for each element. Information is displayed for indicating the current burn cycle "exposure" time of a particular core element and the location in the core where operational or regulatory limits have been or will be exceeded. In this manner, any actual or potential violation of predetermined core operating limits can be easily and quickly identified visually. Utilizing another feature of the present invention, a reactor plant operator or engineer can control the view and orientation of a displayed 3-D virtual reality model of a reactor core to examine performance parameters of multiple core elements simultaneously. In addition, the virtual reality 3-D display feature of the visualization system can be operated so as to provide a simulated visual "fly-through" or "fly-around" tour of the reactor core. For these and other reasons apparent from the discussions of the best mode of the invention below, the present invention provides a much needed and more intuitive 3-D visualization tool for evaluating critical core safety and performance parameter data.
- An embodiment of the invention will now be described, by way of example,with reference to the accompanying drawings, in which:-
- FIGURE 1 is a block diagram of the reactor core performance visualization system illustrated in an arrangement for processing data from an operating nuclear reactor core;
- FIGURE 2 is a block diagram of the reactor core performance visualization system illustrated in an arrangement for processing data from a nuclear reactor core simulator;
- FIGURE 3 is an example computer display screen image of a single frame from a reactor core performance animation sequence;
- FIGURES 4 - 6 are example computer display screen images of a 3-D virtual reality model of a nuclear reactor core; and
- FIGURE 7 is an enlarged view of a portion of the display screen image of Figure 3 showing a ¼-core diagram for illustrating dynamic performance parameters of reactor core fuel bundles and control blades.
-
- In an exemplary embodiment of present invention, the data visualization system is configured to run as a software application under MicroSoft's Windows95 or 98™ operating system. In this manner, a user may enter various performance parameter selection criterion and visualization system commands for manipulating displayed images via keyboard or, for example, a point-and-click desk-top mouse input device.
- Referring now to FIGURE 1, the core performance data visualization system of the present invention is described in the context of communicating with an operational nuclear reactor. As indicated in
block 100, sensors and instrumentation located in an operational nuclear reactor core (not shown) provide real-time measurement data to some sort of reactor control computer or, for example, to a reactor coremonitoring system computer 101. Numerical core performance data acquired by coremonitoring system computer 101 is provided to the data visualization system of the present invention via adigital communications channel 102. The visualization system apparatus includes a digital computer orcentral processing unit 103, preferably having a large data storage capacity including both working RAM and archival storage, input devices such as a keyboard and a mouse (not shown), and a high resolutioncolor display device 108. Upon acquiring all pertinent core performance data from coremonitoring system computer 101,visualization system computer 103 constructs two distinct data arrays, 104 and 105, in memory from temporal and spatially-related core performance data. These two data arrays are then used in creating specially formatted files for generating different types of visual displays viewable onsystem monitor 108. - In an exemplary embodiment of present invention, the data visualization system uses VRML and creates AVI files. Both VRML programs and the AVI file protocol are well known. Likewise, VRML and AVI authoring/viewing software is commonly available from commercial software developers, either as shareware or as packaged products. Moreover, although the data visualization system of the present invention uses conventional AVI and VRML file protocols, other multimedia file protocols could be employed in the present invention for constructing and viewing the animation and 3-D image files.
- Referring again to FIGURE 1,
data array 104 is constructed in computer memory byvisualization system computer 103 from 2-D (two-dimensional) spatially-related time-varying core performance parameter data, P(x,y,t), received fromcore monitoring computer 101. This data includes various different performance parameter values associated with each element in the core and is indexed withinarray 104 according to a time value (elapsed real or exposure time) and a two-dimensional location coordinate for the particular core element.Visualization system computer 103 then uses the P(x,y,t) data to create AVI digitalimage animation files 106 for displaying a variety of dynamic color-coded graphics, such as reactor core element diagrams and multi-ordinate graphs. Conventional AVI file viewing software, resident in the visualization system computer memory, is used to accessanimation files 106 and display the animated 2-D color coded graphics ondisplay device 108. The animated graphics allow the user, for example, to simultaneously view the time-wise numerical evolution of core performance parameter values (and/or other multiple variable-dependent data) for one or more elements in the reactor core. - Preferably, the visualization system of the present invention utilizes the conventional MicroSoft Windows™ operating system environment to provide a user-friendly interface having parameter and display selection menus (not shown) to allow the viewer to select from a variety of display arrangements. For example, in accordance with the present invention, a user may select a display arrangement having multiple animated graphics for tracking several performance parameters simultaneously or a display arrangement showing only a single animated graphic of a ¼-core diagram illustrating the time-wise evolution of a selected parameter.
- Another
data array 105 is formed in system memory from 3-D (three-dimensional) spatially-related core performance parameter information, P(x,y,z), that was or is indicative of the state of the reactor core at a selected point(s) in time. This information includes performance parameter data and/or core configuration information indexed withinarray 105 according to its three-dimensional spacial location coordinate of origin within the core. The P(x,y,z) data inarray 105 is then formatted byvisualization system computer 103 into virtual reality modeling language (VRML)files 107. Conventional VRML file viewing software, resident in the visualization system computer memory, is used to accessVRML files 107 and display a virtual 3-D color-coded reactor core model image that can be manipulated in three dimensions by the viewer. Alternatively, the AVI and VRML files of the present invention can be viewed using a computer running a conventional memory-resident World Wide Web browser (e.g., Netscape Communicator4.51™) with the appropriate AVI or VRML "plug-in" (e.g., Netscape's avi plug-in DLL NPAVI32 or VRML World's Cosmo Player 1.0). - In FIGURE 2, an alternate embodiment of the reactor core performance visualization system of the present invention is shown in the context of obtaining performance data from a reactor core simulator. In this embodiment, a nuclear reactor core simulator computer, 200, provides simulated core performance parameter data via
data channel 201 to the core performance data visualization system. Just as described above with respect to Figure 1,visualization computer 202 selects and organizes this data into two separate arrays, 203 and 204, which are then used to respectively createAVI animation files 205 andVRML files 206 for producing a visual image(s) ondisplay device 208. - FIGURE 3 shows a single frame of an example animation sequence generated by the reactor core performance visualization system computer. In a preferred embodiment, spatially-related time-varying data, P(x,y,t), for one or more selected reactor core performance parameters (e.g., MAPLHGR, MFLPD and CPR) are displayed as animated color-coded graphics in which colors and indicia change during the animation sequence to reflect the changing conditions within the core over a predetermined passage of time or sequence of events. In a preferred embodiment, the animated display images include one or more color-coded reactor core configuration diagrams, 301, one or more two-dimensional graphs/contour plots, 302, and a two-dimensional color-coded perspective image of the
reactor core 303. Each core configuration diagram 301 consists of a ¼-core representation of the arrangement of fuel bundles and control blades as viewed from the top of the reactor looking down into the core. The range of colors used by the visualization system in displaying the various diagrams and graphics are set to correspond to the range of numerical values possible for the particular performance parameter(s) selected for display. - FIGURES 4 through 6 show several example computer display screen images of a 3-D virtual reality model of a nuclear reactor core created from VRML files containing P(x,y,z) core performance data. In this example embodiment, control blades are represented by cross-beam figures 402, 502, 602 and fuel bundles are represented by vertical strings of color-coded cubes or blocks 401, 501, 601. The displayed color of each block is indicative of a numerical value or range for a selected performance parameter. In a preferred embodiment, the color of a particular block is indicative of the power being produced at a corresponding physical portion of the fuel bundle, e.g., "hotter" high-power portions are represented by red shades and "cooler" low-power portions by blue shades.
- FIGURE 7 shows an enlarged view of a portion of the display screen image of Figure 3 showing a ¼-core diagram illustrating one of the dynamic performance parameters for the reactor core. A color-coded multi-square diagram represents the physical configuration (as viewed from above) of fuel bundles and control blades within a one-quarter section of a reactor core. Indicia identifying the particular performance parameter data selected for display by the viewer (e.g., CPR) is provided in the upper left-hand corner of the diagram. Immediately below the parameter identification, a numerical value indicative of the elapsed "exposure" (or "burn") time of the represented elements within the reactor core is displayed, e.g., a value representing units of elapsed time in the current burn cycle. Square color-coded boxes 700 represent fuel bundles and
cross-like symbols 702 represent control blades. The color of each box or block is representative of the power produced by the fuel bundle at the current exposure time. Each box 700 also contains x andy location indicia 701 indicative of its position relative to other bundles in the core. Another (larger)numerical indicia 704 indicates the value of the currently selected performance parameter (e.g. CPR) associated with the particular fuel bundle. Thecross-like symbols 702 representing control blades include centralnumeric indicia 703 that represent the vertical height of the control blade within the reactor core. Since the numerical values for various characteristics are time dependent, the displayed indicia are dynamic and will change during the animation sequence. - The above described visualization system and method for presenting nuclear reactor core performance data is believed to be applicable to a wide range of reactors and core lading arrangements for reducing the man-hours of decision-making time required in determining core operational limits and evaluating nuclear core designs. In addition, the visualization system of the present invention is not intended to be limited solely to the use of the AVI protocol or VRML for creating animation of 3-D virtual reality modeling files from the acquired performance parameter data. In practice, any other conventional animation file protocol and/or 3-D virtual reality modeling software could be used in conjunction with the present invention by creating files of the appropriate protocol and format from the data stored in
arrays 104/203 and 105/206.
Claims (14)
- A method for visually presenting nuclear reactor core performance data as animated two-dimensional graphics and three-dimensional images on a video display monitor (108) coupled to a computer (103), comprising the steps, executed by the computer, of:acquiring nuclear reactor core performance data from an operational reactor (100) or from another computer system (101) via a communications link (102);formatting time-varying reactor core performance parameter data acquired over a predetermined period of time into one or more image animation files (106), information in said image animation files being displayable on a video monitor (108) as one or more video image frames either singly or sequentially to form an animated image;formatting spatially-related core performance parameter data corresponding to one or more selected points in time into one or more virtual reality model image files (107), information in said virtual reality model image files being displayable on a video monitor (108) as a 3-D image; anddisplaying on said video monitor (108) one or more animated graphics or a three-dimensional model virtual image of a reactor core from information stored in said image animation files (106) and said virtual reality model image files (107).
- The method of claim 1 wherein said step of acquiring nuclear reactor core performance data further includes the steps, executed by a computer, of:creating in computer memory a first data array (104) comprising time-varying reactor core performance parameter data; andcreating in computer memory a second data array (105) comprising spatially-related core performance parameter data corresponding to one or more selected points in time.
- A method for visually presenting nuclear reactor core performance information as animated two-dimensional graphics and three-dimensional images, comprising the steps, executed by a computer, of:storing nuclear reactor core performance data, said data comprising spatially-related and temporally-related core performance parameter data acquired directly from an operational reactor (100) or from another computer system (101) via a communications link (102);generating a first data array (104) comprising time-varying reactor core performance parameter data corresponding to reactor core elements in two dimensions acquired over a predetermined duration of time;generating a second data array (105) comprising spatially-related core performance parameter data corresponding to reactor core elements in three dimensions acquired at one or more selected points) in time;formatting data from the first data array (104) into one or more image animation files (106) in accordance with an AVI protocol, information in said image animation files being displayable as one or more video image frames either singly or sequentially;formatting data from the second data array (105) into one or more 3-D virtual model image files (107) in accordance with a VRML protocol; andproviding to a display device (108) information from said image animation files or information from said 3-D virtual model image files for displaying one or more animated graphics illustrating a time-wise evolution of core performance parameters and/or an image of a three-dimensional virtual model of a reactor core.
- A system for displaying nuclear reactor core performance data, said system comprising a computer (103) including a storage memory and I/O devices including a graphics display device (108), said computer programmed to:(i) format time-varying reactor core performance parameter data (104) acquired over a predetermined period of time into one or more image animation files (106);(ii) format spatially-related reactor core performance parameter data (105) corresponding to one or more selected points in time into one or more virtual reality model image files (107); and(iii) display information from said image animation files (106) and/or said virtual reality model image files (107) on said graphic display device.
- The system of claim 4 wherein the computer includes a user interface input device and executable program instruction means for enabling a viewer to control a displayed perspective and viewing position of a 3-D virtual reality model image based on information from one or more of said virtual reality model image files.
- The system of claim 4 wherein an animation sequence play-back rate of displayed image animation file information may be selected and controlled by a viewer.
- The system of claim 4 wherein a displayed 3-D perspective and/or viewing position of displayed virtual reality model image file information may be selected and controlled by a viewer.
- The system of claim 4 wherein a three-dimensional virtual model image and/or displayed animated graphics comprise color-coded portions such that a predetermined range of displayed color frequencies correspond to a predetermined range of values for a selected performance parameter.
- The system of claim 4 wherein information displayed from said animation files produce animated graphics including a diagram of reactor core elements (301) and/or multi-ordinate graphs (302).
- A computer program embodied on a computer-readable medium for displaying nuclear reactor core performance and configuration information, comprising:means for formatting time-varying reactor core performance parameter data acquired over a predetermined period of time into one or more image animation files;means for formatting spatially-related core performance parameter data corresponding to one or more selected points in time into one or more virtual reality model image files; andmeans for displaying information from image animation files and/or virtual reality model image files on a display device.
- A nuclear reactor core performance data visualization system for displaying time-varying reactor core performance parameters comprising a computes (103) connected to a color graphics display device (108), said visualization system having a display arrangement including an animated reactor core configuration diagram (301) wherein reactor fuel bundles are represented by color-coded boxes (700) labeled with numerical indicia (704) indicative of a selected performance parameter value, and reactor control blades are represented by cross-like figures (702) positioned between the boxes and labeled with numerical indicia (703) representing a vertical position within a reactor core.
- A nuclear reactor core performance data visualization system as set forth in claim 11 wherein the boxes representing fuel bundles are further labeled with indicia (701) indicative of relative bundle position within a reactor core.
- A nuclear reactor core performance data visualization system as set forth in claim 11 wherein relative positions of the boxes in the display arrangement correspond to positions of fuel bundles within a reactor core.
- A nuclear reactor core performance data visualization system as set forth in claim 11 wherein indicia and color of the boxes change dynamically during display in accordance with changes in numerical value of associated performance parameters.
Applications Claiming Priority (2)
| Application Number | Priority Date | Filing Date | Title |
|---|---|---|---|
| US09/393,290 US6404437B1 (en) | 1999-09-10 | 1999-09-10 | Nuclear reactor core performance data visualization system |
| US393290 | 1999-09-10 |
Publications (1)
| Publication Number | Publication Date |
|---|---|
| EP1083576A1 true EP1083576A1 (en) | 2001-03-14 |
Family
ID=23554094
Family Applications (1)
| Application Number | Title | Priority Date | Filing Date |
|---|---|---|---|
| EP00307235A Withdrawn EP1083576A1 (en) | 1999-09-10 | 2000-08-22 | Nuclear reactor core performance data visualization system |
Country Status (3)
| Country | Link |
|---|---|
| US (1) | US6404437B1 (en) |
| EP (1) | EP1083576A1 (en) |
| JP (1) | JP2001228283A (en) |
Cited By (5)
| Publication number | Priority date | Publication date | Assignee | Title |
|---|---|---|---|---|
| EP1821314A1 (en) * | 2006-02-16 | 2007-08-22 | General Electric Company | Display, visualization, and processing tool for channel distortion and cell friction mitigation |
| CN108875213A (en) * | 2018-06-19 | 2018-11-23 | 哈尔滨工程大学 | A kind of reactor core thermal-hydraulic multiscale analysis method |
| CN111008070A (en) * | 2019-12-10 | 2020-04-14 | 北京科技大学 | A fast neutron reactor full-core channel parallel task division method and system |
| CN111128416A (en) * | 2019-12-31 | 2020-05-08 | 西安交通大学 | A visual thermal-hydraulic experimental device and method for a dead pipe section of a nuclear power plant |
| US20240006086A1 (en) * | 2021-03-19 | 2024-01-04 | Ats Corporation | Systems and methods for simulating an operation of one or more automated tools within a nuclear facility |
Families Citing this family (34)
| Publication number | Priority date | Publication date | Assignee | Title |
|---|---|---|---|---|
| US7155715B1 (en) * | 1999-03-31 | 2006-12-26 | British Telecommunications Public Limited Company | Distributed software system visualization |
| US6678585B1 (en) * | 1999-09-28 | 2004-01-13 | Pavilion Technologies, Inc. | Method and apparatus for maximizing power usage in a power plant |
| JP3548065B2 (en) * | 1999-11-15 | 2004-07-28 | インターナショナル・ビジネス・マシーンズ・コーポレーション | Remote control system, server / client system, product terminal device control server, product terminal device operation method, device information sharing method, and storage medium |
| DE10005881A1 (en) * | 2000-02-10 | 2001-08-30 | Norbert Zimmermann | Process and system for the visualization of three-dimensional objects |
| US7231333B2 (en) * | 2003-03-31 | 2007-06-12 | Global Nuclear Fuel - Americas, Llc | Method and arrangement for developing core loading patterns in nuclear reactors |
| US8873698B2 (en) * | 2002-12-18 | 2014-10-28 | Global Nuclear Fuel—Americas, LLC | Computer-implemented method and system for designing a nuclear reactor core which satisfies licensing criteria |
| US7200541B2 (en) | 2002-12-23 | 2007-04-03 | Global Nuclear Fuel-Americas, Llc | Method and arrangement for determining nuclear reactor core designs |
| US7222061B2 (en) * | 2002-12-18 | 2007-05-22 | Global Nuclear Fuel - Americas, Llc | Method and arrangement for developing rod patterns in nuclear reactors |
| US9047995B2 (en) * | 2002-12-18 | 2015-06-02 | Global Nuclear Fuel—Americas, LLC | Method and system for designing a nuclear reactor core for uprated power operations |
| US7424412B2 (en) * | 2002-12-23 | 2008-09-09 | Global Nuclear Fuel - Americas, Llc | Method of determining nuclear reactor core design with reduced control blade density |
| US7693249B2 (en) * | 2003-01-31 | 2010-04-06 | Global Nuclear Fuel - Americas, Llc | Method of improving nuclear reactor performance |
| US7280946B2 (en) * | 2003-04-30 | 2007-10-09 | Global Nuclear Fuel-Americas, Llc | Method and arrangement for determining pin enrichments in fuel bundle of nuclear reactor |
| US7499840B2 (en) * | 2003-10-06 | 2009-03-03 | Global Nuclear Fuel - Americas, Llc | Method and apparatus for creating and editing a nuclear reactor core loading template |
| US7636652B2 (en) * | 2003-10-06 | 2009-12-22 | Global Nuclear Fuel - Americas, Llc | Method and apparatus for facilitating recovery of nuclear fuel from a fuel pool |
| CN1760990B (en) | 2004-10-15 | 2011-11-30 | 西屋电气有限责任公司 | Improved first core fuel assembly configuration and method of implementing same |
| US8041548B2 (en) * | 2004-12-30 | 2011-10-18 | Global Nuclear Fuels-Americas, LLC | Method and apparatus for evaluating a proposed solution to a constraint problem for a nuclear reactor involving channel deformation |
| US7409032B2 (en) * | 2005-05-13 | 2008-08-05 | Global Nuclear Fuel - Americas, Llc | Method of fuel bundle consideration in a reactor |
| JP4703281B2 (en) * | 2005-06-17 | 2011-06-15 | 株式会社東芝 | BWR excess fuel health monitoring system |
| US8294705B2 (en) * | 2007-05-10 | 2012-10-23 | International Business Machines Corporation | Virtual network operations center |
| US8373698B2 (en) * | 2007-05-10 | 2013-02-12 | International Business Machines Corporation | Holographic enterprise network |
| US7839401B2 (en) * | 2007-05-10 | 2010-11-23 | International Business Machines Corporation | Management of enterprise systems and applications using three-dimensional visualization technology |
| US20080288220A1 (en) * | 2007-05-17 | 2008-11-20 | Dillenberger Donna N | Use of a three-dimensional (3d) data center to share service operations |
| US8259099B2 (en) * | 2007-05-17 | 2012-09-04 | International Business Machines Corporation | Use of three-dimensional data center to support servicing external operations |
| RU2358314C1 (en) * | 2007-10-08 | 2009-06-10 | Федеральное государственное унитарное предприятие "Научно-исследовательский технологический институт имени А.П. Александрова" | Method of simulating nuclear reactor reactivity |
| US8587640B2 (en) * | 2008-05-26 | 2013-11-19 | Colin Gavrilenco | Display device for displaying cross-sectional representations of an object |
| US9489279B2 (en) * | 2011-01-18 | 2016-11-08 | Cisco Technology, Inc. | Visualization of performance data over a network path |
| US9424376B2 (en) | 2011-11-18 | 2016-08-23 | Terrapower, Llc | Enhanced neutronics systems |
| US20140376678A1 (en) * | 2013-06-25 | 2014-12-25 | Robert H. Leyse | Method of and Apparatus for Monitoring a Nuclear Reactor Core Under Normal and Accident Conditions |
| US9152695B2 (en) * | 2013-08-28 | 2015-10-06 | Intelati, Inc. | Generation of metadata and computational model for visual exploration system |
| JP6366960B2 (en) * | 2014-02-28 | 2018-08-01 | 株式会社東芝 | Monitoring system and monitoring method |
| EP3586341B1 (en) * | 2017-02-27 | 2023-10-25 | TerraPower, LLC | Method for modeling a nuclear reactor |
| TWI669616B (en) * | 2018-08-13 | 2019-08-21 | 行政院原子能委員會核能研究所 | Simulate segmentation methodology of cylinder and pie cake digital model |
| CN112860967B (en) * | 2021-02-02 | 2024-06-21 | 中广核工程有限公司 | Nuclear accident multivariate information visualization method and electronic device for multiple types of users |
| JP7830377B2 (en) * | 2023-03-20 | 2026-03-16 | 株式会社東芝 | Core monitoring system and core monitoring program |
Citations (4)
| Publication number | Priority date | Publication date | Assignee | Title |
|---|---|---|---|---|
| EP0088572A2 (en) * | 1982-03-01 | 1983-09-14 | The Babcock & Wilcox Company | Systems for monitoring abnormal transient conditions in pressurised water nuclear reactor installations |
| EP0243049A2 (en) * | 1986-04-10 | 1987-10-28 | Westinghouse Electric Corporation | Two and three dimensional core power distribution monitor and display |
| WO1996003753A1 (en) * | 1994-07-21 | 1996-02-08 | Westinghouse Electric Corporation | Method and a system for accurately calculating pwr power from excore detector currents corrected for changes in 3-d power distribution and coolant density |
| EP0860759A1 (en) * | 1997-02-20 | 1998-08-26 | Volkswagen Aktiengesellschaft | Method and device for multimedia visualisation of complex systems |
Family Cites Families (8)
| Publication number | Priority date | Publication date | Assignee | Title |
|---|---|---|---|---|
| JP3037717B2 (en) * | 1990-04-27 | 2000-05-08 | 株式会社東芝 | Reactor fuel assembly |
| AU2683192A (en) * | 1991-09-17 | 1993-04-27 | General Physics International Engineering & Simulation, Inc. | Real time analysis of power plant thermohydraulic phenomenon |
| US5309485A (en) * | 1992-07-06 | 1994-05-03 | General Electric Company | Core automated monitoring system |
| JP3253450B2 (en) * | 1994-06-21 | 2002-02-04 | 株式会社東芝 | Core performance estimation device and core performance estimation method |
| US5790616A (en) | 1996-08-09 | 1998-08-04 | General Electric Company | Method and system for determining nuclear reactor core control blade positioning |
| US5790618A (en) | 1997-07-21 | 1998-08-04 | General Electric Company | Method and system for determining the impact of a mislocated nuclear fuel bundle loading |
| US6097399A (en) * | 1998-01-16 | 2000-08-01 | Honeywell Inc. | Display of visual data utilizing data aggregation |
| SE521873C2 (en) * | 1998-08-25 | 2003-12-16 | Toshiba Kk | A core energy instrument system fixed in the core |
-
1999
- 1999-09-10 US US09/393,290 patent/US6404437B1/en not_active Expired - Fee Related
-
2000
- 2000-08-22 EP EP00307235A patent/EP1083576A1/en not_active Withdrawn
- 2000-09-08 JP JP2000272401A patent/JP2001228283A/en not_active Withdrawn
Patent Citations (4)
| Publication number | Priority date | Publication date | Assignee | Title |
|---|---|---|---|---|
| EP0088572A2 (en) * | 1982-03-01 | 1983-09-14 | The Babcock & Wilcox Company | Systems for monitoring abnormal transient conditions in pressurised water nuclear reactor installations |
| EP0243049A2 (en) * | 1986-04-10 | 1987-10-28 | Westinghouse Electric Corporation | Two and three dimensional core power distribution monitor and display |
| WO1996003753A1 (en) * | 1994-07-21 | 1996-02-08 | Westinghouse Electric Corporation | Method and a system for accurately calculating pwr power from excore detector currents corrected for changes in 3-d power distribution and coolant density |
| EP0860759A1 (en) * | 1997-02-20 | 1998-08-26 | Volkswagen Aktiengesellschaft | Method and device for multimedia visualisation of complex systems |
Cited By (7)
| Publication number | Priority date | Publication date | Assignee | Title |
|---|---|---|---|---|
| EP1821314A1 (en) * | 2006-02-16 | 2007-08-22 | General Electric Company | Display, visualization, and processing tool for channel distortion and cell friction mitigation |
| CN108875213A (en) * | 2018-06-19 | 2018-11-23 | 哈尔滨工程大学 | A kind of reactor core thermal-hydraulic multiscale analysis method |
| CN108875213B (en) * | 2018-06-19 | 2022-04-12 | 哈尔滨工程大学 | Reactor core thermal hydraulic multi-scale analysis method |
| CN111008070A (en) * | 2019-12-10 | 2020-04-14 | 北京科技大学 | A fast neutron reactor full-core channel parallel task division method and system |
| CN111008070B (en) * | 2019-12-10 | 2023-05-12 | 北京科技大学 | A fast neutron reactor core channel parallel task division method and system |
| CN111128416A (en) * | 2019-12-31 | 2020-05-08 | 西安交通大学 | A visual thermal-hydraulic experimental device and method for a dead pipe section of a nuclear power plant |
| US20240006086A1 (en) * | 2021-03-19 | 2024-01-04 | Ats Corporation | Systems and methods for simulating an operation of one or more automated tools within a nuclear facility |
Also Published As
| Publication number | Publication date |
|---|---|
| US6404437B1 (en) | 2002-06-11 |
| JP2001228283A (en) | 2001-08-24 |
Similar Documents
| Publication | Publication Date | Title |
|---|---|---|
| US6404437B1 (en) | Nuclear reactor core performance data visualization system | |
| US6289299B1 (en) | Systems and methods for interactive virtual reality process control and simulation | |
| CN104680260B (en) | A kind of power grid visualization sensor model construction method and system | |
| Mahadev et al. | Envisioning power system data: concepts and a prototype system state representation | |
| US8316313B2 (en) | Method for selecting shapes in a graphical display | |
| CN107529667B (en) | Mixed reality nuclear power plant simulation and analysis system | |
| CN115062493B (en) | Digital twin system dedicated to continuous operation test of power grid secondary equipment and construction method | |
| CN107657135B (en) | A method and system for replacing the inner stator of a nuclear power plant generator | |
| CN112035934B (en) | Method for performing construction management control based on digital design model of transformer substation | |
| Klump et al. | An advanced visualization platform for real-time power system operations | |
| CN111176642A (en) | Interaction visualization processing system based on plane graph and application method | |
| EP0449293A2 (en) | Method and apparatus for three-dimensional displaying of a physical quantity | |
| Guo et al. | Visualization of a hydro-electric generating unit and its applications | |
| CN109918738B (en) | Three-dimensional visualization method, evaluation method and system for reactor power state of nuclear power plant | |
| Hsieh et al. | Visualization system for field monitoring data and its effectiveness | |
| Klump et al. | Real-time data retrieval and new visualization techniques for the energy industry | |
| CN119987901A (en) | A fast flow field visualization data loading method | |
| Arévalo et al. | Interactive visual procedure using an extended fmea and mixed-reality | |
| KR20210091484A (en) | Virtual screen processing device of power equipment and virtual screen providing method | |
| KR20250103195A (en) | Digital twin system for manufacturing processes using simulation data processing technology | |
| JP2001005522A (en) | Data display device | |
| Fujiwara et al. | User-friendly workstation for power systems analysis | |
| KR102933517B1 (en) | Modeling system and method reflecting realtime status based on data of manufacturing factory | |
| CN117876598B (en) | Three-dimensional expression method, system and readable storage medium for attribute volume model | |
| JPH04229377A (en) | Method for controlling image formed with computer |
Legal Events
| Date | Code | Title | Description |
|---|---|---|---|
| PUAI | Public reference made under article 153(3) epc to a published international application that has entered the european phase |
Free format text: ORIGINAL CODE: 0009012 |
|
| AK | Designated contracting states |
Kind code of ref document: A1 Designated state(s): DE SE |
|
| AX | Request for extension of the european patent |
Free format text: AL;LT;LV;MK;RO;SI |
|
| 17P | Request for examination filed |
Effective date: 20010914 |
|
| AKX | Designation fees paid |
Free format text: DE SE |
|
| STAA | Information on the status of an ep patent application or granted ep patent |
Free format text: STATUS: THE APPLICATION HAS BEEN WITHDRAWN |
|
| 18W | Application withdrawn |
Effective date: 20030522 |