EP1071042A2 - Method for determining the components of image noise patterns of an imaging device and use of this method in an imaging device - Google Patents
Method for determining the components of image noise patterns of an imaging device and use of this method in an imaging device Download PDFInfo
- Publication number
- EP1071042A2 EP1071042A2 EP00202314A EP00202314A EP1071042A2 EP 1071042 A2 EP1071042 A2 EP 1071042A2 EP 00202314 A EP00202314 A EP 00202314A EP 00202314 A EP00202314 A EP 00202314A EP 1071042 A2 EP1071042 A2 EP 1071042A2
- Authority
- EP
- European Patent Office
- Prior art keywords
- components
- dimensional
- flat field
- field data
- banding
- Prior art date
- Legal status (The legal status is an assumption and is not a legal conclusion. Google has not performed a legal analysis and makes no representation as to the accuracy of the status listed.)
- Granted
Links
Images




Classifications
-
- H—ELECTRICITY
- H04—ELECTRIC COMMUNICATION TECHNIQUE
- H04N—PICTORIAL COMMUNICATION, e.g. TELEVISION
- H04N17/00—Diagnosis, testing or measuring for television systems or their details
-
- G—PHYSICS
- G06—COMPUTING OR CALCULATING; COUNTING
- G06V—IMAGE OR VIDEO RECOGNITION OR UNDERSTANDING
- G06V10/00—Arrangements for image or video recognition or understanding
- G06V10/20—Image preprocessing
- G06V10/30—Noise filtering
-
- H—ELECTRICITY
- H04—ELECTRIC COMMUNICATION TECHNIQUE
- H04N—PICTORIAL COMMUNICATION, e.g. TELEVISION
- H04N5/00—Details of television systems
- H04N5/14—Picture signal circuitry for video frequency region
- H04N5/21—Circuitry for suppressing or minimising disturbance, e.g. moiré or halo
Definitions
- This invention relates to a method for determining the components of image noise patterns of an imaging device and use of this method in an imaging device. More particularly, this invention relates to a method for the separation of the components of nonuniformity assignable to banding (one-dimensional periodic noise), streaking (one-dimensional random noise), and granularity (two-dimensional random noise) from a flat field scan produced by a digital imaging system.
- Certain photographic or digital imaging components introduce a two-dimensional random noise into the image. In photographic components, this is the result of the random distribution of the photographic imaging elements or grains, and is termed granularity. In digital components, such two-dimensional noise can be generated by quantum or thermal fluctuations which are introduced into the electronic signal recorded by the individual pixels, and which vary randomly from pixel to pixel. Furthermore, digital imaging components may also introduce one-dimensional artifacts into the image, such as banding (one-dimensional periodic noise) or streaking (one-dimensional random noise). The spatial structure of these artifacts can be characterized by examining their microdensity profile, which can be thought of as a plot of the opacity of the image as a function of x and y spatial coordinates.
- the banding artifact is characterized by regularly spaced lines having a periodic microdensity profile, whereas the streaking artifact is characterized by a superposition of lines of random width, and spacing, leading to a random microdensity profile.
- Banding may result from periodic positioning errors in the placement of a one-dimensional pixel array, whereas streaking may result from random variations between the responses of adjacent pixels in a one-dimensional array.
- the above artifacts are most visible and objectionable in uniform or featureless areas of an image.
- imaging components are frequently tested for their tendency to introduce the above artifacts by examination of a flat field or featureless image produced by the imaging system.
- an image can be produced by capturing a uniform gray or colored background in a camera or scanner, and examining the captured image.
- a digital printer can be tested by creating a synthetic digital image in which all pixels are set to exactly the same digital code value, printing or displaying this image, and examining the output.
- a goal in the design and manufacture of imaging components, systems, or subsystems is to produce an image free of distortions or artifacts.
- an inventive method for determining at least one component of a noise pattern of an imaging device comprising the steps of:
- Another object of the present invention is to provide a computer program for determining at least one component of a noise pattern of an imaging device and thereby producing images free of distortions or artifacts.
- an inventive computer program embodied on a computer readable medium for determining at least one component of a noise pattern of an imaging device, comprising:
- a further object of the present invention is to provide an imaging device for determining at least one component of a noise pattern and thereby providing a correction tool for producing images with said imaging device, which are free of distortions or artifacts.
- an inventive imaging device comprising:
- the noise power spectrum provides a statistical description of random fluctuations, based on (image) data from uniform areas (flat fields). If periodic fluctuations are also present in the data, however, conventional NPS measurements provide inaccurate information about the magnitude of these components (see P. D. Burns, " Measurement of Random and Periodic Image Noise in Raster-Written Images ", SPSE Conference on Advances in Non-Impact Printing Technologies , 1984, pp. 139-142). If the NPS measurement is modified to accurately report the magnitude of these periodic components, then the random noise is not properly characterized.
- NPS Wiener spectrum
- vj is the jth spatial frequency
- L is the length of the measuring slit
- N is the number of points per segment
- m is the segment index
- M is the number of segments
- ⁇ x is the sampling increment
- d(x) represents a microdensity trace across a flat field
- d is the estimate of the mean density.
- a stable NPS estimate can be obtained that
- v x and v y are the spatial frequencies
- N x and N y are the number of points in the x and y directions, respectively, for each two dimensional block
- d(x,y) represents a two-dimensional microdensity trace across a flat field
- g2D(x,y) is a two-dimensional zero mean ergodic random process representing the image granularity
- sx(x) and sy(y) are one-dimensional zero mean ergodic random processes representing the streaking in the x and y directions, respectively
- bx(x) and by(y) are one-dimensional zero mean periodic functions representing the banding in the x and y directions, respectively.
- aj, vj, and ⁇ j are the amplitude, spatial frequency and phase of the jth component, respectively.
- NPS rand ( v x , v y ) G 2 D ( v x , v y )+ S x ( v x ) ⁇ ( v y )+ S y ( v y ) ⁇ ( v x )
- G 2D ( v x ,v y ) is the two-dimensional NPS of the image granularity
- S x (v x ) and S y (v y ) are the one-dimensional NPS of the streaking in the x and y directions, respectively
- ⁇ ( v ) is the Dirac delta function.
- the one dimensional periodic components generate a series of delta functions (e. g. line components) along the x and y axes, assuming that the banding is oriented along these axes.
- the key to the present invention lies in: (1) the assumption of additivity, and (2) the recognition that two of the artifacts of interest are one-dimensional in nature, so that information regarding these artifacts is restricted to the axes of the two-dimensional NPS.
- the artifact that is not restricted to the axes (granularity) can be estimated using the off-axis two-dimensional spectral information.
- the remaining two artifacts can then be separated because one creates a line spectrum (banding) while the other results in a continuous spectrum (streaking).
- the segmentation operations are performed in the following order: (1) banding estimation and removal; (2) granularity estimation; and (3) streaking estimation.
- the banding is removed first because of spectral leakage that biases the subsequent estimates of streaking and granularity.
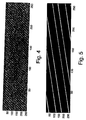
- Fig. 1 shows a synthetic image containing two-dimensional random noise, banding, and streaking artifacts.
- the banding occurs along the fast scan (x) and the slow scan (y) axes.
- the direction of fast scan is parallel to the width of a sheet of paper on which the image is printed.
- the slow scan direction is parallel to the length of the paper sheet.
- the magnitudes of the banding peaks and their frequencies can be estimated in a number of ways, for example, the technique described by Bouk et al. in "Measurement of Graininess for Halftone Electrophotography” , Proceedings of the IS&T's Eighth International Congress on Advances in Non-Impact Printing Technologies , October 25-30, 1992, pp. 166-170.
- the first step is to extract the axial portion of the two-dimensional NPS, then perform the banding estimation and removal, and finally reinsert the filtered axial spectrum back into the two-dimensional spectrum.
- the reinserted axial spectrum is now assumed to contain all streaking and all granularity power from along the axes; only the banding component has been removed.
- the banding which is actually expected from digital devices will be parallel to either the fast scan or the slow scan axis. This means that the images will all be similar to Fig. 1 rather than Fig. 4. If this is the case, then the two-dimensional banding removal filter is not required.
- a hybrid of one-dimensional and two-dimensional processing can be used instead. Row and column averages may be used to reduce the images to one-dimensional data, for purposes of estimating the spatial frequencies and amplitudes of interest along the two axes.
- Two-dimensional versions of the sine and cosine functions are then built and used to remove the banding component. Only after this banding component is removed is the two-dimensional spectrum generated, which is then used to estimate granularity and streaking.
- the spectral power along the axes of the two-dimensional spectrum represents the sum total of the streaking artifact and the granularity (see Eq. (6)). Since both artifacts result in continuous spectra, it is not possible to separate their individual contributions without an independent estimate of at least one of the artifact spectra. Since the granularity is the only artifact with a two-dimensional nature, it is possible to use the off-axis power of the two-dimensional spectrum to derive an independent estimate of the axial power distribution for the granularity. This is accomplished by taking a band adjacent to one of the axes, taken to be the x axis for the sake of specificity.
- the band used is 0 ⁇ y ⁇ 3 cycles/mm for all values of the x axis of the two-dimensional NPS.
- the granularity NPS along the y-axis is arrived at similarly.
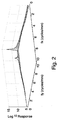
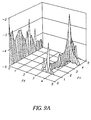
- Fig. 8a shows the two-dimensional NPS surface for a synthetic pattern containing two-dimensional random noise, streaking (along horizontal and vertical directions) and banding (also along both directions).
- Banding components were added at (nominal) frequencies of 0.5 cycles/mm along the direction of the x axis, and at 1.5 cycles/mm and 3.0 cycles/mm along the direction of the y axis.
- Table 1 shows the banding frequency and amplitude estimates that resulted from the banding filtering and removal procedure. These estimates agree well with the simulation input values, to within the precision of the measurement.
- Banding Estimates For Synthetic Data frequency along x (cycles/mm) Amplitude (optical density) frequency along y (cycles/mm) Amplitude (optical density) 0.50 0.089 1.54 0.033 2.86 0.158
- Fig. 8b shows the component one-dimensional estimates for the streaking and granularity NPS of the synthetic pattern. These show excellent agreement with the known NPS of the input components. Note that the periodic components have been successfully filtered, along with the attendant spectral leakage (for a description of spectral leakage, see F. J. Harris, " On the Use of Windows for Harmonic Analysis with the Discrete Fourier Transform ", Proceedings of the IEEE , Vol. 66, No. 1, January 1978, pp. 51-83). There is some evidence of a downward spike in the streaking NPS estimates at 1.5 cycles/mm, possibly due to a slight overestimation of the amplitude of this banding component.
- Patterns composed of single and multiple components were tested.
- the resulting component NPS estimates were compared to the known NPS of the individual components, prior to combination, and demonstrated to be accurate to within the statistical precision of the NPS estimates.
- the flat field was scanned on a reflection microdensitometer, using a 4x magnification objective with a numerical aperture of 0.1. Combining this objective with a 5x ocular and appropriate square aperture yields a nominal 50 micrometer square aperture at the specimen plane.
- An array of 1280 by 1280 points was scanned at 50 micrometer sample spacing, using an optical filter pack designed to simulate a y ( ⁇ ) spectral response (photopic visual response) cascaded with a D5000 illuminant.
- the two-dimensional NPS estimates that follow were computed with square blocks of length 128.
- Fig. 9a shows the two-dimensional NPS surface computed from the scan of a flat field of visual density 0.8 produced by a commercially available, electrophotographic laser printer. Prominent horizontal streaking is visible in the flat field, which produces the corresponding ridge in the two-dimensional NPS parallel to the y frequency axis. A triplet of spectral lines appears at roughly 4 cycles/mm, along both frequency axes and on the diagonal. The fact that these spectral lines appear in such a regular grid (as opposed to along one frequency axis only) is interpreted to be the result of a two-dimensional periodic pattern. The fact that there is no visually obvious one-dimensional banding in the field confirms this hypothesis.
- Table 2 shows the banding estimates for this printer sample.
- the banding components near 4 cycles/mm have comparable amplitudes that agree well with visual observations, and with amplitude estimates obtained from the axial NPS slices.
- the component along the y direction near 3 cycles/mm is also prominent.
- a component at 0.1 cycles/mm along the direction of the x axis, not obvious in the two-dimensional NPS plot was identified using a one-dimensional NPS estimate with higher spectral resolution.
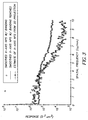
- the granularity NPS estimates (see Fig. 9b) are reasonable, compared with the two-dimensional noise floor seen in Fig. 9a.
- the streaking NPS estimate along the direction of the y axis (Fig. 9b), which has been scaled per Eq.
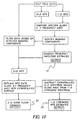
- FIG. 10 A flowchart of the spectral separation method is shown in Fig. 10.
- the input image which represents the scan of a flat field by a digital input device, or the scan of a flat field written by a digital output device, is read in, and both one-dimensional and two-dimensional NPS estimates are formed.
- the one-dimensional NPS estimates are obtained from spectral analysis of averages in the direction of the x and y axes.
- the one-dimensional and two-dimensional estimates are compared, and the spectral lines due to banding are identified. These periodic components are then filtered out of the flat field scan, as described previously.
- the banding frequency and amplitude estimates 10 are also output by the filtering algorithm during the course of the banding removal.
- the methods disclosed here can be applied to both monochrome (single color channel) and multiple color channel (for example, red, green and blue) images. Furthermore, the methods can be applied to each or all scans of a multiple color channel digital image, or to a color channel computed from the original, for example a luminance channel that is a weighted combination of red, green and blue values at each pixel.
- an imaging system or device may incorporate this invention into its components, in order to utilize the estimated two-dimensional random, one-dimensional streaking or one-dimensional banding components obtained using this invention to correct the image data, or to adjust the imaging system components or imaging system software to compensate for or remove any or all of the image noise.
- the spectral separation algorithm has been encoded in Matlab 5; the necessary source code is listed in Appendix I.
- the input to the program consists of a single channel image. It is obvious to anybody skilled in the art that other inputs are possible.
Landscapes
- Engineering & Computer Science (AREA)
- Multimedia (AREA)
- Health & Medical Sciences (AREA)
- Biomedical Technology (AREA)
- General Health & Medical Sciences (AREA)
- Signal Processing (AREA)
- Physics & Mathematics (AREA)
- General Physics & Mathematics (AREA)
- Theoretical Computer Science (AREA)
- Image Processing (AREA)
- Facsimile Image Signal Circuits (AREA)
- Testing, Inspecting, Measuring Of Stereoscopic Televisions And Televisions (AREA)
Abstract
Description


| Banding Estimates For Synthetic Data. | |||
| frequency along x (cycles/mm) | Amplitude (optical density) | frequency along y (cycles/mm) | Amplitude (optical density) |
| 0.50 | 0.089 | 1.54 | 0.033 |
| 2.86 | 0.158 |
| Banding Estimates For Electrophotographic Laser Printer | |||
| frequency along x (cycles/mm) | Amplitude (optical density) | frequency along y (cycles/mm) | Amplitude (optical density) |
| 0.10 | 0.002 | 2.96 | 0.016 |
| 3.91 | 0.002 | 3.93 | 0.005 |


Claims (11)
- A method for determining at least one component of a noise pattern of an imaging device, comprising the steps of:providing flat field data with respect to the specific imaging device;forming a preliminary estimate of banding components and streaking components; anddetermining the banding components, the two-dimensional random noise statistics and the streaking components.
- The method as claimed in claim 1 wherein the imaging device is selected from the group of consisting of a printer, a film scanner, a document or print scanner and a digital camera.
- A method for determining at least one component of a noise pattern of an imaging device, comprising the steps of:providing flat field data;forming a preliminary estimate of banding components by computing one-dimensional averages of the flat field data and carrying out a Fourier analysis of the one dimensional averages;determining the banding components by carrying out a two-dimensional Fourier analysis of the original flat field data, and comparing the result to the preliminary estimate;removing the banding components from the flat field data, to obtain modified flat field data;forming a second preliminary estimate of streaking components by carrying out a Fourier analysis on the modified flat field data;determining the two-dimensional random noise statistics by carrying out a Fourier analysis on the modified flat field data; and determining the streaking components by modifying the preliminary estimate of the streaking components with the two-dimensional random noise statistics.
- The method as claimed in claim 3 wherein the imaging device is selected from the group consisting of a printer, a film scanner, a document or print scanner and a digital camera.
- A computer program embodied on a computer readable medium for determining at least one component of a noise pattern of an imaging device, comprising:a data input segment providing flat field data with respect to the specific imaging device;a calculation segment for forming a preliminary estimate of banding components and streaking components which are part of said flat field data; anda plurality of data output segments providing a determination of the banding components, two-dimensional random noise statistics and the streaking components.
- The computer program as claimed in claim 5 wherein the imaging device is selected from the group consisting of a printer, a film scanner, a document or print scanner and a digital camera.
- A computer program embodied on a computer readable medium for determining at least one component of a noise pattern of an imaging device, comprising:a data input segment providing flat field data;a first estimate segment for forming preliminary banding components by computing one-dimensional averages of the flat field data and carrying out a Fourier analysis of the one dimensional averages;a determination segment for calculation the banding components by carrying out a two-dimensional Fourier analysis of the original flat field data, and comparing the result to the preliminary banding components;a filtering segment for removing the banding components from the flat field data, to obtain modified flat field data;a second estimate segment for forming a second preliminary estimate of streaking components by carrying out a Fourier analysis on the modified flat field data;a determination segment for determining the two-dimensional random noise statistics by carrying out a Fourier analysis on the modified flat field data; anda determination segment for determining the streaking components by modifying the preliminary estimate of the streaking components with the two-dimensional random noise statistics.
- The computer program as claimed in claim 5 wherein the imaging device is selected form the group of consisting of a printer, a film scanner, a document or print scanner and a digital camera.
- An imaging device comprising:a data input segment for providing flat field data;a control section for forming a preliminary estimate of banding components and streaking components, and determining the banding components, the two-dimensional random noise statistics and the streaking components; anda correction section for applying the determined banding components, the two-dimensional random noise statistics and the streaking components to image data.
- The imaging device as claimed in claim 9 is chosen from the group consisting of a printer, a film scanner, a document or print scanner and a digital camera.
- The imaging device as claimed in claim 9 wherein the control section comprises:a first estimate means for forming preliminary banding components by computing one-dimensional averages of the flat field data and carrying out a Fourier analysis of the one dimensional averages;a determination means for calculation the banding components by carrying out a two-dimensional Fourier analysis of the original flat field data, and comparing the result to the preliminary banding components;a subtraction means for removing the banding components from the flat field data, to obtain modified flat field data;a second estimate means for forming a second preliminary estimate of streaking components by carrying out a Fourier analysis on the modified flat field data;a determination means for determining the two-dimensional random noise statistics by carrying out a Fourier analysis on the modified flat field data; anda determination means for determining the streaking components by modifying the preliminary estimate of the streaking components with the two-dimensional random noise statistics.
Applications Claiming Priority (2)
| Application Number | Priority Date | Filing Date | Title |
|---|---|---|---|
| US09/356,584 US6584233B1 (en) | 1999-07-19 | 1999-07-19 | Method for determining the components of image noise patterns of an imaging device and use of this method in an imaging device |
| US356584 | 1999-07-19 |
Publications (3)
| Publication Number | Publication Date |
|---|---|
| EP1071042A2 true EP1071042A2 (en) | 2001-01-24 |
| EP1071042A3 EP1071042A3 (en) | 2003-05-28 |
| EP1071042B1 EP1071042B1 (en) | 2006-03-08 |
Family
ID=23402064
Family Applications (1)
| Application Number | Title | Priority Date | Filing Date |
|---|---|---|---|
| EP00202314A Expired - Lifetime EP1071042B1 (en) | 1999-07-19 | 2000-07-03 | Method for determining the components of image noise patterns of an imaging device and use of this method in an imaging device |
Country Status (4)
| Country | Link |
|---|---|
| US (1) | US6584233B1 (en) |
| EP (1) | EP1071042B1 (en) |
| JP (1) | JP2001067467A (en) |
| DE (1) | DE60026443D1 (en) |
Cited By (4)
| Publication number | Priority date | Publication date | Assignee | Title |
|---|---|---|---|---|
| EP1383306A3 (en) * | 2002-07-19 | 2004-09-29 | Hewlett-Packard Development Company, L.P. | Reducing artifacts in printing |
| EP1601178A3 (en) * | 2004-05-25 | 2008-02-20 | Xerox Corporation | Measurement and control of high frequency banding in a marking system |
| CN103903224A (en) * | 2012-12-25 | 2014-07-02 | 腾讯科技(深圳)有限公司 | Digital image banding noise processing method and apparatus |
| WO2020139595A1 (en) * | 2018-12-24 | 2020-07-02 | Gopro, Inc. | Reduction of banding artifacts in image processing |
Families Citing this family (11)
| Publication number | Priority date | Publication date | Assignee | Title |
|---|---|---|---|---|
| US6778290B2 (en) * | 2001-08-23 | 2004-08-17 | Eastman Kodak Company | Printing image frames corresponding to motion pictures |
| US6987881B2 (en) * | 2002-04-26 | 2006-01-17 | Keio University | Automatic visibility improvement method for digital image |
| JP4552583B2 (en) * | 2004-03-26 | 2010-09-29 | セイコーエプソン株式会社 | Noise detection apparatus, noise detection method, and noise detection program |
| JP4715995B2 (en) * | 2004-03-26 | 2011-07-06 | セイコーエプソン株式会社 | Banding noise detection device, banding noise detection method, and banding noise detection program |
| US7369145B2 (en) | 2005-01-10 | 2008-05-06 | Polaroid Corporation | Method and apparatus for controlling the uniformity of print density of a thermal print head array |
| US7672476B2 (en) * | 2005-01-26 | 2010-03-02 | Pixar | Bandlimited noise for computer graphics |
| US7508994B2 (en) * | 2005-12-05 | 2009-03-24 | Eastman Kodak Company | Method for detecting streaks in digital images |
| US7729559B2 (en) * | 2006-05-22 | 2010-06-01 | Ge Healthcare Bio-Sciences Corp. | System and method for optical section image line removal |
| KR20110062008A (en) * | 2009-12-02 | 2011-06-10 | 삼성전자주식회사 | Image forming apparatus and image noise processing method |
| US9092854B2 (en) * | 2013-07-30 | 2015-07-28 | Hewlett-Packard Indigo B.V. | Metrics to identify image smoothness |
| JP6704608B2 (en) | 2016-02-08 | 2020-06-03 | 富士ゼロックス株式会社 | Terminal device, diagnostic system and program |
Family Cites Families (5)
| Publication number | Priority date | Publication date | Assignee | Title |
|---|---|---|---|---|
| GB2205464B (en) | 1987-06-05 | 1991-12-11 | Gec Avionics | Image processing apparatus |
| US5799111A (en) * | 1991-06-14 | 1998-08-25 | D.V.P. Technologies, Ltd. | Apparatus and methods for smoothing images |
| US5537669A (en) | 1993-09-30 | 1996-07-16 | Kla Instruments Corporation | Inspection method and apparatus for the inspection of either random or repeating patterns |
| DE19511752A1 (en) | 1995-03-30 | 1996-10-10 | Siemens Ag | Process for high-resolution evaluation of signals for one- or two-dimensional direction or frequency estimation |
| US5691824A (en) * | 1995-06-29 | 1997-11-25 | Agfa Division, Bayer Corporation | Scanning system for scanning reflective and transmissive images |
-
1999
- 1999-07-19 US US09/356,584 patent/US6584233B1/en not_active Expired - Lifetime
-
2000
- 2000-07-03 DE DE60026443T patent/DE60026443D1/en not_active Expired - Lifetime
- 2000-07-03 EP EP00202314A patent/EP1071042B1/en not_active Expired - Lifetime
- 2000-07-19 JP JP2000218962A patent/JP2001067467A/en active Pending
Cited By (6)
| Publication number | Priority date | Publication date | Assignee | Title |
|---|---|---|---|---|
| EP1383306A3 (en) * | 2002-07-19 | 2004-09-29 | Hewlett-Packard Development Company, L.P. | Reducing artifacts in printing |
| EP1601178A3 (en) * | 2004-05-25 | 2008-02-20 | Xerox Corporation | Measurement and control of high frequency banding in a marking system |
| CN103903224A (en) * | 2012-12-25 | 2014-07-02 | 腾讯科技(深圳)有限公司 | Digital image banding noise processing method and apparatus |
| CN103903224B (en) * | 2012-12-25 | 2018-01-09 | 腾讯科技(深圳)有限公司 | The processing method and processing device of digital picture Banded improvement |
| WO2020139595A1 (en) * | 2018-12-24 | 2020-07-02 | Gopro, Inc. | Reduction of banding artifacts in image processing |
| US10863155B2 (en) | 2018-12-24 | 2020-12-08 | Gopro, Inc. | Reduction of banding artifacts in image processing |
Also Published As
| Publication number | Publication date |
|---|---|
| DE60026443D1 (en) | 2006-05-04 |
| JP2001067467A (en) | 2001-03-16 |
| US6584233B1 (en) | 2003-06-24 |
| EP1071042A3 (en) | 2003-05-28 |
| EP1071042B1 (en) | 2006-03-08 |
Similar Documents
| Publication | Publication Date | Title |
|---|---|---|
| EP1071042A2 (en) | Method for determining the components of image noise patterns of an imaging device and use of this method in an imaging device | |
| Leung et al. | Comparison of image data fusion techniques using entropy and INI | |
| US5592571A (en) | Digital pixel-accurate intensity processing method for image information enhancement | |
| Liu et al. | A universal destriping framework combining 1-D and 2-D variational optimization methods | |
| Kane et al. | Quantification of banding, streaking and grain in flat field images | |
| US7746505B2 (en) | Image quality improving apparatus and method using detected edges | |
| Brauers et al. | Direct PSF estimation using a random noise target | |
| CN114724000A (en) | Screen shot image moire processing method, device and equipment | |
| Wrigley et al. | Thematic mapper image quality: Registration, noise, and resolution | |
| EP1958158B1 (en) | Method for detecting streaks in digital images | |
| Sun et al. | Noise in 3D laser range scanner data | |
| Hader et al. | On noise-sensitive automatic tuning of gate-defined sensor dots | |
| Vartiainen et al. | Detection of irregularities in regular patterns | |
| JP2001074602A (en) | Apparatus and method for evaluating image | |
| Salah et al. | A fractional-order derivative variational framework for blind image deconvolution via nash game strategy | |
| Medford et al. | Removing Atmospheric Fringes from Zwicky Transient Facility i-band Images using Principal Component Analysis | |
| JPWO2006073155A1 (en) | Apparatus for pattern defect inspection, method thereof, and computer-readable recording medium recording the program thereof | |
| Sziranyi et al. | Overall picture degradation error for scanned images and the efficiency of character recognition | |
| Soulez et al. | Joint deconvolution and demosaicing | |
| Sizikov et al. | Removal of Complex Image Distortions via Solving Integral Equations Using the" Spectral Method". | |
| AKINTOYE et al. | COMPOSITE MEDIAN WIENER FILTER BASED TECHNIQUE FOR IMAGE ENHANCEMENT. | |
| Li et al. | PCA and wavelet transform for fusing panchromatic and multispectral images | |
| RU2316816C2 (en) | Method for removing noise on an image | |
| Ahmed | Image enhancement and noise removal by using new spatial filters | |
| DE112020000818T5 (en) | Method for depth measurement with a time-of-flight camera using amplitude-modulated continuous light |
Legal Events
| Date | Code | Title | Description |
|---|---|---|---|
| PUAI | Public reference made under article 153(3) epc to a published international application that has entered the european phase |
Free format text: ORIGINAL CODE: 0009012 |
|
| AK | Designated contracting states |
Kind code of ref document: A2 Designated state(s): AT BE CH CY DE DK ES FI FR GB GR IE IT LI LU MC NL PT SE |
|
| AX | Request for extension of the european patent |
Free format text: AL;LT;LV;MK;RO;SI |
|
| PUAL | Search report despatched |
Free format text: ORIGINAL CODE: 0009013 |
|
| AK | Designated contracting states |
Designated state(s): AT BE CH CY DE DK ES FI FR GB GR IE IT LI LU MC NL PT SE |
|
| AX | Request for extension of the european patent |
Extension state: AL LT LV MK RO SI |
|
| 17P | Request for examination filed |
Effective date: 20031103 |
|
| AKX | Designation fees paid |
Designated state(s): DE FR GB |
|
| 17Q | First examination report despatched |
Effective date: 20040421 |
|
| GRAP | Despatch of communication of intention to grant a patent |
Free format text: ORIGINAL CODE: EPIDOSNIGR1 |
|
| GRAS | Grant fee paid |
Free format text: ORIGINAL CODE: EPIDOSNIGR3 |
|
| GRAA | (expected) grant |
Free format text: ORIGINAL CODE: 0009210 |
|
| AK | Designated contracting states |
Kind code of ref document: B1 Designated state(s): DE FR GB |
|
| REG | Reference to a national code |
Ref country code: GB Ref legal event code: FG4D |
|
| REF | Corresponds to: |
Ref document number: 60026443 Country of ref document: DE Date of ref document: 20060504 Kind code of ref document: P |
|
| PG25 | Lapsed in a contracting state [announced via postgrant information from national office to epo] |
Ref country code: DE Free format text: LAPSE BECAUSE OF FAILURE TO SUBMIT A TRANSLATION OF THE DESCRIPTION OR TO PAY THE FEE WITHIN THE PRESCRIBED TIME-LIMIT Effective date: 20060609 |
|
| PG25 | Lapsed in a contracting state [announced via postgrant information from national office to epo] |
Ref country code: GB Free format text: LAPSE BECAUSE OF NON-PAYMENT OF DUE FEES Effective date: 20060703 |
|
| PLBE | No opposition filed within time limit |
Free format text: ORIGINAL CODE: 0009261 |
|
| STAA | Information on the status of an ep patent application or granted ep patent |
Free format text: STATUS: NO OPPOSITION FILED WITHIN TIME LIMIT |
|
| 26N | No opposition filed |
Effective date: 20061211 |
|
| GBPC | Gb: european patent ceased through non-payment of renewal fee |
Effective date: 20060703 |
|
| EN | Fr: translation not filed | ||
| PG25 | Lapsed in a contracting state [announced via postgrant information from national office to epo] |
Ref country code: FR Free format text: LAPSE BECAUSE OF FAILURE TO SUBMIT A TRANSLATION OF THE DESCRIPTION OR TO PAY THE FEE WITHIN THE PRESCRIBED TIME-LIMIT Effective date: 20070309 |
|
| PG25 | Lapsed in a contracting state [announced via postgrant information from national office to epo] |
Ref country code: FR Free format text: LAPSE BECAUSE OF FAILURE TO SUBMIT A TRANSLATION OF THE DESCRIPTION OR TO PAY THE FEE WITHIN THE PRESCRIBED TIME-LIMIT Effective date: 20060308 |