EP1010943B1 - Flame monitoring methods and apparatus - Google Patents
Flame monitoring methods and apparatus Download PDFInfo
- Publication number
- EP1010943B1 EP1010943B1 EP99308595A EP99308595A EP1010943B1 EP 1010943 B1 EP1010943 B1 EP 1010943B1 EP 99308595 A EP99308595 A EP 99308595A EP 99308595 A EP99308595 A EP 99308595A EP 1010943 B1 EP1010943 B1 EP 1010943B1
- Authority
- EP
- European Patent Office
- Prior art keywords
- wavelength
- flame
- produce
- transient species
- signal
- Prior art date
- Legal status (The legal status is an assumption and is not a legal conclusion. Google has not performed a legal analysis and makes no representation as to the accuracy of the status listed.)
- Expired - Lifetime
Links
- 238000012544 monitoring process Methods 0.000 title claims description 11
- 238000000034 method Methods 0.000 title claims description 10
- 239000000446 fuel Substances 0.000 claims description 65
- 238000001514 detection method Methods 0.000 claims description 52
- 230000001052 transient effect Effects 0.000 claims description 52
- 238000002485 combustion reaction Methods 0.000 claims description 31
- 239000004215 Carbon black (E152) Substances 0.000 claims description 14
- 229930195733 hydrocarbon Natural products 0.000 claims description 14
- 150000002430 hydrocarbons Chemical class 0.000 claims description 14
- 230000005670 electromagnetic radiation Effects 0.000 claims description 13
- 230000001419 dependent effect Effects 0.000 claims description 6
- 230000003750 conditioning effect Effects 0.000 claims description 5
- 230000000875 corresponding effect Effects 0.000 description 49
- 239000000047 product Substances 0.000 description 15
- 230000005855 radiation Effects 0.000 description 13
- 238000001228 spectrum Methods 0.000 description 4
- 238000004364 calculation method Methods 0.000 description 3
- 239000003344 environmental pollutant Substances 0.000 description 2
- 231100000719 pollutant Toxicity 0.000 description 2
- XUIMIQQOPSSXEZ-UHFFFAOYSA-N Silicon Chemical compound [Si] XUIMIQQOPSSXEZ-UHFFFAOYSA-N 0.000 description 1
- 238000013473 artificial intelligence Methods 0.000 description 1
- 238000013528 artificial neural network Methods 0.000 description 1
- QVGXLLKOCUKJST-UHFFFAOYSA-N atomic oxygen Chemical compound [O] QVGXLLKOCUKJST-UHFFFAOYSA-N 0.000 description 1
- 230000002596 correlated effect Effects 0.000 description 1
- 238000010586 diagram Methods 0.000 description 1
- 230000000694 effects Effects 0.000 description 1
- 238000000295 emission spectrum Methods 0.000 description 1
- 238000004519 manufacturing process Methods 0.000 description 1
- 229910052760 oxygen Inorganic materials 0.000 description 1
- 239000001301 oxygen Substances 0.000 description 1
- GGYFMLJDMAMTAB-UHFFFAOYSA-N selanylidenelead Chemical compound [Pb]=[Se] GGYFMLJDMAMTAB-UHFFFAOYSA-N 0.000 description 1
- 230000035945 sensitivity Effects 0.000 description 1
- 229910052710 silicon Inorganic materials 0.000 description 1
- 239000010703 silicon Substances 0.000 description 1
- 239000013589 supplement Substances 0.000 description 1
- 230000009897 systematic effect Effects 0.000 description 1
- XLYOFNOQVPJJNP-UHFFFAOYSA-N water Substances O XLYOFNOQVPJJNP-UHFFFAOYSA-N 0.000 description 1
Images



Classifications
-
- G—PHYSICS
- G01—MEASURING; TESTING
- G01N—INVESTIGATING OR ANALYSING MATERIALS BY DETERMINING THEIR CHEMICAL OR PHYSICAL PROPERTIES
- G01N25/00—Investigating or analyzing materials by the use of thermal means
-
- F—MECHANICAL ENGINEERING; LIGHTING; HEATING; WEAPONS; BLASTING
- F23—COMBUSTION APPARATUS; COMBUSTION PROCESSES
- F23N—REGULATING OR CONTROLLING COMBUSTION
- F23N5/00—Systems for controlling combustion
- F23N5/02—Systems for controlling combustion using devices responsive to thermal changes or to thermal expansion of a medium
- F23N5/08—Systems for controlling combustion using devices responsive to thermal changes or to thermal expansion of a medium using light-sensitive elements
- F23N5/082—Systems for controlling combustion using devices responsive to thermal changes or to thermal expansion of a medium using light-sensitive elements using electronic means
-
- F—MECHANICAL ENGINEERING; LIGHTING; HEATING; WEAPONS; BLASTING
- F23—COMBUSTION APPARATUS; COMBUSTION PROCESSES
- F23N—REGULATING OR CONTROLLING COMBUSTION
- F23N2229/00—Flame sensors
- F23N2229/16—Flame sensors using two or more of the same types of flame sensor
Definitions
- the invention relates to flame monitoring methods and apparatus.
- Flame monitoring apparatus embodying the invention may be used for monitoring a flame of burning hydrocarbon fuel such as in a boiler, furnace or other combustion equipment, in order to determine characteristics of the flame and, in particular, to provide information on the stoichiometry of the combustion process. In such an application, therefore, the apparatus can be used to improve combustion efficiency and reduce the production of pollutants.
- a known system for monitoring a hydrocarbon flame comprises a charge coupled device (CCD) array camera including an ultraviolet - visible image intensifier for sensing emission from CH species and/or OH species, and an infrared camera with band pass interference filters for sensing emission from, for example, CO species, CO 2 species and/or H 2 O species.
- CCD charge coupled device
- the CCD camera provides combustion information to allow control of the fuel air ratio.
- apparatus for monitoring a hydrocarbon flame comprising first detecting means responsive to electromagnetic radiation emitted by the flame in a first wavelength corresponding to a transient species existing for only a short time within the combustion region of the flame to produce a first detection signal, second detecting means responsive to electromagnetic radiation emitted by the flame in a second wavelength corresponding to a non-transient species in the combustion region to produce a second detection signal, and first comparing means responsive to the first and second detection signals to produce a first comparison signal, and output means for producing an output signal dependent on the air/fuel ratio in the flame, the apparatus being characterised by third detecting means responsive to electromagnetic radiation emitted by the flame in a third wavelength which corresponds to a second non-transient species and is different from the wavelength corresponding to the first-mentioned non-transient species whereby to produce a third detection signal, and by second comparison means responsive to the third detection signal and to one of the first and second detection signals to produce a second comparison signal, the output means being operative to produce the
- a method for monitoring a hydrocarbon flame comprising the steps of detecting electromagnetic radiation emitted by the flame in a first wavelength corresponding to a transient species existing for only a short time within the combustion region of the flame to produce a first detection signal, detecting electromagnetic radiation emitted by the flame in a second wavelength corresponding to a non-transient species in the combustion region to produce a second detection signal, comparing the first and second detection signals to produce a first comparison signal, and producing an output signal dependent on the air/fuel ratio in the flame, the method being characterised by the steps of detecting electromagnetic radiation emitted by the flame in a third wavelength which corresponds to a second non-transient species and is different from the wavelength corresponding to the first-mentioned non-transient species whereby to produce a third detection signal, comparing the third detection signal with one of the first and second detection signals to produce a second comparison signal, and producing the output signal in dependence on the first and second comparison signals.
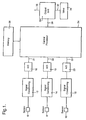
- the apparatus shown in Figure 1 comprises a plurality of electromagnetic radiation sensors. As will be explained in more detail below, there are at least three sensors and possibly more. For ease of description, Figure 1 shows three sensors, 6, 8 and 10. Each of these sensors is fitted with a narrow band filter so that it is only responsive to a narrow range of wavelengths in a particular band. These wavelengths and bands will be discussed in more detail below.
- the sensors are mounted in or on the boiler, furnace or other combustion apparatus and positioned to view the flame of burning hydrocarbon fuel which is to be monitored.
- the signals from each of the sensors dependent on the radiation sensed in the respective narrow range of wavelengths, are amplified and frequency-band limited by a respective one of signal conditioning units 12,14 and 16 and then passed to respective analogue to digital converters 18,19 and 20.
- the resultant digitised detection signals on lines 21,22 and 23 are passed to a central processing unit 24.
- a memory 26 is associated with the CPU 24.
- the CPU processes the data and provides information on the stoichiometry of the combustion process.
- the resultant output on a line 28 is passed to an output unit 30.
- the unit 30 can produce an output on a line 32 which automatically controls a valve arrangement shown diagrammatically at 34 which in turn can adjust the fuel/air ratio in the furnace, so as to produce the desired air/fuel ratio. This may be adjusted to the stoichiometric ratio, to maximise efficiency, or to a predetermined amount of excess air in order to reduce pollutants.
- the output unit 30 can produce an output on a line 36 for indicating the results of the flame monitoring process on a suitable display and/or for transmitting the information to a distant location.
- sensor 6 is arranged to be responsive to radiation in a narrow wavelength band centred at 2.96 ⁇ m
- sensor 8 is arranged to be responsive to radiation in a narrow wavelength band centred at 3.35 ⁇ m
- sensor 10 is arranged to be responsive to radiation in a narrow wavelength band centred at 3 10nm.
- sensors 6 and 8 can be lead selenide sensors
- sensor 10 can be a silicon sensor.
- the emission spectrum of a hydrocarbon flame contains various emission peaks, examples of which are as follows:-
- the vertical axis is the ratio of the power in a particular frequency band between two of the digitised detection signals (lines 18,19 and 20), to a logarithmic scale, and the horizontal axis is the air/fuel ratio relative to the stoichiometric value (1).
- curve A represents the ratio of the power in a particular frequency band in the detection signal from sensor 10 (at 310nm corresponding to the OH transient species) to the power in a particular frequency band in the detection signal from sensor 8 (at 3.35 ⁇ m corresponding to the emission from the hot hydrocarbon fuel).
- Curve B represents the ratio of the power in a particular frequency band in the detection signal from sensor 6 (at 2.9 ⁇ m, corresponding to H 2 O) to the power in a particular frequency band in the detection signal from sensor 8 (at 3.35 ⁇ m corresponding to the hot hydrocarbon fuel).
- the curves in Figure 2 were measured in a gas-fired furnace at 100% load (maximum fuel input), and were measured over a 10-30 Hz frequency band.
- FIG. 2 clearly shows that curve A varies much more significantly with the air/fuel ratio than does curve B, particularly over the important region close to the stoichiometric air/fuel ratio.
- the curves thus show that the frequency spectrum of the emissions due to the transient species (OH in this case) is significantly different from the frequency spectrum of the fuel or product species emissions and that these differences vary with flame stoichiometry.
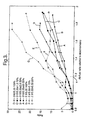
- Figure 3 corresponds to Figure 2 (the axes are the same although the vertical axis is not to a logarithmic scale in Figure 3), but shows curves at a range of different furnace loads or fuel inputs.
- the four curves shown in full line (curves A, B, C and D) all show the ratio of the power in a particular frequency band in the detection signal from sensor 10 (at 310nm corresponding to the OH transient species) to the power in a particular frequency band in the detection signal from sensor 8 (at 3.35 ⁇ m, corresponding to the hot fuel in the flame), curves A, B, C and D corresponding respectively to furnace loads or fuel inputs of 25%, 50%, 75% and 100% of the maximum.
- the dotted curves E, F, and G all show the ratio of the power in a particular frequency band in the detection signal from sensor 6 at 2.9 ⁇ m (the H 2 O product) to the power in a particular frequency band in the detection signal from sensor 8 at 3.35 ⁇ m (the hot fuel in the flame) .
- Curves E, F and G correspond respectively to the ratios at furnace loads or fuel inputs of 25%,75% and 100% of the maximum.
- the apparatus of Figure 1 uses the digitised detection signals on lines 18, 19 and 20 from the sensors 6,8 and 10 to measure the two ratios discussed above: (i) the ratio of the power in a particular frequency band in the detection signal corresponding to the OH transient species at 310nm to the detection signal corresponding to the emission from the hot fuel in the flame at 3.35 ⁇ m, and (ii) the ratio of the power in a particular frequency band in the detection signal corresponding to the H 2 O product at 2.9 ⁇ m to the power in a particular frequency band in the detection signal emission from the hot fuel in the flame at 3.35 ⁇ m.
- the CPU 24 can determine these two ratios by measuring the mean amplitude in each detector signal and comparing them. Alternatively, if the frequency pass bands of the signal conditioning units are relatively wide, the CPU can perform a Fast Fourier Transform on the digitised data, to convert it into the frequency domain, and then integrate over the required frequency band and again take the ratios. The resultant ratio data is then compared with data stored in the memory 26 (thus, in effect, using data corresponding to that shown in Figures 2 and 3) to determine the combustion conditions. The resultant signal on line 28 is then used by the output unit 30 to adjust the air/fuel ratio by means of the valve 34 to produce a desired air/fuel ratio (normally, just above stoichiometric).
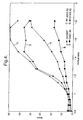
- Figure 4 is generally similar to Figure 2 (except that the vertical scale is not logarithmic), but plots power ratios between outputs at different wavelengths.
- curve A in Figure 4 shows the power ratio between the output at 310nm (the OH transient species) and the output at 927nm (corresponding to H 2 O), plotted against the air/fuel ratio.
- Curve B shows the power ratio between the output at 310nm (the OH transient species) and the output at 1.45 ⁇ m (again corresponding to H 2 O), plotted against the air/fuel ratio.
- Curve C shows the power ratio between the output at 431nm (the CH transient species) and the output at 3.35nm (corresponding the hot fuel) plotted against the air/fuel ratio.
- curve D shows the power ratio between the output at 516nm (the C 2 transient species) and the output at 3.35nm (the hot fuel), plotted against the air/fuel ratio.
- the curves were all measured in a gas-fired furnace at full load.
- Figure 4 shows that the sensors 6,8 and 10 (or one or two of them) can be modified to be sensitive to different radiation wavelengths so as to enable the CPU to measure one of the power ratios shown in Figure 4 and - thereby measure the air/fuel ratio in the flame.
- Curves generally similar in shape to Curves A,B,C and D in Figure 4 will also be obtained if the non-transient species measured is H 2 O at 2.9 ⁇ m or is CO 2 at 4.5 ⁇ m.
- Figures 5,6,7 and 8 show another mode of processing the data derived from the sensors 6,8 and 10.
- the detection signal data from the different detectors is correlated to derive the cross-correlation coefficient (vertical axis), and this is plotted against the air/fuel ratio relative to stoichiometric (horizontal axis).
- curve A in Figure 5 shows how the cross-correlation coefficient between the detection signal at 310nm corresponding to the OH transient species (sensor 10), and the detection signal at 3.35 ⁇ m corresponding to the hot fuel in the flame (sensor 8) varies with the air/fuel ratio.
- Curve A shows that there is a significant variation which is substantially linear over the important region adjacent to the stoichiometric ratio.
- Curve A in Figure 8 shows how the cross-correlation coefficient between the detection signal at 2.9 ⁇ m (sensor 6), corresponding to the H 2 O combustion product, and the detection signal at 3.35 ⁇ m, corresponding to the hot fuel in the flame (sensor 8), varies with the air/fuel ratio. The variation is small, and substantially less than the variation shown by curve A in Figure 5.
- the CPU 24 ( Figure 1) performs the required correlation calculations (i) on the digital data received from the sensors 8 and 10 (corresponding to curve A in Figure 5) and (ii) on the digital data received from the sensors 6 and 8 (corresponding to curve A in Figure 5).
- the two correlation outputs can be compared with each other and also respectively compared with data stored in the memory 26 to determine the air/fuel ratio.
- the CPU can adjust the air/fuel ratio to bring it to the desired value.
- Curve B in Figure 5 shows how the cross-correlation coefficient between the detection signal at 310nm (the OH transient species, sensor 10) and the detection signal at 2.9 ⁇ m (water, sensor 6) varies with the air/fuel ratio. Again, there is a significant variation (generally similar to though not as great as that of curve A in Figure 5). Therefore, the CPU 24 can produce correlation calculations on the digital data received from sensors 6 and 10 to supplement the correlation calculations specified above on the data received from the other two pairs of sensors.
- sensor 6 could instead be arranged to be responsive to emission corresponding to a product of combustion at a different wavelength from 2.9 ⁇ m; for example, H 2 O at 927nm or at 1.45 ⁇ m, or CO 2 at 4.5 ⁇ m.
- Sensor 8 could be arranged to be responsive to emission from a product of combustion, instead of to emission from the hot fuel in the flame. Obviously, though, if it were responsive to the emission corresponding to a product of combustion, this would be at a different wavelength from the wavelength to which sensor 6 is responsive.
- Sensor 10 could be arranged to be responsive to radiation from some other transient species such as those mentioned earlier: CH at about 431 nm and C 2 at about 517nm, for example.
- curves C,D and E in Figure 5 show the correlation coefficient between the output at 310nm (in each case) on the one hand and the outputs at 1.45 ⁇ m (H 2 O combustion product), 4.5 ⁇ m (CO 2 combustion product) and 927nm (H 2 O combustion product) respectively on the other hand. Again, these curves all show significant variation with air/fuel ratio, though somewhat less than for curve A in Figure 5.
- curves B to J show the correlation coefficients between the outputs corresponding to different pairs of non-transient species as follows:-
- FIG 8 shows that curves B to J are generally similar in shape to curve A in Figure 5: the variation of each correlation coefficient with the air/fuel ratio is small.
- the apparatus may be set up so as to operate simultaneously or sequentially in the two different modes (the first mode in which it takes the ratio of the outputs in a particular frequency band from each detector signal and the second mode in which it measures the correlation coefficients).
- the result will be to produce two or more estimates of the combustion conditions represented by the air/fuel ratio relative to stoichiometric.
- the CPU could then be arranged to make a weighted judgement between the estimates in order to control the output unit 30 and the valve unit 34.
- a suitable artificial intelligence means could be used such as an expert system, by using fuzzy or conventional logical rules, or by means of an artificial neural network.
- the emission of radiation in a narrow wavelength band corresponding to a transient species that exists only for a short time within the combustion region is compared with the emission in at least one narrow wavelength band corresponding to the hot hydrocarbon fuel in the flame or to a product of combustion to produce an output varying significantly with the air/fuel ratio.
- the emission of radiation in wavelength bands respectively corresponding to non-transient species such as different products of combustion or a product of combustion and the fuel, can be also compared to produce an output varying only slightly with the air/fuel ratio, in order to improve the discrimination process by contrasting the outputs respectively produced with and without the use of the emission due to the transient species.
- the comparison involving the two non-transient species may be omitted.
- two of the sensors could be responsive to radiation in wavelength bands corresponding to different transient species, with the third responsive to radiation in a wavelength band corresponding to a non-transient species.
- the emission corresponding to each of the transient species could then be compared with the emission corresponding to the non-transient species.
- more than three sensors could be used to provide further sensitivity of discrimination with at least one being responsive to radiation in a wavelength corresponding to a transient species.
Landscapes
- Engineering & Computer Science (AREA)
- Chemical & Material Sciences (AREA)
- Combustion & Propulsion (AREA)
- Mechanical Engineering (AREA)
- General Engineering & Computer Science (AREA)
- Analytical Chemistry (AREA)
- Health & Medical Sciences (AREA)
- Life Sciences & Earth Sciences (AREA)
- Physics & Mathematics (AREA)
- Biochemistry (AREA)
- General Health & Medical Sciences (AREA)
- General Physics & Mathematics (AREA)
- Immunology (AREA)
- Pathology (AREA)
- Control Of Combustion (AREA)
- Investigating, Analyzing Materials By Fluorescence Or Luminescence (AREA)
- Investigating Or Analyzing Materials Using Thermal Means (AREA)
Description
- The invention relates to flame monitoring methods and apparatus. Flame monitoring apparatus embodying the invention, and to be described below by way of example only, may be used for monitoring a flame of burning hydrocarbon fuel such as in a boiler, furnace or other combustion equipment, in order to determine characteristics of the flame and, in particular, to provide information on the stoichiometry of the combustion process. In such an application, therefore, the apparatus can be used to improve combustion efficiency and reduce the production of pollutants.
- A known system for monitoring a hydrocarbon flame, as disclosed in US patent No. 5249954, comprises a charge coupled device (CCD) array camera including an ultraviolet - visible image intensifier for sensing emission from CH species and/or OH species, and an infrared camera with band pass interference filters for sensing emission from, for example, CO species, CO2 species and/or H2O species. The CCD camera provides combustion information to allow control of the fuel air ratio.
- Detection of emissions from the C2, CH and/or OH species by a pair of photodiodes is also known from UK patent No. 2204428.
- According to the invention, there is provided apparatus for monitoring a hydrocarbon flame, comprising first detecting means responsive to electromagnetic radiation emitted by the flame in a first wavelength corresponding to a transient species existing for only a short time within the combustion region of the flame to produce a first detection signal, second detecting means responsive to electromagnetic radiation emitted by the flame in a second wavelength corresponding to a non-transient species in the combustion region to produce a second detection signal, and first comparing means responsive to the first and second detection signals to produce a first comparison signal, and output means for producing an output signal dependent on the air/fuel ratio in the flame, the apparatus being characterised by third detecting means responsive to electromagnetic radiation emitted by the flame in a third wavelength which corresponds to a second non-transient species and is different from the wavelength corresponding to the first-mentioned non-transient species whereby to produce a third detection signal, and by second comparison means responsive to the third detection signal and to one of the first and second detection signals to produce a second comparison signal, the output means being operative to produce the output signal in dependence on the first and second comparison signals.
- According to the invention, there is further provided a method for monitoring a hydrocarbon flame, comprising the steps of detecting electromagnetic radiation emitted by the flame in a first wavelength corresponding to a transient species existing for only a short time within the combustion region of the flame to produce a first detection signal, detecting electromagnetic radiation emitted by the flame in a second wavelength corresponding to a non-transient species in the combustion region to produce a second detection signal, comparing the first and second detection signals to produce a first comparison signal, and producing an output signal dependent on the air/fuel ratio in the flame, the method being characterised by the steps of detecting electromagnetic radiation emitted by the flame in a third wavelength which corresponds to a second non-transient species and is different from the wavelength corresponding to the first-mentioned non-transient species whereby to produce a third detection signal, comparing the third detection signal with one of the first and second detection signals to produce a second comparison signal, and producing the output signal in dependence on the first and second comparison signals.
- Preferred embodiments of the invention are object of the dependent claims.
- Flame monitoring methods and apparatus according to the invention will now be described, by way of example only, with reference to the accompanying diagrammatic drawings in which:
- Figure 1 is a block diagram of one form of the apparatus; and
- Figures 2 - 8 are graphs for explaining the operation of the apparatus of Figure 1.
-
- The apparatus shown in Figure 1 comprises a plurality of electromagnetic radiation sensors. As will be explained in more detail below, there are at least three sensors and possibly more. For ease of description, Figure 1 shows three sensors, 6, 8 and 10. Each of these sensors is fitted with a narrow band filter so that it is only responsive to a narrow range of wavelengths in a particular band. These wavelengths and bands will be discussed in more detail below. The sensors are mounted in or on the boiler, furnace or other combustion apparatus and positioned to view the flame of burning hydrocarbon fuel which is to be monitored. The signals from each of the sensors, dependent on the radiation sensed in the respective narrow range of wavelengths, are amplified and frequency-band limited by a respective one of
signal conditioning units digital converters lines central processing unit 24. Amemory 26 is associated with theCPU 24. In a manner to be explained in detail below, the CPU processes the data and provides information on the stoichiometry of the combustion process. The resultant output on aline 28 is passed to anoutput unit 30. Theunit 30 can produce an output on aline 32 which automatically controls a valve arrangement shown diagrammatically at 34 which in turn can adjust the fuel/air ratio in the furnace, so as to produce the desired air/fuel ratio. This may be adjusted to the stoichiometric ratio, to maximise efficiency, or to a predetermined amount of excess air in order to reduce pollutants. - In addition, the
output unit 30 can produce an output on aline 36 for indicating the results of the flame monitoring process on a suitable display and/or for transmitting the information to a distant location. - In one advantageous form of the apparatus, which will now be described in more detail, sensor 6 is arranged to be responsive to radiation in a narrow wavelength band centred at 2.96µm, sensor 8 is arranged to be responsive to radiation in a narrow wavelength band centred at 3.35µm, and
sensor 10 is arranged to be responsive to radiation in a narrow wavelength band centred at 3 10nm. In such an arrangement, sensors 6 and 8 can be lead selenide sensors, andsensor 10 can be a silicon sensor. - The operation of the apparatus will now be considered in more detail.
- The emission spectrum of a hydrocarbon flame contains various emission peaks, examples of which are as follows:-
- (a) a peak associated with the hot hydrocarbon fuel in the flame, such as centred at 3.35 µm;
- (b) peaks associated with products of combustion in the flame - such as centred at 927 nm, 1.45 µm and 2.9 µm for H2O, and 4.5µm for CO2; and
- (c) peaks associated with transient species that only exist for a short time within the combustion region, such as a peak corresponding to OH centred at about 310 nm, a peak associated with CH centred at about 431nm, and a peak associated with C2 centred at about 517 nm.
-
- It has been found in accordance with the invention that the frequency spectrum of emissions due to the transient species is significantly different from the frequency spectrum of the emissions due to the fuel and the products of combustion, and that these differences vary with the stoichiometry of the combustion process.
- In Figure 2, the vertical axis is the ratio of the power in a particular frequency band between two of the digitised detection signals (
lines - Figure 2 clearly shows that curve A varies much more significantly with the air/fuel ratio than does curve B, particularly over the important region close to the stoichiometric air/fuel ratio. The curves thus show that the frequency spectrum of the emissions due to the transient species (OH in this case) is significantly different from the frequency spectrum of the fuel or product species emissions and that these differences vary with flame stoichiometry.
- Figure 3 corresponds to Figure 2 (the axes are the same although the vertical axis is not to a logarithmic scale in Figure 3), but shows curves at a range of different furnace loads or fuel inputs. The four curves shown in full line (curves A, B, C and D) all show the ratio of the power in a particular frequency band in the detection signal from sensor 10 (at 310nm corresponding to the OH transient species) to the power in a particular frequency band in the detection signal from sensor 8 (at 3.35 µm, corresponding to the hot fuel in the flame), curves A, B, C and D corresponding respectively to furnace loads or fuel inputs of 25%, 50%, 75% and 100% of the maximum.
- The dotted curves E, F, and G all show the ratio of the power in a particular frequency band in the detection signal from sensor 6 at 2.9 µm (the H2O product) to the power in a particular frequency band in the detection signal from sensor 8 at 3.35 µm (the hot fuel in the flame) . Curves E, F and G correspond respectively to the ratios at furnace loads or fuel inputs of 25%,75% and 100% of the maximum.
- In order to enable a comparison to be made between the different curves, the values corresponding to the 25%, 50% and 75% loads have been multiplied by arbitrary factors to make them equivalent to the ratio values at an air/fuel ratio of 3% excess oxygen above stoichiometric (indicated at X).
- Figure 3 clearly shows that curves A, B, C and D (plotting the ratio of the signal due to the OH transient species output to the signal due to the hot fuel in the flame) have a much better consistency and a more systematic change with the air/fuel ratio at different furnace loads than curves E, F and G.
- Accordingly, in one mode of operation, the apparatus of Figure 1 uses the digitised detection signals on
lines sensors 6,8 and 10 to measure the two ratios discussed above: (i) the ratio of the power in a particular frequency band in the detection signal corresponding to the OH transient species at 310nm to the detection signal corresponding to the emission from the hot fuel in the flame at 3.35 µm, and (ii) the ratio of the power in a particular frequency band in the detection signal corresponding to the H2O product at 2.9 µm to the power in a particular frequency band in the detection signal emission from the hot fuel in the flame at 3.35 µm. If the frequency passbands of thesignal conditioning units CPU 24 can determine these two ratios by measuring the mean amplitude in each detector signal and comparing them. Alternatively, if the frequency pass bands of the signal conditioning units are relatively wide, the CPU can perform a Fast Fourier Transform on the digitised data, to convert it into the frequency domain, and then integrate over the required frequency band and again take the ratios. The resultant ratio data is then compared with data stored in the memory 26 (thus, in effect, using data corresponding to that shown in Figures 2 and 3) to determine the combustion conditions. The resultant signal online 28 is then used by theoutput unit 30 to adjust the air/fuel ratio by means of thevalve 34 to produce a desired air/fuel ratio (normally, just above stoichiometric). - Figure 4 is generally similar to Figure 2 (except that the vertical scale is not logarithmic), but plots power ratios between outputs at different wavelengths. Thus curve A in Figure 4 shows the power ratio between the output at 310nm (the OH transient species) and the output at 927nm (corresponding to H2O), plotted against the air/fuel ratio. Curve B shows the power ratio between the output at 310nm (the OH transient species) and the output at 1.45µm (again corresponding to H2O), plotted against the air/fuel ratio. Curve C shows the power ratio between the output at 431nm (the CH transient species) and the output at 3.35nm (corresponding the hot fuel) plotted against the air/fuel ratio. Finally, curve D shows the power ratio between the output at 516nm (the C2 transient species) and the output at 3.35nm (the hot fuel), plotted against the air/fuel ratio. The curves were all measured in a gas-fired furnace at full load. In each case, there is again shown a significant variation of the power ratio with the air/fuel ratio. Thus, Figure 4 shows that the sensors 6,8 and 10 (or one or two of them) can be modified to be sensitive to different radiation wavelengths so as to enable the CPU to measure one of the power ratios shown in Figure 4 and - thereby measure the air/fuel ratio in the flame.
- Curves generally similar in shape to Curves A,B,C and D in Figure 4 will also be obtained if the non-transient species measured is H2O at 2.9µm or is CO2 at 4.5µm.
- Figures 5,6,7 and 8 show another mode of processing the data derived from the
sensors 6,8 and 10. In this mode, the detection signal data from the different detectors is correlated to derive the cross-correlation coefficient (vertical axis), and this is plotted against the air/fuel ratio relative to stoichiometric (horizontal axis). - Thus, curve A in Figure 5 shows how the cross-correlation coefficient between the detection signal at 310nm corresponding to the OH transient species (sensor 10), and the detection signal at 3.35 µm corresponding to the hot fuel in the flame (sensor 8) varies with the air/fuel ratio. Curve A shows that there is a significant variation which is substantially linear over the important region adjacent to the stoichiometric ratio.
- Curve A in Figure 8, in contrast, shows how the cross-correlation coefficient between the detection signal at 2.9 µm (sensor 6), corresponding to the H2O combustion product, and the detection signal at 3.35µm, corresponding to the hot fuel in the flame (sensor 8), varies with the air/fuel ratio. The variation is small, and substantially less than the variation shown by curve A in Figure 5.
- Therefore, in one form of the alternative mode of operation, the CPU 24 (Figure 1) performs the required correlation calculations (i) on the digital data received from the sensors 8 and 10 (corresponding to curve A in Figure 5) and (ii) on the digital data received from the sensors 6 and 8 (corresponding to curve A in Figure 5). The two correlation outputs can be compared with each other and also respectively compared with data stored in the
memory 26 to determine the air/fuel ratio. Again, by means of theoutput unit 30 and thevalve 34, the CPU can adjust the air/fuel ratio to bring it to the desired value. - Curve B in Figure 5shows how the cross-correlation coefficient between the detection signal at 310nm (the OH transient species, sensor 10) and the detection signal at 2.9µm (water, sensor 6) varies with the air/fuel ratio. Again, there is a significant variation (generally similar to though not as great as that of curve A in Figure 5). Therefore, the
CPU 24 can produce correlation calculations on the digital data received fromsensors 6 and 10 to supplement the correlation calculations specified above on the data received from the other two pairs of sensors. - In this second mode of operation, it is also not essential that the
sensors 6, 8 and 10 be responsive to radiation in the three wavelengths specified above with reference to Figure 1. Thus, sensor 6 could instead be arranged to be responsive to emission corresponding to a product of combustion at a different wavelength from 2.9 µm; for example, H2O at 927nm or at 1.45 µm, or CO2 at 4.5 µm. Sensor 8 could be arranged to be responsive to emission from a product of combustion, instead of to emission from the hot fuel in the flame. Obviously, though, if it were responsive to the emission corresponding to a product of combustion, this would be at a different wavelength from the wavelength to which sensor 6 is responsive.Sensor 10 could be arranged to be responsive to radiation from some other transient species such as those mentioned earlier: CH at about 431 nm and C2 at about 517nm, for example. - By way of example, curves C,D and E in Figure 5 show the correlation coefficient between the output at 310nm (in each case) on the one hand and the outputs at 1.45µm (H2O combustion product), 4.5µm (CO2 combustion product) and 927nm (H2O combustion product) respectively on the other hand. Again, these curves all show significant variation with air/fuel ratio, though somewhat less than for curve A in Figure 5.
- In Figure 6, the correlation coefficients between the outputs corresponding to the CH transient species at 431nm on the one hand and the outputs at five different non-transient species on the other hand are shown respectively in curves A,B,C,D and E. In curve A, the non-transient species is the hot fuel at 3.35µm, in curve B it is H2O at 2.9µm, in curve C it is H2O again but at 1.45µm, in curve D it is CO2 at 4.5 µm, and in curve E it is H2O again but at 927nm. Again, these curves all show significant variation with air/fuel ratio, though somewhat less than for curve A in Figure 5.
- In Figure 7, the correlation coefficients between the outputs corresponding to the C2 transient species at 516nm on the one hand and the outputs at five different non-transient species on the other hand are shown respectively in curves A,B,C,D and E. In curve A, the non-transient species is the hot fuel at 3.35µm, in curve B it is H2O at 2.9µm, in curve C it is H2O again but at 1.45µm, in curve D it is CO2 at 4.5 µm, and in curve E it is H2O again but at 927nm. Again, these curves all show significant variation with air/fuel ratio, though somewhat less than for curve A in Figure 5.
- Referring again to Figure 8, curves B to J show the correlation coefficients between the outputs corresponding to different pairs of non-transient species as follows:-
- (i) Curve B this shows the correlation coefficient between the output corresponding to H2O at 2.9µm and the output corresponding to CO2 at 4.5µm;
- (ii) Curve C: this shows the correlation coefficient between the output corresponding to the hot fuel at 3.35µm and the output corresponding to CO2 at 4.5µm;
- (iii) Curves D,E and F: these show the correlation coefficients between, in each case, the output corresponding to H2O at 1.45µm on the one hand and the outputs corresponding to CO2 at 4.5µm (curve D), hot fuel at 3.35µm (curve E), and H2O at 2.9µm (curve F) respectively on the other hand;
- (iv) Curves G,H,I and J: these show the correlation coefficients between, in each case, the output corresponding to H2O at 927nm on the one hand and the outputs corresponding to CO2 at 4.5µm (curve G), the hot fuel at 3.35µm (curve H), H2O at 2.9 µm (curve I), and H2O at 1.45µm (curve J) respectively on the other hand.
-
- Figure 8 shows that curves B to J are generally similar in shape to curve A in Figure 5: the variation of each correlation coefficient with the air/fuel ratio is small.
- Thus, a comparison of the curves shown in Figures 5,6 and 7 on the one hand with the curves shown in Figure 8 on the other shows how the apparatus of Figure 1 could be modified by making the
sensors 6,8 and 10 sensitive to radiation in the appropriate narrow wavelength bands. - The apparatus may be set up so as to operate simultaneously or sequentially in the two different modes (the first mode in which it takes the ratio of the outputs in a particular frequency band from each detector signal and the second mode in which it measures the correlation coefficients). The result will be to produce two or more estimates of the combustion conditions represented by the air/fuel ratio relative to stoichiometric. The CPU could then be arranged to make a weighted judgement between the estimates in order to control the
output unit 30 and thevalve unit 34. For example, a suitable artificial intelligence means could be used such as an expert system, by using fuzzy or conventional logical rules, or by means of an artificial neural network. - In all the embodiments disclosed, therefore, the emission of radiation in a narrow wavelength band corresponding to a transient species that exists only for a short time within the combustion region is compared with the emission in at least one narrow wavelength band corresponding to the hot hydrocarbon fuel in the flame or to a product of combustion to produce an output varying significantly with the air/fuel ratio. Advantageously, and as described, the emission of radiation in wavelength bands respectively corresponding to non-transient species such as different products of combustion or a product of combustion and the fuel, can be also compared to produce an output varying only slightly with the air/fuel ratio, in order to improve the discrimination process by contrasting the outputs respectively produced with and without the use of the emission due to the transient species. However, if desired the comparison involving the two non-transient species may be omitted.
- If desired, two of the sensors could be responsive to radiation in wavelength bands corresponding to different transient species, with the third responsive to radiation in a wavelength band corresponding to a non-transient species. The emission corresponding to each of the transient species could then be compared with the emission corresponding to the non-transient species. Clearly, more than three sensors could be used to provide further sensitivity of discrimination with at least one being responsive to radiation in a wavelength corresponding to a transient species.
Claims (13)
- Apparatus for monitoring a hydrocarbon flame, comprising first detecting means (10) responsive to electromagnetic radiation emitted by the flame in a first wavelength corresponding to a transient species existing for only a short time within the combustion region of the flame to produce a first detection signal, second detecting means (6 or 8) responsive to electromagnetic radiation emitted by the flame in a second wavelength corresponding to a non-transient species in the combustion region to produce a second detection signal, first comparing means (24) responsive to the first and second detection signals to produce a first comparison signal, and output means (30) for producing an output signal dependent on the air/fuel ratio in the flame, the apparatus being characterised by third detecting means (6 or 8) responsive to electromagnetic radiation emitted by the flame in a third wavelength which corresponds to a second non-transient species and is different from the wavelength corresponding to the first-mentioned non-transient species whereby to produce a third detection signal, and by second comparison means (24) responsive to the third detection signal and to one of the first and second detection signals to produce a second comparison signal, the output means (30) being operative to produce the output signal in dependence on the first and second comparison signals.
- Apparatus according to claim 1, characterised in that the transient species is OH and the first wavelength is about 310nm.
- Apparatus according to claim 1, characterised in that the transient species is CH and the first wavelength is about 431nm.
- Apparatus according to claim 1, characterised in that the transient species is C2 and the first wavelength is about 517nm.
- Apparatus according to any preceding claim, characterised in that the non-transient species is selected from (a) the hot hydrocarbon fuel in the flame with the second wavelength being about 3.35 µm, (b) H2O with the second wavelength being about 927nm, (c) H2O with the second wavelength being about 1.45 µm, (d) H2O with the second wavelength being about 2.9 nm, and (e) CO2 with the second wavelength being about 4.5 µm.
- Apparatus according to any preceding claim, characterised in that the second non-transient species is selected from (a) the hot hydrocarbon fuel in the flame with the third wavelength being about 3.35µm , (b) H2O with the third wavelength being about 927nm, (c) H2O with the third wavelength being about 1.45µm, (d) H2O with the third wavelength being about 2.9µm, and (e) CO2 with the third wavelength being about 4.5µm.
- Apparatus according to any preceding claim, characterised in that the or each comparison means (24) detects the power values corresponding to each of the two detection signals compared in predetermined frequency bands, and compares the power values.
- Apparatus according to claim 7, characterised in that the detecting means (6,8,10) include respective signal conditioning means (12,14,16) to produce the detection signals in the predetermined frequency bands, the signal conditioning means (12,14,16) comprising respective narrow band amplifiers, and the comparison means (24) comprising means responsive to the mean amplitude of each of the detection signals.
- Apparatus according to claim 7, characterised in that the or each comparison means (24) comprises means for obtaining the Fast Fourier Transform of the respective detection signals as they vary with time and for integrating the Fast Fourier Transform over the predetermined frequency bands.
- Apparatus according to any one of claims 1 to 6, characterised in that the or each comparison means (24) comprises correlating means for cross-correlating the two detection signals compared.
- Apparatus according to any preceding claim, characterised by means (34) responsive to the output signal for adjusting the air/fuel ratio of the flame.
- A method for monitoring a hydrocarbon flame, comprising the steps of detecting electromagnetic radiation emitted by the flame in a first wavelength corresponding to a transient species existing for only a short time within the combustion region of the flame to produce a first detection signal, detecting electromagnetic radiation emitted by the flame in a second wavelength corresponding to a non-transient species in the combustion region to produce a second detection signal, comparing the first and second detection signals to produce a first comparison signal, and producing an output signal dependent on the air/fuel ratio in the flame, the method being characterised by the steps of detecting electromagnetic radiation emitted by the flame in a third wavelength which corresponds to a second non-transient species and is different from the wavelength corresponding to the first-mentioned non-transient species whereby to produce a third detection signal, comparing the third detection signal with one of the first and second detection signals to produce a second comparison signal, and producing the output signal in dependence on the first and second comparison signals.
- A method according to claim 12, characterised by the step of responding to the output signal by adjusting the air/fuel ratio of the flame.
Applications Claiming Priority (2)
| Application Number | Priority Date | Filing Date | Title |
|---|---|---|---|
| GB9827719A GB2344883B (en) | 1998-12-16 | 1998-12-16 | Flame monitoring methods and apparatus |
| GB9827719 | 1998-12-16 |
Publications (3)
| Publication Number | Publication Date |
|---|---|
| EP1010943A2 EP1010943A2 (en) | 2000-06-21 |
| EP1010943A3 EP1010943A3 (en) | 2001-05-16 |
| EP1010943B1 true EP1010943B1 (en) | 2005-09-07 |
Family
ID=10844349
Family Applications (1)
| Application Number | Title | Priority Date | Filing Date |
|---|---|---|---|
| EP99308595A Expired - Lifetime EP1010943B1 (en) | 1998-12-16 | 1999-10-29 | Flame monitoring methods and apparatus |
Country Status (7)
| Country | Link |
|---|---|
| US (1) | US6247918B1 (en) |
| EP (1) | EP1010943B1 (en) |
| JP (1) | JP4540781B2 (en) |
| KR (1) | KR100696234B1 (en) |
| CN (1) | CN1257176A (en) |
| DE (1) | DE69927115T2 (en) |
| GB (1) | GB2344883B (en) |
Families Citing this family (22)
| Publication number | Priority date | Publication date | Assignee | Title |
|---|---|---|---|---|
| US6780378B2 (en) * | 2001-06-28 | 2004-08-24 | Gas Technology Institute | Method for measuring concentrations of gases and vapors using controlled flames |
| US6775645B2 (en) * | 2001-11-14 | 2004-08-10 | Electric Power Research Institute, Inc. | Application of symbol sequence analysis and temporal irreversibility to monitoring and controlling boiler flames |
| US7353140B2 (en) * | 2001-11-14 | 2008-04-01 | Electric Power Research Institute, Inc. | Methods for monitoring and controlling boiler flames |
| EP1327824A1 (en) * | 2001-12-24 | 2003-07-16 | ABB Schweiz AG | Detection and control of gas turbine combustion operation above lean blowout condition |
| EP1702179B1 (en) | 2003-12-11 | 2014-11-12 | ABB Inc. | Signal processing technique for improved flame scanner discrimination |
| US20050267709A1 (en) * | 2004-05-28 | 2005-12-01 | Fisher-Rosemount Systems, Inc. | System and method for detecting an abnormal situation associated with a heater |
| US7536274B2 (en) * | 2004-05-28 | 2009-05-19 | Fisher-Rosemount Systems, Inc. | System and method for detecting an abnormal situation associated with a heater |
| US7202794B2 (en) * | 2004-07-20 | 2007-04-10 | General Monitors, Inc. | Flame detection system |
| ATE458185T1 (en) * | 2006-11-29 | 2010-03-15 | Abb Research Ltd | DEVICE AND METHOD FOR PROCESSING AND/OR ANALYZING IMAGE INFORMATION REPRESENTING RADIATION |
| US7878795B2 (en) * | 2007-05-22 | 2011-02-01 | R.W. Beckett Corporation | Burner ignition controller |
| US8070482B2 (en) * | 2007-06-14 | 2011-12-06 | Universidad de Concepción | Combustion control system of detection and analysis of gas or fuel oil flames using optical devices |
| EP2239505A1 (en) * | 2009-04-08 | 2010-10-13 | Siemens Aktiengesellschaft | Method for analysing the tendency to hum of a combustion chamber and method for controlling a gas turbine |
| CN102749141A (en) * | 2012-07-30 | 2012-10-24 | 中国科学院自动化研究所 | Radiation temperature measuring method and apparatus for measuring true target temperature |
| GB2514341B (en) * | 2013-05-20 | 2016-08-24 | Edwards Ltd | Radiant burner combustion monitoring |
| ITPD20130186A1 (en) * | 2013-07-02 | 2015-01-03 | Sit La Precisa S P A Con Socio Uni Co | METHOD OF MONITORING THE OPERATION OF A BURNER |
| CN104566516B (en) * | 2013-10-16 | 2017-06-06 | 光宝电子(广州)有限公司 | Gas stove with flame detection function |
| CN103629692B (en) * | 2013-11-26 | 2016-03-16 | 浙江工商大学 | The decentralized control method of boiler-burner |
| CN104315535B (en) * | 2014-10-31 | 2015-06-03 | 山东泰景电力科技有限公司 | Detection device and method for flame burning state |
| JP6508772B2 (en) * | 2015-05-26 | 2019-05-08 | アズビル株式会社 | Flame detection system |
| CN105354974A (en) * | 2015-11-30 | 2016-02-24 | 无锡拓能自动化科技有限公司 | Flame detection method based on three-wavelength infrared flame detector |
| CN105513261A (en) * | 2015-11-30 | 2016-04-20 | 无锡拓能自动化科技有限公司 | Three-wavelength infrared flame detector |
| CN112629694B (en) * | 2020-11-26 | 2023-01-13 | 中国大唐集团科学技术研究院有限公司火力发电技术研究院 | Temperature detection method for hearth of coal-fired power plant |
Family Cites Families (29)
| Publication number | Priority date | Publication date | Assignee | Title |
|---|---|---|---|---|
| JPS5882039A (en) * | 1981-11-11 | 1983-05-17 | Hitachi Ltd | Air-fuel ratio control device for internal combustion engines |
| JPS5924119A (en) * | 1982-07-30 | 1984-02-07 | Hitachi Ltd | Method for measuring the amount of unburned matter in ash generated from a pulverized coal combustion furnace and the concentration of NOx in exhaust gas |
| JPS60162121A (en) * | 1984-02-01 | 1985-08-23 | Hitachi Ltd | flame monitoring device |
| US4709155A (en) * | 1984-11-22 | 1987-11-24 | Babcock-Hitachi Kabushiki Kaisha | Flame detector for use with a burner |
| JPH0227571B2 (en) * | 1984-12-06 | 1990-06-18 | Tokyo Denryoku Kk | NENSHOJOTAISHINDANHOHO |
| US4913647A (en) * | 1986-03-19 | 1990-04-03 | Honeywell Inc. | Air fuel ratio control |
| JPS62261819A (en) * | 1986-05-08 | 1987-11-14 | Ngk Spark Plug Co Ltd | Air-fuel ratio detector |
| JPS62276326A (en) * | 1986-05-26 | 1987-12-01 | Ishikawajima Harima Heavy Ind Co Ltd | Diagnosis of combustion |
| GB2204428A (en) * | 1987-05-06 | 1988-11-09 | British Gas Plc | Control of burner air/fuel ratio |
| JPH01305342A (en) * | 1988-06-02 | 1989-12-08 | Fuji Heavy Ind Ltd | Measuring device for air fuel ratio of engine |
| US5270797A (en) * | 1989-07-20 | 1993-12-14 | Brooklyn College Foundation | Method and apparatus for determining a material's characteristics by photoreflectance using improved computer control |
| JP2966862B2 (en) * | 1989-11-15 | 1999-10-25 | 株式会社日立製作所 | Combustion light sensor |
| US5077550A (en) * | 1990-09-19 | 1991-12-31 | Allen-Bradley Company, Inc. | Burner flame sensing system and method |
| US5186146A (en) * | 1990-12-20 | 1993-02-16 | Hitachi, Ltd. | Combustion evaluation apparatus and combustion controller |
| US5332386A (en) * | 1992-07-01 | 1994-07-26 | Toyota Jidosha Kabushiki Kaisha | Combustion control method |
| US5249954A (en) * | 1992-07-07 | 1993-10-05 | Electric Power Research Institute, Inc. | Integrated imaging sensor/neural network controller for combustion systems |
| JPH06273322A (en) * | 1993-03-17 | 1994-09-30 | Hitachi Ltd | Camera, spectroscopic system, and combustion evaluation device using these |
| JP3464697B2 (en) * | 1993-12-21 | 2003-11-10 | 興和株式会社 | Oxygen saturation meter |
| US5599179A (en) * | 1994-08-01 | 1997-02-04 | Mississippi State University | Real-time combustion controller |
| US5495112A (en) * | 1994-12-19 | 1996-02-27 | Elsag International N.V. | Flame detector self diagnostic system employing a modulated optical signal in composite with a flame detection signal |
| JP3423124B2 (en) * | 1995-09-19 | 2003-07-07 | 株式会社タクマ | Combustion monitoring sensor and air ratio control method for combustion device using the same |
| JPH0998972A (en) * | 1995-10-06 | 1997-04-15 | Hitachi Ltd | Biological optical measurement device and image creation method |
| US5798946A (en) * | 1995-12-27 | 1998-08-25 | Forney Corporation | Signal processing system for combustion diagnostics |
| DE19615141A1 (en) * | 1996-04-17 | 1997-10-23 | Bfi Automation Gmbh | Method and device for controlling a combustion process in a boiler |
| US6045353A (en) * | 1996-05-29 | 2000-04-04 | American Air Liquide, Inc. | Method and apparatus for optical flame control of combustion burners |
| US6071114A (en) * | 1996-06-19 | 2000-06-06 | Meggitt Avionics, Inc. | Method and apparatus for characterizing a combustion flame |
| US5993194A (en) * | 1996-06-21 | 1999-11-30 | Lemelson; Jerome H. | Automatically optimized combustion control |
| US5785512A (en) * | 1996-12-17 | 1998-07-28 | Fireye, Inc. | Infrared emittance combustion analyzer |
| US5961314A (en) * | 1997-05-06 | 1999-10-05 | Rosemount Aerospace Inc. | Apparatus for detecting flame conditions in combustion systems |
-
1998
- 1998-12-16 GB GB9827719A patent/GB2344883B/en not_active Expired - Fee Related
-
1999
- 1999-10-28 KR KR1019990047259A patent/KR100696234B1/en not_active Expired - Fee Related
- 1999-10-29 DE DE69927115T patent/DE69927115T2/en not_active Expired - Lifetime
- 1999-10-29 EP EP99308595A patent/EP1010943B1/en not_active Expired - Lifetime
- 1999-11-12 US US09/438,781 patent/US6247918B1/en not_active Expired - Lifetime
- 1999-12-15 JP JP35601599A patent/JP4540781B2/en not_active Expired - Fee Related
- 1999-12-16 CN CN99126435A patent/CN1257176A/en active Pending
Also Published As
| Publication number | Publication date |
|---|---|
| JP4540781B2 (en) | 2010-09-08 |
| EP1010943A3 (en) | 2001-05-16 |
| GB2344883A (en) | 2000-06-21 |
| GB2344883B (en) | 2003-10-29 |
| KR20000047566A (en) | 2000-07-25 |
| DE69927115D1 (en) | 2005-10-13 |
| JP2000180363A (en) | 2000-06-30 |
| DE69927115T2 (en) | 2006-06-14 |
| GB2344883A8 (en) | 2000-10-10 |
| GB9827719D0 (en) | 1999-02-10 |
| KR100696234B1 (en) | 2007-03-19 |
| EP1010943A2 (en) | 2000-06-21 |
| HK1029619A1 (en) | 2001-04-06 |
| CN1257176A (en) | 2000-06-21 |
| US6247918B1 (en) | 2001-06-19 |
Similar Documents
| Publication | Publication Date | Title |
|---|---|---|
| EP1010943A2 (en) | Flame monitoring methods and apparatus | |
| US4435149A (en) | Method and apparatus for monitoring the burning efficiency of a furnace | |
| US4179606A (en) | Flame sensor | |
| US4934926A (en) | Method and apparatus for monitoring and controlling burner operating air equivalence ratio | |
| US12241790B2 (en) | Visual monitoring method for cross-section temperature fields and radiation characteristics of boiler furnaces by combining radiation images and spectra | |
| EP0588753B1 (en) | Method for detecting a fire condition | |
| US5052214A (en) | Knock detector using optical fiber thermometer | |
| CN105758434A (en) | Sensing demodulation method based on linear array InGaAs scanning FBG reflection spectrum | |
| CN115541803B (en) | Multispectral analysis of the online detection method of combustion flame stability of coal-fired power plant boilers | |
| US5594421A (en) | Method and detector for detecting a flame | |
| CN120741407A (en) | Mining laser methane telemetry system and method based on multispectral fusion | |
| CN116519144B (en) | A spectral-based method for identifying combustion states in coal-fired power plant furnaces | |
| JP3242232B2 (en) | Flame detection and combustion diagnostic device | |
| US6914246B2 (en) | Method and apparatus for spatially resolving flame temperatures using ultraviolet light emission | |
| CN117990627A (en) | A method for detecting two-dimensional distribution of gas phase sodium mass concentration in flame | |
| CN107796421B (en) | The method for quickly determining FBG reflectance spectrum abnormal patterns | |
| US5285676A (en) | Air-fuel ratio measurement apparatus and method therefor | |
| CN117968854A (en) | A non-contact intelligent temperature measurement system and method based on dual infrared | |
| JPS61138022A (en) | Diagnosis method for combustion condition | |
| JP2678450B2 (en) | Temperature measuring device | |
| EP0926647A2 (en) | Method for detecting a fire condition | |
| JPS6138430A (en) | Fire sensor | |
| JPH0684912B2 (en) | thermometer | |
| KR930010542A (en) | Surface condition measuring device | |
| JPS63315829A (en) | Burner combustion monitoring control method |
Legal Events
| Date | Code | Title | Description |
|---|---|---|---|
| PUAI | Public reference made under article 153(3) epc to a published international application that has entered the european phase |
Free format text: ORIGINAL CODE: 0009012 |
|
| AK | Designated contracting states |
Kind code of ref document: A2 Designated state(s): DE FR IT |
|
| AX | Request for extension of the european patent |
Free format text: AL;LT;LV;MK;RO;SI |
|
| PUAL | Search report despatched |
Free format text: ORIGINAL CODE: 0009013 |
|
| AK | Designated contracting states |
Kind code of ref document: A3 Designated state(s): AT BE CH CY DE DK ES FI FR GB GR IE IT LI LU MC NL PT SE |
|
| AX | Request for extension of the european patent |
Free format text: AL;LT;LV;MK;RO;SI |
|
| 17P | Request for examination filed |
Effective date: 20011113 |
|
| AKX | Designation fees paid |
Free format text: DE FR IT |
|
| 17Q | First examination report despatched |
Effective date: 20031128 |
|
| GRAP | Despatch of communication of intention to grant a patent |
Free format text: ORIGINAL CODE: EPIDOSNIGR1 |
|
| GRAS | Grant fee paid |
Free format text: ORIGINAL CODE: EPIDOSNIGR3 |
|
| GRAA | (expected) grant |
Free format text: ORIGINAL CODE: 0009210 |
|
| AK | Designated contracting states |
Kind code of ref document: B1 Designated state(s): DE FR IT |
|
| REF | Corresponds to: |
Ref document number: 69927115 Country of ref document: DE Date of ref document: 20051013 Kind code of ref document: P |
|
| PG25 | Lapsed in a contracting state [announced via postgrant information from national office to epo] |
Ref country code: IT Free format text: LAPSE BECAUSE OF NON-PAYMENT OF DUE FEES Effective date: 20051029 |
|
| ET | Fr: translation filed | ||
| PLBE | No opposition filed within time limit |
Free format text: ORIGINAL CODE: 0009261 |
|
| STAA | Information on the status of an ep patent application or granted ep patent |
Free format text: STATUS: NO OPPOSITION FILED WITHIN TIME LIMIT |
|
| 26N | No opposition filed |
Effective date: 20060608 |
|
| PGFP | Annual fee paid to national office [announced via postgrant information from national office to epo] |
Ref country code: FR Payment date: 20081014 Year of fee payment: 10 |
|
| PGRI | Patent reinstated in contracting state [announced from national office to epo] |
Ref country code: IT Effective date: 20091201 |
|
| REG | Reference to a national code |
Ref country code: FR Ref legal event code: ST Effective date: 20110218 |
|
| PG25 | Lapsed in a contracting state [announced via postgrant information from national office to epo] |
Ref country code: FR Free format text: LAPSE BECAUSE OF NON-PAYMENT OF DUE FEES Effective date: 20051107 |
|
| PGFP | Annual fee paid to national office [announced via postgrant information from national office to epo] |
Ref country code: DE Payment date: 20131023 Year of fee payment: 15 |
|
| PGFP | Annual fee paid to national office [announced via postgrant information from national office to epo] |
Ref country code: IT Payment date: 20131023 Year of fee payment: 15 |
|
| REG | Reference to a national code |
Ref country code: DE Ref legal event code: R119 Ref document number: 69927115 Country of ref document: DE |
|
| PG25 | Lapsed in a contracting state [announced via postgrant information from national office to epo] |
Ref country code: DE Free format text: LAPSE BECAUSE OF NON-PAYMENT OF DUE FEES Effective date: 20150501 |
|
| PG25 | Lapsed in a contracting state [announced via postgrant information from national office to epo] |
Ref country code: IT Free format text: LAPSE BECAUSE OF NON-PAYMENT OF DUE FEES Effective date: 20141029 |
|
| PG25 | Lapsed in a contracting state [announced via postgrant information from national office to epo] |
Ref country code: FR Free format text: LAPSE BECAUSE OF NON-PAYMENT OF DUE FEES Effective date: 20051031 |