EP0959433A2 - Super resolution apparatus and methods for electro-optical systems - Google Patents
Super resolution apparatus and methods for electro-optical systems Download PDFInfo
- Publication number
- EP0959433A2 EP0959433A2 EP99109872A EP99109872A EP0959433A2 EP 0959433 A2 EP0959433 A2 EP 0959433A2 EP 99109872 A EP99109872 A EP 99109872A EP 99109872 A EP99109872 A EP 99109872A EP 0959433 A2 EP0959433 A2 EP 0959433A2
- Authority
- EP
- European Patent Office
- Prior art keywords
- data
- reconstructed
- background
- scene
- matrix
- Prior art date
- Legal status (The legal status is an assumption and is not a legal conclusion. Google has not performed a legal analysis and makes no representation as to the accuracy of the status listed.)
- Granted
Links
- 238000000034 method Methods 0.000 title claims abstract description 99
- 230000003287 optical effect Effects 0.000 claims abstract description 104
- 238000003384 imaging method Methods 0.000 claims abstract description 36
- 238000001914 filtration Methods 0.000 claims abstract description 14
- 230000006872 improvement Effects 0.000 claims abstract description 6
- 239000011159 matrix material Substances 0.000 claims description 72
- 238000000354 decomposition reaction Methods 0.000 claims description 6
- 238000012935 Averaging Methods 0.000 claims description 3
- 230000002301 combined effect Effects 0.000 claims description 3
- 238000010586 diagram Methods 0.000 description 16
- 238000012545 processing Methods 0.000 description 15
- 238000003491 array Methods 0.000 description 11
- 230000000694 effects Effects 0.000 description 8
- 238000013459 approach Methods 0.000 description 5
- 230000000875 corresponding effect Effects 0.000 description 4
- 230000008569 process Effects 0.000 description 4
- 239000000523 sample Substances 0.000 description 3
- 238000001228 spectrum Methods 0.000 description 3
- 239000000654 additive Substances 0.000 description 2
- 230000000996 additive effect Effects 0.000 description 2
- 238000004458 analytical method Methods 0.000 description 2
- 230000002596 correlated effect Effects 0.000 description 2
- 238000013461 design Methods 0.000 description 2
- 238000013507 mapping Methods 0.000 description 2
- 238000012634 optical imaging Methods 0.000 description 2
- 238000005070 sampling Methods 0.000 description 2
- 238000012546 transfer Methods 0.000 description 2
- 230000004075 alteration Effects 0.000 description 1
- 238000013528 artificial neural network Methods 0.000 description 1
- 238000000576 coating method Methods 0.000 description 1
- 230000001276 controlling effect Effects 0.000 description 1
- 238000000151 deposition Methods 0.000 description 1
- 238000005286 illumination Methods 0.000 description 1
- 238000010191 image analysis Methods 0.000 description 1
- 230000010354 integration Effects 0.000 description 1
- 239000013307 optical fiber Substances 0.000 description 1
- 238000005457 optimization Methods 0.000 description 1
- 230000009467 reduction Effects 0.000 description 1
- 239000000758 substrate Substances 0.000 description 1
- 238000011410 subtraction method Methods 0.000 description 1
Images


Classifications
-
- G—PHYSICS
- G06—COMPUTING; CALCULATING OR COUNTING
- G06T—IMAGE DATA PROCESSING OR GENERATION, IN GENERAL
- G06T3/00—Geometric image transformation in the plane of the image
- G06T3/40—Scaling the whole image or part thereof
- G06T3/4053—Super resolution, i.e. output image resolution higher than sensor resolution
-
- G—PHYSICS
- G06—COMPUTING; CALCULATING OR COUNTING
- G06T—IMAGE DATA PROCESSING OR GENERATION, IN GENERAL
- G06T5/00—Image enhancement or restoration
- G06T5/20—Image enhancement or restoration by the use of local operators
-
- G06T5/70—
-
- G06T5/73—
Definitions
- the present invention relates generally to optical devices, and more particularly to an optical sensor utilizing background reconstruction image processing techniques in order to provide a much higher level of resolution of a localized object within a 5 background scene.
- Optical sensors are devices which for decades have been used to detect and record optical images.
- Various types of optical sensors have been developed which work in the Ultra Violet Bands, Infra Red Bands as well as in the Visible Bands of operation. Examples of such devices include Weather Sensors, Terrain Mapping Sensors, Surveillance Sensors, Medical Probes, Telescopes and Television Cameras.
- An optical sensor typically includes an optical system and one or more detectors.
- the optical system portion is made up of various combinations of lenses, mirrors and filters used to focus light onto a focal plane located at the image plane of the optical system.
- the detectors which make at the image plane are used to convert the light received from the optical system into electrical signals.
- Some types of optical sensors use film rather than detectors to record the images. In this case, the grain size of the film is analogous to the detectors described above.
- spatial resolution is the size or the smallest object that can be resolved in the image or, equivalently, the ability to differentiate between closely spaced objects. If the optical system is free from optical aberrations (which means being “well corrected”) the spatial resolution is ultimately limited by either diffraction effects or the size of the detector.
- Diffraction is a well known characteristic of light which describes how light passes through an aperture of an optical system. Diffraction causes the light passing through an aperture to spread out so that the point light sources of a scene end up as a pattern of light (known as a diffraction pattern) diffused across the image.
- a diffraction pattern For a well corrected, unobscured optical system known as a diffraction limited system, the diffraction pattern includes a very bright central spot, surrounded by somewhat fainter bright and dark rings which gradually fade away as the distance from the central spot increases.
- An optical sensor that is designed to be diffraction limited usually has a very well corrected optical system and detectors sized so that the central spot of the diffraction pattern just fits within the active area of the detector. With conventional sensors, making the detectors smaller does not improve resolution and considerably increases the cost due to the expense of the extra detectors and the associated electronics.
- the size of the aperture used in the optical system determines the amount of resolution lost to diffraction effects.
- the aperture size is normally expressed as an f-number which is the ratio of the effective focal length to the size of the clear aperture.
- the aperture size is normally expressed as a Numerical aperture (NA) which is the index of refraction times the sine of the half angle of the cone of illumination. For a given focal length, a high f-number corresponds to a smaller aperture, while a higher Numerical aperture corresponds to a larger aperture.
- NA Numerical aperture
- a basic limitation of conventional optical sensors is the aperture size required for a given level of resolution. Higher resolution images require larger apertures. In many situations the use of such a system is very costly. This is because using a larger aperture requires a significantly larger optical system.
- the cost for larger systems which have apertures with diameters greater than one foot is typically proportional to the diameter of the aperture raised to a power of "x".
- the variable "x" usually ranges from 2.1 to 2.9 depending on a number of other particulars associated with the sensor such as its wave band, field of regard, and field of view.
- the size of the optical sensor is particularly relevant for systems that fly on some type of platform, either in space or in the air. Under such conditions the sensor must be light weight, strong, and capable of surviving the rigors of the flight environment. Thus the cost of going to a larger optical system can be in the hundreds of millions of dollars for some of the larger and more sophisticated sensors. Practical considerations, such as the amount of weight the host rocket, plane, balloon, or other vehicle can accommodate, or the amount of space available, may also limit the size of the sensor. These practical considerations can prevent a larger system from being implemented no matter how large the budget.
- sub-pixel resolution In sub-pixel resolution the optical system is limited in spatial resolution not by diffraction but by the size of the detectors or pixels. In this case, the diffraction pattern of the aperture is much smaller than the detectors, so the detectors do not record all the resolution inherent in the optical system's image.
- Sub-pixel resolution attempts to reconstruct an image that includes the higher resolution not recorded by the detectors. This technique does not require hardware or system operation changes in order to work. Examples of sub-pixel resolution techniques are disclosed in an article in ADVANCED SIGNAL PROCESSING ALGORITHMS, ARCHITECTURES AND IMPLEMENTATIONS II, by J.B. Abbiss et al., The International Society For Optical Engineering, Volume 1566, P. 363 (1991).
- optical imaging techniques are disclosed in an article entitled SUPER RESOLUTION ALGORITHMS FOR A MODIFIED HOPFIELD NEURAL NETWORK, by J.B. Abbiss et al., IEEE Transactions On Signal Processing, Vol. 39, No. 7, July 1991 and in a paper entitled FAST REGULARIZED DECONVOLUTION IN OPTICS AND RADARS, by J.B. Abbiss et al., presented at the 3rd IMA Conference on Mathematics in Signal Processing. These techniques use linear algebra and matrix techniques to restore signals or images from a limited discrete data set.
- an object of the present invention to provide an apparatus and method for increasing the resolution of an optical sensor without using a substantially larger aperture.
- the invention provides an apparatus and method for improving the spatial resolution of an object using a background reconstruction approach wherein a localized object containing high spatial frequencies is assumed to exist inside a background scene containing primarily low and/or very high spatial frequencies compared to the spatial frequencies of the localized object.
- the imaging system cannot pass these high spatial frequencies (neither the high frequencies of the object, nor the very high frequencies of the background) .
- the background image's low spatial frequencies are used to reconstruct the background scene in which the localized object is situated. Using this reconstructed background and the space limited nature of the localized object (i.e. it is only present in part of the scene, not the entire scene), the high spatial frequencies that did not pass through an optical system are restored, reconstructing a detailed image of the localized object.
- An improvement comprises filtering the noisy blurred background data of the same scene to obtain noise suppressed data; applying estimations of point spread functions associated with the noise suppressed data and optical system to estimates of the noise suppressed data to obtain a reconstructed background image (I r (X)); and low pass filtering the noisy blurred scene data containing the object to be reconstructed (D1, and using the reconstructed background image (I r (x)) to eliminate the background data from the image data to obtain a reconstructed image of an object with increased spatial resolution.
- the present invention is directed to an apparatus and method of superresolution of an image for achieving resolutions beyond the diffraction limit. This is accomplished by background reconstruction, wherein a localized object containing high spatial frequencies is assumed to exist inside a background scene containing primarily low and/or very high spatial frequencies compared to the spatial frequencies of the localized object.
- the point spread function (PSF) of an optical system causes the background data to blend with and flow over objects of interest, thereby contaminating the boundaries of these objects and making it exceedingly difficult to distinguish these objects from the background data.
- PSF point spread function
- the object may be disentangled from the background such that there will exist uncontaminated boundaries between the object and the background scene.
- Another way of describing the effect of a PSF is to note that the spatial frequencies associated with the object of interest which lie beyond the optical system cutoff frequency are lost.
- a localized object such as a tractor having high spatial frequencies is super-resolved inside a background scene containing primarily low and/or ultra-high spatial frequencies such as a cornfield.
- the imaging system cannot pass either the high spatial frequencies of the object or the ultra-high spatial frequencies of the background.
- This invention uses the background images' low spatial frequencies to reconstruct the background scene in which the localized object is situated.
- This reconstructed background and the space limited nature of the localized object can be used to restore the high spatial frequencies that did not pass through the optical system, thereby reconstructing a detailed image of the localized object.
- the sensor (10) as in conventional devices includes an optical system (12) and detectors (14).
- the optical system (12) which includes various combinations of lenses, mirrors and filters depending on the type of application is used to focus light onto a focal plane where the detectors (14) are located.
- the optical system (12) also includes a predetermined aperture size corresponding to a particular Numeral aperture (NA) which, in conventional diffraction-limited devices, limits the amount of spatial resolution that is attainable. This is, as previously described, due to diffraction blurring effects.
- NA Numeral aperture
- optical system (12) can be described by an optical transfer function (OTF) which represents the complete image forming system, and which can be used to characterize that system.
- OTF optical transfer function
- the detectors (14) convert the light received from the optical system (12) into the electrical signals which become the data used to generate images.
- the detectors are configured in a linear array for Scanning systems or in a matrix array for Staring systems.
- Scanning systems the detector linear array is swept in a direction perpendicular to the length of the array generating data one scan line at a time with each line corresponding to one line of the image.
- Staring systems the matrix array is not moved and generates all of the imaging data simultaneously.
- each detector of the matrix array corresponds to one pixel of the image. It is intended that the detectors (14) of the present invention will be configured as a linear array or a matrix array depending on the type of system being used.
- the detectors (14) take many different forms depending on the wavelength of light used by the present invention. For example, in the ultraviolet and X-Ray ranges such detectors as semitransparent photocathodes and opaque photocathodes can be used. In the visible range such detectors as vacuum phototubes, photomultipliers, photoconductors, and photodiodes can be used. In the infrared range, such detectors as photoconductors, photodiodes, pyroelectric, photon drag and golay cell devices can be used.
- the present invention various elements of the sensor (10) must be optimized to be used with a particular image-processing technique.
- the type of optimization depends on the image-processing technique.
- the present invention includes two alternative image-processing techniques. Each of these two super-resolution methods may be used with the sensor configurations as described below.
- the senor (10) must include detectors (14) that have an "instantaneous field of view" that is equal to or less than the desired level of spatial resolution. If, for example, the required resolution is one meter or less then the "instantaneous field of view" of the detectors must be one meter or less (even though the central lobe of the diffraction pattern is much larger). This makes the pixel size of the image produced by the sensor (10) smaller than the central diffraction lobe. (Note that, such a configuration adds additional cost to the sensors. However, for large systems the increase in cost is less than the cost of a larger aperture.)
- the sensor (10) can obey this rule in one of two ways.
- One way is to use more smaller-size detectors (14).
- the number of detectors used varies anywhere from one to millions depending on the application.
- At least five times more detectors (14) than normal are required to achieve the desired resolution.
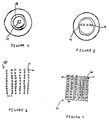
- a diagram of a linear detector array to be used with the present invention is shown in FIGURE 2, while a diagram of a matrix detector array to be used with the present invention is shown in FIGURE 3.
- the number of detectors (14) included in these arrays (28), (30) depends on the application. However, as previously pointed out to achieve the higher resolution these arrays (28), (38) will include at least five times more detectors (14) than conventional sensors for a given application.
- the size of the individual detector is never smaller than the size of the central diffraction on lobe . This is because utilizing smaller sensors serves no purpose since the resolution is limited by the optical aperture.
- the size of the individual detectors (14) must be smaller than the size of the central diffraction lobe (18), as shown in FIGURE 4.
- Another way of configuring the sensor (10) according to Case one is again to use a larger number of detectors (14), but instead of using smaller detectors configure the optical system (12) so that more than one detector is spread across the central diffraction lobe.
- This allows conventional size detectors (14) to be used.
- the number of detectors (14) used again must be five times or more than required in conventional sensors.
- the back focal length In order to configure the optical system (12) as described above the back focal length must be adjusted so that five or more detectors (14) spread across the central diffraction lobe (18), as shown in FIGURE 5.
- the solution is to use detectors (14) configured in a multi-linear array as shown in FIGURE 6.
- the multi-linear array (20) includes a number of individual linear arrays (22) shifted parallel to each other by a distance (d) which is a fraction of a pixel.
- d distance which is a fraction of a pixel.
- each linear array (22) generates imaging data corresponding to one scan line of each of the images.
- each linear array (22) creates one of the images being produced.
- the array (20) includes ten or more individual linear arrays 22 which are capable of producing ten or more different images.
- the sensor (10) is configured to take images of objects in multiple color bands. In Scanning systems, this is accomplished by utilizing a multi-linear array, as shown in FIGURE 7.
- the multi-linear array (24) also includes a number of individual linear arrays (22) arranged in a parallel configuration shifted parallel to each other by a distance (d) which is a fraction of a pixel.
- a color filter (26) is disposed over each of the linear arrays (22).
- the color filters (26) are configured to pass only a particular portion of the color spectrum which may include multiple wavelengths of visible light.
- each linear array (22) produces images of the same object in different color bands.
- the filters (26) are fabricated by depositing optical coatings on transparent substrates, which are then placed over each of the linear arrays (22). This process is well known.
- the multiple color-band data is created by incorporating a beam splitter in the optical system (12) and using multiple detector arrays.
- the beam splitter (28) splits the incoming light (32) into multiple beams (34);
- Figure 8 shows the basic idea using a two-beam system. Due to the operation of the beam splitter (28) each light beam (34) includes a different part of the color spectrum which may include one or more different bands of visible or infrared light. Each light beam is directed to one of the detector arrays (30) producing images of the same object in different color bands.
- the senor (10) is a combination of the three previously described cases. This is accomplished by combining the principles discussed above with regard to Cases one, two or three. In all three cases the sensor must be desired to have a signal to noise ratio which is high as possible. This is done either by increasing the integration time of the detectors (14) or by slowing down the scan speed as much as possible for scanning systems.
- the system's design, or its operation mode, or both are changed in order to take the required multiple images in a known pattern displaced by a known distance that is not a multiple of a pixel, but rather is a multiple of a pixel plus a known fraction of a pixel.
- a processor (16) which processes the image data to achieve the higher resolution. This done by recovering "lost” information from the image data. Even though the diffraction blur destroys the required spatial resolution, some of the "lost” spatial information still exists spread across the focal plane.
- the small-size detectors described above are used to sample at a 5 to 10 times higher rate than is customary in these sorts of optical systems in conjunction with processing enabling much of this "lost” information to be recovered and thus restoring the image to a higher level of resolution than classical diffraction theory would allow.
- the processor (16) uses one of two image processing techniques: a Non-linear Reconstruction method using a modified Richardson-Lucy Enhancement technique, and a background reconstruction approach using a linear algebra technique.
- the processor (16) in addition to using one of the above described primary data processing techniques, also uses other techniques to process further the imaging data. This further processing is accomplished by standard image enhancement techniques which can be used to improve the reconstructed image. Such techniques include, but are not limited to, edge sharpening, contrast stretching or other contrast enhancement techniques.
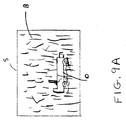
- FIG. 9A there is shown a scene (S) comprising a localized object (O) such as a tractor within a noisy blurred background (B).
- input data D2 (Block 20), representing the noisy blurred background data, is input into module 30 to remove the noise from D2 using a modified version of the method of sieves.
- the input data D1 and D2 indicated in block 20 has been sampled at the Nyquist rate (5 times the customary image sampling rate) and preferably at twice the Nyquist rate (ten times the customary sampling rate) to obtain robust input data.
- the modified method of sieves removes noise by averaging adjacent pixels of the noisy blurred background data D2 of the same scene together, using two and three pixel wide point spread functions.
- Array h 0 in equation (9a) of module 30 represents the optical system PSF, which is the Fourier transform of the OTF input.
- the output of module 30 thus provides separate pictures - the optical system image I(x) and the modified background data images D3(x) and D4(x).
- new point spread functions h 3T and h 4T have been constructed to account for the combined effect of the method of sieves and the optical system. These new point spread functions use both the two and three pixel wide point spread functions, h 3 and h 4 , previously identified, as well as the optical system PSF h 0 , as shown in equation 9(d) and (e), to arrive at the new PSF's.
- the Richardson-Lucy method is then used to reconstruct the background scene data, D2, with the reconstructed data defined to be I r (x).
- Figure 10 shows an exploded view of the processing steps for reconstructing the background scene to obtain the reconstructed background I r (x).
- the noise suppressed data D2 from block 20 of Figure 9B is used as the first estimate of the true background scene, I n (x) (Module 100).
- this estimate of the true background scene is then blurred using the combined method of sieves and optical system point spread functions to obtain two picture representations 13(x) and 14(x), where 13(x) is given by equation 10 (a) and 14 (x) is given by equation 10 (b).
- Two new arrays, as shown in module 120 are then created by dividing pixel by pixel the noisy scene data, D3(x) and D4(x), by the blurred estimate of the true background scene, I3(x) and I4(x), as shown in equations 10(c) and (d) respectively.
- the processor determines whether a predetermined number of iterations have been performed, as shown in block 140. If the predetermined number has not been performed, the current estimate of the true background is replaced by the new estimate of the true background (Z(x)) (Block 150) and the processing sequence or modules 110 - 140 are repeated. If, however, the predetermined number has been reached, then the latest estimate of the true background scene is taken to be the reconstructed background scenes; that is, I r (x) is taken to equal Z(x) as shown in block 160. Note that for the optical systems described above the predetermined number of iterations is preferably between one thousand and two thousand.
- the background subtraction method for super-resolving the object of interest in D1 is detailed in Figure 11.
- Figure 11 the noisy blurred scene data D1 containing the object to be reconstructed is used as input, with a low-pass filter (block 600) applied to remove high spatial frequency noise from the D1 data as shown by equation 11(a).
- the transfer function h b (x) represents the Fourier transform of the binotf array.
- the binotf array specifies the non-zero spatial frequency of the otf located in the fourier plane.
- Figure 12 shows the fourier transform of an image depicting binotf to ensure no higher frequencies in the spectrum exist.
- the values of binotf are 1 up to the optical system cutoff value f c and 0 beyond that cutoff.
- the low pass filtered data D f (x) in Figure 11 is then multiplied pixel by pixel with the bin man array (binmap (x)) to separate out a first estimate of the reconstructed object from the filtered D1 data, as shown in equation 11(b) in module 610.
- the binmap array specifies the region in the scene containing the object to be super-resolved.
- the binmap has array elements equal to 1 where the object of interest is located and array elements equal to 0 everywhere else.
- Figure 13 shows a pictorial representation of the binmap array, where the binman window (W) holds a region containing an object of interest (RI) consisting of pixels equal to one in the region containing the object and pixels equal to zero everywhere else (RO).
- Equation 11 provides the mathematical formula for this replacement, creating a reconstructed object array S(x).
- S(x) is then convolved with the optical system PSF (h 0 ) to blur the combination of the reconstructed background and the estimated reconstructed object as shown in equation 11(d) of module 630.
- a new array, N(X), is then created in block 640 by dividing, on a pixel by pixel basis, the filtered D1 scene array (D f ) by the blurred combination of the reconstructed background and the estimated reconstructed object (I S ) as shown in equation 11(e) of module 640.
- the new array, N(x) is then correlated with the optical system PSF (h 0 ) and multiplied, for each pixel specified by binmap, by the current estimate of the reconstructed object. Equation 11(f) of module 650 is then used to determine Fix), the new estimate of the reconstructed object.
- the reconstructed object G(x) is the output of module 70.
- This G(x) is in fact the desired super-resolved object.
- the above description of the super-resolution method as shown in Figure 11 is set up to handle non-thinned apertures.
- step 630 of Figure 11 in which the new scene I s (x) is blurred again using the optical system's PSF may be excluded.
- Figures 14A - D represent simulated bar target charts where Figure 14A represents the truth scene illustrated by a series of alternating dark and light bands within a background.
- Figure 14B represents the blurred image of the truth scene (through a small aperture), and
- Figures 14C and 14D represent the reconstructed images using the non-linear background reconstruction method previously described.
- Figures 15A - D are associated respectively with Figures 14A - D and represent a one-dimensional Fourier transform cut through each of the "scenes", thus clearly illustrating the spatial frequencies that have been restored to the reconstructed image.
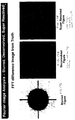
- Figures 16A - C represent the application of the non-linear method to a thinned aperture system.
- the thinned aperture configuration is an annulus. It should be noted, however, that the method may be utilized with any thinned aperture design.
- Figure 16A represents a computer generated ground scene (i.e. the truth scene) . The blurred image of that scene is then depicted in Figure 16B, while the final reconstructed, super-resolved image is shown in Figure 16C.
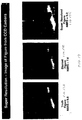
- Figures 17A - C represent images of figures taken from a CCD camera.
- Figure 17A represents the truth scene (a picture of a toy spacemen), while Figure 17B shows the blurred image of the scene (observed through a small aperture).
- Figure 17C represents the reconstructed image, and
- Figure 17D shows the magnitude of the difference of the two-dimensional Fourier transform between the truth scene in Figure 17A and the blurred image of Figure 17B.
- Figure 17E shows the difference between the truth scene and the first stage of reconstruction (i.e. the deconvolved figure), while Figure 17F shows the magnitude of the difference of the two-dimensional Fourier transform and the truth scene for the reconstructed, super resolved image. Note that black indicates a 0 difference, which is the desired result, while white indicates a maximum difference.
- Figures 17D, E and F the radius of Figure 17D corresponds to the cutoff of the optical system or camera, and the deconvolved image frequencies in Figure 17E have been enhanced inside the cutoff but remain zero outside the cutoff.
- the super-resolved figure in Figure 17F has further improved the image by restoring frequencies outside the cutoff as can be shown by the increased blackness of the figure with respect to either Figures 17D or 17E.
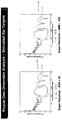
- Figures 18A-B represent a graphical illustration of the truth, blurred, and reconstructed super-resolved images for SNR values of 50 and 100 respectively.
- Figures 18A and B show that the non-linearly reconstructed images closely parallel the truth images.
- the reconstruction approach using a linear transformed method is now described.
- the imaging system is mathematically characterized by a linear operator represented by a matrix.
- an inverse imaging matrix corresponding to the inverse operator must be constructed.
- a constrained least squares procedure such as Tikhonov regularization
- a regularized pseudo-inverse (RPI) matrix may be generated.
- Zero-order Tikhonov regularization is preferably used, although higher order Tikhonov regularization may sometimes give better results. The details of this are not described here, as Tikhonov regularization is well-known in the art.
- a key quantity used to construct the RPI matrix is the regularization parameter which controls the image restoration. Larger parameter values protect the restored image from the corrupting effects of the optical system but result in a restored image which has lower resolution.
- An optimum or near optimum value for the regularization parameter may be derived automatically from the image data.
- Singular value decomposition (SVD) of the imaging operator matrix may be used to compute the RPI matrix. By estimating the noise or error level of the degraded image the singular values of the matrix determine the extent to which the full information in the original scene may be recovered. Note that the use of the SVD process is not essential in determining the RPI matrix, and other methods such as QR decomposition of the imaging matrix may also be used to achieve essentially the same result.
- the imaging matrix size increases approximately as the square of the image size, and the computational burden associated with forming the RPI of the imaging matrix quickly becomes intolerable.
- the imaging matrix can be expanded into circulant form by inserting appropriately positioned, additional columns.
- a fundamental theorem of matrix algebra is that the Fourier transform diagonalizes a circulant matrix. This allows the reduction of the image reconstruction algorithm to a pair of one dimensional fast Fourier transforms, followed by a vector - vector multiplication, and finally an inverse one dimensional fast Fourier transform. This procedure allows the image restoration by this Tikhonov regularization technique to be done entirely in the Fourier transform domain, dramatically reducing the time required to compute the reconstructed image.
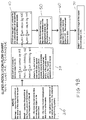
- Figure 19 provides an illustration of the steps taken to obtain the reconstructed image using the linear transform method.
- FIGs 19a,b A flow diagrams of the Linear Algebra Technique according to the present invention are shown in Figures 19a,b.
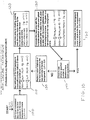
- Module 16 shows the subtraction step whereby the matrix representation (g 3 ) of the difference between blurred scene data containing the background and object of interest (g 1 ) and the blurred scene containing only the background data (g 2 ) is formed as (g 1 -g 2 ).
- the position and size of the object of interest is specified by choosing x,y coordinates associated with image matrix (g 1 -g 2 ) (module 18).
- a segment of sufficient size to contain the blurred object in its entirety is then extracted from the matrix representation of (g 1 -g 2 ), as shown in Module 20. That is, an area equal to the true extent of the local object plus its diffracted energy is determined.
- An identically located segment i.e.
- module 22 segment having the same x,y coordinates
- module 22 segment having the same x,y coordinates
- the two image segments output from module 15 and 20 are then input to module 24 to restore g 2 and (g 1 -g 2 ) using nth order Tikhonov regularization.
- the restored segments are then added together as shown in step 26 and the area containing the restored object of interest is extracted therefrom, as shown in module 28.
- the resulting reconstructed image includes much of the spatial resolution which was lost due to diffraction blurring effects.
- the present invention is not limited to any one type of optical sensor device.
- the principles which have been described herein apply to many types of applications which include, but are not limited to, Optical Earth Resource Observation Systems (both Air and Spaceborne), Optical Weather Sensors (both Air and Spaceborne), Terrain Mapping Sensors both Air and Spaceborne), Surveillance Sensors (both Air and Spaceborne), Optical Phenomenology Systems (both Air and Spaceborne), Imaging Systems that utilize optical fibers such as Medical Probes, Commercial Optical Systems such as Television Cameras, Telescopes utilized for astronomy and Optical Systems utilized for police and Rescue Work.
- the imaging system/method disclosed herein may be used on a satellite, and a means for controlling the satellite which is located on the earth may be provided.
Abstract
Description
- The present application is related to copending commonly assigned U.S. patent application, serial number 08/763,610, filed on December 11, 1996, entitled "Apparatus and Method For Providing Optical Sensors With Super Resolution", incorporated herein by reference.
- The present invention relates generally to optical devices, and more particularly to an optical sensor utilizing background reconstruction image processing techniques in order to provide a much higher level of resolution of a localized object within a 5 background scene.
- Optical sensors are devices which for decades have been used to detect and record optical images. Various types of optical sensors have been developed which work in the Ultra Violet Bands, Infra Red Bands as well as in the Visible Bands of operation. Examples of such devices include Weather Sensors, Terrain Mapping Sensors, Surveillance Sensors, Medical Probes, Telescopes and Television Cameras.
- An optical sensor typically includes an optical system and one or more detectors. The optical system portion is made up of various combinations of lenses, mirrors and filters used to focus light onto a focal plane located at the image plane of the optical system. The detectors which make at the image plane are used to convert the light received from the optical system into electrical signals. Some types of optical sensors use film rather than detectors to record the images. In this case, the grain size of the film is analogous to the detectors described above.
- An important performance characteristic of optical sensors is their "spatial resolution" which is the size or the smallest object that can be resolved in the image or, equivalently, the ability to differentiate between closely spaced objects. If the optical system is free from optical aberrations (which means being "well corrected") the spatial resolution is ultimately limited by either diffraction effects or the size of the detector.
- Diffraction is a well known characteristic of light which describes how light passes through an aperture of an optical system. Diffraction causes the light passing through an aperture to spread out so that the point light sources of a scene end up as a pattern of light (known as a diffraction pattern) diffused across the image. For a well corrected, unobscured optical system known as a diffraction limited system, the diffraction pattern includes a very bright central spot, surrounded by somewhat fainter bright and dark rings which gradually fade away as the distance from the central spot increases.
- An optical sensor that is designed to be diffraction limited usually has a very well corrected optical system and detectors sized so that the central spot of the diffraction pattern just fits within the active area of the detector. With conventional sensors, making the detectors smaller does not improve resolution and considerably increases the cost due to the expense of the extra detectors and the associated electronics.
- The size of the aperture used in the optical system determines the amount of resolution lost to diffraction effects. In applications such as camera lenses and telescope objectives, the aperture size is normally expressed as an f-number which is the ratio of the effective focal length to the size of the clear aperture. In applications such as microscope objectives, the aperture size is normally expressed as a Numerical aperture (NA) which is the index of refraction times the sine of the half angle of the cone of illumination. For a given focal length, a high f-number corresponds to a smaller aperture, while a higher Numerical aperture corresponds to a larger aperture.
- A basic limitation of conventional optical sensors is the aperture size required for a given level of resolution. Higher resolution images require larger apertures. In many situations the use of such a system is very costly. This is because using a larger aperture requires a significantly larger optical system.
- The cost for larger systems which have apertures with diameters greater than one foot is typically proportional to the diameter of the aperture raised to a power of "x". The variable "x" usually ranges from 2.1 to 2.9 depending on a number of other particulars associated with the sensor such as its wave band, field of regard, and field of view.
- The size of the optical sensor is particularly relevant for systems that fly on some type of platform, either in space or in the air. Under such conditions the sensor must be light weight, strong, and capable of surviving the rigors of the flight environment. Thus the cost of going to a larger optical system can be in the hundreds of millions of dollars for some of the larger and more sophisticated sensors. Practical considerations, such as the amount of weight the host rocket, plane, balloon, or other vehicle can accommodate, or the amount of space available, may also limit the size of the sensor. These practical considerations can prevent a larger system from being implemented no matter how large the budget.
- A number of optical imaging techniques have been developed to increase spatial resolution. One such technique is known as sub-pixel resolution. In sub-pixel resolution the optical system is limited in spatial resolution not by diffraction but by the size of the detectors or pixels. In this case, the diffraction pattern of the aperture is much smaller than the detectors, so the detectors do not record all the resolution inherent in the optical system's image. Sub-pixel resolution attempts to reconstruct an image that includes the higher resolution not recorded by the detectors. This technique does not require hardware or system operation changes in order to work. Examples of sub-pixel resolution techniques are disclosed in an article in ADVANCED SIGNAL PROCESSING ALGORITHMS, ARCHITECTURES AND IMPLEMENTATIONS II, by J.B. Abbiss et al., The International Society For Optical Engineering, Volume 1566, P. 363 (1991).
- Another example is the use of "thinned aperture" systems where for example, a widely-spaced pattern or small holes is used as a substitute for the complete aperture. However, even "thinned apertures" are limited in resolution by diffraction theory and by the outer diameter of the widely-spaced pattern or small holes. Note that current electro-optical systems are sometimes designed so that the size of their detector matches the size of the diffraction blur of their optics.
- Other examples of optical imaging techniques are disclosed in an article entitled SUPER RESOLUTION ALGORITHMS FOR A MODIFIED HOPFIELD NEURAL NETWORK, by J.B. Abbiss et al., IEEE Transactions On Signal Processing, Vol. 39, No. 7, July 1991 and in a paper entitled FAST REGULARIZED DECONVOLUTION IN OPTICS AND RADARS, by J.B. Abbiss et al., presented at the 3rd IMA Conference on Mathematics in Signal Processing. These techniques use linear algebra and matrix techniques to restore signals or images from a limited discrete data set.
- The previously described techniques have a number of drawbacks with regard to optical sensors. First, only one of these techniques is directed toward a diffraction limited device. In addition, these techniques often produce systems of equations which cannot be solved due to the practical constraints on computing power. Furthermore, none of the previously described techniques specify either the types of detectors or other system parameters which are used along with these techniques.
- It is, therefore, an object of the present invention to provide an apparatus and method for increasing the resolution of an optical sensor without using a substantially larger aperture.
- The invention provides an apparatus and method for improving the spatial resolution of an object using a background reconstruction approach wherein a localized object containing high spatial frequencies is assumed to exist inside a background scene containing primarily low and/or very high spatial frequencies compared to the spatial frequencies of the localized object. The imaging system cannot pass these high spatial frequencies (neither the high frequencies of the object, nor the very high frequencies of the background) . The background image's low spatial frequencies are used to reconstruct the background scene in which the localized object is situated. Using this reconstructed background and the space limited nature of the localized object (i.e. it is only present in part of the scene, not the entire scene), the high spatial frequencies that did not pass through an optical system are restored, reconstructing a detailed image of the localized object.
- An improvement comprises filtering the noisy blurred background data of the same scene to obtain noise suppressed data; applying estimations of point spread functions associated with the noise suppressed data and optical system to estimates of the noise suppressed data to obtain a reconstructed background image (Ir(X)); and low pass filtering the noisy blurred scene data containing the object to be reconstructed (D1, and using the reconstructed background image (Ir(x)) to eliminate the background data from the image data to obtain a reconstructed image of an object with increased spatial resolution.
- The above objects, further features and advantages of the present invention are described in detail below in conjunction with the drawings, of which:
- FIGURE 1 is a general block diagram of the optical sensor according to the present invention;
- FIGURE 2 is a diagram of a linear detector array tailored to the present invention;
- FIGURE 3 is a diagram of a matrix detector array tailored to the present invention;
- FIGURE 4 is a diagram illustrating the size of an individual detector tailored to the present invention;
- FIGURE 5 is a diagram illustrating how the detector grid is sized with respect to the central diffraction lobe;
- FIGURE 6 is a diagram of a multi-linear detector array tailored to the present invention;
- FIGURE 7 is a diagram of another version of a multi-linear detector array tailored to the present invention;
- FIGURE 8 is diagram illustrating the operation of a beam splitter as part of an optical system tailored to the present invention;
- FIGURE 9A-B represents an image scene and a flow diagram of the non-linear background reconstruction technique of the image scene according to the present invention;
- FIGURE 10 is a diagram illustrating the Richardson-Lucy background reconstruction portion of the non-linear image processing technique according to the present invention;
- FIGURE 11 is a diagram illustrating the Object Reconstruction and background subtraction portion of the non-linear image processing according to the present invention;
- FIGURE 12 is a schematic illustrating the Fourier Transform characteristic of binotf.
- FIGURE 13 is a schematic of the relationship of binmap to the object of interest within a window of a particular scene according to the present invention; and
- FIGURES 14A-D show the effects of super-resolution of simulated bar targets using the non-linear reconstruction technique according to the present invention;
- FIGURES 15A-D show the Fourier analysis of simulated bar targets associated with FIGs 14A-D;
- FIGURES 16A-C show simulated images associated with a thinned aperture optical system configuration using non-linear method.
- FIGURES 17A-C show the super-resolution of an image of a figure taken from a CCD camera and reconstructed using the non-linear method according to the invention;
- FIGURES 17D-F show the Fourier image analysis of the image of FIGs 17A-C;
- FIGURES 18A-B show the Fourier analysis of superimposed truth, blurred, and reconstructed images as function of frequency for SNR values of 50 and 100, respectively;
- FIGURES 19a,b are flow diagrams of the linear algebra background reconstruction technique according to the present invention.
-
- The present invention is directed to an apparatus and method of superresolution of an image for achieving resolutions beyond the diffraction limit. This is accomplished by background reconstruction, wherein a localized object containing high spatial frequencies is assumed to exist inside a background scene containing primarily low and/or very high spatial frequencies compared to the spatial frequencies of the localized object. The point spread function (PSF) of an optical system causes the background data to blend with and flow over objects of interest, thereby contaminating the boundaries of these objects and making it exceedingly difficult to distinguish these objects from the background data. However, if one knows or can derive the background, then the object may be disentangled from the background such that there will exist uncontaminated boundaries between the object and the background scene. Another way of describing the effect of a PSF is to note that the spatial frequencies associated with the object of interest which lie beyond the optical system cutoff frequency are lost. In the background reconstruction approach, a localized object such as a tractor having high spatial frequencies is super-resolved inside a background scene containing primarily low and/or ultra-high spatial frequencies such as a cornfield. Typically, the imaging system cannot pass either the high spatial frequencies of the object or the ultra-high spatial frequencies of the background. This invention uses the background images' low spatial frequencies to reconstruct the background scene in which the localized object is situated. This reconstructed background and the space limited nature of the localized object (that is, the object is present in only part of the scene rather than the entire scene) can be used to restore the high spatial frequencies that did not pass through the optical system, thereby reconstructing a detailed image of the localized object.
- In accordance with alternative embodiments of the present invention, both linear and nonlinear methods for reconstructioning localized objects and backgrounds to produce super-resolved images are described.
- Referring to FIGURE 1, there is shown a general block diagram of an optical sensor accommodating the present invention. The sensor (10) as in conventional devices includes an optical system (12) and detectors (14). The optical system (12) which includes various combinations of lenses, mirrors and filters depending on the type of application is used to focus light onto a focal plane where the detectors (14) are located. The optical system (12) also includes a predetermined aperture size corresponding to a particular Numeral aperture (NA) which, in conventional diffraction-limited devices, limits the amount of spatial resolution that is attainable. This is, as previously described, due to diffraction blurring effects.
- The optical system (12) can be described by an optical transfer function (OTF) which represents the complete image forming system, and which can be used to characterize that system.
- The detectors (14) convert the light received from the optical system (12) into the electrical signals which become the data used to generate images. In conventional sensors the detectors are configured in a linear array for Scanning systems or in a matrix array for Staring systems. In Scanning systems, the detector linear array is swept in a direction perpendicular to the length of the array generating data one scan line at a time with each line corresponding to one line of the image. In Staring systems the matrix array is not moved and generates all of the imaging data simultaneously. Thus each detector of the matrix array corresponds to one pixel of the image. It is intended that the detectors (14) of the present invention will be configured as a linear array or a matrix array depending on the type of system being used.
- The detectors (14) take many different forms depending on the wavelength of light used by the present invention. For example, in the ultraviolet and X-Ray ranges such detectors as semitransparent photocathodes and opaque photocathodes can be used. In the visible range such detectors as vacuum phototubes, photomultipliers, photoconductors, and photodiodes can be used. In the infrared range, such detectors as photoconductors, photodiodes, pyroelectric, photon drag and golay cell devices can be used.
- In the present invention various elements of the sensor (10) must be optimized to be used with a particular image-processing technique. The type of optimization depends on the image-processing technique. As will be described in detail later, the present invention includes two alternative image-processing techniques. Each of these two super-resolution methods may be used with the sensor configurations as described below.
- In case one, the sensor (10) must include detectors (14) that have an "instantaneous field of view" that is equal to or less than the desired level of spatial resolution. If, for example, the required resolution is one meter or less then the "instantaneous field of view" of the detectors must be one meter or less (even though the central lobe of the diffraction pattern is much larger). This makes the pixel size of the image produced by the sensor (10) smaller than the central diffraction lobe. (Note that, such a configuration adds additional cost to the sensors. However, for large systems the increase in cost is less than the cost of a larger aperture.)
- The sensor (10) can obey this rule in one of two ways. One way is to use more smaller-size detectors (14). In conventional sensors the number of detectors used varies anywhere from one to millions depending on the application.
- In one embodiment of the present invention at least five times more detectors (14) than normal are required to achieve the desired resolution. A diagram of a linear detector array to be used with the present invention is shown in FIGURE 2, while a diagram of a matrix detector array to be used with the present invention is shown in FIGURE 3. The number of detectors (14) included in these arrays (28), (30) depends on the application. However, as previously pointed out to achieve the higher resolution these arrays (28), (38) will include at least five times more detectors (14) than conventional sensors for a given application.
- In conventional sensors, the size of the individual detector is never smaller than the size of the central diffraction on lobe . This is because utilizing smaller sensors serves no purpose since the resolution is limited by the optical aperture. In the present invention, the size of the individual detectors (14) must be smaller than the size of the central diffraction lobe (18), as shown in FIGURE 4.
- Another way of configuring the sensor (10) according to Case one is again to use a larger number of detectors (14), but instead of using smaller detectors configure the optical system (12) so that more than one detector is spread across the central diffraction lobe. This allows conventional size detectors (14) to be used. The number of detectors (14) used again must be five times or more than required in conventional sensors. In order to configure the optical system (12) as described above the back focal length must be adjusted so that five or more detectors (14) spread across the central diffraction lobe (18), as shown in FIGURE 5.
- In Scanning systems, it is difficult to generate multiple image data by viewing the object at different times. This is because the optical system assumes that the object remains stationary while being scanned. The solution is to use detectors (14) configured in a multi-linear array as shown in FIGURE 6. The multi-linear array (20) includes a number of individual linear arrays (22) shifted parallel to each other by a distance (d) which is a fraction of a pixel. When the array (20) is swept each linear array (22) generates imaging data corresponding to one scan line of each of the images. Thus each linear array (22) creates one of the images being produced. In the preferred configuration, the array (20) includes ten or more individual
linear arrays 22 which are capable of producing ten or more different images. - Now two more examples of this technique are discussed. These examples are labeled Case three and Case four.
- In Case three, the sensor (10) is configured to take images of objects in multiple color bands. In Scanning systems, this is accomplished by utilizing a multi-linear array, as shown in FIGURE 7. The multi-linear array (24) also includes a number of individual linear arrays (22) arranged in a parallel configuration shifted parallel to each other by a distance (d) which is a fraction of a pixel. A color filter (26) is disposed over each of the linear arrays (22). The color filters (26) are configured to pass only a particular portion of the color spectrum which may include multiple wavelengths of visible light. When the array (24) is swept, each linear array (22) produces images of the same object in different color bands. The filters (26) are fabricated by depositing optical coatings on transparent substrates, which are then placed over each of the linear arrays (22). This process is well known.
- In Staring systems, the multiple color-band data is created by incorporating a beam splitter in the optical system (12) and using multiple detector arrays. Such a configuration is illustrated in FIGURE 8. The beam splitter (28) splits the incoming light (32) into multiple beams (34); Figure 8 shows the basic idea using a two-beam system. Due to the operation of the beam splitter (28) each light beam (34) includes a different part of the color spectrum which may include one or more different bands of visible or infrared light. Each light beam is directed to one of the detector arrays (30) producing images of the same object in different color bands.
- In Case four, the sensor (10) is a combination of the three previously described cases. This is accomplished by combining the principles discussed above with regard to Cases one, two or three. In all three cases the sensor must be desired to have a signal to noise ratio which is high as possible. This is done either by increasing the integration time of the detectors (14) or by slowing down the scan speed as much as possible for scanning systems. For Case two, the system's design, or its operation mode, or both, are changed in order to take the required multiple images in a known pattern displaced by a known distance that is not a multiple of a pixel, but rather is a multiple of a pixel plus a known fraction of a pixel.
- Referring back to FIGURE 1, coupled to the detectors (14) is a processor (16) which processes the image data to achieve the higher resolution. This done by recovering "lost" information from the image data. Even though the diffraction blur destroys the required spatial resolution, some of the "lost" spatial information still exists spread across the focal plane. The small-size detectors described above are used to sample at a 5 to 10 times higher rate than is customary in these sorts of optical systems in conjunction with processing enabling much of this "lost" information to be recovered and thus restoring the image to a higher level of resolution than classical diffraction theory would allow.
- The processor (16) uses one of two image processing techniques: a Non-linear Reconstruction method using a modified Richardson-Lucy Enhancement technique, and a background reconstruction approach using a linear algebra technique.
- One reasonable extension of the previously described imaging techniques is to use phase retrieval or wave front phase information to reconstruct the image and thus achieve higher resolution. Another reasonable extension of the previously described technique is to use prior knowledge of the background scene to help resolve objects that have recently moved into the scene. The processor (16) in addition to using one of the above described primary data processing techniques, also uses other techniques to process further the imaging data. This further processing is accomplished by standard image enhancement techniques which can be used to improve the reconstructed image. Such techniques include, but are not limited to, edge sharpening, contrast stretching or other contrast enhancement techniques.
- The Non-linear Background Reconstruction method using a modified Richardson-Lucy Enhancement Technique is described as follows. In Figure 9A, there is shown a scene (S) comprising a localized object (O) such as a tractor within a noisy blurred background (B). In Figure 9B, input data D2 (Block 20), representing the noisy blurred background data, is input into
module 30 to remove the noise from D2 using a modified version of the method of sieves. Note that the input data D1 and D2 indicated inblock 20 has been sampled at the Nyquist rate (5 times the customary image sampling rate) and preferably at twice the Nyquist rate (ten times the customary sampling rate) to obtain robust input data. - The modified method of sieves removes noise by averaging adjacent pixels of the noisy blurred background data D2 of the same scene together, using two and three pixel wide point spread functions. Array h0 in equation (9a) of
module 30 represents the optical system PSF, which is the Fourier transform of the OTF input. - The output of
module 30 thus provides separate pictures - the optical system image I(x) and the modified background data images D3(x) and D4(x). As shown inblock 40, new point spread functions h3T and h4T have been constructed to account for the combined effect of the method of sieves and the optical system. These new point spread functions use both the two and three pixel wide point spread functions, h3 and h4, previously identified, as well as the optical system PSF h0, as shown in equation 9(d) and (e), to arrive at the new PSF's. - As shown in
block 50, the Richardson-Lucy method is then used to reconstruct the background scene data, D2, with the reconstructed data defined to be Ir(x). Figure 10 shows an exploded view of the processing steps for reconstructing the background scene to obtain the reconstructed background Ir(x). - In Figure 10 the noise suppressed data D2 from
block 20 of Figure 9B, is used as the first estimate of the true background scene, In(x) (Module 100). As shown inmodule 110, this estimate of the true background scene is then blurred using the combined method of sieves and optical system point spread functions to obtain two picture representations 13(x) and 14(x), where 13(x) is given by equation 10 (a) and 14 (x) is given by equation 10 (b). Two new arrays, as shown inmodule 120, are then created by dividing pixel by pixel the noisy scene data, D3(x) and D4(x), by the blurred estimate of the true background scene, I3(x) and I4(x), as shown in equations 10(c) and (d) respectively. The new arrays T3(x) and T4(x) are then correlated with the combined method of sieves and optical system PSF's and the result is multiplied pixel by pixel with the current estimate of the true background scene. In this manner a new estimate of the true background scene, Z(x), is obtained as shown inmodule 130 and by equations 10 (e)-(g). - The processor then determines whether a predetermined number of iterations have been performed, as shown in
block 140. If the predetermined number has not been performed, the current estimate of the true background is replaced by the new estimate of the true background (Z(x)) (Block 150) and the processing sequence or modules 110 - 140 are repeated. If, however, the predetermined number has been reached, then the latest estimate of the true background scene is taken to be the reconstructed background scenes; that is, Ir(x) is taken to equal Z(x) as shown inblock 160. Note that for the optical systems described above the predetermined number of iterations is preferably between one thousand and two thousand. - In Figure 9B the reconstructed background Ir(x) (equal to Z(x)) is then input to
module 60, where the background subtraction steps are performed to super-resolve the object within the noisy blurred scene data (D1). The reconstructed object, G(x), which has been super-resolved, is then output as shown inmodule 70. - The background subtraction method for super-resolving the object of interest in D1 is detailed in Figure 11. In Figure 11 the noisy blurred scene data D1 containing the object to be reconstructed is used as input, with a low-pass filter (block 600) applied to remove high spatial frequency noise from the D1 data as shown by equation 11(a). In equation 11(a) the transfer function hb(x) represents the Fourier transform of the binotf array. The binotf array specifies the non-zero spatial frequency of the otf located in the fourier plane. Figure 12 shows the fourier transform of an image depicting binotf to ensure no higher frequencies in the spectrum exist.
- As shown in Figure 12, the values of binotf are 1 up to the optical system cutoff value fc and 0 beyond that cutoff. The low pass filtered data Df(x) in Figure 11 is then multiplied pixel by pixel with the bin man array (binmap (x)) to separate out a first estimate of the reconstructed object from the filtered D1 data, as shown in equation 11(b) in
module 610. The binmap array specifies the region in the scene containing the object to be super-resolved. The binmap has array elements equal to 1 where the object of interest is located and array elements equal to 0 everywhere else. Figure 13 shows a pictorial representation of the binmap array, where the binman window (W) holds a region containing an object of interest (RI) consisting of pixels equal to one in the region containing the object and pixels equal to zero everywhere else (RO). - The next step in Figure 11 is to replace the reconstructed background scene pixels, Ir(x), by the estimated reconstructed object pixels, D0(x), at object positions specified by the binmap (40), as shown in
module 620.Equation 11© provides the mathematical formula for this replacement, creating a reconstructed object array S(x). S(x) is then convolved with the optical system PSF (h0) to blur the combination of the reconstructed background and the estimated reconstructed object as shown in equation 11(d) ofmodule 630. A new array, N(X), is then created in block 640 by dividing, on a pixel by pixel basis, the filtered D1 scene array (Df) by the blurred combination of the reconstructed background and the estimated reconstructed object (IS) as shown in equation 11(e) of module 640. The new array, N(x), is then correlated with the optical system PSF (h0) and multiplied, for each pixel specified by binmap, by the current estimate of the reconstructed object. Equation 11(f) ofmodule 650 is then used to determine Fix), the new estimate of the reconstructed object. - After K(x) has been calculated a check is made, as shown in
module 660, to determine whether the specified number of iterations have been completed. If more iterations are needed the current estimate of the reconstructed object is replaced by the new estimate as shown by equation 11(g) ofmodule 670. Steps 620 - 660 are repeated until the specified number of iterations have been accomplished. When this happens the latest estimate of the reconstructed objects is taken to be the reconstructed object; that is G(x) is set equal to K(x), as shown in module 680 (equation 11H). - In Figure 9B the reconstructed object G(x) is the output of
module 70. This G(x) is in fact the desired super-resolved object. Note that the above description of the super-resolution method as shown in Figure 11 is set up to handle non-thinned apertures. For thinned aperture systems, step 630 of Figure 11 (in which the new scene Is(x) is blurred again using the optical system's PSF) may be excluded. - Three examples of applying the background reconstruction approach using the above-described non-linear technique to obtain surer-resolution are illustrated in Figures 14 - 16. Figures 14A - D represent simulated bar target charts where Figure 14A represents the truth scene illustrated by a series of alternating dark and light bands within a background. Figure 14B represents the blurred image of the truth scene (through a small aperture), and Figures 14C and 14D represent the reconstructed images using the non-linear background reconstruction method previously described. Figures 15A - D are associated respectively with Figures 14A - D and represent a one-dimensional Fourier transform cut through each of the "scenes", thus clearly illustrating the spatial frequencies that have been restored to the reconstructed image.
- Figures 16A - C represent the application of the non-linear method to a thinned aperture system. In this case, the thinned aperture configuration is an annulus. It should be noted, however, that the method may be utilized with any thinned aperture design. Figure 16A represents a computer generated ground scene (i.e. the truth scene) . The blurred image of that scene is then depicted in Figure 16B, while the final reconstructed, super-resolved image is shown in Figure 16C.
- Figures 17A - C represent images of figures taken from a CCD camera. Figure 17A represents the truth scene (a picture of a toy spacemen), while Figure 17B shows the blurred image of the scene (observed through a small aperture). Figure 17C represents the reconstructed image, and Figure 17D shows the magnitude of the difference of the two-dimensional Fourier transform between the truth scene in Figure 17A and the blurred image of Figure 17B. Figure 17E shows the difference between the truth scene and the first stage of reconstruction (i.e. the deconvolved figure), while Figure 17F shows the magnitude of the difference of the two-dimensional Fourier transform and the truth scene for the reconstructed, super resolved image. Note that black indicates a 0 difference, which is the desired result, while white indicates a maximum difference. As one can see from a comparison of Figures 17D, E and F, the radius of Figure 17D corresponds to the cutoff of the optical system or camera, and the deconvolved image frequencies in Figure 17E have been enhanced inside the cutoff but remain zero outside the cutoff. The super-resolved figure in Figure 17F has further improved the image by restoring frequencies outside the cutoff as can be shown by the increased blackness of the figure with respect to either Figures 17D or 17E. This is a clear demonstration that super resolution has occurred. Figures 18A-B represent a graphical illustration of the truth, blurred, and reconstructed super-resolved images for SNR values of 50 and 100 respectively. Figures 18A and B show that the non-linearly reconstructed images closely parallel the truth images.
- In an alternative embodiment, the reconstruction approach using a linear transformed method is now described. When reconstructing either the background scene or the localized object, the imaging system is mathematically characterized by a linear operator represented by a matrix. To restore either a background scene or the localized object, an inverse imaging matrix corresponding to the inverse operator must be constructed. However, due to the existence of system noise, applying the inverse imaging matrix to the image is intrinsically unstable and results in a poorly reconstructed image. However by applying a constrained least squares procedure such as Tikhonov regularization, a regularized pseudo-inverse (RPI) matrix may be generated. Zero-order Tikhonov regularization is preferably used, although higher order Tikhonov regularization may sometimes give better results. The details of this are not described here, as Tikhonov regularization is well-known in the art.
- A key quantity used to construct the RPI matrix is the regularization parameter which controls the image restoration. Larger parameter values protect the restored image from the corrupting effects of the optical system but result in a restored image which has lower resolution. An optimum or near optimum value for the regularization parameter may be derived automatically from the image data. Singular value decomposition (SVD) of the imaging operator matrix may be used to compute the RPI matrix. By estimating the noise or error level of the degraded image the singular values of the matrix determine the extent to which the full information in the original scene may be recovered. Note that the use of the SVD process is not essential in determining the RPI matrix, and other methods such as QR decomposition of the imaging matrix may also be used to achieve essentially the same result.
- The imaging matrix size increases approximately as the square of the image size, and the computational burden associated with forming the RPI of the imaging matrix quickly becomes intolerable. However, in the special case that the image and object fields are the same size and are sampled at the same intervals (as is the case here), the imaging matrix can be expanded into circulant form by inserting appropriately positioned, additional columns. A fundamental theorem of matrix algebra is that the Fourier transform diagonalizes a circulant matrix. This allows the reduction of the image reconstruction algorithm to a pair of one dimensional fast Fourier transforms, followed by a vector - vector multiplication, and finally an inverse one dimensional fast Fourier transform. This procedure allows the image restoration by this Tikhonov regularization technique to be done entirely in the Fourier transform domain, dramatically reducing the time required to compute the reconstructed image. Figure 19 provides an illustration of the steps taken to obtain the reconstructed image using the linear transform method.
- A flow diagrams of the Linear Algebra Technique according to the present invention are shown in Figures 19a,b. Referring now to Figure 19a, the technique first converts the imaging data collected by the optical system of the sensor into a matrix of the form
Module 16 then shows the subtraction step whereby the matrix representation (g3) of the difference between blurred scene data containing the background and object of interest (g1) and the blurred scene containing only the background data (g2) is formed as (g1-g2). Next, the position and size of the object of interest is specified by choosing x,y coordinates associated with image matrix (g1-g2) (module 18). A segment of sufficient size to contain the blurred object in its entirety is then extracted from the matrix representation of (g1-g2), as shown inModule 20. That is, an area equal to the true extent of the local object plus its diffracted energy is determined. An identically located segment (i.e. segment having the same x,y coordinates) is extracted from the blurred background scene matrix g2 as shown inmodule 22. The two image segments output frommodule module 24 to restore g2 and (g1-g2) using nth order Tikhonov regularization. The restored segments are then added together as shown instep 26 and the area containing the restored object of interest is extracted therefrom, as shown inmodule 28. - The resulting reconstructed image includes much of the spatial resolution which was lost due to diffraction blurring effects.
- It should be noted that the present invention is not limited to any one type of optical sensor device. The principles which have been described herein apply to many types of applications which include, but are not limited to, Optical Earth Resource Observation Systems (both Air and Spaceborne), Optical Weather Sensors (both Air and Spaceborne), Terrain Mapping Sensors both Air and Spaceborne), Surveillance Sensors (both Air and Spaceborne), Optical Phenomenology Systems (both Air and Spaceborne), Imaging Systems that utilize optical fibers such as Medical Probes, Commercial Optical Systems such as Television Cameras, Telescopes utilized for astronomy and Optical Systems utilized for Police and Rescue Work. The imaging system/method disclosed herein may be used on a satellite, and a means for controlling the satellite which is located on the earth may be provided.
- While the inversion has been particularly shown and described with reference to preferred embodiments thereof, it will be understood by those skilled in the art that changes in form and details may be made therein without departing from the spirit and scope of the present invention.
Claims (44)
- In an optical system having a detector means and processor means in which image data is obtained comprising scene data containing an object to be reconstructed, and background data of the same scene, an improved method for increasing the spatial resolution of the imaging data produced by the optical system, the improvement therewith comprising:obtaining a reconstructed background image, andlow pass filtering the scene data containing the object to be reconstructed and using the reconstructed background image to eliminate the background data from the image data to obtain a reconstructed image of the object with increased spatial resolution.
- In an optical system having a detector means and processor means in which image data is obtained comprising scene data containing an object to be reconstructed, and background data of the same scene, an improved method for increasing the spatial resolution of the imaging data produced by the diffraction limited optical system, the improvement therewith comprising:filtering the noisy blurred background data (D2) of the same scene to obtain noise suppressed data:applying estimations of point spread functions associated with the noise suppressed data and optical system to the noise suppressed data to obtain a reconstructed background image (Ir(x)); andlow pass filtering the noisy blurred scene data containing the object to be reconstructed and using the reconstructed background image to eliminate the background data from the image data to obtain a reconstructed image of the object with increased spatial resolution.
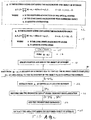
- The method according to claim 2, wherein the step of filtering to remove noise from D2 comprises using the modified method of sieves to remove said noise, using the equations;
- The method according to claim 2, wherein the reconstructed background Ir(x) is obtained using the Richardson-Lucy reconstruction technique.
- The method according to claim 3, further comprising constructing new point spread functions (h3T, h4T) to account for combined effect of the method of sieves two and three pixel wide point spread functions, and the optical system point spread functions.
- The method according to claim 5, wherein said noise suppressed data is used as an estimate of the true background scene data and wherein the step of reconstructing the background Ir(X) further comprises:(a) blurring the estimate of the true background scene data;(b) dividing on a pixel by pixel basis the noisy scene data (D3, D4) by the blurred estimate of the true background scene data to create a new array (T3, T4);(c) correlating said new array with the complete method of sieves and optical system point spread functions and multiplying the result on a pixel by pixel basis with the current estimate of the true background scene data to provide a new estimate of said true background scene Z(x) ; and(d) taking the new estimate of the true background scene to be the reconstructed background scene Ir(x).
- The method according to claim 6, further comprising the step of determining whether a threshold number of iterations has been met and repeating the steps of claim 6 until said threshold is achieved.
- The method according to claim 6, wherein the noise suppressed values D3 and D4 are used as the first estimate of the true background scene.
- The method according to claim 6, wherein the step of correlating the new array to obtain a new estimate of the true background scene further comprises using said new point spread functions, h3T and h4T, where
- The method according to claim 2, wherein the step of eliminating the background data further comprises:(a) separating out a first estimate, D0(x), of reconstructed object data from the filtered D1 data;(b) replacing reconstructed background scene pixels by estimate reconstructed object pixels at predetermined object positions to obtain an image indicative of the reconstructed background and estimated reconstructed object (S(x));(c) blurring the combination of the reconstructed background and estimated reconstructed object to obtain a blurred image Is(x);(d) dividing on a pixel basis the filtered D1 scene data by the blurred combination of the reconstructed background and estimated reconstructed object data to obtain a new array of image data N(x);(e) correlating said new array N(x) with the optical system point spread function and multiplying for each pixel specified by the current estimate of the reconstructed object to provide a new estimate of said reconstructed object;(f) taking the new estimate of the reconstructed object to be the reconstructed image of the object having increased spatial resolution.
- The method according to claim 10, further comprising the step of determining whether a threshold number of iterations has been met and repeating steps b-f of claim 10 until said threshold is achieved.
- The method according to claim 10, wherein the step of separating out a first estimate of the reconstructed object from the filter data D1, further comprises using binmap values specifying the position in a scene of the object to be resolved in combination with the filtered data (Df(x)) to obtain Do(X), where
- The method according to claim 12, wherein the predetermined object positions for replacing the reconstructed background scene pixels by the estimated reconstructed object pixels S(x) are specified by the binmap values, where
- The method according to claim 13, wherein the step of blurring the combination of the reconstructed background and estimated reconstructed object data uses the optical system point spread function, where
- In an optical system having a detector means and processor means in which image data is obtained comprising noisy blurred scene data containing an object to be reconstructed, and noisy blurred background data of the same scene; a method for increasing the spatial resolution of the imaging data produced by the diffraction limited optical system, said method comprising the steps of:converting said imaging data into a matrix (gi,j);regularizing said matrix by performing nth order Tikhonov regularization to said matrix to provide a regularized pseudo-inverse (RPI) matrix; andapplying said RPI matrix to said matrix to provide a reconstructed image of said object.
- The method according to claim 15, wherein said RPI matrix is determined via a singular value decomposition (SVD) of the imaging matrix obtained from the point spread function.
- The method according to claim 15, wherein said RPI matrix is determined using QR decomposition of the imaging matrix.
- A method for substantially increasing the spatial resolution of imaging data produced by a diffraction limited optical system said method comprising the steps of:converting said imaging data into a first matrix g1, comprising background data and object of interest data, and a second matrix g2 comprising background data;subtracting the second matrix g2 from the first matrix g1 to obtain a third matrix g3 indicative of the difference between said first and second matrices,specifying a position and size of said object of interest in the third matrix g3;extracting a segment having coordinates which completely includes said blurred object from said third matrix g3;performing nth order Tikhonov regularization on each said extracted segment and said second matrix to restore said segment, adding said restored segments, and extracting an area of said added restored segment containing said object of interest to obtain the restored image data containing a restored object of interest.
- The method according to claim 18, wherein said first matrix comprises an image scene containing an object of interest and background data, and wherein said second matrix comprises said image scene containing only said background data.
- The method according to claim 18, further comprising the step of low pass filtering said first and second matrices to the system cutoff frequency.
- The method according to claim 19, wherein the step of extracting a segment having coordinates which completely includes said blurred object comprises extracting an area equal to the extent of the object of interest plus the diffracted energy associated with said object of interest.
- An optical system having a detector means and processor means in which image data is obtained comprising scene data containing an object to be reconstructed, and background data of the same scene, an improved apparatus for increasing the spatial resolution of the imaging data produced by the optical system, the improvement therewith comprising:means for obtaining a reconstructed background image, andmeans for low pass filtering the scene data containing the object to be reconstructed and using the reconstructed background image to eliminate the background data from the image data to obtain a reconstructed image of the object with increased spatial resolution.
- In an optical system having a detector means and processor means in which image data is obtained comprising noisy blurred scene data containing an object to be reconstructed (D1), and noisy blurred background data (D2) of the same scene, an improved apparatus for increasing the spatial resolution of the imaging data produced by the diffraction limited optical system, the improvement therewith comprising:means for filtering the noisy blurred background data (D2) of the same scene to obtain noise suppressed data:means for applying estimations of point spread functions associated with the noise suppressed data and optical system to the noise suppressed data to obtain a reconstructed background image (Ir(x)); andmeans for low pass filtering the noisy blurred scene data containing the object to be reconstructed and using the reconstructed background image to eliminate the background data from the image data to obtain a reconstructed image of the object with increased spatial resolution.
- The apparatus of claim 23, wherein the means for filtering to remove noise from D2 comprises means for using the modified method of sieves to remove said noise, using the equations;
- The apparatus of claim 23, wherein the reconstructed background Ir(x) is obtained using a means for implementing the Richardson-Lucy reconstruction technique.
- The apparatus of claim 24, further comprising means constructing new point spread functions (h3T, h4T) to account for combined effect of the method of sieves two and three pixel wide point spread functions, and the optical system point spread functions.
- The apparatus of claim 26, wherein said means to obtain the reconstructed background Ir(x) further comprises:(a) means for blurring the estimate of the true background scene data;(b) means for dividing on a pixel by pixel basis the noisy scene data (D3, D4) by the blurred estimate of the true background scene data to create a new array (T3, T4);(c) means for correlating said new array with the complete method of sieves and optical system point spread functions and multiplying the result on a pixel by pixel basis with the current estimate of the true background scene data to provide a new estimate of said true background scene Z(x); and(d) means for taking the new estimate of the true background scene to be the reconstructed background scene Ir(x).
- The apparatus of claim 27, further comprising means for determining whether a threshold number of iterations has been met and repeating the steps of claim 27 until said threshold is achieved.
- The apparatus of claim 27, wherein the noise suppressed values D3 and D4 are used as the first estimate of the true background scene.
- The apparatus of claim 27, wherein the means for correlating the new array to obtain a new estimate of the true background scene further comprises means for using said new point spread functions , h3T and h4T, where
- The apparatus of claim 23, wherein the means for eliminating the background data further comprises:(a) means for separating out a first estimate, D0(x), of reconstructed object data from the filtered D1 data;(b) means for replacing reconstructed background scene pixels by estimate reconstructed object pixels at predetermined object positions to obtain an image indicative of the reconstructed background and estimated reconstructed object (S(x));(c) means for blurring the combination of the reconstructed background and estimated reconstructed object to obtain a blurred image Is(x);(d) means for dividing on a pixel basis the filtered D1 scene data by the blurred combination of the reconstructed background and estimated reconstructed object data to obtain a new array of image data N(x);(e) means for correlating said new array N(x) with the optical system point spread function and multiplying for each pixel specified by the current estimate of the reconstructed object to provide a new estimate of said reconstructed object;(f) means for taking the new estimate of the reconstructed object to be the reconstructed image of the object having increased spatial resolution.
- The apparatus of claim 31, further comprising means for determining whether a threshold number of iterations has been met and repeating steps b-f of claim 31 until said threshold is achieved.
- The apparatus of claim 32, wherein the means for separating out a first estimate of the reconstructed object from the filter data D1, further comprises means for using binmap values specifying the position in a scene of the object to be resolved in combination with the filtered data (Df(x)) to obtain Do(X), where
- The apparatus of claim 33, wherein the predetermined object positions for replacing the reconstructed background scene pixels by the estimated reconstructed object pixels S(x) are specified by the binmap values, where
- The apparatus of claim 34, wherein the means of blurring the combination of the reconstructed background and estimated reconstructed object data uses the optical system point spread function, where
- In an optical system having a detector means and processor means in which image data is obtained comprising noisy blurred scene data containing an object to be reconstructed, and noisy blurred background data of the same scene; an apparatus for increasing the spatial resolution of the imaging data produced by the diffraction limited optical system, comprising:means for converting said imaging data into a matrix (gi,j);means for regularizing said matrix by performing nth order Tikhonov regularization to said matrix to provide a regularized pseudo-inverse (RPI) matrix; andmeans for applying said RPI matrix to said matrix to provide a reconstructed image of said object.
- The apparatus of claim 36, wherein said RPI matrix is determined via a singular value decomposition (SVD) of the imaging matrix obtained from the point spread function.
- The apparatus of claim 36, wherein said RPI matrix is determined using QR decomposition of the imaging 20 matrix.
- An apparatus for substantially increasing the spatial resolution of imaging data produced by a diffraction limited optical system comprising:means for converting said imaging data into a first matrix g1, comprising background data and object of interest data, and a second matrix g2 comprising background data;means for subtracting the second matrix g2 from the first matrix g1 to obtain a third matrix g3 indicative of the difference between said first and second matrices,means for specifying a position and size of said object of interest in the third matrix g3;means for extracting a segment having coordinates which completely includes said blurred object from said third matrix g3; andmeans for performing nth order Tikhonov regularization on each said extracted segment and said second matrix to restore said segment, adding said restored segments, and extracting an area of said added restored segment containing said object of interest to obtain the restored image data containing a restored object of interest.
- The apparatus of claim 39, wherein said first matrix comprises an image scene containing an object of interest and background data, and wherein said second matrix comprises said image scene containing only said background data.
- The apparatus of claim 40, further comprising means for low pass filtering said first and second matrices to the system cutoff frequency.
- The apparatus of claim 40, wherein the means for extracting a segment having coordinates which completely includes said blurred object comprises means for extracting an area equal to the extent of the object of interest plus the diffracted energy associated with said object of interest.
- The method of claims 1, 2, 6 or 15 wherein the optical system is on a satellite which is controlled from the earth.
- The apparatus of claims 22, 23, 27 or 36 wherein the optical system is on a satellite, further comprising means, located on the earth, for controlling the satellite.
Applications Claiming Priority (2)
| Application Number | Priority Date | Filing Date | Title |
|---|---|---|---|
| US81842 | 1979-10-04 | ||
| US09/081,842 US6295392B1 (en) | 1998-05-20 | 1998-05-20 | Super resolution methods for electro-optical systems |
Publications (4)
| Publication Number | Publication Date |
|---|---|
| EP0959433A2 true EP0959433A2 (en) | 1999-11-24 |
| EP0959433A3 EP0959433A3 (en) | 2003-04-23 |
| EP0959433B1 EP0959433B1 (en) | 2013-02-13 |
| EP0959433B9 EP0959433B9 (en) | 2013-04-17 |
Family
ID=22166748
Family Applications (1)
| Application Number | Title | Priority Date | Filing Date |
|---|---|---|---|
| EP99109872.4A Expired - Lifetime EP0959433B9 (en) | 1998-05-20 | 1999-05-19 | Super resolution apparatus and methods for electro-optical systems |
Country Status (2)
| Country | Link |
|---|---|
| US (2) | US6295392B1 (en) |
| EP (1) | EP0959433B9 (en) |
Cited By (3)
| Publication number | Priority date | Publication date | Assignee | Title |
|---|---|---|---|---|
| WO2002054394A2 (en) * | 2000-12-28 | 2002-07-11 | Darren Kraemer | Superresolution in periodic data storage media |
| ES2291129A1 (en) * | 2006-08-03 | 2008-02-16 | Consejo Superior De Investigaciones Cientificas | Rivet manufactured for non-metallic materials |
| WO2022057837A1 (en) * | 2020-09-16 | 2022-03-24 | 广州虎牙科技有限公司 | Image processing method and apparatus, portrait super-resolution reconstruction method and apparatus, and portrait super-resolution reconstruction model training method and apparatus, electronic device, and storage medium |
Families Citing this family (31)
| Publication number | Priority date | Publication date | Assignee | Title |
|---|---|---|---|---|
| US6295392B1 (en) * | 1998-05-20 | 2001-09-25 | Itt Manufacturing Enterprises, Inc. | Super resolution methods for electro-optical systems |
| JP2000207549A (en) * | 1999-01-11 | 2000-07-28 | Olympus Optical Co Ltd | Image processor |
| US6448545B1 (en) * | 2000-01-18 | 2002-09-10 | Syncrotronics Corp. | Precision endoscopic imaging system |
| US6448788B1 (en) * | 1999-05-26 | 2002-09-10 | Microwave Imaging System Technologies, Inc. | Fixed array microwave imaging apparatus and method |
| US6741739B1 (en) * | 2000-05-03 | 2004-05-25 | Itt Manufacturing Enterprises | Method and apparatus for improving signal to noise ratio using wavelet decomposition and frequency thresholding |
| US7164105B2 (en) * | 2002-04-05 | 2007-01-16 | Microwave Imaging Systems Technologies, Inc. | Non-invasive microwave analysis systems |
| US20040077943A1 (en) * | 2002-04-05 | 2004-04-22 | Meaney Paul M. | Systems and methods for 3-D data acquisition for microwave imaging |
| KR100549339B1 (en) * | 2002-10-31 | 2006-02-02 | 한국전력공사 | Determination of Shape Annealing Method Matrix by Contrainted Regularization Method in Nuclear Power Plants |
| US7162100B1 (en) * | 2002-12-11 | 2007-01-09 | Itt Manufacturing Enterprises Inc. | Methods for image enhancement |
| US8363704B1 (en) | 2003-07-24 | 2013-01-29 | Rayburn David C | Method of transmitting information using a bandwidth limited communications channel |
| US20060013332A1 (en) * | 2004-07-16 | 2006-01-19 | Rayburn David C | Method of sending information using superresolution to didtinguish overlapping symbols |
| US8532338B2 (en) * | 2004-07-06 | 2013-09-10 | Hewlett-Packard Development Company, L.P. | System and method for compensating for motion blur in optical navigation |
| US7532772B2 (en) * | 2004-07-20 | 2009-05-12 | Duke University | Coding for compressive imaging |
| US7602997B2 (en) * | 2005-01-19 | 2009-10-13 | The United States Of America As Represented By The Secretary Of The Army | Method of super-resolving images |
| US7856154B2 (en) * | 2005-01-19 | 2010-12-21 | The United States Of America As Represented By The Secretary Of The Army | System and method of super-resolution imaging from a sequence of translated and rotated low-resolution images |
| US8577184B2 (en) * | 2005-01-19 | 2013-11-05 | The United States Of America As Represented By The Secretary Of The Army | System and method for super-resolution imaging from a sequence of color filter array (CFA) low-resolution images |
| US8666196B2 (en) * | 2005-01-19 | 2014-03-04 | The United States Of America As Represented By The Secretary Of The Army | System and method for super-resolution imaging from a sequence of color filter array (CFA) low-resolution images |
| ES2272192B1 (en) | 2005-10-14 | 2008-03-16 | Consejo Superior Invet. Cientificas | METHOD OF BLIND DECONVOLUTION AND SUPERRESOLUTION FOR SEQUENCES AND SETS OF IMAGES, AND THEIR APPLICATIONS. |
| US8755866B2 (en) * | 2006-05-03 | 2014-06-17 | Covidien Lp | Method and apparatus for lymph node mapping |
| US20080144001A1 (en) * | 2006-12-15 | 2008-06-19 | Bauke Heeg | Spectral imaging device |
| US7755121B2 (en) * | 2007-08-23 | 2010-07-13 | Aptina Imaging Corp. | Imagers, apparatuses and systems utilizing pixels with improved optical resolution and methods of operating the same |
| DE102008042356A1 (en) | 2008-09-25 | 2010-04-08 | Carl Zeiss Smt Ag | Projection exposure system with optimized adjustment option |
| US8928763B2 (en) | 2008-12-09 | 2015-01-06 | Abbyy Development Llc | Detecting and correcting blur and defocusing |
| RU2653461C2 (en) | 2014-01-21 | 2018-05-08 | Общество с ограниченной ответственностью "Аби Девелопмент" | Glare detection in the image data frame |
| US8098303B2 (en) * | 2008-12-09 | 2012-01-17 | Abbyy Software Ltd. | Method and system for restoring a motion-blurred image |
| US8379119B2 (en) * | 2008-12-09 | 2013-02-19 | Abbyy Software Ltd. | Device and system for restoring a motion-blurred image |
| US9124762B2 (en) * | 2012-12-20 | 2015-09-01 | Microsoft Technology Licensing, Llc | Privacy camera |
| US9154698B2 (en) * | 2013-06-19 | 2015-10-06 | Qualcomm Technologies, Inc. | System and method for single-frame based super resolution interpolation for digital cameras |
| CN105869190A (en) * | 2015-01-22 | 2016-08-17 | 富士通株式会社 | Background image reconstruction method, device and monitoring device |
| CN106572314B (en) * | 2015-10-09 | 2019-05-31 | 富士通株式会社 | Reconstructing device, method and the monitoring device of background image |
| CN113298700B (en) * | 2021-05-31 | 2023-09-05 | 清华大学深圳国际研究生院 | High-resolution image reconstruction method in scattering scene |
Family Cites Families (9)
| Publication number | Priority date | Publication date | Assignee | Title |
|---|---|---|---|---|
| US4532548A (en) * | 1983-01-27 | 1985-07-30 | Hughes Aircraft Company | Resolution enhancement and zoom |
| US5168161A (en) * | 1990-04-18 | 1992-12-01 | Texas Instruments Incorporated | System and method of determining surface characteristics using infrared imaging |
| US5414782A (en) * | 1992-12-16 | 1995-05-09 | The United States Of Amercia As Represented By The Secretary Of Commerce | Procedure for digital image restoration |
| US5572608A (en) * | 1994-08-24 | 1996-11-05 | International Business Machines Corporation | Sinc filter in linear lumen space for scanner |
| US5974159A (en) * | 1996-03-29 | 1999-10-26 | Sarnoff Corporation | Method and apparatus for assessing the visibility of differences between two image sequences |
| US6047090A (en) * | 1996-07-31 | 2000-04-04 | U.S. Philips Corporation | Method and device for automatic segmentation of a digital image using a plurality of morphological opening operation |
| CA2212776A1 (en) * | 1997-08-08 | 1999-02-08 | Andrzej Barwicz | A spectrometric micro-sensor/transducer and procedure for interpretation of spectrometric data |
| FR2778838A1 (en) * | 1998-05-19 | 1999-11-26 | Koninkl Philips Electronics Nv | METHOD FOR DETECTING VARIATIONS IN ELASTICITY AND ECHOGRAPHIC APPARATUS FOR CARRYING OUT THIS METHOD |
| US6295392B1 (en) * | 1998-05-20 | 2001-09-25 | Itt Manufacturing Enterprises, Inc. | Super resolution methods for electro-optical systems |
-
1998
- 1998-05-20 US US09/081,842 patent/US6295392B1/en not_active Expired - Fee Related
-
1999
- 1999-05-19 EP EP99109872.4A patent/EP0959433B9/en not_active Expired - Lifetime
-
2001
- 2001-05-16 US US09/855,557 patent/US6483952B2/en not_active Expired - Fee Related
Non-Patent Citations (4)
| Title |
|---|
| A.G. AL-BAKKAR ET AL.: "A PARALLEL IMPLEMENTATION OF A MODIFIED RICHARDSON LUCY ALGORITHM FOR IMAGE DE-BLURRINGS", INTERNATIONAL JOURNAL OF INFRARED AND MILLIMETER WAVES, vol. 18, no. 3, 1 March 1997 (1997-03-01), pages 555 - 575 |
| J.B. ABBISS ET AL.: "ADVANCED SIGNAL PROCESSING ALGORITHMS, ARCHITECTURES AND IMPLEMENTATIONS", THE INTERNATIONAL SOCIETY FOR OPTICAL ENGINEERING, vol. 1566, 1991, pages 363 |
| J.B. ABBISS ET AL.: "SUPER RESOLUTION ALGORITHMS FOR A MODIFIED HOPFIELD NEURAL NETWORK", IEEE TRANSACTIONS ON SIGNAL PROCESSING, vol. 39, no. 7, July 1991 (1991-07-01) |
| S.M.T. MATTHEWS; A.H. LETTINGTON: "NON-LINEAR TECHNIQUES FOR IMAGE RESTORATION", INTERNATIONAL SYMPOSIUM ON SIGNAL PROCESSING AND ITS APPLICATIONS, 1996, pages 443 - 446 |
Cited By (6)
| Publication number | Priority date | Publication date | Assignee | Title |
|---|---|---|---|---|
| WO2002054394A2 (en) * | 2000-12-28 | 2002-07-11 | Darren Kraemer | Superresolution in periodic data storage media |
| WO2002054394A3 (en) * | 2000-12-28 | 2002-11-21 | Darren Kraemer | Superresolution in periodic data storage media |
| US6947363B2 (en) | 2000-12-28 | 2005-09-20 | R. J. Dwayne Miller | Superresolution in periodic data storage media |
| ES2291129A1 (en) * | 2006-08-03 | 2008-02-16 | Consejo Superior De Investigaciones Cientificas | Rivet manufactured for non-metallic materials |
| WO2008020109A1 (en) * | 2006-08-03 | 2008-02-21 | Consejo Superior De Investigaciones Científicas | Method for restoration of images which are affected by imperfections, device for implementation of this, and the corresponding applications |
| WO2022057837A1 (en) * | 2020-09-16 | 2022-03-24 | 广州虎牙科技有限公司 | Image processing method and apparatus, portrait super-resolution reconstruction method and apparatus, and portrait super-resolution reconstruction model training method and apparatus, electronic device, and storage medium |
Also Published As
| Publication number | Publication date |
|---|---|
| EP0959433A3 (en) | 2003-04-23 |
| US6295392B1 (en) | 2001-09-25 |
| EP0959433B1 (en) | 2013-02-13 |
| US6483952B2 (en) | 2002-11-19 |
| US20010024534A1 (en) | 2001-09-27 |
| EP0959433B9 (en) | 2013-04-17 |
Similar Documents
| Publication | Publication Date | Title |
|---|---|---|
| US6295392B1 (en) | Super resolution methods for electro-optical systems | |
| US6240219B1 (en) | Apparatus and method for providing optical sensors with super resolution | |
| Biemond et al. | Iterative methods for image deblurring | |
| Moik | Digital processing of remotely sensed images | |
| DeWeert et al. | Lensless coded-aperture imaging with separable Doubly-Toeplitz masks | |
| Von der Lühe | Speckle imaging of solar small scale structure. I-Methods | |
| Brandt et al. | Data reduction pipeline for the CHARIS integral-field spectrograph I: detector readout calibration and data cube extraction | |
| US20140198236A1 (en) | Generating Modulation Patterns for the Acquisition of Multiscale Information in Received Signals | |
| Ma et al. | Extensions of compressed imaging: flying sensor, coded mask, and fast decoding | |
| Zeng et al. | Robust reconstruction with deep learning to handle model mismatch in lensless imaging | |
| Adorf | Hubble space telescope image restoration in its fourth year | |
| Oktem et al. | High-resolution computational spectral imaging with photon sieves | |
| EP2324456A1 (en) | Processing for coded aperture imaging | |
| Berdeu et al. | PIC: a data reduction algorithm for integral field spectrographs-Application to the SPHERE instrument | |
| Galbraith et al. | Resolution enhancement of multilook imagery for the multispectral thermal imager | |
| González et al. | Non-parametric PSF estimation from celestial transit solar images using blind deconvolution | |
| Cannon et al. | Image processing by computer | |
| Molnar et al. | Spectral deconvolution with deep learning: removing the effects of spectral PSF broadening | |
| Hadj-Youcef et al. | Restoration from multispectral blurred data with non-stationary instrument response | |
| Seldin et al. | Space object identification using phase-diverse speckle | |
| Vollmerhausen et al. | Extending the range performance of diffraction limited imagers | |
| Khetkeeree et al. | Satellite image restoration using adaptive high boost filter based on in-flight point spread function | |
| Malik et al. | Computational imaging with an extended field of view | |
| EP1096295A1 (en) | Apparatus and method for providing optical sensors with improved resolution | |
| Stayman et al. | An analysis of coded aperture acquisition and reconstruction using multi-frame code sequences for relaxed optical design constraints |
Legal Events
| Date | Code | Title | Description |
|---|---|---|---|
| PUAI | Public reference made under article 153(3) epc to a published international application that has entered the european phase |
Free format text: ORIGINAL CODE: 0009012 |
|
| AK | Designated contracting states |
Kind code of ref document: A2 Designated state(s): AT BE CH CY DE DK ES FI FR GB GR IE IT LI LU MC NL PT SE |
|
| AX | Request for extension of the european patent |
Free format text: AL;LT;LV;MK;RO;SI |
|
| PUAL | Search report despatched |
Free format text: ORIGINAL CODE: 0009013 |
|
| AK | Designated contracting states |
Designated state(s): AT BE CH CY DE DK ES FI FR GB GR IE IT LI LU MC NL PT SE |
|
| AX | Request for extension of the european patent |
Extension state: AL LT LV MK RO SI |
|
| 17P | Request for examination filed |
Effective date: 20031023 |
|
| AKX | Designation fees paid |
Designated state(s): DE FR GB |
|
| 17Q | First examination report despatched |
Effective date: 20031229 |
|
| 17Q | First examination report despatched |
Effective date: 20031229 |
|
| RAP1 | Party data changed (applicant data changed or rights of an application transferred) |
Owner name: EXELIS INC. |
|
| REG | Reference to a national code |
Ref country code: DE Ref legal event code: R079 Ref document number: 69944613 Country of ref document: DE Free format text: PREVIOUS MAIN CLASS: G06T0015000000 Ipc: G06T0005000000 |
|
| GRAP | Despatch of communication of intention to grant a patent |
Free format text: ORIGINAL CODE: EPIDOSNIGR1 |
|
| RIC1 | Information provided on ipc code assigned before grant |
Ipc: G06T 5/00 20060101AFI20120814BHEP |
|
| GRAS | Grant fee paid |
Free format text: ORIGINAL CODE: EPIDOSNIGR3 |
|
| GRAA | (expected) grant |
Free format text: ORIGINAL CODE: 0009210 |
|
| AK | Designated contracting states |
Kind code of ref document: B1 Designated state(s): DE FR GB |
|
| REG | Reference to a national code |
Ref country code: GB Ref legal event code: FG4D |
|
| REG | Reference to a national code |
Ref country code: DE Ref legal event code: R096 Ref document number: 69944613 Country of ref document: DE Effective date: 20130411 |
|
| PLBE | No opposition filed within time limit |
Free format text: ORIGINAL CODE: 0009261 |
|
| STAA | Information on the status of an ep patent application or granted ep patent |
Free format text: STATUS: NO OPPOSITION FILED WITHIN TIME LIMIT |
|
| 26N | No opposition filed |
Effective date: 20131114 |
|
| PG25 | Lapsed in a contracting state [announced via postgrant information from national office to epo] |
Ref country code: DE Free format text: LAPSE BECAUSE OF NON-PAYMENT OF DUE FEES Effective date: 20131203 |
|
| REG | Reference to a national code |
Ref country code: DE Ref legal event code: R097 Ref document number: 69944613 Country of ref document: DE Effective date: 20131114 |
|
| REG | Reference to a national code |
Ref country code: DE Ref legal event code: R119 Ref document number: 69944613 Country of ref document: DE Effective date: 20131203 |
|
| REG | Reference to a national code |
Ref country code: FR Ref legal event code: PLFP Year of fee payment: 17 |
|
| REG | Reference to a national code |
Ref country code: FR Ref legal event code: PLFP Year of fee payment: 18 |
|
| REG | Reference to a national code |
Ref country code: FR Ref legal event code: PLFP Year of fee payment: 19 |
|
| REG | Reference to a national code |
Ref country code: FR Ref legal event code: PLFP Year of fee payment: 20 |
|
| PGFP | Annual fee paid to national office [announced via postgrant information from national office to epo] |
Ref country code: FR Payment date: 20180525 Year of fee payment: 20 |
|
| PGFP | Annual fee paid to national office [announced via postgrant information from national office to epo] |
Ref country code: GB Payment date: 20180529 Year of fee payment: 20 |
|
| REG | Reference to a national code |
Ref country code: GB Ref legal event code: PE20 Expiry date: 20190518 |
|
| PG25 | Lapsed in a contracting state [announced via postgrant information from national office to epo] |
Ref country code: GB Free format text: LAPSE BECAUSE OF EXPIRATION OF PROTECTION Effective date: 20190518 |