EP0916102B1 - Herstellungsverfahren von reservoirbegrenzungsbilder - Google Patents
Herstellungsverfahren von reservoirbegrenzungsbilder Download PDFInfo
- Publication number
- EP0916102B1 EP0916102B1 EP97937136A EP97937136A EP0916102B1 EP 0916102 B1 EP0916102 B1 EP 0916102B1 EP 97937136 A EP97937136 A EP 97937136A EP 97937136 A EP97937136 A EP 97937136A EP 0916102 B1 EP0916102 B1 EP 0916102B1
- Authority
- EP
- European Patent Office
- Prior art keywords
- pressure
- time
- reservoir
- fluid
- boundary
- Prior art date
- Legal status (The legal status is an assumption and is not a legal conclusion. Google has not performed a legal analysis and makes no representation as to the accuracy of the status listed.)
- Expired - Lifetime
Links
- 238000004519 manufacturing process Methods 0.000 title description 8
- 239000012530 fluid Substances 0.000 claims abstract description 103
- 230000035939 shock Effects 0.000 claims abstract description 76
- 238000000034 method Methods 0.000 claims abstract description 64
- 230000000977 initiatory effect Effects 0.000 claims abstract description 32
- 230000008859 change Effects 0.000 claims abstract description 29
- 230000015572 biosynthetic process Effects 0.000 claims description 28
- 238000002347 injection Methods 0.000 claims description 5
- 239000007924 injection Substances 0.000 claims description 5
- 230000003247 decreasing effect Effects 0.000 claims description 3
- 230000000149 penetrating effect Effects 0.000 claims 3
- 238000005259 measurement Methods 0.000 abstract description 5
- 238000004088 simulation Methods 0.000 abstract description 5
- 230000006870 function Effects 0.000 description 42
- 238000012360 testing method Methods 0.000 description 26
- 238000005755 formation reaction Methods 0.000 description 25
- 239000011148 porous material Substances 0.000 description 24
- 238000009792 diffusion process Methods 0.000 description 19
- 230000000875 corresponding effect Effects 0.000 description 14
- 238000010586 diagram Methods 0.000 description 14
- 238000006073 displacement reaction Methods 0.000 description 14
- XLYOFNOQVPJJNP-UHFFFAOYSA-N water Substances O XLYOFNOQVPJJNP-UHFFFAOYSA-N 0.000 description 14
- 239000012528 membrane Substances 0.000 description 13
- 230000000694 effects Effects 0.000 description 11
- 230000001965 increasing effect Effects 0.000 description 9
- 230000033001 locomotion Effects 0.000 description 9
- 230000008569 process Effects 0.000 description 9
- 238000009826 distribution Methods 0.000 description 7
- 239000000463 material Substances 0.000 description 7
- 230000035699 permeability Effects 0.000 description 7
- 238000004364 calculation method Methods 0.000 description 6
- 238000010276 construction Methods 0.000 description 6
- 238000009795 derivation Methods 0.000 description 5
- 239000000243 solution Substances 0.000 description 5
- 238000004458 analytical method Methods 0.000 description 4
- 230000008878 coupling Effects 0.000 description 4
- 238000010168 coupling process Methods 0.000 description 4
- 238000005859 coupling reaction Methods 0.000 description 4
- 238000010348 incorporation Methods 0.000 description 4
- 230000001939 inductive effect Effects 0.000 description 4
- 230000001105 regulatory effect Effects 0.000 description 4
- 230000007480 spreading Effects 0.000 description 4
- 238000003892 spreading Methods 0.000 description 4
- 230000003068 static effect Effects 0.000 description 4
- 238000012795 verification Methods 0.000 description 4
- 238000003384 imaging method Methods 0.000 description 3
- 230000003116 impacting effect Effects 0.000 description 3
- 230000010354 integration Effects 0.000 description 3
- 230000000670 limiting effect Effects 0.000 description 3
- 238000012886 linear function Methods 0.000 description 3
- 230000007246 mechanism Effects 0.000 description 3
- 230000002085 persistent effect Effects 0.000 description 3
- 238000007789 sealing Methods 0.000 description 3
- 238000003860 storage Methods 0.000 description 3
- 230000001052 transient effect Effects 0.000 description 3
- 230000007704 transition Effects 0.000 description 3
- 230000005540 biological transmission Effects 0.000 description 2
- 210000004027 cell Anatomy 0.000 description 2
- 238000004891 communication Methods 0.000 description 2
- 239000002131 composite material Substances 0.000 description 2
- 230000007547 defect Effects 0.000 description 2
- 230000001419 dependent effect Effects 0.000 description 2
- 230000004907 flux Effects 0.000 description 2
- 238000012423 maintenance Methods 0.000 description 2
- 230000004048 modification Effects 0.000 description 2
- 238000012986 modification Methods 0.000 description 2
- 238000000275 quality assurance Methods 0.000 description 2
- 238000002310 reflectometry Methods 0.000 description 2
- 238000009825 accumulation Methods 0.000 description 1
- 230000003321 amplification Effects 0.000 description 1
- 238000013459 approach Methods 0.000 description 1
- 230000006399 behavior Effects 0.000 description 1
- 230000008901 benefit Effects 0.000 description 1
- 238000009530 blood pressure measurement Methods 0.000 description 1
- 210000001601 blood-air barrier Anatomy 0.000 description 1
- 239000002775 capsule Substances 0.000 description 1
- 239000004020 conductor Substances 0.000 description 1
- 230000001276 controlling effect Effects 0.000 description 1
- 230000002596 correlated effect Effects 0.000 description 1
- 238000013461 design Methods 0.000 description 1
- 238000011161 development Methods 0.000 description 1
- 230000018109 developmental process Effects 0.000 description 1
- 230000002500 effect on skin Effects 0.000 description 1
- 238000004146 energy storage Methods 0.000 description 1
- 238000011067 equilibration Methods 0.000 description 1
- 230000007717 exclusion Effects 0.000 description 1
- 239000000446 fuel Substances 0.000 description 1
- 238000009499 grossing Methods 0.000 description 1
- 230000004941 influx Effects 0.000 description 1
- 230000007774 longterm Effects 0.000 description 1
- 238000013178 mathematical model Methods 0.000 description 1
- 230000003278 mimic effect Effects 0.000 description 1
- 238000003199 nucleic acid amplification method Methods 0.000 description 1
- 230000010355 oscillation Effects 0.000 description 1
- 239000002245 particle Substances 0.000 description 1
- 230000000737 periodic effect Effects 0.000 description 1
- 238000005293 physical law Methods 0.000 description 1
- 210000003429 pore cell Anatomy 0.000 description 1
- 238000012545 processing Methods 0.000 description 1
- 230000000644 propagated effect Effects 0.000 description 1
- 238000011084 recovery Methods 0.000 description 1
- 230000009467 reduction Effects 0.000 description 1
- 230000002829 reductive effect Effects 0.000 description 1
- 230000008929 regeneration Effects 0.000 description 1
- 238000011069 regeneration method Methods 0.000 description 1
- 230000004044 response Effects 0.000 description 1
- 230000002441 reversible effect Effects 0.000 description 1
- 150000003839 salts Chemical class 0.000 description 1
- 238000000926 separation method Methods 0.000 description 1
- 239000007787 solid Substances 0.000 description 1
- 230000009897 systematic effect Effects 0.000 description 1
- 238000009827 uniform distribution Methods 0.000 description 1
Images


Classifications
-
- G—PHYSICS
- G01—MEASURING; TESTING
- G01V—GEOPHYSICS; GRAVITATIONAL MEASUREMENTS; DETECTING MASSES OR OBJECTS; TAGS
- G01V1/00—Seismology; Seismic or acoustic prospecting or detecting
- G01V1/40—Seismology; Seismic or acoustic prospecting or detecting specially adapted for well-logging
- G01V1/44—Seismology; Seismic or acoustic prospecting or detecting specially adapted for well-logging using generators and receivers in the same well
-
- G—PHYSICS
- G01—MEASURING; TESTING
- G01V—GEOPHYSICS; GRAVITATIONAL MEASUREMENTS; DETECTING MASSES OR OBJECTS; TAGS
- G01V9/00—Prospecting or detecting by methods not provided for in groups G01V1/00 - G01V8/00
Definitions
- the invention relates to a method for identifying and producing dimensionally accurate images of the boundary limits of geologic reservoirs from transient pressure data obtained in a well producing from the geological reservoir, and more particularly where the method is based on concepts of fluid inertia and static capillary pressure which control the distribution of energy in the reservon.
- test is the "shut in” or "buildup” test and is the reverse of the flow test the reservoir is allowed to flow for an extended period of time until the pressure stabilizes and then the flow is shut off while the pressure is monitored
- injection test is another kind of test in which a borehole fluid is injected into the formation, the injection of fluid is stopped, and the pressure monitored
- Variations on the "flow test” and the "shut in” test include observations at a plurality of wells in a reservoir In such multiple well observations, for example, one well might be opened up in a flow test while the pressure in a second, shut in, well is monitored. A another example of multiple well observations, one well might be shut in while the pressure in a second, flowing well, is monitored These are called interference tests.
- the invention is directed to a method for deriving discrete boundary limits of a geologic reservoir from measurements of transient well pressure obtained in a vertical, near vertical, or horizontal well bore of a well which is completed to produce from the reservoir at a constant flow rate and wherein an initiating capillary rupture shock wave is generated upon the initiation of well flow and expands radially outwardly from the well bore
- the method requires continuously sensing fluid pressure in the well over a period of time which includes the time of initiation of well flow and recording the pressure data in a plot of well pressure versus time
- the method includes the further steps of determining the minimum radial distance from the well bore to each discrete section of reservoir boundary limit indicated by each abrupt change of slope in the pressure vs.
- each discrete boundary limit is then adjusted about the origin of the polar coordinate chart and then re-positioned on its tangent circle defined by its associated distance radial to the point of contact in relationship with the other discrete boundary limits to thereby provide a symmetric energy equivalent simulation of the reservoir boundary.
- the map then generated may be compared to a geologist map for verification or amendment of the geologist's map.
- the method of the present invention is utilized for producing images of reservoir boundary limits and is based upon concepts of fluid inertia and static or initiating capillary pressure which control the distribution of energy in the reservoir
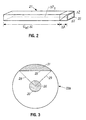
- the method requires that a well bore 1 be drilled through earth formations 2 into the reservoir 3 as shown in FIG 1 and geologic fluids be produced from the reservoir into the well at a constant flow rate controlled by a well choke 4 .
- Reservoir fluids are produced through perforations 5 in the well liner 6 and directed through a tail pipe 8 on a production packer 9 to a string of tubing 10 for travel to the earth's surface.
- a side pocket mandrel 11 which is constructed and arranged to internally receive a retrievable side pocket well tool such as a pressure gauge 12 .
- the pressure gauge 12 installed in the side pocket mandrel 11 may be any one of several commercially available pressure gauges which provide an electrical read-out signal.
- the pressure readings can be continuous or periodic, such as every 10 seconds although much larger periods might be acceptable if the reservoir is very large.
- One such gauge includes an inductive coupling member positioned relative to an inductive coupling member in the side pocket mandrel 11 so as to passively transmit pressure data from the pressure gauge to the inductive coupling member in the side pocket mandrel
- the inductive coupling member in the side pocket mandrel is electrically connected to a conductor cable 15 in an external conduit which extends to the surface 16 of the earth and a recorder 17 for a surface read out and recording of the downhole data on a real time basis
- Fluid pressure of the flowing fluids is sensed in the well continuously over a period of time and in a time frame which includes the time of initiation of flow from the well
- the sensed pressure data are recorded with respect to time so that they may be continuously plotted
- the period of time is extended until the pressure measurements assume a constant linear relationship with respect to time
- a pressure gauge for sensing fluid pressure in the well be placed in the portion of the well bore which is located in the reservoir, other devices and methods which provide a representative bottom hole pressure might be employed, including methods for producing flowing tubing pressure data which may be corrected or uncorrected
- the theory from which the imaging method of the invention has evolved utilizes the concept of a moving capillary pressure shock wave created by the initiation of well flow from the reservoir and the concept that capillary shock waves regulate fluid flow in the geologic reservoir
- the porosity of the geologic formations of the reservoir is a controlling, though not exclusive, factor in the rate of flow of geologic fluids from the reservoir
- the reservoir formations are comprised of numerous interconnecting pores and it is a premise of the theory that before a fluid can begin to move from one pore to another, it must initially break a very weak electronic membrane that exists at the pore throat then later adjust that membrane for any subsequent abrupt changes in flow Then the fluid must flow away from the rupture plane in order for the next pore throat membrane to fail This flow of fluid is dependent on the ability of the capillary to carry the fluid toward the producing well This process produces an expanding moving boundary as a wave front between the active fluid filled reservoir
- the magnitude of the static rupture at each pore throat need not be large for it to have a regulating effect upon the flow of fluid in the reservoir
- the process is a series of tiny pulses composed of alternating rupture flow rupture flow rupture and so on until no more rupturable pores can be added to the line
- the rupture or adjustment pressure differential, that is initiating capillary pressure, need only be non-zero
- the present theory applies the concept of the bubble and the physical laws pertaining thereto to fluid-filled porous media, such as the geologic reservoir which comprises a collection of many bubbles, water-filled bubbles or droplets, film-wetted surfaces, electronic membranes across porosity channels, wetted particles, and fixed electronic bonding sites on the surface of the formations
- fluid-filled porous media such as the geologic reservoir which comprises a collection of many bubbles, water-filled bubbles or droplets, film-wetted surfaces, electronic membranes across porosity channels, wetted particles, and fixed electronic bonding sites on the surface of the formations
- the equations of motion relevant to the "Bubble Theory" are based upon a model of a radially growing region of flowing fluid around the well bore during an infinite acting period
- the electronic membranes along the radial stream lines do not rupture because no differential pressure exits to rupture them
- the membranes do not need to have much strength as they are coincident with the streamlines
- the active fluid behind the rupture front responds to a dynamic equation of motion that is dominated by the diffusion terms
- the inertial terms are useful for assessing the characteristic velocity of transmission of small changes of pressure behind the wave through the open capillaries behind the wave front
- the pressure distribution behind the wave front rapidly redistributes itself to maintain a uniform rate of pressure depletion in accordance with the second law of thermodynamics, that is, the bounded system tends toward a constant rate pressure drop at any given point of time throughout the region bounded by two succeeding shock waves
- the movement ofthe wave front and velocity of the rupture wave is derived by using a simple perturbation technique initiated by a single defect in undisturbed reservoir space
- the defect can be described as a single differential moving element that opens a capillary or bundle of capillaries through the reservoir
- This capillary is a string of pore spaces wherein each pore throat normal to fluid flow is opened by sequentially rupturing the successive pore throats that exist along the direction of the pressure gradient Those pore throat electronic membranes that exist along the sides of the capillary, parallel to the imposed radial stream lines, remain intact
- the small differential block 21 of dimensions ⁇ X by ⁇ Y by ⁇ Z, represents a traveling rupture volume ⁇ V at the head of the growing capillary or bundle of capillaries It functions as a moving steady state shock wave that must pass the rupture volume flow of fluid into the capillary, the head of which is at wavefront 22 of the shock wave
- ⁇ P c static capillary rupture pressure
- the weakest membrane is both a function of its inherent strength to sustain a differential pressure and the differential pressure imposed.
- Capillaries growing in parallel or bundles of capillaries in the form of elements will deplete the pressure equally across membranes that exist between them. This keeps the membranes intact between capillaries along the flow paths or streamlines. Thus, the formation will always have unbroken membranes along the flow paths through the formation.
- the regulating mechanism for the growth of the active region or cone of influence about the well bore upon initiation of flow is the depletion of pressure in a small elemental space to develop a pressure difference equivalent to initiating capillary pressure or that pressure necessary to rupture the bubble at the pore throat.
- the depletion of this leading or shock wave element is controlled by its ability to transport fluid through it and into the active portion of the reservoir This element will proceed in the direction of the weakest port throat or parallel to adjacent pore throats
- the element is a creature of mass incorporation The entire mass of fluid that flows through the leading element must continue to deplete in order for the element to rupture succeeding pore throats and to advance.
- the element acts as a depletion volume that is added to the system while the integral of fluid that has passed through it is the system volume. Fluid is carried through the element as a steady process based upon Darcy's Law, which law represents the steady resistance to flow through the element. In this case, the element moves through the formation incorporating active volume into the active mass of reservoir fluid.
- the moving element incorporates mass as a function of its depletion by the initiating capillary pressure, ⁇ P c .
- This depletion is controlled by a gradient ⁇ P c / ⁇ X developed within the element by Darcy's Law. It is therefore possible to write a material balance for mass flow through the element that will describe the volume in terms of the velocity of the element which at this point is unknown
- the mass that passes through the cell in a given unit of time can also be described as ⁇ ⁇ ⁇ ⁇ ⁇ Y ⁇ Z ⁇ q , where ⁇ Z is displacement with respect to the Z-axis, ⁇ is formation porosity, ⁇ is the fluid density, and U wf is the velocity of the capillary wavefront
- the mass depletes in pressure by the initiating capillary pressure, ⁇ P c
- ⁇ is the permeability
- ⁇ P c the initiating capillary pressure
- ⁇ fluid viscosity
- U bulk is an equivalent for mass flow through the element.
- the concept of a moving element material balance is symbolized in the schematic of FIG.2.
- the individual capillaries that make up the element are going from pore to pore by breaking the weakest port throat that which has developed the greater differential pressure and is closest to rupture
- the capillary is indifferent to coordinate system
- the element which is moving along a bundle of capillaries responds to the mass that has been incorporated into its segment of the system, that is, the element responds to the incorporated mass between itself and the source of perturbation at the well bore
- the depicted capillary length used in the following derivation should be considered to be a line integral
- the velocity of the element at any time must be treated as a function of the mass incorporated into the active system and Darcy's Law
- the velocity of the element may be referenced to time or time referenced to the velocity of the element Membranes aligned normal to lines of equal potential are infinitely strong
- the direction of flow will be along gradient lines.
- the distance traveled is a line integral
- the coordinate system is a function of the field boundary
- the element velocity is released to and regulated by Darcy's Law and the compressibility form of the energy equation
- the element operates at steady conditions and its velocity is proportional to the mass that has passed through it
- the element is sensitive to the depletion of the mass that it is incorporating such that the shock wave front changes velocity characteristics to match the material that is passing through it at any given instant in time For example in the event the wave passes from gas to water saturation, one would expect it to increase in velocity and behave as though the mass already incorporated was a water equivalent This will cause an apparent distortion in start time of the perturbation and in apparent distance of the wave front from the perturbation
- the increase in speed with phase change causes a differential wave velocity that presents some interesting problems at water contacts If two wave front elements are approaching a water contact or wedge, the first wave element to encounter the water will move ahead at a multiple of the speed of the element that continues to encounter gas.
- Equation (1) The volume of fluid liberated ⁇ V, is quantified by the definition of compressibility in Equation (1) This would be the equivalent of Charles Law as applied to fluids of small compressibility and is a fundamental relationship used in fluid mechanics It is to be recognized in the derivations presented herein that the material balance for flow through the element is referenced to the traveling element In this case, mass flow equivalent velocity through the element is chosen as the independent variable and the apparent time of travel is the dependent variable This references the velocity of the block to the flow that is allowed to pass as regulated by Darcy's Law This will allow separation of variables so that a relationship between velocity and apparent time or mass-based time may be fixed The resulting relationship may then be tied to an initiating point in time to produce the relationship for velocity as a function of time The shock wave front will go where it will based upon shape of the formation and fluid factors that govern hydraulic diffusivity The propagation of the element is then free of coordinate system constrictions as it becomes a line-mass integral Once the line is pinned to a location, then the location of the wave front
- the leading element is at steady state conditions and is indifferent to the point of origin.
- the initiating capillary pressure and Darcy's Law regulate its movement through reservoir space.
- Eq (1) mass throughput and time as expressed in Eq (1) This is much like taking a trip while riding backward wherein the scenery is the same but the perspective is different
- the element senses how much mass it has incorporated into the capillary, rather than where it is going In solid mechanics, this concept is called a material coordinate system
- the capillary wave propagation equation derived in the following paragraphs results from the identical cancellation of the cross-sectional area terms in the moving shock element
- the resultant equation for velocity and distance traveled by the perturbation are based entirely upon linear distance from the source and related hydraulic diffusivity and time
- the terms ⁇ X and ⁇ R for the other coordinate systems are interchangeable.
- Most problems in reservoir engineering are conveniently based upon cylindrical coordinates This relationship is important to understanding the wave front generation in a horizontal well
- the coordinate system to be selected is determined by the geometry of the perturbation and the boundary conditions
- a vertical well is represented by a line source between infinite parallel planes This is the equivalent of a segment of an infinite line source
- a horizontal well of finite length simulates a race track shape for a disturbance emanating therefrom
- the system becomes asymmetric -- resulting in a new internal system being formed that is symmetric
- an infinite plane source represents a linear system comprised of all parallel capillaries.
- Equation (18) the time from inception of a perturbation is noted as t.
- the integration of this relationship for distance traveled from the perturbation created by the initiating of well flow must be considered as an upper limit
- Equation (19) Although never reconciled to classic diffusion theory, provides an accurate relationship for the distance to the limit symbolized by d. which is interchangeable with the terms R and X in the foregoing equations In this case, d is the length of the capillary
- the active area of the reservoir must assume a shape in accordance with the laws of thermodynamics.
- the surface or wave front will minimize its surface area automatically In a reservoir that is confined between two sealing planes, the shape of the wave surface will be cylindrical In an infinite medium it will be spherical Infinitely thick reservoirs do not exist in nature
- a reservoir with a single perforation will mimic spherical behavior for a short time
- the wave front once it encounters the upper and lower boundaries of the reservoir will dispose itself so as to minimize its active surface area, that is, it will assume a perpendicular disposition to the upper and lower sealing boundary surfaces, becoming a minimum orthogonal geometric function between them This is the result of the second Law of Thermodynamics
- cylindrical active reservoir volume that is, the volume for a homogeneous reservoir of constant thickness h and encompassed by an expanding wave
- ACTIVE RESERVOIR VOLUME 4 ⁇ ⁇ ⁇ h ⁇ ⁇ t
- the expanding "bubble" wave is propagated with a constant amplitude or intensity ⁇ Pc and the velocity of the wave front is inversely proportional to the square of the distance from the perturbation at the well Also, the intensity of the capillary wave front remains constant at ⁇ Pc, inversely analogous to the phenomenon of light such that light diminishes in intensity inversely as the square of the distance from a point source while the velocity of light remains constant.
- the capillary wave encounters one reservoir limit at a time
- the existence of the limit is recognized at the well by information carried to the well bore by an inertial wave that functions to distribute energy between the wave front and the well bore along the capillary.
- the inertial terms in this relationship are small but provide a theoretical basis for the rapid movement of pressure information behind the capillary rupture wave front.
- the coefficient of the wave equation provides a basis for estimating pressure pulse transmission velocity behind the wave front.
- the necessary redistribution of mass is small and the distances it must be moved are small.
- the transient pressure redistribution occurs quickly to maintain P constant.
- the relatively small value for the dynamic coefficient is small when compared with the hydraulic diffusivity
- the inertia or momentum of the fluid in the capillary is exceedingly large. It is constructive to think of the fluid filled capillary as being a linear energy storage device
- the pressure distribution behind the capillary shock wave will respond rapidly to the advancing boundary by adjusting the flowing pressure gradient in the region between successive bubble shock waves.
- the pressure gradients in the vertical and transverse directions will be zero because of the absence of vertical and transverse flows Equation (23) below gives the characteristic velocity of the dynamic waves that move between the bounding capillary waves in the radial direction from the well
- ⁇ P / ⁇ t will tend toward uniformity across the active region bounded by the capillary shock waves and the well bore
- q is the flow rate from the well
- V is the active volume of the reservoir
- C t is the total system compressibility
- Equation (29) known as the productivity index equation where P is fluid pressure, shows that dP/dt will be constant over the active volume of the reservoir if volume and flow from the reservoir is constant for fluids of small compressibility. It can also be shown that Equation (29) is a result of Newton's Law for the conservation of momentum for a stable radial flow system, that is, radial flow across any circular boundary at any designated radius in the system with the flow rate into the well bore being directly proportional to the momentum of the zone of influence defined by the active flowing system
- the productivity index Equation (29) is a statement that energy in the bounded region is conserved, energy is distributed over the bounded region, and radial momentum is conserved
- d 2 ⁇ t
- ⁇ P/ ⁇ t q/(4 ⁇ C t h ⁇ t ⁇ )
- the significance of the M 1 slope is not apparent until one discovers that dP/d(Log t) is identically equal to 2 303 (t) dp/dt and the slope M 1 is proportional to power dissipation in the reservoir in the area immediately around the well bore
- the first derivative of pressure with respect to time tends rapidly toward uniformity in the region bounded by the primary wave
- the moving wave front boundary introduces a cross derivative between the fixed coordinate system and the coordinate system that travels with the primary wave resulting in a non-linear system of radial equations.
- a value of the M 1 slope which is constant indicates that a region of constant power dissipation is forming behind the primary wave
- the slow movement of the wave allows a condition of near semi steady energy state to exist behind it, that is, there is a substantially uniform decreasing gradation of reservoir pressure from the well to the wave front
- the term dP/dt then becomes a direct indicator of a moving wave front encompassing a volume which is the productivity index value for the active reservoir volume
- the primary shock wave acts as the outer reservoir boundary.
- the well bore is the inner boundary
- the reservoir will maintain constant power dissipation according to the second law of thermodynamics and will maintain reservoir energy through a pressure, volume, mass, and energy balance for the entire reservoir according to the first law of thermodynamics Newton's Laws for Conservation of Momentum are also observed to maintain a dynamic balance of fluid forces acting through the well.
- the asymmetry of the reservoir due to the permeability limit results in the generation of a secondary region of draw down around the bore of the flowing well to maintain all of the required balances in the reservoir
- the abrupt change in flow from the reservoir results in the generation of a secondary capillary shock wave
- the sudden change in flow through the capillary results in a readjustment of the electronic forces present at each pore throat
- the new active reservoir volume grows symmetrically and in proportion to the growth of the entire reservoir relative to the size of the active reservoir at the time the limit was encountered
- the reservoir volume continues to grow in two distinct regions of constant power dissipation or constant M
- the intensity of the lost productive energy growth at the boundary results from the focusing of the energy loss through the radial segment subtended by the no-flow limit FIG.
- FIG. 3 graphically demonstrates the reflection mechanism, showing an expanding circular shock wave with wave front 22a as it impacts with a straight section 25 of the reservoir boundary and the spreading points of impact being joined to the well 26 by truncating radials 28, 29.
- a secondary capillary shock wave with expanding circular wave front 30 is generated to maintain the required energy balance for the reservoir
- the reflection mechanism can be understood by considering that each secondary wave is moving up a potential hill and will retrace the reservoir volume traversed previously by the primary wave Because the velocity of the primary wave is a function of time and hydraulic diffusivity, the secondary wave is a function of hydraulic diffusivity, time, and the time of secondary wave initiation
- the First Law of Thermodynamics which states that energy in a closed system is conserved, can be applied to the geologic reservoir under consideration as the conservation of distributed power over the active reservoir, or that volume of the 'reservoir encompassed by the circular capillary wave
- the next step is to calculate the pressure depletion contributed to the well by this loss of contributed flow.
- the secondary demand on the well is then added to the original field depletion to achieve the pressure draw down generated behind the secondary wave Equation (44) describes the pressure depletion contribution to the secondary field
- DP(t) includes skin effect and is referenced to the original pressure P i . This convention is common and simplifies the writing of equations. The skin term changes sign for drawdowns and buildups and becomes tedious to carry in equation manipulations. Pressure losses due to skin are contemplated in this disclosure.
- Thinning of pay in all directions from the well will show up only in the late stages of the test as the reservoir as a whole approaches semi-steady state, that is, when all of the capillary radials cease to grow
- the well acts as a focal point or a lens to maintain balance according to the laws of physics
- An analogy comparing streamlines to light rays is very useful to understanding the imaging that occurs in the course of applying the "Bubble” or "Petroporokinekinetics” theory described herein
- the communication through the well bore allows the non-growing capillary radials to deplete symmetrically with the growing radials in the same depletion region defined by the primary wave and the secondary wave
- These energy bands of dissipation or pressure depletion segments point to the capillary waves much the same way that the tail of a comet points to the head
- the capillary secondary waves provide succeeding boundaries to define each region of discretely lost growth as each limit is encountered
- a reservoir's boundary limits are defined by a sharp transition in hydraulic diffusivity of the geologic formations Generally, a one order of magnitude reduction in hydraulic diffusivity will produce a reflection which signifies the presence of a limit.
- "Bubble Theory" predicts that those capillaries striking the permeability limit will begin to reduce their flow contribution to the well relative to the still growing capillaries in the infinite acting radial regions.
- a discrete section of boundary limit or reflector can be defined geometrically as the locus of points at the edge of the flow field between the extremities of two truncating radials each emanating from the well at an angle to the radial to the initial point of boundary contact which is located therebetween
- the limit is not an active reflector until the primary wave has reached it and the mechanical energy not gained by the primary wave is focussed back into the well and forms the secondary energy depletion region
- the reflecting boundary limit can also be considered to be formed of a plurality of discrete limits, each located between a pair of truncating radials
- the secondary regions that are formed are ordered in the precedence with which the primary wave strikes each limit
- the reservoir is divided by memory streamlines or capillary membranes formed by the expanding capillary rupture shock wave
- the active reservoir and the well pressure are sensitive only to the angular disposition of those capillaries which are no longer growing in length and the angular rate at which those remaining growing capillaries cease to grow
- Deviations in the curvature of the reflecting face of the reservoir limit results in variations in the angular relationship of capillary growth termination with time Because this is a time vs angle relationship it is possible to deal with variations of the reflecting boundary as related to corresponding changes in reflected intensity.
- each newly encountered straight no-flow boundary limit is heralded by a two to one increase in magnitude of the slope of the function, oftentimes preceded by a small step drop in pressure at the well then followed by a short term dynamic that settles into the new increased semilog slope
- the reflector in terms of contributing right and left hand sides with respect to the radial 33 to the point of contact 37 with the boundary limit If viewed in terms of equally contributing right and left hand sides, as shown in FIG.
- FIG. 5(a) there is shown an expanding capillary wave 40 which is expanding concentrically with respect to a well bore 26b in a geologic reservoir and is making initial impact with a discrete section 41 of the reservoir boundary limit wherein the section is convex in shape.
- the distance from the well bore 26b is represented by the distance radial 42 to the initial point of contact with the boundary.
- the most recent points of contact of the wave with the boundary may be joined to the well bore 26b by a pair of truncating radials 42a, 42b.
- the angles ⁇ L and ⁇ R which the left and right truncating radials define with the distance radial 42 may be directly measured from the map.
- the lengths of the truncating radials are equal to (4 ⁇ t ) and the length of the distance radial 42 is equal to (4 ⁇ t 1 )
- FIG 5b is a schematic diagram, similar to FIG 5a, which shows an expanding shock wave striking a convex limit but with a hypothetical straight line boundary and geometric construction similar to FIG. 4 superposed thereon
- the distance radial 42 impacts the hypothetical straight line in perpendicular relation and with the hypothetical boundary and truncating radials forms a pair of right triangles, each with the distance radial 42 as a common side of length equal to (4 ⁇ t 1 ) and a hypotenuse represented by a truncating radial of length equal to (4 ⁇ t )
- the hypothetical angular displacements ⁇ L ' and ⁇ R ' differ from the angular displacements ⁇ L and ⁇ R as measured on a geologist's map.
- the right triangle which includes ⁇ R ' is displaced on the graphical plot by angular rotation about its vertex at the well location by an amount such that its vertex formed by the hypotenuse and straight line boundary makes contact with the convex boundary.
- the resulting construction shown in FIG. 5c displays the angles ⁇ R ' and ⁇ R and the angle ⁇ R ' - ⁇ R which is the displacement caused by the deviation of the geologist's boundary from a hypothetical straight boundary.
- the difference in the angles for ⁇ R ' - ⁇ R is designated as the angle a depicted in FIG. 5d.
- the back projected value of M 2 can provide relative angular displacement
- the value M 2 can be used to compute a point to point angular displacement or the sum of the angles ⁇ plus ⁇ in the configurations for convex and concave limits as shown in FIGS 5(d) and 6, respectively, wherein the angles ⁇ and ⁇ represent the respective angular displacements. In both cases the sum of ⁇ plus ⁇ is the same. It is the angular contribution of apparent flow influx that is controlled by the M 1 /M 2 ratio, which ratio responds to the rate of termination of growing radii.
- M 2 q C( d ⁇ dt ) ( ⁇ + ⁇ + ⁇ 2 ⁇ )
- ⁇ + ⁇ obtained for a limit detected on the pressure vs time curve is therefore available along with values of distance d for comparison with values of ⁇ + ⁇ and d derived from the geologist's map This is called curvature or angle of diffraction and it represents the angle of displacement from the tangent line by a line from a point of contact on the boundary projected back to the circle of tangency
- an apparent boundary reflection plane 39 can be drawn through the center of the well and parallel to the straight face of the reservoir boundary section.
- the curvature of the boundary limit is defined by the sum of the angles ⁇ plus ⁇ and the curved boundary is non-unique in spatial relationship and relative location with respect to the well
- the boundary limit with such curvature, and at a calculated distance d from the well as noted from the time of wave travel to the initial point of contact and tangency can be re-positioned to obtain a best fit with other discrete sections of reservoir boundary so long as such re-positioning does not create a second limit geometrically
- the boundary limit with such curvature, and at a calculated distance d from the well as noted from the time of wave travel to the initial point of contact and tangency can be re-positioned to obtain a best fit with other discrete sections of reservoir boundary so long as such re-positioning does not create a second limit geometrically
- the boundary limit with such curvature, and at a calculated distance d from the well as noted from the time of wave travel to the initial point of contact and tangency can be re-positioned to obtain a best fit with other discrete
- the pair of truncating radials associated with a discrete section of the boundary define an angle therebetween so long as the wave front is impacting the discrete section of boundary From the pressure vs time plot.
- the end of a section of the curve having a given slope M 1 and at a greater distance from the well than the distance radial will limit the spread of the truncating radials
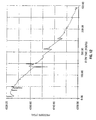
- the variables in the plot of pressure vs time may both be linear although a plot which uses the logarithm of time as shown in FIG 14 or the square root of time is more effective in displaying a change of slope when the shock wave impacts a discrete section of the reservoir boundary
- the process for creating a pressure vs time curve from the geologist's map is a matter of a few steps as enumerated below to calculate the ⁇ + ⁇ angles for each limit at any point in time.
- the process is as follows
- the plot of pressure versus the semilog of time demonstrates the gain of confirmed reservoir volume directly proportional to time. This corresponds to a growing circle or segment thereof which is expanding in concentric relation to the well
- the plot of pressure versus the square root of time indicates the growth of the "active reservoir” as the square root of time This is the case for a channel-like reservoir or a well flowing between parallel limits
- the log plot will have straight segments
- the function will be a collage of products of the t and log t. The relative straightness of the function to be observed is an engineering judgment
- FIG 19(a) is a Cartesian coordinate graph wherein the abscissa is the time of flow of the capillary energy shock wave and the ordinates are the slope values for M 1 calculated from multiple fixed points. This is called a funicular stack Similar graphs may be constructed wherein the abscissa is the square root of time, the logarithm of time or any function of time
- the purpose of the funicular section is to assist in locating sections of a plot that exhibit persistent and constant slopes punctuated by abrupt changes
- the taking of numerical derivatives has been punctuated with problems related to numerical noise for short span derivatives and with problems related to artificial smoothing for long span derivatives
- the funicular section is a systematic means for testing a data trend for straightness and then noting abrupt changes in slope upon which the method of this invention is based This can be done with any functional relationship
- the process is equivalent to laying a straight edge next to a data plot starting with the first point and extending the straight edge to every point in succession along the plot A calculation of the slope is made and plotted on a separate plot The process is repeated starting with the second and successive points The result is like a surveyors traverse in that repeated functions will result in approximately the same derivative values as long as the points lie along the same functional straight line. When the slop increases, the value of the derivative will begin to decrease At each succeeding point along the straight lin.
- the derivatives will remain constant, that is, produce a plotted function that is constant and then begin increasing As each line is computed, a series of horizontal lines will appear that increase or decrease with point progression At the point that represents the abrupt change, a new series of horizontal lines will be generated, producing another flat spot.
- the slope of the function will progress stepwise until each shift 1 the plot slope is represented by a step increase or decrease in the slope calculation
- the plot will appear to stair step at each abrupt shift in the slope of the plot
- This plot is the key in locating secondary and higher wave regenerations in the well bore
- the process may be reversed and run backwards
- the combination of plots may be overlaid to spot consistent derivative values
- the advantage of this method is that it can be run numerically to produce three different views of the process of abrupt slope shifts in various forms of data plots
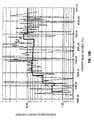
- Fig 19(b) is a plot wherein the abscissa is the logarithm of the flow time of the capillary energy shock wave and the ordinate is a DIMENSIONLESS ENERGY FUNCTION of values equal to M/M 1 where M and M 1 are slope values of the pressure versus time function Similar plots may be constructed with abscissa values equal to the square root of time or any other function of time
- Fig. 20 is a derivative plot wherein the abscissa is the distance in feet traveled by the primary capillary energy shock wave (energy wave) which is proportional to the square root of time and the ordinate is a PARALLEL STABILITY FUNCTION and ordinate values are equal to (dP/d t )
- N is the square root of time plot derivative and when N is a constant value, the presentation of parallel boundary limits to the expanding waves is in evidence
- FIG 21 is a BARLOG® plot of distance traveled by the primary wave versus the Log [M(t) / M 1 / Log (2)], which plot gives a close approximation for the number of times the semilog slope of the pressure vs. time curve has doubled While a plot of the pressure versus the square root of time or a plot of pressure versus the log of time can be tested with a straight edge to provide the same information as to boundary limits, the graph of FIG. 21 is a simpler format which is sometimes preferable
- FIG 7 An example of a reservoir boundary limit 60 of circular form having a common center with the well bore 61 is shown in FIG 7
- the primary shock wave 62 strikes the circular limit at all points at the same time
- the primary region is in near semi-steady energy state to the time of wave impact, that is, dP/dt is constant throughout the reservoir volume at any given time and upon impact the primary region goes directly from infinite radial flow to a semi-steady energy state No secondary region is formed.
- the primary wave 67 strikes the nearest point on the bounding circle and thereafter enlarges its contact with the boundary
- the section of boundary which has been impacted by the primary wave is defined by a pair of truncating radial 69, 70, which will travel about the boundary in opposite clockwise and counter-clockwise directions until they join at the farthest point 71 on the boundary
- the boundary limit 65 as viewed from the well, appears to be a limit of continuously increasing concavity
- a secondary energy region will form concentric about the well bore 66 and rapidly grow in circular expansion to achieve a semi-steady energy state at a rate which depends on its degree of eccentricity with respect to the boundary
- a reservoir boundary and the well therein are related such that the primary shock wave impacts discrete sections of the boundary in spaced time intervals, the secondary energy regions that are formed are ordered in the precedence and sequence at which the primary wave strikes the successive discrete sections of the boundary limits
- An example of a reservoir with an elliptical boundary 72 is shown in FIG 9 If the well 73 is located at the geometric center of the ellipse as in FIG 9 or on a minor axis of the elliptical boundary and just off the major axis, the well would see two limits before closure, that is, the effect would be the same as though the primary shock wave is striking two isolated and widely separated direct boundary limits, each demarcated by a spreading pair of truncating radial such as the pairs 74, 75.
- the volumetric flow rate from the well should also be recorded as a continuous running flow rate curve This is a quality assurance check and enables exclusion of data known to be affected by a shut-in or major rate change
- FIG 12 is such a plot of well pressure versus well flow time for the reservoir of FIGS 10 and 11 wherein well pressure and well flow time are plotted in linear functions
- FIG. 13 is a plot of the same well pressure data used in FIG 12 but wherein well pressure is plotted as a linear function versus the logarithm of time
- FIG 14 shows the curve of FIG 13 wherein slope lines of M 1 - M 4 have been added and emphasize the changes in slope
- FIGS 17(a) - 17 (c) depict the segments of apparent flow angle of reservoir fluid into the well to the reservoir The flow angles are ordered in correspondence with the increasing distance of travel of the primary shock wave to the discrete sections of the reservoir boundary.
- FIG. 17(a) shows a 360°flow angle ⁇ 1 into the reservoir well immediately prior to the impact of the shock wave with the first section of boundary limit.
- the flow angle of FIG 17(b) corresponds to the first limit encountered by the expanding shock wave with flow angles of FIGS 17(c), 17(d) and 17(e) corresponding to the second, third and fourth limits encountered at successively greater travel times and correspondingly greater distances from the reservoir well
- the orientation of the limit represented by the flow angle C of FIG. 17(c) is limited such that in rotating the angle about its vertex to obtain a "fit", its angle must be included in the flow angle B on which it is superposed, that is, the radii which define its angle must not be rotated beyond the defining radius of the flow angle A towards which it is rotated
- the next step is creating a polar coordinate system chart where the well bore represents the origin of the polar coordinate system and each detected discrete boundary limit is located on the chart at a distance from the origin corresponding to the distance derived therefor.
- the method further requires for each discrete limit, inscribing on the chart a circle which is centered about the origin and inscribing a minimal radius corresponding to the distance d derived for each such limit
- the minimal radius may be inscribed on said chart in an arbitrary direction of the origin, each intersection of a minimal radius line and its associated circle representing a point of tangency of a tangent line to the circle at the initial point of contact of the shock wave with the reservoir limit
- R t 2 ⁇ ⁇ + ⁇ + ⁇
- values of R i >2 indicates concavity of a limit
- R t ⁇ 2 indicates convexity
- the angular disposition of each said discrete reservoir limit is then adjusted about the origin of the polar coordinate chart and then re-positioned on its tangent point of contact with its associated distance radial in relationship with the other discrete reservoir limits to thereby provide a simulation of the reservoir boundary
- the map then generated may be compared to a geologist's map for verification or amendment of the geologist's map.
- the values for d and ⁇ + ⁇ for each detected limit may be compared with values for d and ⁇ - ⁇ associated with discrete sections of the reservoir boundary as postulated in a geologist's map of the reservoir.
- the different arcs are assembled to provide an equivalent map of the reservoir about the well
- the geologist's map is almost always an aid to the assembly of the equivalent map which can therefore be used to verify the geologist's map or to urge its modification
- a Table of values used in preparing the composite of assembled flow angles of FIGs 17(a) - 17(e) and superposed on the geologist's map of FIG 16 is as follows d ⁇ ⁇ ⁇ Limit 1 1300 70° -2 91602 6 083785 Limit 2 1600 176° 0 0 Limit 3 1900 270° 0 0 Limit 4 3300 25° 0 0 WATER 4000 39° 0 1.411928
- the solid line is an interpretation based on the values from the table
- the method described herein is directed to the processing of well pressure data for the goal of determining the shape of each independent boundary section of a geologic reservoir and deriving the size of the reservoir therefrom
- boundary shapes as determined by the theory may not be mathematically unique, they are nevertheless geometrically constrained over their ranges of possible existence such that a set of symmetrical images are created that can logically be assembled into a representative map of the reservoir
- the method of the invention can have significant economic impact
- An application of the method can save a commercial developer from large financial losses if geology and seismic studies indicate a large reservoir when in reality it is of uneconomic size It can also allow the hooking of proved reserves much earlier in the development of a proven large field than would normally be the case
- the constructed map could be rotated arbitrarily about an axis passing through the well and normal to the plane of the map to give a new map that would match the observations as well as the original constructed map
- the map could then be viewed as having a rotational ambiguity about an axis through the vertical wellbore
- the map also has a "mirror" ambiguity, i.e. a mirror image of a constructed map in a plane normal to the map would also satisfy the data
- ambiguities may also exist, depending upon the complexity of the reservoir
- the simplest form of this would consist of a flow test in one well while simultaneously observing the shut in pressure at another well in the reservoir The second well would remain shut in while the first well is shut in Then the second well would be flowed to gain a different perspective of the reservoir from a different location
- Such multiple well observations and determination of reservoir boundaries from such observations are intended to be within the scope of the present invention
Landscapes
- Life Sciences & Earth Sciences (AREA)
- Physics & Mathematics (AREA)
- General Life Sciences & Earth Sciences (AREA)
- Geophysics (AREA)
- General Physics & Mathematics (AREA)
- Acoustics & Sound (AREA)
- Remote Sensing (AREA)
- Geology (AREA)
- Environmental & Geological Engineering (AREA)
- Engineering & Computer Science (AREA)
- Geophysics And Detection Of Objects (AREA)
- Liquid Crystal Substances (AREA)
- Aerodynamic Tests, Hydrodynamic Tests, Wind Tunnels, And Water Tanks (AREA)
- Measuring Fluid Pressure (AREA)
- Apparatus For Radiation Diagnosis (AREA)
Claims (26)
- Verfahren zum Bestimmen einer Grenze bzw. Abgrenzung eines unterirdischen Reservoirs mit einem Fluid unter Druck, mit folgenden Verfahrensschritten:(a) Erhalten eines Drucks des Fluids in einem Schacht über ein Zeitintervall, der das Reservoir durchdringt,(b) Bestimmen einer Neigung bzw. eines Verlaufs des Drucks des Fluids als eine Funktion der Zeit,(c) Erfassen einer Vielzahl von Zeitpunkten "t1", die mit einer abrupten Änderung in der Neigung des Drucks als eine Funktion der Zeit verbunden sind, die bezeichnend für eine verringerte Rate des Fluidflusses sind, und(d) Bestimmen einer Vielzahl von Bereichen "d1" des Einflusses des Schachts als eine Funktion der abrupten Änderung.
- Verfahren nach Anspruch 1, bei dem die Neigung des Drucks des Fluids als eine Funktion der Zeit auf einem Ausdruck bzw. einem Graphen-bestimmt wird, der aus einer Reihe ausgewählt ist, einschließlich (i) des Drucks des Fluids gegenüber dem Logarithmus der Zeit, und (ii) des Drucks des Fluids gegenüber der Quadratwurzel der Zeit.
- Verfahren nach Anspruch 2, bei dem der Druck des Fluids in dem Schacht unter einer Bedingung erhalten wird, die ausgewählt ist aus einer Reihe einschließlich (i) einem Fluß bei einer im wesentlichen konstanten Rate des Flusses des Fluids, (ii) einer Nullrate des Flusses, und (iii) folgend auf eine Einspritzung von Bohrlochfluid in die Formation.
- Verfahren nach Anspruch 2, das weiterhin den Schritt des Verwendens eines Seilhaufens umfaßt, um die Vielzahl von abrupten Änderungen in der Neigung des Drucks des Fluids als eine Funktion der Zeit zu bestimmen.
- Verfahren nach Anspruch 1, bei dem das Reservoir eine Diffusität η hat und die Beziehung zwischen d, t, und η gegeben ist durch
d=a √ (ηt), wobei a≥0,75. - Verfahren nach Anspruch 1 mit dem weiteren Schritt des Bestimmens einer Krümmung der Grenze.
- Verfahren nach Anspruch 1, bei dem das Zeitintervall ausreichend groß für den Druck des Fluids ist, um eine konstante lineare Beziehung bezüglich der Zeit anzunehmen.
- Verfahren nach Anspruch 1, bei dem der Druck für eine Reihe von diskreten Werten der Zeit über das Zeitintervall erhalten wird.
- Verfahren nach Anspruch 1, bei dem Druck für kontinuierliche Werte der Zeit über das Zeitintervall erhalten wird.
- Verfahren zum Bestimmen einer Grenze in einem unterirdischen Reservoir, das eine Grenze hat und ein Fluid unter Druck enthält, mit folgenden Verfahrensschritten:(a) Erhalten über ein Zeitintervall des Drucks des Fluids in einer Vielzahl von Schächten, die das Reservoir durchdringen,(b) Bestimmen einer Vielzahl von Neigungen des Drucks des Fluids in jedem der Vielzahl von Schächten als eine Funktion der Zeit,(c) Erfassen einer Vielzahl von Zeitpunkten "t1", die mit einer abrupten Änderung in jeder der Vielzahl von Neigungen des Drucks als eine Funktion der Zeit verbunden sind, die bezeichnend für eine abnehmende Rate des Fluidflusses sind, und(d) Bestimmen einer Vielzahl von Bereichen d1 des Einflusses der Schächte als eine Funktion der abrupten Änderungen.
- Verfahren nach Anspruch 10, bei dem der Druck des Fluids in jedem der Vielzahl von Schächten unter einer Bedingung gemessen wird, die aus einer Reihe ausgewählt ist, einschließlich (i) dem Fluß bei einer im wesentlichen konstanten Rate des Flusses des Fluids, (ii) einer Nullrate des Flusses, und (iii) folgend auf ein Einspritzen von Bohrlochfluid in die Formation.
- Verfahren nach Anspruch 10, bei dem die Vielzahl von Neigungen des Drucks des Fluids als eine Funktion der Zeit auf einem Grahpen bestimmt wird, der ausgewählt ist aus einer Reihe einschließlich (i) dem Druck des Fluids gegenüber dem Logarithmus der Zeit, und (ii) dem Druck des Fluids gegenüber der Quadratwurzel der Zeit.
- Verfahren nach Anspruch 10, das weiterhin eine Verwendung eines Seilstapels umfaßt, um die abrupten Änderungen in der Neigung des Drucks des Fluids als eine Funktion der Zeit zu bestimmen.
- Verfahren nach Anspruch 10, bei dem das Reservoir eine Diffusität η hat und die Beziehung zwischen d1, t1 und η1 gegeben ist durch
d1=a√ (η t1), wobei a≥0,75. - Verfahren nach Anspruch 10, das weiterhin den Schritt des Bestimmens einer Krümmung der Grenze von der abrupten Änderung in der Vielzahl von Neigungen des Drucks als eine Funktion der Zeit umfaßt.
- Verfahren nach Anspruch 10, bei dem das Zeitintervall ausreichend groß ist, damit der Druck des Fluids eine konstante lineare Beziehung unter Bezugnahme der Zeit annimmt.
- Verfahren nach Anspruch 10, bei dem der Druck für eine Reihe von diskreten Werten der Zeit über das Zeitintervall erhalten wird.
- Verfahren nach Anspruch 10, bei dem der Druck für kontinuierliche Werte der Zeit über das Zeitintervall erhalten wird.
- Verfahren zum Bestimmen einer Grenze eines unterirdischen Reservoirs mit einem Fluid unter Druck, mit den Verfahrensschritten:(a) Erhalten eines Drucks über einem Zeitintervall des Fluids in einem Schacht, der das Reservoir durchdringt,(b) Bestimmen einer Neigung des Drucks des Fluids als eine Funktion der Zeit,(c) Erfassen einer Vielzahl von Zeitpunkten "t1", die mit einer abrupten Änderung in der Neigung des Drucks als eine Funktion der Zeit verbunden sind,(d) in Beziehung Bringen der Zeit t1 zu einem Beginn einer Schockwelle in dem Fluid, und(e) Bestimmen einer Vielzahl von Bereichen "d1" einer Einwirkung des Schachts als eine Funktion des Durchgangs der Schockwelle.
- Verfahren nach Anspruch 19, bei dem die Neigung des Drucks des Fluids als eine Funktion der Zeit auf einem Ausdruck bestimmt wird, der ausgewählt ist aus einer Reihe einschließlich (i) dem Druck des Fluids gegenüber dem Logarithmus der Zeit, und (ii) dem Druck des Fluids gegenüber der Quadratwurzel der Zeit.
- Verfahren nach Anspruch 19, bei dem der Druck des Fluids in dem Schacht unter einer Bedingung erhalten wird, die ausgewählt ist aus einer Reihe mit (i) einem Fluß bei einer im wesentlichen konstanten Rate des Flusses des Fluids, (ii) einer Nullrate des Flusses, und (iii) folgend einem Einspritzen von Bohrlochflüssigkeit in die Formation.
- Verfahren nach Anspruch 19, das weiterhin den Schritt des Verwendens eines Seilstapels umfaßt, um die abrupten Änderungen im Verlauf des Drucks des Fluids als eine Funktion der Zeit zu bestimmen.
- Verfahren nach Anspruch 19, das weiterhin den Schritt des Bestimmens einer Krümmung der Grenze umfaßt.
- Verfahren nach Anspruch 19, bei dem das Zeitintervall ausreichend groß ist, damit der Druck des Fluids eine konstante lineare Beziehung unter Bezugnahme der Zeit annimmt.
- Verfahren nach Anspruch 19, bei dem der Druck aus einer Reihe von diskreten Werten der Zeit über dem Zeitintervall erhalten wird.
- Verfahren nach Anspruch 19, bei dem der Druck für kontinuierliche Werte der Zeit über dem Zeitintervall erhalten wird.
Applications Claiming Priority (3)
| Application Number | Priority Date | Filing Date | Title |
|---|---|---|---|
| US2320796P | 1996-08-05 | 1996-08-05 | |
| US23207P | 1996-08-05 | ||
| PCT/US1997/013838 WO1998005982A1 (en) | 1996-08-05 | 1997-08-05 | Method for producing images of reservoir boundaries |
Publications (2)
| Publication Number | Publication Date |
|---|---|
| EP0916102A1 EP0916102A1 (de) | 1999-05-19 |
| EP0916102B1 true EP0916102B1 (de) | 2002-11-27 |
Family
ID=21813696
Family Applications (1)
| Application Number | Title | Priority Date | Filing Date |
|---|---|---|---|
| EP97937136A Expired - Lifetime EP0916102B1 (de) | 1996-08-05 | 1997-08-05 | Herstellungsverfahren von reservoirbegrenzungsbilder |
Country Status (7)
| Country | Link |
|---|---|
| US (1) | US6041017A (de) |
| EP (1) | EP0916102B1 (de) |
| AT (1) | ATE228659T1 (de) |
| AU (1) | AU3972197A (de) |
| CA (1) | CA2263466C (de) |
| DE (1) | DE69717454T2 (de) |
| WO (1) | WO1998005982A1 (de) |
Families Citing this family (16)
| Publication number | Priority date | Publication date | Assignee | Title |
|---|---|---|---|---|
| WO2002003103A2 (en) * | 2000-06-29 | 2002-01-10 | Object Reservoir, Inc. | Method and system for solving finite element models using multi-phase physics |
| US7369973B2 (en) | 2000-06-29 | 2008-05-06 | Object Reservoir, Inc. | Method and system for representing reservoir systems |
| US7096122B2 (en) * | 2003-07-22 | 2006-08-22 | Dianli Han | Method for producing full field radial grid for hydrocarbon reservoir simulation |
| US7171316B2 (en) * | 2003-10-17 | 2007-01-30 | Invensys Systems, Inc. | Flow assurance monitoring |
| US7069148B2 (en) * | 2003-11-25 | 2006-06-27 | Thambynayagam Raj Kumar Michae | Gas reservoir evaluation and assessment tool method and apparatus and program storage device |
| GB0416878D0 (en) * | 2004-07-29 | 2004-09-01 | Sensornet Ltd | Processing sensing measurements |
| GB2443125B (en) * | 2005-08-08 | 2012-02-08 | Halliburton Energy Serv Inc | Computer-implemented methods to design a rotary drill bit with a desired bit walk rate |
| US8145463B2 (en) * | 2005-09-15 | 2012-03-27 | Schlumberger Technology Corporation | Gas reservoir evaluation and assessment tool method and apparatus and program storage device |
| US8244509B2 (en) * | 2007-08-01 | 2012-08-14 | Schlumberger Technology Corporation | Method for managing production from a hydrocarbon producing reservoir in real-time |
| US8576084B2 (en) * | 2010-07-26 | 2013-11-05 | Invensys Systems, Inc. | Accuracy improvement in flowmeter systems |
| EP2906783A4 (de) * | 2012-10-15 | 2015-09-23 | Conocophillips Co | Verfahren zur ermittlung der kolbenabfallzeit und verwendung |
| US10041893B2 (en) * | 2014-12-23 | 2018-08-07 | Schlumberger Technology Corporation | Methods and systems for identifying hydrocarbon fluid transition characteristics using nuclear magnetic resonance |
| CN105003254B (zh) * | 2015-08-05 | 2017-06-06 | 中国海洋石油总公司 | 高温高压井筒环空密闭空间温压变化模拟实验装置 |
| CN112433248B (zh) * | 2020-11-10 | 2022-09-30 | 成都理工大学 | 一种碳酸盐岩沉积环境下隐蔽储层的探测方法 |
| CN113255155B (zh) * | 2021-06-11 | 2024-05-28 | 中海石油(中国)有限公司 | 一种储层不连续界限的阻渗能力等级的评价方法 |
| CN119247474B (zh) * | 2023-06-28 | 2025-10-03 | 中国石油天然气集团有限公司 | 气测曲线形态函数判别地层流体性质的方法 |
Family Cites Families (4)
| Publication number | Priority date | Publication date | Assignee | Title |
|---|---|---|---|---|
| US4052885A (en) * | 1976-08-24 | 1977-10-11 | The United States Of America As Represented By The United States Energy Research And Development Administration | Portable device and method for determining permeability characteristics of earth formations |
| FR2530825A1 (fr) * | 1982-07-21 | 1984-01-27 | Geostock | Procede de detection de zones permeables dans les travaux souterrains a l'avancement |
| US5417103A (en) * | 1993-11-10 | 1995-05-23 | Hunter; Roger J. | Method of determining material properties in the earth by measurement of deformations due to subsurface pressure changes |
| US5796678A (en) * | 1997-08-11 | 1998-08-18 | Trans Seismic International, Inc. | Method for determining the presence of fluids in a subterranean formation |
-
1997
- 1997-08-05 WO PCT/US1997/013838 patent/WO1998005982A1/en not_active Ceased
- 1997-08-05 AT AT97937136T patent/ATE228659T1/de not_active IP Right Cessation
- 1997-08-05 US US08/906,671 patent/US6041017A/en not_active Expired - Lifetime
- 1997-08-05 CA CA002263466A patent/CA2263466C/en not_active Expired - Fee Related
- 1997-08-05 EP EP97937136A patent/EP0916102B1/de not_active Expired - Lifetime
- 1997-08-05 DE DE69717454T patent/DE69717454T2/de not_active Expired - Lifetime
- 1997-08-05 AU AU39721/97A patent/AU3972197A/en not_active Abandoned
Also Published As
| Publication number | Publication date |
|---|---|
| EP0916102A1 (de) | 1999-05-19 |
| WO1998005982A1 (en) | 1998-02-12 |
| CA2263466C (en) | 2002-06-18 |
| DE69717454T2 (de) | 2003-10-23 |
| AU3972197A (en) | 1998-02-25 |
| CA2263466A1 (en) | 1998-02-12 |
| US6041017A (en) | 2000-03-21 |
| DE69717454D1 (de) | 2003-01-09 |
| ATE228659T1 (de) | 2002-12-15 |
Similar Documents
| Publication | Publication Date | Title |
|---|---|---|
| EP0916102B1 (de) | Herstellungsverfahren von reservoirbegrenzungsbilder | |
| US8983818B2 (en) | Method for characterizing the fracture network of a fractured reservoir and method for developing it | |
| Weingarten et al. | Prediction of sand production in gas wells: methods and Gulf of Mexico case studies | |
| GB2479990A (en) | Multicomponent seismic inversion of VSP data | |
| CA2555751A1 (en) | Method for constructing a geologic model of a subsurface reservoir | |
| GB2322948A (en) | Determining the equivalent permeability of a fracture network in a sub-surface,multi-layered medium | |
| Kam et al. | Reservoir characterization and history matching of the Horn River shale: an integrated geoscience and reservoir-simulation approach | |
| US5170377A (en) | 3-D mapping of salt domes | |
| Nguyen et al. | Integration of 3D Geological Modeling and Fault Seal Analysis for Pore Pressure Characterization of a High Pressure and High Temperature Exploration Well in Nam Con Son Basin, a Case Study Offshore Vietnam | |
| CN109298448A (zh) | 一种致密气压裂工程甜点的预测方法和装置 | |
| EP0803073A1 (de) | Neigungsmesserverarbeitungsverfahren | |
| Al-Hamad et al. | Drilling with 3D geomechanical modeling-efficient simulation method | |
| Stewart et al. | The interpretation of vertical pressure gradients measured at observation wells in developed reservoirs | |
| Onaisi et al. | Stress related wellbore instability problems in deep wells in ABK field | |
| CN106990433B (zh) | 一种隆起区微小侵蚀沟槽的识别方法 | |
| RU2093860C1 (ru) | Способ сейсмического контроля изменения емкостных свойств и положения контура продуктивности нефтегазового пласта в процессе его разработки | |
| Behie et al. | Perforation Design Models for Heterogeneous, Multiphase Flow | |
| CN116068649A (zh) | 针对高陡断层附近内幕潜山的变速成图方法 | |
| Paillet et al. | Theoretical Models Relating Acoustic Tube-Vave Attenuation To Fracture Permeability-Reconciling Model Results With Field Data | |
| CN119846707B (zh) | 一种云灰复合潜山刻画方法及装置 | |
| US20250189694A1 (en) | Modeling a Subsurface Formation Using an Unstructured Grid | |
| CN115407389B (zh) | 断块划分的方法及装置 | |
| Hongbin et al. | Origin of rollover | |
| Orlov et al. | Natural Fracture Modeling in Unconventional Dadas-I Member for 3D Seismic Survey in the Southeastern Turkey | |
| Che et al. | An Integrated Solution in Utilizing Active Magnetic Ranging to Seal Off Underground Gas Storage: Theoretical Analysis and Field Test |
Legal Events
| Date | Code | Title | Description |
|---|---|---|---|
| PUAI | Public reference made under article 153(3) epc to a published international application that has entered the european phase |
Free format text: ORIGINAL CODE: 0009012 |
|
| 17P | Request for examination filed |
Effective date: 19990218 |
|
| AK | Designated contracting states |
Kind code of ref document: A1 Designated state(s): AT BE CH DE DK FR GB IE IT LI NL |
|
| RAP1 | Party data changed (applicant data changed or rights of an application transferred) |
Owner name: GOLDSBERRY, FRED L. |
|
| RIN1 | Information on inventor provided before grant (corrected) |
Inventor name: GOLDSBERRY, FRED L. |
|
| GRAG | Despatch of communication of intention to grant |
Free format text: ORIGINAL CODE: EPIDOS AGRA |
|
| 17Q | First examination report despatched |
Effective date: 20020214 |
|
| GRAG | Despatch of communication of intention to grant |
Free format text: ORIGINAL CODE: EPIDOS AGRA |
|
| GRAH | Despatch of communication of intention to grant a patent |
Free format text: ORIGINAL CODE: EPIDOS IGRA |
|
| GRAH | Despatch of communication of intention to grant a patent |
Free format text: ORIGINAL CODE: EPIDOS IGRA |
|
| GRAA | (expected) grant |
Free format text: ORIGINAL CODE: 0009210 |
|
| AK | Designated contracting states |
Kind code of ref document: B1 Designated state(s): AT BE CH DE DK FR GB IE IT LI NL |
|
| PG25 | Lapsed in a contracting state [announced via postgrant information from national office to epo] |
Ref country code: LI Free format text: LAPSE BECAUSE OF FAILURE TO SUBMIT A TRANSLATION OF THE DESCRIPTION OR TO PAY THE FEE WITHIN THE PRESCRIBED TIME-LIMIT Effective date: 20021127 Ref country code: CH Free format text: LAPSE BECAUSE OF FAILURE TO SUBMIT A TRANSLATION OF THE DESCRIPTION OR TO PAY THE FEE WITHIN THE PRESCRIBED TIME-LIMIT Effective date: 20021127 Ref country code: BE Free format text: LAPSE BECAUSE OF FAILURE TO SUBMIT A TRANSLATION OF THE DESCRIPTION OR TO PAY THE FEE WITHIN THE PRESCRIBED TIME-LIMIT Effective date: 20021127 Ref country code: AT Free format text: LAPSE BECAUSE OF FAILURE TO SUBMIT A TRANSLATION OF THE DESCRIPTION OR TO PAY THE FEE WITHIN THE PRESCRIBED TIME-LIMIT Effective date: 20021127 |
|
| REF | Corresponds to: |
Ref document number: 228659 Country of ref document: AT Date of ref document: 20021215 Kind code of ref document: T |
|
| REG | Reference to a national code |
Ref country code: GB Ref legal event code: FG4D |
|
| REG | Reference to a national code |
Ref country code: CH Ref legal event code: EP |
|
| REG | Reference to a national code |
Ref country code: IE Ref legal event code: FG4D |
|
| REF | Corresponds to: |
Ref document number: 69717454 Country of ref document: DE Date of ref document: 20030109 |
|
| PG25 | Lapsed in a contracting state [announced via postgrant information from national office to epo] |
Ref country code: DK Free format text: LAPSE BECAUSE OF FAILURE TO SUBMIT A TRANSLATION OF THE DESCRIPTION OR TO PAY THE FEE WITHIN THE PRESCRIBED TIME-LIMIT Effective date: 20030227 |
|
| REG | Reference to a national code |
Ref country code: CH Ref legal event code: PL |
|
| ET | Fr: translation filed | ||
| PG25 | Lapsed in a contracting state [announced via postgrant information from national office to epo] |
Ref country code: IE Free format text: LAPSE BECAUSE OF NON-PAYMENT OF DUE FEES Effective date: 20030805 |
|
| PLBE | No opposition filed within time limit |
Free format text: ORIGINAL CODE: 0009261 |
|
| STAA | Information on the status of an ep patent application or granted ep patent |
Free format text: STATUS: NO OPPOSITION FILED WITHIN TIME LIMIT |
|
| 26N | No opposition filed |
Effective date: 20030828 |
|
| REG | Reference to a national code |
Ref country code: IE Ref legal event code: MM4A |
|
| PGFP | Annual fee paid to national office [announced via postgrant information from national office to epo] |
Ref country code: FR Payment date: 20120823 Year of fee payment: 16 Ref country code: DE Payment date: 20120731 Year of fee payment: 16 Ref country code: IT Payment date: 20120811 Year of fee payment: 16 |
|
| PGFP | Annual fee paid to national office [announced via postgrant information from national office to epo] |
Ref country code: NL Payment date: 20120809 Year of fee payment: 16 |
|
| REG | Reference to a national code |
Ref country code: NL Ref legal event code: V1 Effective date: 20140301 |
|
| PG25 | Lapsed in a contracting state [announced via postgrant information from national office to epo] |
Ref country code: NL Free format text: LAPSE BECAUSE OF NON-PAYMENT OF DUE FEES Effective date: 20140301 Ref country code: DE Free format text: LAPSE BECAUSE OF NON-PAYMENT OF DUE FEES Effective date: 20140301 |
|
| REG | Reference to a national code |
Ref country code: DE Ref legal event code: R119 Ref document number: 69717454 Country of ref document: DE Effective date: 20140301 |
|
| REG | Reference to a national code |
Ref country code: FR Ref legal event code: ST Effective date: 20140430 |
|
| PG25 | Lapsed in a contracting state [announced via postgrant information from national office to epo] |
Ref country code: IT Free format text: LAPSE BECAUSE OF NON-PAYMENT OF DUE FEES Effective date: 20130805 |
|
| PG25 | Lapsed in a contracting state [announced via postgrant information from national office to epo] |
Ref country code: FR Free format text: LAPSE BECAUSE OF NON-PAYMENT OF DUE FEES Effective date: 20130902 |
|
| PGFP | Annual fee paid to national office [announced via postgrant information from national office to epo] |
Ref country code: GB Payment date: 20150805 Year of fee payment: 19 |
|
| GBPC | Gb: european patent ceased through non-payment of renewal fee |
Effective date: 20160805 |
|
| PG25 | Lapsed in a contracting state [announced via postgrant information from national office to epo] |
Ref country code: GB Free format text: LAPSE BECAUSE OF NON-PAYMENT OF DUE FEES Effective date: 20160805 |