EP0902883B1 - Method for measuring a sound signal propagation delay in a fluid by zero-crossing of the said sound signal - Google Patents
Method for measuring a sound signal propagation delay in a fluid by zero-crossing of the said sound signal Download PDFInfo
- Publication number
- EP0902883B1 EP0902883B1 EP97928307A EP97928307A EP0902883B1 EP 0902883 B1 EP0902883 B1 EP 0902883B1 EP 97928307 A EP97928307 A EP 97928307A EP 97928307 A EP97928307 A EP 97928307A EP 0902883 B1 EP0902883 B1 EP 0902883B1
- Authority
- EP
- European Patent Office
- Prior art keywords
- period
- amplitudes
- characteristic
- ratio
- maximum
- Prior art date
- Legal status (The legal status is an assumption and is not a legal conclusion. Google has not performed a legal analysis and makes no representation as to the accuracy of the status listed.)
- Expired - Lifetime
Links
Images

Classifications
-
- G—PHYSICS
- G01—MEASURING; TESTING
- G01F—MEASURING VOLUME, VOLUME FLOW, MASS FLOW OR LIQUID LEVEL; METERING BY VOLUME
- G01F1/00—Measuring the volume flow or mass flow of fluid or fluent solid material wherein the fluid passes through a meter in a continuous flow
- G01F1/66—Measuring the volume flow or mass flow of fluid or fluent solid material wherein the fluid passes through a meter in a continuous flow by measuring frequency, phase shift or propagation time of electromagnetic or other waves, e.g. using ultrasonic flowmeters
- G01F1/667—Arrangements of transducers for ultrasonic flowmeters; Circuits for operating ultrasonic flowmeters
Definitions
- the subject of the present invention is a method for measuring the time of propagation of an acoustic signal in a fluid flow between a first transducer playing the role of transmitter and a second transducer playing the role of receiver and located at a determined distance from the first transducer, the signal acoustic emitted by the first transducer consisting of at least one pulse emitted at a determined acoustic frequency Fa and the acoustic signal received by the second transducer comprising a series of oscillations characteristics whose amplitude is first increasing over several periods, then decreasing over several following periods, the envelope of characteristic oscillations having the shape of a spindle, the method consisting in sampling the acoustic signal received, at a sampling frequency Fe, to digitize the signal acoustic received sampled, and to be sought, by analysis of the acoustic signal receipt sampled and digitized, the first significant zero crossing of characteristic oscillations of the acoustic signal received.
- the flow can be obtained by combining a measurement of the propagation times of the two acoustic signals emitted between the two points in opposite directions with a measurement of phase shifts acoustic induced in each acoustic signal by the propagation of each acoustic signals in the flow.
- European patent application no. 0 426 309 describes an example of such a flow measurement system, in which the received signal is sampled and digitally converted, measurement of phase shift acoustic being performed by performing synchronous signal detection scanned.
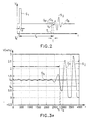
- FIG. 2 shows the form of a rectangular pulse signal S 1 of width T emitted at an instant T 0 by a first ultrasonic transducer disposed in the flow of a fluid at a first point, and the shape of the signal S 2 constituting the impulse response received in echo at an instant T 1 by a second ultrasonic transducer arranged in the flow of the fluid at a second point distinct from the first point.
- the acoustic signal S 2 received by the second transducer consists of a series of characteristic oscillations O c which increase in amplitude over several periods then decrease, the envelope of the characteristic oscillations having the shape of a spindle.
- the characteristic oscillations O c of the signal S 2 are preceded and followed by parasitic oscillations O p of low amplitude. To determine the instant T 1 at the start of the characteristic oscillations, the first significant zero crossing of the characteristic oscillations O c of the received acoustic signal S 2 should be identified .
- FIG. 3 shows, on a larger scale than in FIG. 2, an example of an acoustic signal S 2 received as an echo of a rectangular pulse S 1 emitted at a determined acoustic frequency Fa.
- a threshold voltage V S is fixed, with respect to which the level of the acoustic signal received S 2 is compared, the comparison being carried out on a digital signal obtained after sampling of the received analog acoustic signal, at a sampling frequency Fe which constitutes for example a multiple of the acoustic frequency Fa.
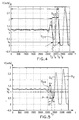
- FIG. 4 shows a curve S 21 which corresponds to the shape of an acoustic signal received for nitrogen (N 2 ) and a curve S 22 which corresponds to the shape of an acoustic signal received for a mixture of carbon dioxide and methane (CO 2 / CH 4 ). It can be seen that the curve S 21 crosses the threshold voltage V S at an instant T 4 which triggers the identification of the preceding zero crossing at an instant T 3 which is rightly considered to be the mark of the start of the characteristic oscillations O c .
- the curve S 22 which is in phase with the curve S 21 , crosses the threshold voltage V S at an instant T 6 posterior to the instant T 4 and offset with respect to the latter by the value of a period T R of the received signal.
- the instant T 5 then identified for the curve S 22 as the zero crossing point immediately preceding the crossing of the threshold at the instant T 6 is then considered to be the mark of the start of the characteristic oscillations O c of the curve S 22 .
- the curve S 22 has a negative lobe which only comes to be flush with the value of the threshold voltage V s without reaching or crossing this threshold.
- the conventional method of measuring the time of the first zero crossing of the oscillations characteristic of the received signal can generate an error of more or less a period which significantly reduces the accuracy of the measurements.
- the invention aims to remedy the aforementioned drawbacks and to allow decrease the sensitivity of the zero crossing time measurement process by one acoustic signal received, with respect to variations in waveforms of this signal as well that vis-à-vis any external disturbances likely to be detected by a simple threshold crossing monitoring method, and which could cause erroneous measurements.
- the theoretical amplitude ratio ⁇ between the maximum amplitudes Pi-and Pi + of the two lobes of said ideal period is determined beforehand from an average, for several different gases and at different flow rates, of the ratio between the maximum amplitudes P- and P + of the characteristic period observed at from the recording of acoustic signals received.
- the amplitude ratio ⁇ between the maximum amplitudes Pi- and Pi + of two lobes of the first ideal characteristic period of an acoustic signal received is almost constant depending on the nature of the gases and is independent of a gain factor.
- the choice of a comparison criterion based on this ⁇ ratio allows to greatly reduce the dependence of the measure on the nature of the gas, and therefore improve the accuracy and reliability of the measurements.
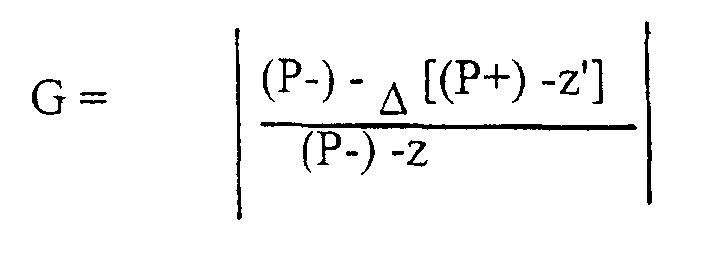
- the comparison between the ratio of the amplitudes P- and P + of the period examined and the corresponding theoretical amplitude ratio ⁇ of the ideal period is carried out by calculating a similarity criterion G which constitutes the result of the comparison compared with the threshold value G S , and which is defined as follows:
- the comparison between the ratio of the amplitudes P- and P + of the period examined and the corresponding theoretical amplitude ratio ⁇ of the ideal period is carried out by calculating a similarity criterion G which constitutes the result of the comparison compared with the threshold value G s , and which is defined as follows: where z represents an offset term intended to make the likeness criterion G slightly dependent on the maximum amplitude (P-) of the negative lobe of the characteristic period examined.
- the risks of power are limited detect waveforms resembling the likeness criterion or G template, who would be drowned in noise.
- the comparison between the ratio of the amplitudes P- and P + of the period examined and the corresponding theoretical amplitude ratio of the ideal period is carried out by calculating a similarity criterion G which constitutes the result of the comparison compared to the threshold value G s , and which is defined as follows: where z represents an offset term intended to make the likeness criterion G slightly dependent on the maximum amplitude (P-) of the negative lobe of the characteristic period examined, and z 'represents an offset term intended to render the resemblance criterion G slightly dependent on the maximum amplitude (P +) of the positive lobe of the characteristic period examined.
- two or three calculations of the similarity criterion G are carried out for each period examined, with values of the ratio of different theoretical amplitudes close to the ratio of predetermined theoretical amplitude and not deviating from it by more than 10%, and the period examined is considered to be a characteristic period if the calculated likeness criterion G is in all cases less than the value of threshold G s .
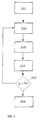
- the threshold value G s of the likeness criterion G as well as the value of the shift term z, we plot beforehand, for different gases and different flow rates, by varying the phase shift between the sampling frequency Fe and the acoustic signal received and by applying a gain factor varying between 0.45 and 1.5, a network of first curves representing the maximum values of the likeness criterion G for the characteristic periods observed and a network of second curves representing the minimum values of the similarity criterion G for the parasitic periods observed, as a function of different possible values of the offset term z, and the threshold value G s and that of the offset term z are chosen as a function of the possible safety margin in the intermediate zone between the network of first curves and the network of second curves.
- the threshold value G s can be between 0.7 and 1.7 and the value of the offset term z can be between 0.21 and 0.25 V.
- the invention is advantageously applicable to a method for measuring the speed of flow of a fluid between two transducers arranged at points of measurement spaced in the direction of a fluid flow whereby the value of the flow velocity to be measured is obtained by combining a measurement of the respective propagation times of each of the two acoustic signals emitted between the two points in opposite directions by the transducers with a measurement acoustic phase shifts respectively induced in each acoustic signal by the propagation of each of said acoustic signals in the flow, the measurement of the respective propagation times of each of the two signals acoustic emissions between the two measurement points being carried out in accordance with method according to the present invention.
- FIG. 1 shows the block diagram of an example of such electronic circuits which are associated with two ultrasonic transducers 1, 2 arranged at a distance from each other in a pipe 3 in which a fluid such as a gas.
- the two transducers 1, 2 are connected to a block of switching 4 which includes two switches 5, 6 and allows the use of each transducer alternately as transmitter and receiver.
- a module transmission 14 and a reception module 17 are respectively connected to switches 5, 6 of the switching block 4.
- the transmission module 14 comprises an operational amplifier 16 and a digital-analog converter 15.
- the reception module 17 comprises at least one amplifier 18 and one analog to digital converter 19 which digitizes and samples simultaneously the received signal.
- a source of electrical energy 7 and a module 8 of power supply management are linked in particular to the transmission modules 14 and reception 17 as well as the switching block 4 and a microcontroller 10.
- the microcontroller 10 notably comprises a quartz clock 9, a unit arithmetic and logic, RAM and ROM circuits, and can cooperate with display circuits 13, a rewritable read-only memory 12 and a serial link 11 of the RS 232 type.
- the gas meters intended to equip each subscriber with a network of distribution must be precise, reliable and as inexpensive as possible. These constraints make it necessary to avoid the use of expensive components, to uses small, long-life but medium-capacity power batteries for safety reasons and to perform calculations according to a measurement process ensuring both high precision and reliability while remaining simple enough to be energy efficient.
- ultrasonic transducers can operate at an acoustic frequency Fa of the order of 40 kHz and the frequency sampling Fe of the acoustic signals received is advantageously 320 kHz, that is to say eight times higher than the frequency Fa.
- the sampling frequency Fe is advantageously equal to one multiple of the acoustic frequency Fa.
- the frequency Fe can also take other values.
- the values (multiples of Fa or not multiples) of Fe are too low, it is better to use for example an algorithm approximation near the maximum (in absolute value) of each period of the acoustic signal, or even to carry out several successive measurements by phase shifting each new measurement the sampling signal with respect to the signal acoustics considered, this in order to obtain greater precision on the values maximum amplitudes (in absolute value).
- the acoustic signal emitted by each transducer is constituted for example by a pulse emitted at the determined acoustic frequency Fa.
- This pulse is for example rectangular. Several pulses could also be emitted.
- S, L, Td, Tu have the meaning indicated above
- ⁇ d and ⁇ u respectively represent the acoustic phase shifts induced in each of the acoustic signals due to the propagation of these signals and Fa represents the frequency of said acoustic signals.
- Tu.Td For a given gas composition, such as the propagation speed c mainly depends on the temperature which varies little during flow measurements, the term Tu.Td also varies little and this term can be recalculated with a relatively low frequency. However, since this is the absolute measure propagation times, the precision obtained for this measurement is directly reported on the flow measurement accuracy. So it is essential to avoid having an offset on this measurement.
- Figure 3a illustrates the zero crossing measurement method performed on each ultrasonic signal received according to a known method, in conjunction with a device like that of Figure 1.
- the received signal is amplified by the amplifier 18 having a gain given, then converted to digital and sampled simultaneously in the converter 19.
- the sampling is carried out at a frequency Fe for example equal to 8 Fa, or 320 kHz if Fa is 40 kHz.
- the instructions for carrying out the measurements make it possible to compare the values of the amplitude of the signal received at the sampled points and which are stored in a random access memory, with a predetermined value corresponding to a threshold V s , and one searches among the amplitude values of the sampled points for the first point following A, which has an amplitude value greater than the threshold.
- the present invention aims to improve this method of determination signal propagation time by measuring the zero crossing time.
- the simple comparison between the voltage amplitude values at the sampled points of a received acoustic signal and a threshold voltage value V s can lead to errors in determining the time of zero crossing Tpz and therefore in the propagation time of the acoustic signal. If in Figure 4 the time of zero crossing T 3 for the curve S 21 relative to the signal corresponding to a gas constituted by nitrogen is correct, on the other hand the time of zero crossing T 5 for the curve S 22 relative the signal for a gas consisting of a mixture of carbon dioxide and methane is incorrect and excessive.
- the method according to the invention makes it possible to avoid this kind of error and, in general, to reduce the sensitivity of the time measurement process zero crossing for waveform variations as well as possible external disturbances which, if detected, would lead to errors of measurement.
- a first ideal characteristic period is defined, distinct from the parasitic oscillations of low amplitude constituting noise, which determines the first zero crossing of the characteristic oscillations O c of the received signal S 2 .
- This ideal period is characterized by an amplitude ratio ⁇ between the amplitudes of the maximum values Pi- and Pi + of the negative and positive lobes of this ideal period.
- the amplitudes of the maximum values P- and P + of the negative lobes and for each period of the received acoustic signal sampled and digitized are determined. positive for the period under review. For this, it is not necessary to examine all of the sampled points of the period, and the determination of the maximum values (in absolute value) P- and P + of the negative and positive lobes of the period examined can be made by a search in the simple vicinity of these extremums.
- the first measurement is carried out by normally sampling the acoustic signal received, then the second measurement is carried out on the second acoustic signal by phase shifting the sampling signal with respect to said second acoustic signal by a determined value 1 / 2Fe .
- the period examined is considered as a parasitic period corresponding to noise, and the analysis is continued over the following period.
- the period examined is considered to be a characteristic period.
- This zero crossing considered as the first passage at significant zero of the characteristic oscillations of the acoustic signal received can advantageously be the zero crossing located between the two positive lobes and negative of the characteristic period.
- FIG. 5 shows a first characteristic oscillation O ca of period ⁇ T with a positive lobe whose amplitude has a maximum value P + and a negative lobe whose amplitude has a maximum value in absolute value P-.
- the zero crossing associated with this period ⁇ T of a first characteristic oscillation O ca defines a zero crossing time corresponding to a time T 7 .
- the amplitude ratio between the amplitudes of the maximum values P- and P + of the two lobes of an examined period of the acoustic signal received constitutes a comparison criterion independent of the nature of the gas. So the aging of electronics can cause gain variations that will not affect this ratio amplitude between the maximum amplitudes P- and P +. Shape recognition of the acoustic signal received can thus be carried out in a simple manner, which limits the energy consumption, since the comparison is made only between maximum amplitudes P- and P + of the lobes and a theoretical amplitude ratio ⁇ between the maximum amplitudes Pi- and Pi + of the two lobes of a period ideal feature.
- the theoretical amplitude ratio ⁇ is determined beforehand from an average, for several different gases and at different flow rates, of the ratio between the maximum amplitudes P- and P + of the characteristic period observed at from the recording of acoustic signals received.
- the comparison between the ratio of the amplitudes P- and P + of the period examined and the corresponding amplitude ratio of the ideal period is carried out by calculating a similarity criterion G which constitutes the result of the comparison compared to the threshold value G s , which is defined as follows:
- the reference theoretical amplitude ratio ⁇ is not affected by the nature of the gas or the gain of the amplification chain of the received signal. This helps to facilitate measures.
- the criterion of resemblance can be made slightly dependent on the amplitude P-.
- a comparison between the ratio of the amplitudes P- and P + of the period examined and the corresponding ratio of amplitudes of the ideal period is carried out by calculating a similarity criterion G which constitutes the result of the comparison compared to the threshold value G s , and which is defined as follows: where z represents an offset term intended to make the likeness criterion G slightly dependent on the amplitude of the maximum value (P-) of the negative lobe of the characteristic period examined.
- the denominator of criterion G is greatly reduced when the amplitude P- is close to the shift term z. If the offset term z has a value slightly higher than the maximum amplitude of the noise (for example of the order of 0.20 to 0.25 Volt), this makes it possible to perform more quickly a rejection of the parasitic periods of the received signal.
- the families of curves 111 and 121 in FIG. 6 were obtained by varying the phase shift between the sampling frequency and the signal and by applying a gain factor varying between 0.45 and 1.5 , the gases taken into account being methane and a mixture of 20% carbon dioxide and 80% nitrogen, the measurements having been made at zero flow rate and at 7m 3 / hour.
- the networks of curves 111 and 121 make it possible to choose the values of the shift term z and of the threshold value G s as a function of the desired safety margin on these values. If we consider Figure 6, we see that we can choose for G s for example a value between about 0.7 and 1.7 V and, for the term of offset z, for example a value between 0.21 and 0.25 V.
- the comparison between the ratio of the amplitudes P- and P + of the period examined and the corresponding ratio of amplitudes of the ideal period is carried out by calculating a similarity criterion G which constitutes the result of the comparison compared to the threshold value G s , and which is defined as follows: where z represents an offset term intended to make the likeness criterion G slightly dependent on the amplitude of the maximum value (P-) of the negative lobe of the characteristic period examined, and z 'represents an offset term intended to render the similarity criterion G slightly dependent on the amplitude of the maximum value (P +) of the positive lobe of the characteristic period examined.
- two or three calculations of the likeness criterion G are carried out with values of the ratio of amplitudes ⁇ different close to the ratio d '' predetermined theoretical amplitude and not deviating from it by more than 10%, in that the period examined is considered to be a characteristic period if the calculated similarity criterion G is in all cases less than the value of threshold G s .
- Figure 7 is a flowchart showing an example of a implementation of the method according to the invention.
- the sampled signal will have 8 points per period of the received signal.
- step 202 the next local minimum (of amplitude P-).
- step 202 if we apply a similarity criterion G involving a shift term z, we only retain the first local minimum whose amplitude P- is greater in absolute value at the offset term z.
- step 203 which consists in looking for neighborhood of a previous half-period T / 2, the value of the maximum amplitude P +.
- the value of the likeness criterion G is calculated with the previously found values of minimum P- and maximum P + of the period examined which presents at least a minimum whose absolute value is greater than the z offset term.
- step 205 a comparison test is carried out between the value of the criterion G calculated and the threshold value G s .
- G ⁇ G s for the period examined this is considered to be a characteristic period and we pass to a step 206 of determining the next zero crossing of the amplitude of the received signal which will constitute the zero crossing situated between the maximum local P + and the local minimum P- and will therefore be the true starting point for the characteristic oscillations O c of the acoustic signal received.
Landscapes
- Physics & Mathematics (AREA)
- Electromagnetism (AREA)
- Fluid Mechanics (AREA)
- General Physics & Mathematics (AREA)
- Measuring Volume Flow (AREA)
- Investigating Or Analyzing Materials By The Use Of Ultrasonic Waves (AREA)
- Measurement Of Mechanical Vibrations Or Ultrasonic Waves (AREA)
Description
La présente invention a pour objet un procédé de mesure du temps de propagation d'un signal acoustique dans un écoulement de fluide entre un premier transducteur jouant le rôle d'émetteur et un second transducteur jouant le rôle de récepteur et situé à une distance déterminée du premier transducteur, le signal acoustique émis par le premier transducteur étant constitué par au moins une impulsion émise à une fréquence acoustique déterminée Fa et le signal acoustique reçu par le second transducteur comprenant une série d'oscillations caractéristiques dont l'amplitude est d'abord croissante sur plusieurs périodes, puis décroissante sur plusieurs périodes suivantes, l'enveloppe des oscillations caractéristiques présentant la forme d'un fuseau, le procédé consistant à échantillonner le signal acoustique reçu, à une fréquence d'échantillonnage Fe, à numériser le signal acoustique reçu échantillonné, et à rechercher, par analyse du signal acoustique reçu échantillonné et numérisé, le premier passage à zéro significatif des oscillations caractéristiques du signal acoustique reçu.The subject of the present invention is a method for measuring the time of propagation of an acoustic signal in a fluid flow between a first transducer playing the role of transmitter and a second transducer playing the role of receiver and located at a determined distance from the first transducer, the signal acoustic emitted by the first transducer consisting of at least one pulse emitted at a determined acoustic frequency Fa and the acoustic signal received by the second transducer comprising a series of oscillations characteristics whose amplitude is first increasing over several periods, then decreasing over several following periods, the envelope of characteristic oscillations having the shape of a spindle, the method consisting in sampling the acoustic signal received, at a sampling frequency Fe, to digitize the signal acoustic received sampled, and to be sought, by analysis of the acoustic signal receipt sampled and digitized, the first significant zero crossing of characteristic oscillations of the acoustic signal received.
Il est connu depuis de nombreuses années de mesurer le débit d'un fluide (ou son volume) s'écoulant dans une conduite en utilisant la propagation des signaux acoustiques émis entre deux transducteurs acoustiques situés en des points espacés dans la direction de l'écoulement du fluide. En principe, un signal acoustique émis du premier transducteur vers le second transducteur est reçu par ce second transducteur et le temps de propagation Td de ce signal acoustique est mesuré. De même, on mesure le temps de propagation Tu d'un signal acoustique émis du second transducteur vers le premier transducteur après réception dudit signal par ce premier transducteur.It has been known for many years to measure the flow of a fluid (or its volume) flowing in a pipe using the propagation of acoustic signals emitted between two acoustic transducers located at points spaced in the direction of fluid flow. In principle, a signal acoustic emitted from the first transducer to the second transducer is received by this second transducer and the propagation time Td of this acoustic signal is measured. Similarly, the propagation time Tu of an acoustic signal is measured transmitted from the second transducer to the first transducer after reception of said signal by this first transducer.
Dans un compteur de fluide, le débit peut être obtenu en combinant une mesure des temps de propagation des deux signaux acoustiques émis entre les deux points dans des directions opposées avec une mesure des déphasages acoustiques induits dans chaque signal acoustique par la propagation de chacun des signaux acoustiques dans l'écoulement. La demande de brevet européen n° 0 426 309 décrit un exemple d'un tel système de mesure de débit, dans lequel le signal reçu est échantillonné et converti numériquement, la mesure du déphasage acoustique étant effectuée en réalisant une détection synchrone du signal numérisé.In a fluid meter, the flow can be obtained by combining a measurement of the propagation times of the two acoustic signals emitted between the two points in opposite directions with a measurement of phase shifts acoustic induced in each acoustic signal by the propagation of each acoustic signals in the flow. European patent application no. 0 426 309 describes an example of such a flow measurement system, in which the received signal is sampled and digitally converted, measurement of phase shift acoustic being performed by performing synchronous signal detection scanned.
Lors de la mesure de la vitesse d'écoulement d'un gaz dans un compteur de gaz utilisant deux transducteurs ultrasonores, il est nécessaire de mesurer le temps de parcours de l'onde ultrasonore entre l'instant d'émission et l'instant de réception, dès lors que la célérité des ondes ultrasonores est dépendante de la nature du gaz.When measuring the flow rate of a gas in a meter gas using two ultrasonic transducers, it is necessary to measure the travel time of the ultrasonic wave between the instant of emission and the instant of reception, since the speed of the ultrasonic waves is dependent on the nature of the gas.
On a représenté sur la Figure 2 la forme d'un signal impulsionnel rectangulaire S1 de largeur T émis à un instant T0 par un premier transducteur ultrasonore disposé dans le flux d'écoulement d'un fluide en un premier point, et la forme du signal S2 constituant la réponse impulsionnelle reçue en écho à un instant T1 par un deuxième transducteur ultrasonore disposé dans le flux d'écoulement du fluide en un deuxième point distinct du premier point.FIG. 2 shows the form of a rectangular pulse signal S 1 of width T emitted at an instant T 0 by a first ultrasonic transducer disposed in the flow of a fluid at a first point, and the shape of the signal S 2 constituting the impulse response received in echo at an instant T 1 by a second ultrasonic transducer arranged in the flow of the fluid at a second point distinct from the first point.
Le signal acoustique S2 reçu par le second transducteur est constitué par une série d'oscillations caractéristiques Oc qui augmentent d'amplitude sur plusieurs périodes puis décroissent, l'enveloppe des oscillations caractéristiques présentant la forme d'un fuseau. Les oscillations caractéristiques Oc du signal S2 sont précédées et suivies d'oscillations parasites Op de faible amplitude. Pour déterminer l'instant T1 de début des oscillations caractéristiques, il convient de repérer le premier passage à zéro significatif des oscillations caractéristiques Oc du signal acoustique reçu S2.The acoustic signal S 2 received by the second transducer consists of a series of characteristic oscillations O c which increase in amplitude over several periods then decrease, the envelope of the characteristic oscillations having the shape of a spindle. The characteristic oscillations O c of the signal S 2 are preceded and followed by parasitic oscillations O p of low amplitude. To determine the instant T 1 at the start of the characteristic oscillations, the first significant zero crossing of the characteristic oscillations O c of the received acoustic signal S 2 should be identified .
On a représenté sur la Figure 3, à une échelle plus grande que sur la Figure 2, un exemple de signal acoustique S2 reçu en écho à une impulsion rectangulaire S1 émise à une fréquence acoustique déterminée Fa.FIG. 3 shows, on a larger scale than in FIG. 2, an example of an acoustic signal S 2 received as an echo of a rectangular pulse S 1 emitted at a determined acoustic frequency Fa.
Pour déterminer le début des oscillations caractéristiques Oc, selon un procédé connu, on fixe une tension de seuil VS, par rapport à laquelle on compare le niveau du signal acoustique reçu S2, la comparaison s'effectuant sur un signal numérique obtenu après échantillonnage du signal acoustique analogique reçu, à une fréquence d'échantillonnage Fe qui constitue par exemple un multiple de la fréquence acoustique Fa.To determine the start of the characteristic oscillations O c , according to a known method, a threshold voltage V S is fixed, with respect to which the level of the acoustic signal received S 2 is compared, the comparison being carried out on a digital signal obtained after sampling of the received analog acoustic signal, at a sampling frequency Fe which constitutes for example a multiple of the acoustic frequency Fa.
Dans ce cas, on repère l'instant T2 auquel l'amplitude du signal reçu franchit la tension de seuil VS, puis on identifie l'instant du passage à zéro précédent (ou suivant) que l'on considère comme l'instant T1 de départ des oscillations caractéristiques Oc du signal acoustique reçu S2.In this case, we identify the instant T 2 at which the amplitude of the received signal crosses the threshold voltage V S , then we identify the instant of the previous (or next) zero crossing that we consider to be the instant T 1 for the start of the characteristic oscillations O c of the acoustic signal received S 2 .
Une telle méthode de mesure peut conduire à des erreurs dès lors que les oscillations caractéristiques Oc du signal acoustique reçu S2 peuvent être plus ou moins amplifiées en fonction de la nature du gaz. Ainsi, on a représenté sur la Figure 4 une courbe S21 qui correspond à la forme d'un signal acoustique reçu pour de l'azote (N2) et une courbe S22 qui correspond à la forme d'un signal acoustique reçu pour un mélange de gaz carbonique et de méthane (CO2/CH4). On constate que la courbe S21 franchit la tension de seuil VS à un instant T4 qui déclenche l'identification du passage à zéro précédent à un instant T3 qui est considéré à juste titre comme la marque du début des oscillations caractéristiques Oc. En revanche, on peut constater que la courbe S22, qui est en phase avec la courbe S21, franchit la tension de seuil VS à un instant T6 postérieur à l'instant T4 et décalé par rapport à celui-ci de la valeur d'une période TR du signal reçu. L'instant T5 identifié alors pour la courbe S22 comme le point de passage à zéro précédant immédiatement le franchissement de seuil à l'instant T6, est alors considéré comme la marque du début des oscillations caractéristiques Oc de la courbe S22. Or, comme on peut le voir sur la Figure 4, la courbe S22 présente un lobe négatif qui ne vient qu'affleurer la valeur de la tension de seuil Vs sans atteindre ou franchir ce seuil.Such a measurement method can lead to errors as soon as the characteristic oscillations O c of the acoustic signal received S 2 can be more or less amplified depending on the nature of the gas. Thus, FIG. 4 shows a curve S 21 which corresponds to the shape of an acoustic signal received for nitrogen (N 2 ) and a curve S 22 which corresponds to the shape of an acoustic signal received for a mixture of carbon dioxide and methane (CO 2 / CH 4 ). It can be seen that the curve S 21 crosses the threshold voltage V S at an instant T 4 which triggers the identification of the preceding zero crossing at an instant T 3 which is rightly considered to be the mark of the start of the characteristic oscillations O c . On the other hand, it can be seen that the curve S 22 , which is in phase with the curve S 21 , crosses the threshold voltage V S at an instant T 6 posterior to the instant T 4 and offset with respect to the latter by the value of a period T R of the received signal. The instant T 5 then identified for the curve S 22 as the zero crossing point immediately preceding the crossing of the threshold at the instant T 6 , is then considered to be the mark of the start of the characteristic oscillations O c of the curve S 22 . However, as can be seen in FIG. 4, the curve S 22 has a negative lobe which only comes to be flush with the value of the threshold voltage V s without reaching or crossing this threshold.
Par suite des atténuations ou amplifications du signal reçu S2, qui varient en fonction de la nature du gaz, la méthode classique de mesure du temps du premier passage à zéro des oscillations caractéristiques du signal reçu peut engendrer une erreur de plus ou moins une période qui fait diminuer de façon significative la précision des mesures.As a result of the attenuations or amplifications of the received signal S 2 , which vary according to the nature of the gas, the conventional method of measuring the time of the first zero crossing of the oscillations characteristic of the received signal can generate an error of more or less a period which significantly reduces the accuracy of the measurements.
L'invention vise à remédier aux inconvénients précités et à permettre de diminuer la sensibilité du procédé de mesure du temps de passage à zéro d'un signal acoustique reçu, vis-à-vis des variations de formes d'onde de ce signal ainsi que vis-à-vis d'éventuelles perturbations extérieures susceptibles d'être détectées par une simple méthode de surveillance de franchissement de seuil, et qui pourraient engendrer des mesures erronées.The invention aims to remedy the aforementioned drawbacks and to allow decrease the sensitivity of the zero crossing time measurement process by one acoustic signal received, with respect to variations in waveforms of this signal as well that vis-à-vis any external disturbances likely to be detected by a simple threshold crossing monitoring method, and which could cause erroneous measurements.
Ces buts sont atteints, conformément à l'invention, grâce à un procédé de mesure du temps de propagation d'un signal acoustique dans un écoulement de fluide entre un premier transducteur jouant le rôle d'émetteur et un second transducteur jouant le rôle de récepteur et situé à une distance déterminée du premier transducteur, le signal acoustique émis par le premier transducteur étant constitué par au moins une impulsion émise à une fréquence acoustique déterminée Fa et le signal acoustique reçu par le second transducteur comprenant une série d'oscillations caractéristiques dont l'amplitude est d'abord croissante sur plusieurs périodes, puis décroissante sur plusieurs périodes suivantes, l'enveloppe des oscillations caractéristiques présentant la forme d'un fuseau, le procédé consistant à échantillonner le signal acoustique reçu, à une fréquence d'échantillonnage Fe, à numériser le signal acoustique reçu échantillonné, et à rechercher, par analyse du signal acoustique reçu échantillonné et numérisé, le premier passage à zéro significatif des oscillations caractéristiques du signal acoustique reçu, caractérisé en ce que, pour rechercher le premier passage à zéro significatif des oscillations caractéristiques du signal acoustique reçu, on définit au préalable une première période caractéristique idéale déterminant le premier passage par zéro des oscillations caractéristiques du signal acoustique reçu, en caractérisant cette période idéale par un rapport d'amplitudes théorique Δ entre les amplitudes maximales Pi- et Pi+ des deux lobes de cette période, on détermine pour chaque période du signal acoustique reçu échantillonné et numérisé, les amplitudes maximales P- et P+ des deux lobes de la période examinée, on compare le rapport de ces amplitudes P- et P+ au rapport d'amplitudes théorique correspondant de la période idéale puis, si le résultat de la comparaison est supérieur à une valeur de seuil GS, on considère la période examinée comme une période parasite correspondant à du bruit tandis que, si le résultat de la comparaison est inférieur à cette valeur de seuil GS, on considère la période examinée comme une période caractéristique et on détermine alors le passage par zéro entre deux lobes de cette période caractéristique, lequel passage à zéro est considéré comme le premier passage à zéro significatif des oscillations caractéristiques du signal acoustique reçu.These aims are achieved, in accordance with the invention, by a method of measuring the propagation time of an acoustic signal in a fluid flow between a first transducer playing the role of transmitter and a second transducer playing the role of receiver and located at a determined distance from the first transducer, the acoustic signal emitted by the first transducer consisting of at least one pulse emitted at a determined acoustic frequency Fa and the acoustic signal received by the second transducer comprising a series of characteristic oscillations of which l the amplitude is first increasing over several periods, then decreasing over several following periods, the envelope of the characteristic oscillations having the shape of a spindle, the method consisting in sampling the acoustic signal received, at a sampling frequency Fe, to digitize the acoustic signal received sampled, and to search, per year analysis of the sampled and digitized received acoustic signal, the first significant zero crossing of the characteristic oscillations of the received acoustic signal, characterized in that, in order to find the first significant zero crossing of the oscillations characteristic of the received acoustic signal, a first is defined beforehand ideal characteristic period determining the first zero crossing of the characteristic oscillations of the acoustic signal received, by characterizing this ideal period by a theoretical amplitude ratio Δ between the maximum amplitudes Pi- and Pi + of the two lobes of this period, we determine for each period of the received acoustic signal sampled and digitized, the maximum amplitudes P- and P + of the two lobes of the period examined, the ratio of these amplitudes P- and P + is compared with the corresponding theoretical amplitude ratio of the ideal period then, if the result of the comparison is greater than one e threshold value G S , the period examined is considered as a parasitic period corresponding to noise while, if the result of the comparison is less than this threshold value G S , the period examined is considered to be a characteristic period and then determines the zero crossing between two lobes of this characteristic period, which zero crossing is considered to be the first significant zero crossing of the characteristic oscillations of the acoustic signal received.
Le rapport d'amplitudes théorique Δ entre les amplitudes maximales Pi-et Pi+ des deux lobes de ladite période idéale est déterminé au préalable à partir d'une moyenne, pour plusieurs gaz différents et à différents débits, du rapport entre les amplitudes maximales P- et P+ de la période caractéristique observée à partir de l'enregistrement de signaux acoustiques reçus.The theoretical amplitude ratio Δ between the maximum amplitudes Pi-and Pi + of the two lobes of said ideal period is determined beforehand from an average, for several different gases and at different flow rates, of the ratio between the maximum amplitudes P- and P + of the characteristic period observed at from the recording of acoustic signals received.
Le rapport d'amplitude Δ entre les amplitudes maximales Pi- et Pi+ des deux lobes de la première période caractéristique idéale d'un signal acoustique reçu est quasi constant en fonction de la nature des gaz et est indépendant d'un facteur de gain. Le choix d'un critère de comparaison basé sur ce rapport Δ permet de diminuer très fortement la dépendance de la mesure à la nature du gaz, et donc d'améliorer la précision et la fiabilité des mesures.The amplitude ratio Δ between the maximum amplitudes Pi- and Pi + of two lobes of the first ideal characteristic period of an acoustic signal received is almost constant depending on the nature of the gases and is independent of a gain factor. The choice of a comparison criterion based on this Δ ratio allows to greatly reduce the dependence of the measure on the nature of the gas, and therefore improve the accuracy and reliability of the measurements.
Selon un premier mode de réalisation de l'invention, la comparaison entre
le rapport des amplitudes P- et P+ de la période examinée et le rapport
d'amplitudes théorique Δ correspondant de la période idéale s'effectue en calculant
un critère de ressemblance G qui constitue le résultat de la comparaison comparé à
la valeur de seuil GS, et qui est défini de la façon suivante :

Selon un deuxième mode de réalisation de l'invention, la comparaison
entre le rapport des amplitudes P- et P+ de la période examinée et le rapport
d'amplitudes théorique Δ correspondant de la période idéale s'effectue en calculant
un critère de ressemblance G qui constitue le résultat de la comparaison comparé à
la valeur de seuil Gs, et qui est défini de la façon suivante :

Selon ce deuxième mode de réalisation, on limite les risques de pouvoir détecter des formes d'ondes ressemblant au critère de ressemblance ou gabarit G, qui seraient noyées dans du bruit.According to this second embodiment, the risks of power are limited detect waveforms resembling the likeness criterion or G template, who would be drowned in noise.
Pour réduire encore la probabilité de détecter des périodes ressemblantes
de faible amplitude, selon un troisième mode de réalisation de l'invention, la
comparaison entre le rapport des amplitudes P- et P+ de la période examinée et le
rapport d'amplitudes théorique correspondant de la période idéale s'effectue en
calculant un critère de ressemblance G qui constitue le résultat de la comparaison
comparé à la valeur de seuil Gs, et qui est défini de la façon suivante :
Afin d'éviter des erreurs dans la détermination des amplitudes maximales P- et P+ des deux lobes de chaque période examinée, erreurs qui peuvent être dues à un déphasage existant entre le signal acoustique reçu et le signal d'échantillonnage, on peut utiliser un algorithme d'approximation du maximum (en valeur absolue) à partir des points échantillonnés au voisinage de chaque maximum en vue d'obtenir une meilleure précision sur les valeurs P- et P+. Toujours pour éviter ces mêmes erreurs, lorsque le signal acoustique reçu est répétable, on effectue plusieurs mesures successives respectivement sur plusieurs signaux acoustiques consécutifs, en déphasant pour chaque signal acoustique le signal d'échantillonnage par rapport au signal acoustique considéré, afin d'obtenir plusieurs points échantillonnés décalés au voisinage du maximum.In order to avoid errors in determining the maximum amplitudes P- and P + of the two lobes of each period examined, errors which may be due to a phase difference existing between the acoustic signal received and the signal sampling, we can use a maximum approximation algorithm (in absolute value) from the points sampled in the vicinity of each maximum in order to obtain better precision on the P- and P + values. Always to avoid these same errors, when the acoustic signal received is repeatable, several successive measurements are made respectively on several consecutive acoustic signals, by phase shifting for each acoustic signal the sampling signal with respect to the acoustic signal considered, in order to obtain several sampled points shifted near the maximum.
Selon une variante de réalisation permettant également de réduire la probabilité de détecter des périodes ressemblantes de faible amplitude, on effectue, pour chaque période examinée, deux ou trois calculs du critère de ressemblance G avec des valeurs du rapport d'amplitudes théorique différentes voisines du rapport d'amplitude théorique prédéterminé et ne s'écartant pas de celle-ci de plus de 10%, et l'on considère la période examinée comme une période caractéristique si le critère de ressemblance calculé G est dans tous les cas inférieur à la valeur de seuil Gs.According to an alternative embodiment also making it possible to reduce the probability of detecting similar periods of small amplitude, two or three calculations of the similarity criterion G are carried out for each period examined, with values of the ratio of different theoretical amplitudes close to the ratio of predetermined theoretical amplitude and not deviating from it by more than 10%, and the period examined is considered to be a characteristic period if the calculated likeness criterion G is in all cases less than the value of threshold G s .
Pour déterminer la valeur de seuil Gs du critère de ressemblance G, ainsi que la valeur du terme de décalage z, on trace au préalable, pour différents gaz et différents débits, en faisant varier le déphasage entre la fréquence d'échantillonnage Fe et le signal acoustique reçu et en appliquant un facteur de gain variant entre 0,45 et 1,5, un réseau de premières courbes représentant les valeurs maximums du critère de ressemblance G pour les périodes caractéristiques observées et un réseau de deuxièmes courbes représentant les valeurs minimums du critère de ressemblance G pour les périodes parasites observées, en fonction de différentes valeurs possibles du terme de décalage z, et on choisit la valeur de seuil Gs et celle du terme de décalage z en fonction de la marge de sécurité possible dans la zone intermédiaire entre le réseau de premières courbes et le réseau de deuxièmes courbes.To determine the threshold value G s of the likeness criterion G, as well as the value of the shift term z, we plot beforehand, for different gases and different flow rates, by varying the phase shift between the sampling frequency Fe and the acoustic signal received and by applying a gain factor varying between 0.45 and 1.5, a network of first curves representing the maximum values of the likeness criterion G for the characteristic periods observed and a network of second curves representing the minimum values of the similarity criterion G for the parasitic periods observed, as a function of different possible values of the offset term z, and the threshold value G s and that of the offset term z are chosen as a function of the possible safety margin in the intermediate zone between the network of first curves and the network of second curves.
A titre d'exemple, la valeur de seuil Gs peut être comprise entre 0,7 et 1,7 et la valeur du terme de décalage z peut être comprise entre 0,21 et 0,25 V.For example, the threshold value G s can be between 0.7 and 1.7 and the value of the offset term z can be between 0.21 and 0.25 V.
L'invention est avantageusement applicable à un procédé de mesure de la vitesse d'écoulement d'un fluide entre deux transducteurs disposés en des points de mesure espacés dans la direction d'un écoulement du fluide selon lequel la valeur de la vitesse d'écoulement à mesurer est obtenue en combinant une mesure des temps de propagation respectifs de chacun des deux signaux acoustiques émis entre les deux points dans des sens opposés par les transducteurs avec une mesure des déphasages acoustiques respectivement induits dans chaque signal acoustique par la propagation de chacun desdits signaux acoustiques dans l'écoulement, la mesure des temps de propagation respectifs de chacun des deux signaux acoustiques émis entre les deux points de mesure étant effectuée conformément au procédé selon la présente invention. The invention is advantageously applicable to a method for measuring the speed of flow of a fluid between two transducers arranged at points of measurement spaced in the direction of a fluid flow whereby the value of the flow velocity to be measured is obtained by combining a measurement of the respective propagation times of each of the two acoustic signals emitted between the two points in opposite directions by the transducers with a measurement acoustic phase shifts respectively induced in each acoustic signal by the propagation of each of said acoustic signals in the flow, the measurement of the respective propagation times of each of the two signals acoustic emissions between the two measurement points being carried out in accordance with method according to the present invention.
D'autres caractéristiques et avantages de l'invention ressortiront de la description suivante de modes particuliers de réalisation, faite en référence aux dessins annexés, sur lesquels :
- la Figure 1 est une représentation, sous la forme d'un schéma-bloc, de l'ensemble d'un dispositif de comptage de gaz connu auquel est applicable la présente invention ;
- la Figure 2 est un diagramme montrant le principe d'une méthode connue de détermination du temps de propagation d'un signal acoustique dans un milieu fluide ;
- la Figure 3 est un diagramme agrandi d'une partie de la Figure 2 montrant le principe d'une méthode connue de détermination du temps de propagation d'un signal acoustique par comparaison du signal reçu avec une valeur de seuil ;
- la Figure 3a est un diagramme analogue à celui de la Figure 3 montrant la façon dont on opère sur un signal échantillonné, selon une méthode connue de détermination du temps de propagation d'un signal acoustique par passage à zéro ;
- la Figure 4 est un ensemble de deux diagrammes analogues à celui de la Figure 3 montrant les risques d'erreur dans une méthode connue de détermination du temps de propagation d'un signal acoustique faisant appel à une comparaison des signaux reçus avec une valeur de seuil ;
- la Figure 5 est un diagramme montrant le principe de mise en oeuvre du procédé selon l'invention pour la détermination du temps de propagation d'un signal acoustique dans un milieu fluide ; et
- la Figure 6 est un diagramme comportant des familles de courbes permettant de choisir des valeurs de paramètres utiles pour la mise en oeuvre du procédé selon l'invention.
- la Figure 7 est un organigramme montrant un exemple des différentes étapes du procédé selon l'invention.
- Figure 1 is a representation, in the form of a block diagram, of the assembly of a known gas metering device to which the present invention is applicable;
- Figure 2 is a diagram showing the principle of a known method for determining the propagation time of an acoustic signal in a fluid medium;
- Figure 3 is an enlarged diagram of part of Figure 2 showing the principle of a known method of determining the propagation time of an acoustic signal by comparison of the received signal with a threshold value;
- FIG. 3a is a diagram similar to that of FIG. 3 showing the way in which a sampled signal is operated, according to a known method of determining the propagation time of an acoustic signal by crossing to zero;
- Figure 4 is a set of two diagrams similar to that of Figure 3 showing the risks of error in a known method of determining the propagation time of an acoustic signal using a comparison of the received signals with a threshold value ;
- Figure 5 is a diagram showing the principle of implementation of the method according to the invention for determining the propagation time of an acoustic signal in a fluid medium; and
- FIG. 6 is a diagram comprising families of curves making it possible to choose values of parameters useful for the implementation of the method according to the invention.
- Figure 7 is a flowchart showing an example of the different steps of the method according to the invention.
Différents types de circuits électroniques peuvent être utilisés pour
assurer un comptage de fluide par une méthode de mesure à ultrasons de la vitesse
d'écoulement du fluide. La Figure 1 montre le schéma de principe d'un exemple de
tels circuits électroniques qui sont associés à deux transducteurs ultrasonores 1, 2
disposés à distance l'un de l'autre dans une conduite 3 dans laquelle s'écoule un
fluide tel qu'un gaz. Les deux transducteurs 1, 2 sont reliés à un bloc de
commutation 4 qui comprend deux commutateurs 5, 6 et permet l'utilisation de
chaque transducteur alternativement comme émetteur et récepteur. Un module
d'émission 14 et un module de réception 17 sont reliés respectivement aux
commutateurs 5, 6 du bloc de commutation 4. Le module d'émission 14 comprend
un amplificateur opérationnel 16 et un convertisseur numérique-analogique 15. Le
module de réception 17 comprend au moins un amplificateur 18 et un
convertisseur analogique-numérique 19 qui numérise et échantillonne
simultanément le signal reçu. Une source d'énergie électrique 7 et un module 8 de
gestion de l'alimentation électrique sont reliés notamment aux modules d'émission
14 et de réception 17 ainsi qu'au bloc de commutation 4 et à un microcontrôleur
10. Le microcontrôleur 10 comprend notamment une horloge à quartz 9, une unité
arithmétique et logique, des circuits de mémoire vive et de mémoire morte, et peut
coopérer avec des circuits d'affichage 13, une mémoire morte réinscriptible 12 et
une liaison série 11 du type RS 232.Different types of electronic circuits can be used to
ensure fluid counting by an ultrasonic speed measurement method
fluid flow. Figure 1 shows the block diagram of an example of
such electronic circuits which are associated with two
Les compteurs de gaz destinés à équiper chaque abonné d'un réseau de distribution doivent être à la fois précis, fiables et le meilleur marché possible. Ces contraintes imposent d'éviter l'utilisation de composants coûteux, de mettre en oeuvre de petites piles d'alimentation de longue durée mais de capacité moyenne pour des raisons de sécurité et d'effectuer des calculs selon un procédé de mesure assurant à la fois une précision et une fiabilité élevées tout en restant suffisamment simple pour être économe en énergie.The gas meters intended to equip each subscriber with a network of distribution must be precise, reliable and as inexpensive as possible. These constraints make it necessary to avoid the use of expensive components, to uses small, long-life but medium-capacity power batteries for safety reasons and to perform calculations according to a measurement process ensuring both high precision and reliability while remaining simple enough to be energy efficient.
Le procédé de mesure selon l'invention qui sera explicité plus loin est ainsi avantageusement appliqué à un dispositif de mesure de la vitesse d'écoulement d'un fluide gazeux, permettant d'assurer le comptage de la consommation de ce fluide, en mettant en oeuvre deux transducteurs ultrasonores disposés à distance l'un de l'autre à l'intérieur d'une conduite, dans le sens d'écoulement du fluide. A titre d'exemple, les transducteurs ultrasonores peuvent fonctionner à une fréquence acoustique Fa de l'ordre de 40 kHz et la fréquence d'échantillonnage Fe des signaux acoustiques reçus est avantageusement de 320 kHz, c'est-à-dire huit fois plus élevée que la fréquence Fa.The measurement method according to the invention which will be explained below is thus advantageously applied to a speed measuring device flow of a gaseous fluid, enabling counting of the consumption of this fluid, using two ultrasonic transducers arranged at a distance from each other inside a pipe, in the direction fluid flow. For example, ultrasonic transducers can operate at an acoustic frequency Fa of the order of 40 kHz and the frequency sampling Fe of the acoustic signals received is advantageously 320 kHz, that is to say eight times higher than the frequency Fa.
La fréquence d'échantillonnage Fe est avantageusement égale à un multiple de la fréquence acoustique Fa. Toutefois, la fréquence Fe peut également prendre d'autres valeurs. Lorsque les valeurs (multiples de Fa ou non multiples) de Fe sont trop basses, il est préférable d'utiliser par exemple un algorithme d'approximation au voisinage du maximum (en valeur absolue) de chaque période du signal acoustique, voire d'effectuer plusieurs mesures successives en déphasant à chaque nouvelle mesure le signal d'échantillonnage par rapport au signal acoustique considéré, ceci afin d'obtenir une plus grande précision sur les valeurs des amplitudes maximales (en valeur absolue). Ces méthodes seront détaillées ultérieurement.The sampling frequency Fe is advantageously equal to one multiple of the acoustic frequency Fa. However, the frequency Fe can also take other values. When the values (multiples of Fa or not multiples) of Fe are too low, it is better to use for example an algorithm approximation near the maximum (in absolute value) of each period of the acoustic signal, or even to carry out several successive measurements by phase shifting each new measurement the sampling signal with respect to the signal acoustics considered, this in order to obtain greater precision on the values maximum amplitudes (in absolute value). These methods will be detailed later.
Lorsque les valeurs de Fe sont suffisamment élevées l'emploi de telles méthodes n'est pas nécessaire.When the Fe values are high enough the use of such methods is not necessary.
Le signal acoustique émis par chaque transducteur est constitué par
exemple par une impulsion émise à la fréquence acoustique déterminée Fa. Cette
impulsion est par exemple rectangulaire.
Plusieurs impulsions pourraient également être émises.The acoustic signal emitted by each transducer is constituted for example by a pulse emitted at the determined acoustic frequency Fa. This pulse is for example rectangular.
Several pulses could also be emitted.
D'une manière générale, le débit de fluide dans une conduite peut
s'écrire :
- S
- désigne la section moyenne de passage offerte à l'écoulement entre les deux transducteurs acoustiques,
- L
- désigne la distance séparant les transducteurs,
- Td
- est le temps de propagation du signal acoustique émis dans le sens de l'écoulement par le premier transducteur (amont) jusqu'à la réception de ce signal acoustique par le second transducteur (aval),
- Tu
- est le temps de propagation du signal acoustique émis dans le sens contraire de l'écoulement par le second transducteur, jusqu'à la réception de ce signal acoustique par le premier transducteur (amont).
- S
- denotes the average passage section offered to the flow between the two acoustic transducers,
- The
- denotes the distance between the transducers,
- td
- is the propagation time of the acoustic signal emitted in the direction of flow by the first transducer (upstream) until the reception of this acoustic signal by the second transducer (downstream),
- You
- is the propagation time of the acoustic signal emitted in the opposite direction of the flow by the second transducer, until the reception of this acoustic signal by the first transducer (upstream).
Si la mesure de ce débit fait en outre intervenir une mesure des
déphasages acoustiques induits dans chaque signal acoustique par la propagation
de chacun des signaux acoustiques émis par les transducteurs dans l'écoulement, le
débit de fluide dans une conduite peut s'écrire :
De façon plus particulière, les temps de propagation Tu et Td peuvent
s'écrire respectivement :
Pour une composition de gaz donnée, comme la vitesse de propagation c dépend principalement de la température qui varie peu lors des mesures de débit, le terme Tu.Td lui aussi varie peu et ce terme peut être recalculé avec une fréquence relativement faible. Toutefois, dès lors qu'il s'agit de la mesure absolue des temps de propagation, la précision obtenue pour cette mesure est directement reportée sur la précision de mesure du débit. Ainsi, il est essentiel d'éviter d'avoir un décalage sur cette mesure.For a given gas composition, such as the propagation speed c mainly depends on the temperature which varies little during flow measurements, the term Tu.Td also varies little and this term can be recalculated with a relatively low frequency. However, since this is the absolute measure propagation times, the precision obtained for this measurement is directly reported on the flow measurement accuracy. So it is essential to avoid having an offset on this measurement.
Par exemple, si la précision recherchée sur le débit est de 1%, la précision sur la mesure des temps de propagation doit être voisine de 0,5%, ce qui correspond à une erreur inférieure à 2 µs sur les temps de propagation avec les gaz courants et les longueurs usuelles L entre deux transducteurs (exemple : L = 150 mm et le gaz étant du méthane).For example, if the accuracy sought on the flow rate is 1%, the accuracy on the measurement of the propagation times must be close to 0.5%, which corresponds to an error of less than 2 µs on the propagation times with gases currents and the usual lengths L between two transducers (example: L = 150 mm and the gas being methane).
Selon un procédé de mesure des temps de propagation Tu et Td, connu sous le nom de méthode de passage à zéro, on mesure les temps de propagation (Tu pz) et (Td pz) des signaux acoustiques émis par chacun des transducteurs jusqu'à la détection par passage à zéro et on en déduit les temps de propagation réels Tu et Td, avec Tu = (Tu pz - To) et Td = (Td pz - To) où To désigne une constante à retrancher pour obtenir le temps de propagation dans le gaz, To ne dépendant que de la nature des transducteurs et des circuits électroniques.According to a known method of measuring the propagation times Tu and Td under the name of zero crossing method, we measure the propagation times (Tu pz) and (Td pz) acoustic signals emitted by each of the transducers until detection by zero crossing and we deduce the propagation times real Tu and Td, with Tu = (Tu pz - To) and Td = (Td pz - To) where To denotes a constant to be subtracted to obtain the propagation time in the gas, To ne depending only on the nature of the transducers and electronic circuits.
La Figure 3a illustre la méthode de mesure par passage à zéro effectuée sur chaque signal ultrasonore reçu selon un procédé connu, en liaison avec un dispositif tel que celui de la Figure 1.Figure 3a illustrates the zero crossing measurement method performed on each ultrasonic signal received according to a known method, in conjunction with a device like that of Figure 1.
Le signal reçu est amplifié par l'amplificateur 18 présentant un gain donné, puis converti en numérique et échantillonné simultanément dans le convertisseur 19. Dans l'exemple considéré, l'échantillonnage est effectué à une fréquence Fe par exemple égale à 8 Fa, soit 320 kHz si Fa vaut 40 kHz.The received signal is amplified by the amplifier 18 having a gain given, then converted to digital and sampled simultaneously in the converter 19. In the example considered, the sampling is carried out at a frequency Fe for example equal to 8 Fa, or 320 kHz if Fa is 40 kHz.
Les instructions permettant d'effectuer les mesures, contenues dans une mémoire morte du microcontrôleur 10, permettent de comparer les valeurs de l'amplitude du signal reçu aux points échantillonnés et qui sont mémorisées dans une mémoire vive, à une valeur prédéterminée correspondant à un seuil Vs, et l'on recherche parmi les valeurs d'amplitude des points échantillonnés le premier point suivant A, qui a une valeur d'amplitude supérieure au seuil.The instructions for carrying out the measurements, contained in a read-only memory of the microcontroller 10, make it possible to compare the values of the amplitude of the signal received at the sampled points and which are stored in a random access memory, with a predetermined value corresponding to a threshold V s , and one searches among the amplitude values of the sampled points for the first point following A, which has an amplitude value greater than the threshold.
A partir de ce point, on recherche le prochain passage par zéro de la courbe représentative du signal ultrasonore. Pour ce faire, on détermine deux points échantillonnés consécutifs B et C qui encadrent le point où l'amplitude de la courbe passe par la valeur zéro et l'on procède par interpolation linéaire entre B et C pour déterminer le point D et donc mesurer le temps de passage à zéro Tpz.From this point, we look for the next zero crossing of the curve representative of the ultrasonic signal. To do this, we determine two consecutive sampled points B and C which frame the point where the amplitude of the curve goes through the value zero and we proceed by linear interpolation between B and C to determine point D and therefore measure the time of zero crossing Tpz.
Selon une variante de réalisation, illustrée sur les Figures 3 et 4 discutées précédemment, il est également possible de rechercher le dernier passage à zéro de la courbe représentative du signal ultrasonore avant que ladite courbe ne passe par le seuil.According to an alternative embodiment, illustrated in Figures 3 and 4 discussed previously, it is also possible to search for the last zero crossing of the curve representative of the ultrasonic signal before said curve passes through the threshold.
La présente invention vise à améliorer cette méthode de détermination d'un temps de propagation de signal par mesure du temps de passage à zéro.The present invention aims to improve this method of determination signal propagation time by measuring the zero crossing time.
Comme on l'a mentionné précédemment en référence aux Figures 3 et 4, la simple comparaison entre les valeurs d'amplitude de tension aux points échantillonnés d'un signal acoustique reçu et une valeur de tension de seuil Vs peut conduire à des erreurs dans la détermination du temps de passage à zéro Tpz et donc dans le temps de propagation du signal acoustique. Si sur la Figure 4 le temps de passage à zéro T3 pour la courbe S21 relative au signal correspondant à un gaz constitué par de l'azote est correct, en revanche le temps de passage à zéro T5 pour la courbe S22 relative au signal correspondant à un gaz constitué par un mélange de dioxyde de carbone et de méthane, est incorrect et excessif.As mentioned previously with reference to FIGS. 3 and 4, the simple comparison between the voltage amplitude values at the sampled points of a received acoustic signal and a threshold voltage value V s can lead to errors in determining the time of zero crossing Tpz and therefore in the propagation time of the acoustic signal. If in Figure 4 the time of zero crossing T 3 for the curve S 21 relative to the signal corresponding to a gas constituted by nitrogen is correct, on the other hand the time of zero crossing T 5 for the curve S 22 relative the signal for a gas consisting of a mixture of carbon dioxide and methane is incorrect and excessive.
Le procédé selon l'invention permet d'éviter ce genre d'erreur et, d'une manière générale, de réduire la sensibilité du procédé de mesure du temps de passage à zéro à des variations de formes d'onde ainsi qu'à des éventuelles perturbations extérieures qui, si elles étaient détectées, engendreraient des erreurs de mesure.The method according to the invention makes it possible to avoid this kind of error and, in general, to reduce the sensitivity of the time measurement process zero crossing for waveform variations as well as possible external disturbances which, if detected, would lead to errors of measurement.
Selon l'invention, pour rechercher le premier passage à zéro significatif des oscillations caractéristiques Oc du signal acoustique reçu S2, on définit au préalable une première période caractéristique idéale, distincte des oscillations parasites de faible amplitude constituant du bruit, qui détermine le premier passage à zéro des oscillations caractéristiques Oc du signal reçu S2. Cette période idéale est caractérisée par un rapport d'amplitude Δ entre les amplitudes des valeurs maximales Pi- et Pi+ des lobes négatif et positif de cette période idéale.According to the invention, in order to find the first significant zero crossing of the characteristic oscillations O c of the acoustic signal received S 2 , a first ideal characteristic period is defined, distinct from the parasitic oscillations of low amplitude constituting noise, which determines the first zero crossing of the characteristic oscillations O c of the received signal S 2 . This ideal period is characterized by an amplitude ratio Δ between the amplitudes of the maximum values Pi- and Pi + of the negative and positive lobes of this ideal period.
Lors de la réception d'un signal acoustique S2 à analyser, qui est échantillonné et numérisé de façon classique, on détermine, pour chaque période du signal acoustique reçu échantillonné et numérisé, les amplitudes des valeurs maximales P- et P+ des lobes négatif et positif de la période examinée. Pour cela, il n'est pas nécessaire d'examiner l'ensemble des points échantillonnés de la période, et la détermination des valeurs maximales (en valeur absolue) P- et P+ des lobes négatif et positif de la période examinée peut être faite par une recherche au simple voisinage de ces extremums.Upon reception of an acoustic signal S 2 to be analyzed, which is sampled and digitized in a conventional manner, the amplitudes of the maximum values P- and P + of the negative lobes and for each period of the received acoustic signal sampled and digitized are determined. positive for the period under review. For this, it is not necessary to examine all of the sampled points of the period, and the determination of the maximum values (in absolute value) P- and P + of the negative and positive lobes of the period examined can be made by a search in the simple vicinity of these extremums.
Cependant, il faut noter qu'il existe un déphasage entre le signal
acoustique reçu et le signal d'échantillonnage.
Ainsi, en fonction du déphasage existant, le point échantillonné représentera de
façon plus ou moins fidèle les valeurs maximales (en valeur absolue) P- et P+ des
lobes négatif et positif.However, it should be noted that there is a phase shift between the acoustic signal received and the sampling signal.
Thus, depending on the existing phase shift, the sampled point will more or less faithfully represent the maximum values (in absolute value) P- and P + of the negative and positive lobes.
Pour remédier à ce problème, il est possible d'utiliser un algorithme
d'approximation du maximum (en valeur absolue) à partir des points
échantillonnés au voisinage du maximum afin d'obtenir une estimation de la
valeur réelle de ce maximum quel que soit le déphasage existant entre le signal
acoustique reçu et le signal d'échantillonnage.
Par exemple, on peut utiliser un algorithme d'approximation polynômiale connu
en soi.
Le problème précédemment évoqué pourrait également être résolu en augmentant
la fréquence d'échantillonnage.To remedy this problem, it is possible to use an algorithm for approximating the maximum (in absolute value) from the sampled points in the vicinity of the maximum in order to obtain an estimate of the real value of this maximum whatever the phase difference between the acoustic signal received and the sampling signal.
For example, one can use a polynomial approximation algorithm known per se.
The previously mentioned problem could also be solved by increasing the sampling frequency.
Toutefois, lorsque le procédé selon l'invention est mis en oeuvre dans un compteur de fluide qui fonctionne sur piles, il est essentiel de réduire le plus possible la consommation énergétique du procédé et cette exigence n'est pas compatible avec une augmentation de la fréquence d'échantillonnage.However, when the method according to the invention is implemented in a fluid meter that operates on batteries, it is essential to reduce the most possible energy consumption of the process and this requirement is not compatible with an increase in the sampling frequency.
En outre, une fréquence d'échantillonnage élevée nécessite l'emploi d'une
horloge plus coûteuse.
Une solution intéressante pour résoudre le problème susvisé en respectant les
contraintes de consommation énergétique et de coût consisterait (lorsque le signal
acoustique est répétable au cours du temps sur plusieurs mesures successives) à
effectuer plusieurs mesures successives respectivement sur plusieurs signaux
acoustiques consécutifs émis dans le même sens de propagation en déphasant le
signal d'échantillonnage par rapport au signal acoustique lorsque l'on effectue une
nouvelle mesure, afin d'obtenir après ces différentes mesures plusieurs points
échantillonnés décalés au voisinage des amplitudes maximales P- et P+ des lobes
négatifs et positifs.
Par exemple, la première mesure est effectuée en échantillonnant normalement le
signal acoustique reçu, puis la seconde mesure est effectuée sur le second signal
acoustique en déphasant le signal d'échantillonnage par rapport audit second
signal acoustique d'une valeur déterminée 1/2Fe.In addition, a high sampling frequency requires the use of a more expensive clock.
An interesting solution to solve the aforementioned problem while respecting the constraints of energy consumption and cost would consist (when the acoustic signal is repeatable over time on several successive measurements) to carry out several successive measurements respectively on several consecutive acoustic signals emitted in the same direction of propagation by shifting the sampling signal with respect to the acoustic signal when a new measurement is carried out, in order to obtain after these various measurements several sampled points offset in the vicinity of the maximum amplitudes P- and P + of the negative and positive lobes .
For example, the first measurement is carried out by normally sampling the acoustic signal received, then the second measurement is carried out on the second acoustic signal by phase shifting the sampling signal with respect to said second acoustic signal by a
Il est ainsi possible d'effectuer plusieurs déphasages successifs (de valeur
1/nFe pour n déphasages) sur le deuxième signal acoustique et les signaux
acoustiques suivants pour obtenir davantage de points échantillonnés au voisinage
des maxima et ainsi avoir une précision encore plus grande sur ces amplitudes
maximales P- et P+.
Il est également avantageux de combiner l'utilisation d'un algorithme
d'approximation du maximum (en valeur absolue) avec cette solution afin
d'accroítre davantage encore la précision.It is thus possible to perform several successive phase shifts (of
It is also advantageous to combine the use of a maximum approximation algorithm (in absolute value) with this solution in order to further increase the precision.
On procède ensuite à une comparaison du rapport de ces amplitudes des valeurs maximales P- et P+ au rapport Δ correspondant de la période idéale.We then proceed to a comparison of the ratio of these amplitudes of maximum values P- and P + at the corresponding Δ ratio of the ideal period.
Si le résultat de la comparaison est supérieur à une valeur de seuil Gs, on considère la période examinée comme une période parasite correspondant à du bruit, et on continue l'analyse sur la période suivante.If the result of the comparison is greater than a threshold value G s , the period examined is considered as a parasitic period corresponding to noise, and the analysis is continued over the following period.
Si le résultat de la comparaison est inférieur à la valeur de seuil Gs, on considère la période examinée comme une période caractéristique.If the result of the comparison is less than the threshold value G s , the period examined is considered to be a characteristic period.
On peut alors déterminer de façon fiable le passage par zéro associé à cette période examinée. Ce passage par zéro considéré comme le premier passage à zéro significatif des oscillations caractéristiques du signal acoustique reçu peut être avantageusement le passage par zéro situé entre les deux lobes positif et négatif de la période caractéristique.We can then reliably determine the zero crossing associated with this period examined. This zero crossing considered as the first passage at significant zero of the characteristic oscillations of the acoustic signal received can advantageously be the zero crossing located between the two positive lobes and negative of the characteristic period.
La Figure 5 montre une première oscillation caractéristique Oca de période ΔT avec un lobe positif dont l'amplitude présente une valeur maximale P+ et un lobe négatif dont l'amplitude présente une valeur maximale en valeur absolue P-. Le passage à zéro associé à cette période ΔT d'une première oscillation caractéristique Oca définit un temps de passage à zéro correspondant à un temps T7.FIG. 5 shows a first characteristic oscillation O ca of period ΔT with a positive lobe whose amplitude has a maximum value P + and a negative lobe whose amplitude has a maximum value in absolute value P-. The zero crossing associated with this period ΔT of a first characteristic oscillation O ca defines a zero crossing time corresponding to a time T 7 .
Le rapport d'amplitude entre les amplitudes des valeurs maximales P- et P+ des deux lobes d'une période examinée du signal acoustique reçu constitue un critère de comparaison indépendant de la nature du gaz. Ainsi, le vieillissement de l'électronique peut entraíner des variations de gain qui n'affecteront pas ce rapport d'amplitude entre les amplitudes maximales P- et P+. La reconnaissance de forme du signal acoustique reçu peut ainsi s'effectuer d'une façon simple, qui limite la consommation d'énergie, puisque la comparaison s'effectue entre les seules amplitudes maximales P- et P+ des lobes et un rapport d'amplitudes théorique Δ entre les amplitudes maximales Pi- et Pi+ des deux lobes d'une période caractéristique idéale.The amplitude ratio between the amplitudes of the maximum values P- and P + of the two lobes of an examined period of the acoustic signal received constitutes a comparison criterion independent of the nature of the gas. So the aging of electronics can cause gain variations that will not affect this ratio amplitude between the maximum amplitudes P- and P +. Shape recognition of the acoustic signal received can thus be carried out in a simple manner, which limits the energy consumption, since the comparison is made only between maximum amplitudes P- and P + of the lobes and a theoretical amplitude ratio Δ between the maximum amplitudes Pi- and Pi + of the two lobes of a period ideal feature.
Le rapport d'amplitudes théorique Δ est déterminé au préalable à partir d'une moyenne, pour plusieurs gaz différents et à différents débits, du rapport entre les amplitudes maximales P- et P+ de la période caractéristique observée à partir de l'enregistrement de signaux acoustiques reçus.The theoretical amplitude ratio Δ is determined beforehand from an average, for several different gases and at different flow rates, of the ratio between the maximum amplitudes P- and P + of the characteristic period observed at from the recording of acoustic signals received.
Selon un mode particulier de réalisation, la comparaison entre le rapport
des amplitudes P- et P+ de la période examinée et le rapport d'amplitude
correspondant de la période idéale s'effectue en calculant un critère de
ressemblance G qui constitue le résultat de la comparaison comparé à la valeur de
seuil Gs, et qui est défini de la façon suivante :

Le fait d'effectuer des comparaisons en prenant en compte des rapports d'amplitudes maximales des lobes d'une période du signal acoustique reçu, le rapport d'amplitudes théorique de référence Δ n'est pas affecté par la nature du gaz ou le gain de la chaíne d'amplification du signal reçu. Ceci contribue à faciliter les mesures.Performing comparisons taking into account reports maximum amplitudes of the lobes of a period of the acoustic signal received, the reference theoretical amplitude ratio Δ is not affected by the nature of the gas or the gain of the amplification chain of the received signal. This helps to facilitate measures.
Toutefois, il pourrait se trouver, parmi les périodes parasites du signal qui constituent du bruit, des formes d'ondes ressemblantes à celle définie par le critère de comparaison G. Pour rendre la détection des périodes caractéristiques moins sensible au risque de prendre en compte des formes d'ondes ressemblantes noyées dans du bruit et qui ne constitueraient pas une première période Oca des oscillations caractéristiques Oc du signal reçu, le critère de ressemblance peut être rendu légèrement dépendant de l'amplitude P-.However, among the parasitic periods of the signal which constitute noise, there could be waveforms similar to that defined by the comparison criterion G. To make the detection of the characteristic periods less sensitive to the risk of taking into account resembling waveforms drowned in noise and which would not constitute a first period O ca of the characteristic oscillations O c of the received signal, the criterion of resemblance can be made slightly dependent on the amplitude P-.
Ainsi, selon un autre mode de réalisation particulier, a comparaison entre
le rapport des amplitudes P- et P+ de la période examinée et le rapport
d'amplitudes correspondant de la période idéale s'effectue en calculant un critère
de ressemblance G qui constitue le résultat de la comparaison comparé à la valeur
de seuil Gs, et qui est défini de la façon suivante :

Dans ce cas, le dénominateur du critère G est fortement diminué quand l'amplitude P- est voisine du terme de décalage z. Si le terme de décalage z présente une valeur légèrement supérieure à l'amplitude maximale du bruit (par exemple de l'ordre de 0,20 à 0,25 Volt), ceci permet d'effectuer plus rapidement une réjection des périodes parasites du signal reçu. In this case, the denominator of criterion G is greatly reduced when the amplitude P- is close to the shift term z. If the offset term z has a value slightly higher than the maximum amplitude of the noise (for example of the order of 0.20 to 0.25 Volt), this makes it possible to perform more quickly a rejection of the parasitic periods of the received signal.
Pour déterminer la valeur de Gs à laquelle doit être comparé le critère de ressemblance G, et la valeur du terme de décalage z, on trace un réseau de premières courbes représentant les valeurs maximum du critère de ressemblance G pour les périodes caractéristiques observées et un réseau de deuxièmes courbes représentant les valeurs minimum du critère de ressemblance G pour les périodes parasites observées, en fonction de différentes valeurs possibles du terme de décalage z, et on choisit la valeur de seuil Gs et celle du terme de décalage z, et on choisit la valeur de seuil Gs et celle du terme de décalage z en fonction de la marge de sécurité possible dans la zone intermédiaire entre le réseau de premières courbes et le réseau de deuxièmes courbes.To determine the value of G s to which the likeness criterion G must be compared, and the value of the shift term z, we draw a network of first curves representing the maximum values of the likeness criterion G for the characteristic periods observed and a network of second curves representing the minimum values of the likeness criterion G for the parasitic periods observed, as a function of different possible values of the shift term z, and the threshold value G s and that of the shift term z are chosen, and we chooses the threshold value G s and that of the offset term z as a function of the possible safety margin in the intermediate zone between the network of first curves and the network of second curves.
A titre d'exemple, les familles de courbes 111 et 121 de la Figure 6 ont
été obtenues en faisant varier le déphasage entre la fréquence d'échantillonnage et
le signal et en appliquant un facteur de gain variant entre 0,45 et 1,5, les gaz pris
en compte étant le méthane et un mélange de 20% de gaz carbonique et de 80%
d'azote, les mesures ayant été faites à débit nul et à 7m3/heure.By way of example, the families of
Les réseaux de courbes 111 et 121 permettent de choisir les valeurs du
terme de décalage z et de la valeur de seuil Gs en fonction de la marge de sécurité
voulue sur ces valeurs. Si l'on considère la Figure 6, on voit que l'on peut choisir
pour Gs par exemple une valeur comprise entre environ 0,7 et 1,7 V et, pour le
terme de décalage z, par exemple une valeur comprise entre 0,21 et 0,25 V.The networks of
Si l'on choisit par exemple Gs = 2 et z = 0,22 V; la marge de sécurité sur z est comprise entre 0,20 et 0,25 V tandis que la marge de sécurité pour Gs est comprise entre 1 et 4. En pratique, avec cet exemple, une période examinée sera considérée comme caractéristique si G < Gs = 1,5.If we choose for example G s = 2 and z = 0.22 V; the safety margin on z is between 0.20 and 0.25 V while the safety margin for G s is between 1 and 4. In practice, with this example, a period examined will be considered as characteristic if G < G s = 1.5.
D'autres variantes de réalisation permettent d'accroítre encore la sécurité et la fiabilité du procédé.Other variant embodiments make it possible to further increase security and the reliability of the process.
Ainsi, selon un mode de réalisation particulier, la comparaison entre le
rapport des amplitudes P- et P+ de la période examinée et le rapport d'amplitudes
correspondant de la période idéale s'effectue en calculant un critère de
ressemblance G qui constitue le résultat de la comparaison comparé à la valeur de
seuil Gs, et qui est défini de la façon suivante :
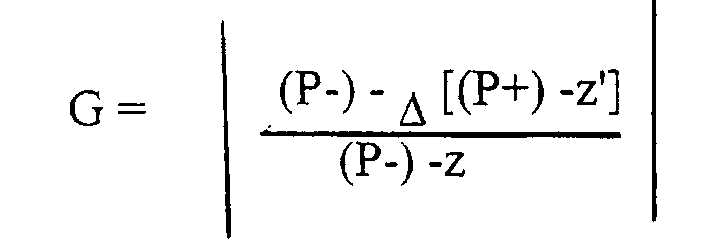
Ceci permet de réduire la sensibilité à des périodes ressemblantes de faible amplitude et, sans augmenter sensiblement la complexité des calculs, de pouvoir diminuer le gain de la chaíne d'amplification jusqu'à des valeurs aussi faibles que 0,35, ce qui économise de l'énergie.This reduces sensitivity to similar periods of low amplitude and, without significantly increasing the complexity of the calculations, ability to decrease gain of amplification chain to values also low than 0.35, which saves energy.
Selon une autre variante, et quelle que soit la formule choisie pour le critère de ressemblance G, on effectue, pour chaque période examinée, deux ou trois calculs du critère de ressemblance G avec des valeurs du rapport d'amplitudes Δ différentes voisines du rapport d'amplitude théorique prédéterminé et ne s'écartant pas de celle-ci de plus de 10%, en ce que l'on considère la période examinée comme une période caractéristique si le critère de ressemblance calculé G est dans tous les cas inférieur à la valeur de seuil Gs.According to another variant, and whatever the formula chosen for the likeness criterion G, for each period examined, two or three calculations of the likeness criterion G are carried out with values of the ratio of amplitudes Δ different close to the ratio d '' predetermined theoretical amplitude and not deviating from it by more than 10%, in that the period examined is considered to be a characteristic period if the calculated similarity criterion G is in all cases less than the value of threshold G s .
La Figure 7 est un organigramme montrant un exemple de processus de mise en oeuvre du procédé selon l'invention.Figure 7 is a flowchart showing an example of a implementation of the method according to the invention.
Si l'on considère un échantillonnage à une fréquence Fe, par exemple de 320 kHz, qui représente huit fois la fréquence acoustique Fa des transducteurs, le signal échantillonné comportera 8 points par période du signal reçu.If we consider sampling at a frequency Fe, for example from 320 kHz, which represents eight times the acoustic frequency Fa of the transducers, the sampled signal will have 8 points per period of the received signal.
Dans la mesure où le signal acoustique reçu présente la forme d'oscillations périodiques, on sait où se trouvent les minimums et maximums successifs, ce qui évite d'examiner l'ensemble des points échantillonnés.Insofar as the acoustic signal received has the form of periodic oscillations, we know where the minimums and maximums are successive, which avoids examining all of the sampled points.
On commence donc, après la phase d'initialisation 201, à chercher au
cours d'une étape 202, le prochain minimum local (d'amplitude P-). Au cours de
cette étape 202, si l'on applique un critère de ressemblance G faisant intervenir un
terme de décalage z, on ne retient que le premier minimum local dont l'amplitude
P- est supérieure en valeur absolue au terme de décalage z. Quant ce premier
minimum local a été trouvé, on passe à l'étape 203 qui consiste à chercher au
voisinage d'une demi-période T/2 précédente, la valeur de l'amplitude maximale
P+.We therefore begin, after the
A l'étape suivante 204, on calcule la valeur du critère de ressemblance G
avec les valeurs précédemment trouvés du minimum P- et du maximum P+ de la
période examinée qui présente au moins un minimum dont la valeur absolue est
supérieure au terme de décalage z.In the
A l'étape 205, on effectue un test de comparaison entre la valeur du
critère G calculée et la valeur de seuil Gs. In
Si G ≥ Gs pour la période examinée, on considère qu'il s'agit d'une période parasite, et il y a retour à l'étape 202 de recherche d'un prochain minimum local.If G ≥ G s for the period examined, we consider that it is a parasitic period, and there is a return to step 202 for searching for a next local minimum.
Si G < Gs pour la période examinée, celle-ci est considérée comme une
période caractéristique et on passe à une étape 206 de détermination du prochain
passage à zéro de l'amplitude du signal reçu qui constituera le passage à zéro situé
entre le maximum local P+ et le minimum local P- et sera donc le vrai point de
départ des oscillations caractéristiques Oc du signal acoustique reçu.If G <G s for the period examined, this is considered to be a characteristic period and we pass to a
Le même processus sera renouvelé quelques instants plus tard pour une nouvelle mesure de détermination du temps de propagation d'un signal acoustique ultrasonore.The same process will be repeated a few moments later for a new measurement for determining the propagation time of an acoustic signal ultrasonic.
Claims (11)
- A method for measuring the propagation time of an acoustical signal within a fluid flow between a first transducer (1) serving as a transmitter and a second transducer (2) serving as the receiver and located at a determined distance from the first transducer (1), wherein the acoustical signal transmitted by the first transducer (1) comprises at least one pulse S1 transmitted at a determined acoustical frequency Fa and the acoustical signal received by the second transducer (2) comprises a series of characteristic oscillations having an amplitude which first decreases over several periods, then decreases over several following periods, the envelope of the characteristic oscillations being spindle-shaped, wherein the method consists in sampling the received acoustical signal at a sampling frequency Fe, digitizing the sampled received acoustical signal, and searching, by analyzing the sampled and digitized received acoustical signal, the first significant zero-crossing of the characteristic oscillations of the received acoustical signal, characterized in that, for searching the first significant zero-crossing of the characteristic oscillations of the received signal, a first ideal characteristic period is previously defined which determines the first zero-crossing of the characteristic oscillations of the received acoustical signal, by characterizing said ideal period by means of a theoretical amplitude ratio between the maximum amplitudes Pi- and Pi+ of the two lobes of said period, for each period of the sampled and digitized received acoustical signal, the maximum amplitudes P- and P+ of the two lobes of the analyzed period are determined, the ratio of said amplitudes P- and P+ is compared to the ratio of theoretical amplitudes, which ratio corresponds to the ideal period and then, if the result of said comparison is greater than a threshold value Gs, the analyzed period is considered to be a spurious period corresponding to a noise, whereas, if the result of said comparison is smaller than said threshold value Gs, the analyzed period is considered to be a characteristic period and the zero crossing between the two lobes of said characteristic period is then determined, which zero-crossing is considered to be the first significant zero-crossing of the characteristic oscillations of the received acoustical signal.
- A method as claimed in claim 1, characterized in that said theoretical ratio of amplitudes Δ between the maximum amplitudes Pi- and Pi+ of the two lobes of said ideal period is previously determined by averaging, for several different gases and at different flow rates, the ratio between the maximum amplitudes P- and P+ of the characteristic period as observed from the recorded received acoustical signals.
- A method as claimed in claim 1 or 2, characterized in that a comparison between the ratio of amplitudes P- and P+ of the analyzed period and the theoretical ratio of amplitudes Δ corresponding to the ideal period is carried out by computing a similarity criterion G which is the result of the comparison to the threshold value Gs, and which is defined as follows:

- A method as claimed in claim 1 or 2, characterized in that the comparison between the ratio of amplitudes P- and P+ of the analyzed period and the theoretical ratio of amplitudes Δ corresponding to the ideal period is carried out by computing a similarity criterion G which is the result of the comparison to the threshold value Gs, and which is defined as follows:where z represents an offset term for making the similarity criterion G slightly dependant on the maximum amplitude P- of the negative lobe of the analyzed characteristic period.
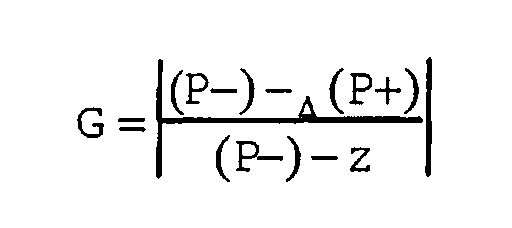
- A method as claimed in claim 1 or 2, characterized in that the comparison between the ratio of amplitudes P- and P+ of the analyzed period and the theoretical ratio of amplitudes Δ corresponding to the ideal period is carried out by computing a similarity criterion G which is the result of the comparison to the threshold value Gs, and which is defined as follows:where z represents an offset term for making the similarity criterion G slightly dependant on the maximum amplitude P- of the negative lobe of the analyzed characteristic period, and z' represents an offset term for making the similarity criterion G slightly dependant on the maximum amplitude P+ of the positive lobe of the analyzed characteristic period.
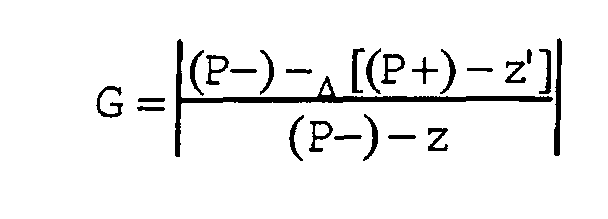
- A method as claimed in any one of claims 1 to 5, characterized in that, for determining the maximum amplitudes P- and P+ of the two lobes of each analyzed period with greater accuracy, the maximum approximation algorithm (in absolute value) is applied to points sampled in the vicinity of each maximum.
- A method as claimed in any one of claims 1 to 6, characterized in that, for determining the maximum amplitudes P- and P+ of the two lobes of each analyzed period with greater accuracy, several consecutive measurements are carried out respectively over several consecutive acoustical signals by phase-shifting, for each acoustical signal, the sampling signal relative to the considered acoustical signal, in order to obtain, after these different measurements, several sampled points which are offset in the vicinity of the maximum amplitudes.
- A method as claimed in any one of claims 3 to 7, characterized in that, for each analyzed period, two or three computations of the similarity criterion G with different values of the theoretical ratio of amplitudes Δ in the vicinity of the predetermined theoretical amplitude ratio, which do not deviate from the latter by more than 10 %, are carried out, and the analyzed period is considered to be the characteristic period if the computed similarity criterion G is always smaller than the threshold value Gs.
- A method according to claim 4, characterized in that, for determining the threshold value Gs of the similarity criterion G as well as the value of the offset term z, there is previously plotted, for different gazes and different flow rates, by varying the phase-shift between the sampling frequency Fe and the received acoustical signal and by applying a gain factor which varies between 0.45 and 1.5, a set of first curves (111) representing the maximum values of similarity criterion G for the observed characteristic period and a set of second curves (121) representing the minimum values of the similarity criterion G for the observed spurious periods, as a function of the different possible values of the offset term z, and the threshold value Gs and that of the offset term z, are chosen as a function of the possible safety margin within the intermediate area between the set of first curves (111) and the set of second curves (121).
- A method as claimed in claim 4 or 9, characterized in that the threshold value Gs ranges between 0.7 and 1.7 and the value of the offset term z ranges between 0.21 and 0.25 V.
- A method for measuring the flow velocity of a fluid between two transducers arranged at measurement points spaced apart in a direction of a flow of said fluid, wherein the value of the flow velocity to be measured is obtained by combining a measurement of the respective propagation times for each of the two acoustical signals transmitted from said transducers between said two points in opposite directions, with a measurement of the acoustical phase-shifts induced respectively in each acoustical signal by the propagation of each of said acoustical signals within said flow, characterized in that the measurement of the respective propagation times of each of the two acoustical signals transmitted between the two measurement points is carried out according to the method of any of claims 1 to 10.
Applications Claiming Priority (3)
| Application Number | Priority Date | Filing Date | Title |
|---|---|---|---|
| FR9607189 | 1996-06-07 | ||
| FR9607189A FR2749652B1 (en) | 1996-06-07 | 1996-06-07 | METHOD FOR MEASURING THE PROPAGATION TIME OF AN ACOUSTIC SIGNAL IN A FLUID BY PASSING TO ZERO OF SAID ACOUSTIC SIGNAL |
| PCT/FR1997/001012 WO1997046854A1 (en) | 1996-06-07 | 1997-06-06 | Method for measuring a sound signal propagation delay in a fluid by zero-crossing of the said sound signal |
Publications (2)
| Publication Number | Publication Date |
|---|---|
| EP0902883A1 EP0902883A1 (en) | 1999-03-24 |
| EP0902883B1 true EP0902883B1 (en) | 2002-04-03 |
Family
ID=9492905
Family Applications (1)
| Application Number | Title | Priority Date | Filing Date |
|---|---|---|---|
| EP97928307A Expired - Lifetime EP0902883B1 (en) | 1996-06-07 | 1997-06-06 | Method for measuring a sound signal propagation delay in a fluid by zero-crossing of the said sound signal |
Country Status (9)
| Country | Link |
|---|---|
| US (1) | US6226598B1 (en) |
| EP (1) | EP0902883B1 (en) |
| CN (1) | CN1221487A (en) |
| AU (1) | AU3265597A (en) |
| DE (1) | DE69711621T2 (en) |
| FR (1) | FR2749652B1 (en) |
| ID (1) | ID17866A (en) |
| RU (1) | RU2182335C2 (en) |
| WO (1) | WO1997046854A1 (en) |
Cited By (1)
| Publication number | Priority date | Publication date | Assignee | Title |
|---|---|---|---|---|
| DE10338940B3 (en) * | 2003-08-22 | 2005-02-10 | Fresenius Medical Care Deutschland Gmbh | Measuring ultrasonic signal transit time within a fluid flow, especially external blood flow in dialysis, with received signal scanned during at least one half-period to give contact points with a static level |
Families Citing this family (26)
| Publication number | Priority date | Publication date | Assignee | Title |
|---|---|---|---|---|
| FR2803383B1 (en) * | 1999-12-29 | 2002-03-29 | Schlumberger Ind Sa | METHOD AND DEVICE FOR DETECTING MALFUNCTION FOR AN ULTRASONIC FLOWMETER |
| JP3616324B2 (en) | 2000-11-27 | 2005-02-02 | 東京計装株式会社 | Ultrasonic flow meter by propagation time difference method |
| DE10254054A1 (en) * | 2002-11-19 | 2004-06-03 | Endress + Hauser Flowtec Ag, Reinach | Device for determining and / or monitoring the volume and / or mass flow of a medium |
| AU2003280620A1 (en) * | 2002-11-26 | 2004-06-18 | Matsushita Electric Industrial Co., Ltd. | Ultrasonic flowmeter and ultrasonic flow rate measuring method |
| US7020448B2 (en) * | 2003-03-07 | 2006-03-28 | Conwise Technology Corporation Ltd. | Method for detecting a tone signal through digital signal processing |
| JP4271979B2 (en) * | 2003-04-21 | 2009-06-03 | 帝人株式会社 | Ultrasonic gas concentration flow measurement method and apparatus |
| US6950768B2 (en) * | 2003-09-08 | 2005-09-27 | Daniel Industries, Inc. | Self-tuning ultrasonic meter |
| EP1718354B1 (en) * | 2004-02-24 | 2020-04-29 | MicroDose Therapeutx, Inc. | Inhaler with a directional flow sensor |
| US7415638B2 (en) * | 2004-11-22 | 2008-08-19 | Qualcomm Incorporated | Pre-decode error handling via branch correction |
| US7917321B2 (en) * | 2008-02-25 | 2011-03-29 | Daniel Measurement And Control, Inc. | Method and system of determining a pattern of arrival time cycle skip in an acoustic flow meter |
| EP2182349A1 (en) | 2008-10-28 | 2010-05-05 | Axsensor AB | Method for determining the starting instant of a periodically oscillating signal response |
| JP4469008B1 (en) * | 2008-11-18 | 2010-05-26 | 株式会社オーバル | Coriolis flow meter |
| US8665101B2 (en) * | 2009-11-16 | 2014-03-04 | Aquarius Spectrum Ltd. | System method and device for leak detection and localization in a pipe network |
| TWI410611B (en) * | 2009-12-11 | 2013-10-01 | Oval Corp | Coriolis flowmeter |
| CN104169692A (en) | 2011-12-02 | 2014-11-26 | 卡姆鲁普股份有限公司 | Ultrasonic flow meter with digitally under-sampled flow measurements |
| DE102013013927A1 (en) * | 2013-08-21 | 2015-02-26 | Acam-Messelectronic Gmbh | Method and device for measuring the flow rate of a liquid by means of ultrasound |
| DK201470196A1 (en) * | 2013-10-14 | 2015-04-20 | Flonidan As | Algorithm for calculating Amplitudes, Phase- or time differences |
| JP6325884B2 (en) * | 2014-05-09 | 2018-05-16 | パナソニック株式会社 | Gas shut-off device |
| WO2017167389A1 (en) * | 2016-03-31 | 2017-10-05 | Danfoss A/S | Method for monitoring an ultrasonic flow meter |
| CN109387829B (en) * | 2017-08-03 | 2022-12-06 | 宏碁股份有限公司 | Distance detection device and distance detection method thereof |
| FR3074913B1 (en) * | 2017-12-08 | 2019-11-22 | Sagemcom Energy & Telecom Sas | METHOD FOR MEASURING A SPEED OF A FLUID |
| FR3109631B1 (en) * | 2020-04-22 | 2022-04-15 | Sagemcom Energy & Telecom Sas | Ultrasonic measurement process taking into account the amount of gas bubbles |
| CN111879368B (en) * | 2020-07-23 | 2022-07-12 | 北京瑞德联数据科技有限公司 | Phase shift detection method, device and equipment in flow measurement |
| CN111964738B (en) * | 2020-08-14 | 2022-10-11 | 中国计量大学 | Dynamic threshold setting method based on ultrasonic echo signal similarity |
| CN113124948B (en) * | 2021-05-20 | 2022-08-30 | 中国计量大学 | High-precision time difference measuring method based on FPGA and cross-correlation method |
| CN115773793B (en) * | 2022-11-29 | 2023-07-21 | 青岛鼎信通讯科技有限公司 | A Dynamic Adjustment Method of Ultrasonic Water Meter Signal Amplitude |
Family Cites Families (11)
| Publication number | Priority date | Publication date | Assignee | Title |
|---|---|---|---|---|
| US4028938A (en) * | 1976-01-26 | 1977-06-14 | Ocean Research Equipment, Inc. | Acoustical flow meter |
| NL7810630A (en) * | 1978-10-25 | 1980-04-29 | Rheometron Ag | DEVICE FOR MEASURING THE SPEED OF FLUID FLOWS. |
| US4432243A (en) * | 1979-02-28 | 1984-02-21 | Ocean Research Equipment, Inc. | Flow calculator with velocity curve fitting circuit means |
| US4308754A (en) * | 1979-10-19 | 1982-01-05 | Panametrics, Inc. | Ultrasonic flowmeter |
| US4452090A (en) * | 1982-05-17 | 1984-06-05 | Airco, Inc. | Ultrasonic flowmeter |
| JPS59195126A (en) * | 1983-04-21 | 1984-11-06 | Yokogawa Hokushin Electric Corp | Ultrasonic flow meter |
| US4787252A (en) * | 1987-09-30 | 1988-11-29 | Panametrics, Inc. | Differential correlation analyzer |
| US5012449A (en) * | 1989-06-30 | 1991-04-30 | Ferranti O.R.E. Inc. | Sonic flow meter |
| GB2237639B (en) * | 1989-10-31 | 1994-07-06 | British Gas Plc | Measurement system |
| US5035147A (en) * | 1990-02-09 | 1991-07-30 | Curtin Matheson Scientific, Inc. | Method and system for digital measurement of acoustic burst travel time in a fluid medium |
| US5753824A (en) * | 1996-06-12 | 1998-05-19 | Welch Allyn, Inc. | Sampling method and apparatus for use with ultrasonic flowmeters |
-
1996
- 1996-06-07 FR FR9607189A patent/FR2749652B1/en not_active Expired - Fee Related
-
1997
- 1997-06-06 AU AU32655/97A patent/AU3265597A/en not_active Abandoned
- 1997-06-06 CN CN97195239A patent/CN1221487A/en active Pending
- 1997-06-06 RU RU99100301/28A patent/RU2182335C2/en not_active IP Right Cessation
- 1997-06-06 EP EP97928307A patent/EP0902883B1/en not_active Expired - Lifetime
- 1997-06-06 ID IDP971946A patent/ID17866A/en unknown
- 1997-06-06 WO PCT/FR1997/001012 patent/WO1997046854A1/en not_active Ceased
- 1997-06-06 DE DE69711621T patent/DE69711621T2/en not_active Expired - Fee Related
-
1998
- 1998-12-04 US US09/205,032 patent/US6226598B1/en not_active Expired - Fee Related
Cited By (1)
| Publication number | Priority date | Publication date | Assignee | Title |
|---|---|---|---|---|
| DE10338940B3 (en) * | 2003-08-22 | 2005-02-10 | Fresenius Medical Care Deutschland Gmbh | Measuring ultrasonic signal transit time within a fluid flow, especially external blood flow in dialysis, with received signal scanned during at least one half-period to give contact points with a static level |
Also Published As
| Publication number | Publication date |
|---|---|
| RU2182335C2 (en) | 2002-05-10 |
| ID17866A (en) | 1998-01-29 |
| DE69711621T2 (en) | 2002-11-28 |
| WO1997046854A1 (en) | 1997-12-11 |
| AU3265597A (en) | 1998-01-05 |
| DE69711621D1 (en) | 2002-05-08 |
| FR2749652A1 (en) | 1997-12-12 |
| US6226598B1 (en) | 2001-05-01 |
| CN1221487A (en) | 1999-06-30 |
| EP0902883A1 (en) | 1999-03-24 |
| FR2749652B1 (en) | 1998-08-21 |
Similar Documents
| Publication | Publication Date | Title |
|---|---|---|
| EP0902883B1 (en) | Method for measuring a sound signal propagation delay in a fluid by zero-crossing of the said sound signal | |
| EP0852725B1 (en) | Method for acoustically measuring a fluid flow rate | |
| FR2713763A1 (en) | Fluid flow meter. | |
| EP1097354B1 (en) | Crossed measurements of flowmeter sound signals | |
| EP3901587B1 (en) | Ultrasonic measurement method taking into account the amount of gas bubbles | |
| FR2803032A1 (en) | METHOD AND DEVICE FOR MEASURING CIRCULATING FLUID FLOW IN A PIPE | |
| EP0161956B1 (en) | Method for the unambiguous doppler speed measurement of a moving object | |
| EP1157258B1 (en) | Method and device for measuring propagation time of a signal, in particular a ultrasonic signal | |
| CA2278408C (en) | Procedure and device for measuring the flow rate of a liquid stream | |
| FR2715725A1 (en) | Method and device for determining a physical parameter represented by the evolution over time of a physical quantity. | |
| FR3050828B1 (en) | METHOD FOR DETERMINING A FLOW RATE OF FLUID FLOWING IN A DRIVING STRING AND ASSOCIATED DEVICE | |
| FR2750495A1 (en) | METHOD AND DEVICE FOR MEASURING A FLOW OF FLOWING FLUID | |
| FR2917179A1 (en) | METHOD AND DEVICE FOR DETERMINING THE INCREASE ANGLE IN A RADIONAVIGATION SYSTEM | |
| FR2946149A1 (en) | METHOD FOR ANALYZING LARGE ELECTRIC CABLES AND ELECTRIC CABLES NETWORKS | |
| WO1998018020A1 (en) | Method for measuring the doppler shift in a sensor system using ambiguous codes | |
| EP3764104A1 (en) | Method for measuring the speed of a fluid, ultrasonic fluid meter, computer program and storage means | |
| FR3030721A1 (en) | DEVICE AND METHOD FOR DETECTING FISH IN A CROSSING DEVICE | |
| EP0343083B1 (en) | Loss of synchronisation detection device, and its use in a digital transmission network | |
| FR3080455A1 (en) | ULTRASOUND ANEMOMETER | |
| FR3156534A1 (en) | Method for measuring the phase of a complex impedance | |
| JPH0534193A (en) | Ultrasonic transmitter-receiver | |
| FR2594947A1 (en) | Method and device for measuring a differential fluid flow rate, in particular for an internal combustion engine | |
| FR2712700A1 (en) | Acquisition and validation of rope speed measurements of a hydraulic flow in sewerage collector. | |
| WO2003030392A1 (en) | Method and device for detecting and locating a symmetry defect on a telephone line | |
| EP0036366A1 (en) | System for processing an acoustical signal of a telemetered wind speed |
Legal Events
| Date | Code | Title | Description |
|---|---|---|---|
| PUAI | Public reference made under article 153(3) epc to a published international application that has entered the european phase |
Free format text: ORIGINAL CODE: 0009012 |
|
| 17P | Request for examination filed |
Effective date: 19981216 |
|
| AK | Designated contracting states |
Kind code of ref document: A1 Designated state(s): DE FR GB IT |
|
| GRAG | Despatch of communication of intention to grant |
Free format text: ORIGINAL CODE: EPIDOS AGRA |
|
| 17Q | First examination report despatched |
Effective date: 20010605 |
|
| GRAG | Despatch of communication of intention to grant |
Free format text: ORIGINAL CODE: EPIDOS AGRA |
|
| GRAH | Despatch of communication of intention to grant a patent |
Free format text: ORIGINAL CODE: EPIDOS IGRA |
|
| REG | Reference to a national code |
Ref country code: GB Ref legal event code: IF02 |
|
| GRAH | Despatch of communication of intention to grant a patent |
Free format text: ORIGINAL CODE: EPIDOS IGRA |
|
| GRAA | (expected) grant |
Free format text: ORIGINAL CODE: 0009210 |
|
| AK | Designated contracting states |
Kind code of ref document: B1 Designated state(s): DE FR GB IT |
|
| PG25 | Lapsed in a contracting state [announced via postgrant information from national office to epo] |
Ref country code: IT Free format text: LAPSE BECAUSE OF FAILURE TO SUBMIT A TRANSLATION OF THE DESCRIPTION OR TO PAY THE FEE WITHIN THE PRE;WARNING: LAPSES OF ITALIAN PATENTS WITH EFFECTIVE DATE BEFORE 2007 MAY HAVE OCCURRED AT ANY TIME BEFORE 2007. THE CORRECT EFFECTIVE DATE MAY BE DIFFERENT FROM THE ONE RECORDED.SCRIBED TIME-LIMIT Effective date: 20020403 |
|
| REF | Corresponds to: |
Ref document number: 69711621 Country of ref document: DE Date of ref document: 20020508 |
|
| GBT | Gb: translation of ep patent filed (gb section 77(6)(a)/1977) |
Effective date: 20020705 |
|
| PLBE | No opposition filed within time limit |
Free format text: ORIGINAL CODE: 0009261 |
|
| STAA | Information on the status of an ep patent application or granted ep patent |
Free format text: STATUS: NO OPPOSITION FILED WITHIN TIME LIMIT |
|
| 26N | No opposition filed |
Effective date: 20030106 |
|
| REG | Reference to a national code |
Ref country code: FR Ref legal event code: GC |
|
| REG | Reference to a national code |
Ref country code: GB Ref legal event code: 732E Free format text: REGISTERED BETWEEN 20090312 AND 20090318 |
|
| REG | Reference to a national code |
Ref country code: FR Ref legal event code: TP |
|
| PGFP | Annual fee paid to national office [announced via postgrant information from national office to epo] |
Ref country code: FR Payment date: 20090615 Year of fee payment: 13 |
|
| PGFP | Annual fee paid to national office [announced via postgrant information from national office to epo] |
Ref country code: GB Payment date: 20090618 Year of fee payment: 13 Ref country code: DE Payment date: 20090622 Year of fee payment: 13 |
|
| GBPC | Gb: european patent ceased through non-payment of renewal fee |
Effective date: 20100606 |
|
| REG | Reference to a national code |
Ref country code: FR Ref legal event code: ST Effective date: 20110228 |
|
| PG25 | Lapsed in a contracting state [announced via postgrant information from national office to epo] |
Ref country code: DE Free format text: LAPSE BECAUSE OF NON-PAYMENT OF DUE FEES Effective date: 20110101 |
|
| PG25 | Lapsed in a contracting state [announced via postgrant information from national office to epo] |
Ref country code: FR Free format text: LAPSE BECAUSE OF NON-PAYMENT OF DUE FEES Effective date: 20100630 |
|
| PG25 | Lapsed in a contracting state [announced via postgrant information from national office to epo] |
Ref country code: GB Free format text: LAPSE BECAUSE OF NON-PAYMENT OF DUE FEES Effective date: 20100606 |