EP0866342A1 - Method of recording and reading a radiation image of an elongate body - Google Patents
Method of recording and reading a radiation image of an elongate body Download PDFInfo
- Publication number
- EP0866342A1 EP0866342A1 EP97200857A EP97200857A EP0866342A1 EP 0866342 A1 EP0866342 A1 EP 0866342A1 EP 97200857 A EP97200857 A EP 97200857A EP 97200857 A EP97200857 A EP 97200857A EP 0866342 A1 EP0866342 A1 EP 0866342A1
- Authority
- EP
- European Patent Office
- Prior art keywords
- image
- grid
- screens
- pattern
- horizontal
- Prior art date
- Legal status (The legal status is an assumption and is not a legal conclusion. Google has not performed a legal analysis and makes no representation as to the accuracy of the status listed.)
- Granted
Links
- 230000005855 radiation Effects 0.000 title claims abstract description 21
- 238000000034 method Methods 0.000 title claims description 25
- OAICVXFJPJFONN-UHFFFAOYSA-N Phosphorus Chemical compound [P] OAICVXFJPJFONN-UHFFFAOYSA-N 0.000 claims abstract description 31
- 239000000463 material Substances 0.000 claims abstract description 4
- 230000036961 partial effect Effects 0.000 claims description 16
- 230000000638 stimulation Effects 0.000 claims description 5
- 230000004936 stimulating effect Effects 0.000 claims description 4
- 238000001514 detection method Methods 0.000 description 8
- 238000003708 edge detection Methods 0.000 description 6
- 238000003384 imaging method Methods 0.000 description 5
- 238000007873 sieving Methods 0.000 description 5
- 230000010354 integration Effects 0.000 description 4
- 230000000737 periodic effect Effects 0.000 description 4
- 238000003745 diagnosis Methods 0.000 description 3
- 238000009499 grossing Methods 0.000 description 3
- 230000002238 attenuated effect Effects 0.000 description 2
- 238000004364 calculation method Methods 0.000 description 2
- 239000000470 constituent Substances 0.000 description 2
- 230000010339 dilation Effects 0.000 description 2
- 230000003628 erosive effect Effects 0.000 description 2
- 238000012417 linear regression Methods 0.000 description 2
- 229920000914 Metallic fiber Polymers 0.000 description 1
- 238000003491 array Methods 0.000 description 1
- 230000001174 ascending effect Effects 0.000 description 1
- 238000012512 characterization method Methods 0.000 description 1
- 238000006243 chemical reaction Methods 0.000 description 1
- 230000001186 cumulative effect Effects 0.000 description 1
- 230000003247 decreasing effect Effects 0.000 description 1
- 230000001419 dependent effect Effects 0.000 description 1
- 238000002059 diagnostic imaging Methods 0.000 description 1
- 238000010586 diagram Methods 0.000 description 1
- 230000000694 effects Effects 0.000 description 1
- 230000008030 elimination Effects 0.000 description 1
- 238000003379 elimination reaction Methods 0.000 description 1
- 230000002708 enhancing effect Effects 0.000 description 1
- 238000000605 extraction Methods 0.000 description 1
- 230000007257 malfunction Effects 0.000 description 1
- 230000000149 penetrating effect Effects 0.000 description 1
- 230000002688 persistence Effects 0.000 description 1
- 238000004321 preservation Methods 0.000 description 1
- 238000003672 processing method Methods 0.000 description 1
- 238000002601 radiography Methods 0.000 description 1
- 230000002829 reductive effect Effects 0.000 description 1
- 230000000717 retained effect Effects 0.000 description 1
- 238000005070 sampling Methods 0.000 description 1
- 238000004904 shortening Methods 0.000 description 1
- 238000001228 spectrum Methods 0.000 description 1
- 238000012795 verification Methods 0.000 description 1
Images






Classifications
-
- G—PHYSICS
- G01—MEASURING; TESTING
- G01T—MEASUREMENT OF NUCLEAR OR X-RADIATION
- G01T1/00—Measuring X-radiation, gamma radiation, corpuscular radiation, or cosmic radiation
- G01T1/16—Measuring radiation intensity
- G01T1/20—Measuring radiation intensity with scintillation detectors
- G01T1/2012—Measuring radiation intensity with scintillation detectors using stimulable phosphors, e.g. stimulable phosphor sheets
- G01T1/2014—Reading out of stimulable sheets, e.g. latent image
-
- G—PHYSICS
- G01—MEASURING; TESTING
- G01T—MEASUREMENT OF NUCLEAR OR X-RADIATION
- G01T1/00—Measuring X-radiation, gamma radiation, corpuscular radiation, or cosmic radiation
- G01T1/16—Measuring radiation intensity
- G01T1/20—Measuring radiation intensity with scintillation detectors
- G01T1/2012—Measuring radiation intensity with scintillation detectors using stimulable phosphors, e.g. stimulable phosphor sheets
Definitions
- the present invention relates to the recording and reading of a radiation image of an elongate body.
- a radiation image for example an image of X-rays transmitted by an object
- a screen comprising a photostimulable phosphor such as one of the phosphors described in European patent publication 503 702 published on 16.09.92 and US 5,340,661.
- the technique for reading out the stored radiation image consists of scanning the screen with stimulating radiation, such as laser light of the appropriate wavelength, detecting the light emitted upon stimulation and converting the emitted light into an electric representation for example by means of a photomultiplier.
- stimulating radiation such as laser light of the appropriate wavelength
- the signal is then digitized, processed and subsequently used to control the hard copy recording in image reproducing system such as a laser recorder. For diagnostic purposes the reproduction is viewed and analyzed on a lightbox.
- Stimulable phosphor screens used in this technique are selected from a variety of sizes which are adapted to the body part that is examined.
- the read out apparatus is designed so that it is able to accommodate and read all these sizes of screens.
- examination types exist in which a larger part of the body is examined than can be recorded on a single, even the largest sized cassette (among commonly used cassette types).
- Examples of such examination types are the diagnosis of the entire vertebral column or of the leg, so-called full leg - full spine examinations, where clinical indication requires that e.g. the full spine be examined at once to enable diagnosis or to qualify diagnosis.
- US 5,111,045 discloses a method wherein a radiation image of a large object such as a vertebral column is recorded on first and second stimulable phosphor screens that are successively positioned in the image recording unit of the apparatus with their confronting ends superimposed on each other in the recording position.
- the stimulable phosphor sheets are circulated in the apparatus along a circulatory path through a recording unit, a read out unit and an erasure unit. Special features are provided to hold the sheets in position at the recording unit. After having been exposed, the sheets are consecutively fed to a read out unit where a digital signal representation of the image stored in a sheet is obtained.
- the image signals representing the images read out of the two sheets are processed so as to combine image portions corresponding to the superimposed portions of the two photostimulable phosphor sheets, with the result that a combined image signal is produced. No details are given on the way in which this image processing is performed.
- US 5,130,541 discloses another method and apparatus for recording a radiation image of an elongate body.
- the method is based on the use of a plurality of elongated stimulable phosphor screens that are successively fed along a circulary path in a combined and dedicated exposure and read out device.
- the disclosure generally relates to the handling of the sheets in such a dedicated combined exposure and read out device.
- the present invention provides a method of recording and reading a radiation image of an elongate body, according to claim 1.
- the method of the present invention is advantageous in that it does not require the use of phosphor screens of sizes that are adapted to the size of the elongate body.
- the method of the present invention provides that a read out apparatus which is designed to accommodate 'normal size' screens can be used for reading the image of an elongate body.
- a plurality of photostimulable phosphor screens each having a size which is smaller than the size of the elongate body, are placed in a large size cassette in a partially overlapping or in a touching disposition.
- the pattern of reference marks may take different forms. Preferably it is composed of a grid or a raster of parallel horizontal and vertical threads of X-ray attenuating material. This embodiment eases the reconstruction of the complete image of the pattern of reference marks.
- the pattern of reference marks may be provided in the cassette wherein the plurality of photostimulable phosphor screens are mounted.
- the cassette is then to be positioned so that the pattern is situated between a source of radiation (X-ray source) and the screens so that, when being exposed, the radiation image of the pattern is recorded on the plurality of photostimulable phosphor screens.
- X-ray source X-ray source
- the grid may be mounted in the X-ray table or on an X-ray stand in between the X-ray source and the cassette.
- a complete image of the elongate body is constructed by means of the partial images.
- the reconstruction of the image of the elongate body from the constituent partial images is in the following referred to as 'stitching'.
- the way in which the partial images are assembled to form a complete image of the elongate body is guided by the way in which partial images of the pattern of reference marks are to be assembled to form the complete image of the pattern of reference marks. Further details on the way in which these images are formed is described extensively hereafter.
- a front-end Graphical User Interface may be used prior to stitching the partial images read out of the screens.
- a front-end Graphical User Interface may be used.
- the following functionality may be supported on the workstation: (1) rotate (90, 180, 270 degrees) functionality; (2) flip horizontal/vertical functionality; (3) anatomical order indication; (4) left-right or top-down composition.
- Fig. 1 shows a schematic representation of the contents of a cassette used in e.g. full leg or full spine examinations. It comprises a grid of strongly X-ray attenuating (e.g. metallic) threads, arranged in a rectangular periodic pattern. The grid is positioned in alignment with the cassette's borders. The grid covers the full surface of the cassette in a continuous way.
- the cassette holds a plurality of photostimulable phosphor screens. The screens may be positioned in a partially overlapping or non-overlapping arrangement.
- Figure 1 shows an arrangement wherein the screens are provided in a partially overlapping position.
- the overlap zone is shown in gray and non-visible image screen borders are drawn in dashed lines.
- an elongate body such as a human spine or a human leg
- penetrating radiation such as X-rays
- the elongate body is placed between an X-ray source and the cassette comprising the phosphor screens and the grid of attenuating material so that a partial image of the elongate body and a partial image of the grid is recorded on each of the screens in the cassette.
- the photostimulable phosphor screens are taken out of the large-size cassette.
- Each of the screens is then put into a 'normal-sized' cassette (i.e. a cassette the dimensions of which correspond to the size of the individual phosphor screens) and applied to a read out apparatus that is able to accommodate and scan the normal size cassettes.
- a 'normal-sized' cassette i.e. a cassette the dimensions of which correspond to the size of the individual phosphor screens
- the read out station is illustrated in figure 2 and comprises a laser 1 emitting light of a wavelength adapted to the stimulation spectrum of the phosphor used, galvanometric light deflection means 2 for deflecting light emitted by the laser onto the photostimulable phosphor screen, a light guide 3 directing light emitted by a stimulable phosphor screen into the light input face of a photomultiplier 4, a sample and hold circuit 5, and an analog to digital convertor 6.
- the read out device also comprises a processing module (not shown) for performing online processing on the digital signal representation of the radiation image.
- the read out signal is applied to a workstation (not shown) for off-line image processing.
- the operation of the read out station is as follows.
- Stimulating rays emitted by laser 1 are directed onto the photostimulable phosphor screen to scan this screen.
- the stimulating rays are deflected into the main scanning direction by means of galvanometric deflection means 2.
- Subscanning is performed by transporting the phosphor screen in the subscanning direction indicated by arrow 7.
- the photostimulable phosphor emits light within a second wavelength range which is different from the wavelength range of the stimulation light.
- the emitted light is directed by means of a light collector 3 onto a photomultiplier 4 for conversion into an electrical image representation.
- the signal is sampled by a sample and hold circuit 5, and converted into a digital raw image signal by means of an analog to digital convertor 6.
- the signals read out from the different photostimulable phosphor screens are then applied to a workstation for performing stitching, i.e. for re-assembling the image of the elongate body and the image of the grid from the sub-images read from the plurality of screens,
- the individual images may be displayed on a workstation that is equipped with a suitable user interface and the following functionality:
- the method applied to assemble the sub-images read out of the plurality of phosphor screens is based on : (1) the detection and modelling of the periodic grid and (2) cross-correlation of overlapping image parts.
- the periodic grid aids to align and stitch the sub-images with respect to each other. Since the grid covers the cassette's surface in a continuous way, the image of the grid should also be present in the assembled image (assembled from the sub-images read out of the plurality of screens) in a continuous way.
- the stitching algorithm is able to cope with the following reconstruction malfunctions :
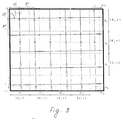
- Fig. 3 depicts the image of a grid, represented by solid lines, superimposed on one of the acquired sub-images.
- the grid is tilted with respect to the image borders either due to rotation of the screen in the elongated (large size) cassette, or due to rotation of the screen with respect to the scanning axis (due to non-perfect feeding of a screen through the image read out apparatus) or due to a combination of said misalignments.
- the tilt angle is shown enlarged for clarity.
- the figure further depicts grid model parameters: periodicity in horizontal and vertical direction, offset of the first grid line in horizontal and vertical direction, tilt angle.
- the dashed lines (---) denote subdivision into rectangular vertical and horizontal blocks for profile calculation, the dotted lines T denote the centre lines of the corresponding blocks.
- the hole marks (o) denote the positions of the vertical grid lines in the horizontal profiles
- the cross marks (x) denote the positions of the horizontal grid lines in the vertical profiles.
- Coordinates used in the process of image re-assembling are defined relative to a coordinate system.
- the origin of this system is situated in the upper left corner of figure 3, with coordinate m running inside a row from left to right along different columns (in the horizontal direction), coordinate n running from top to bottom along different rows (in the vertical direction).
- the solid lines represent the imprint of the attenuating grid onto the image.
- the raster formed by the grid lines may be tilted with an angle ⁇ h with respect to the horizontal axis. Normally, the tilt angle ⁇ h is small and has been drawn in an oversized way for clarity.
- Fig. 4 depicts the general flow of operations, the steps of which are further commented.
- the first step namely the acquisition of the sub-images has already been described higher.
- the sub-images are acquired by reading the individual phosphor screens.
- This step refers to the functions that are performed on the workstation prior to the stitching in order to provide that the partial images are processed in the right order, the right sense etc.
- the functions have been described higher, they include rotation, mirroring etc.
- the grid lines appear in the gray value profile of a horizontal or vertical line of pixels through the image, in the form of a signal peak superimposed onto the original diagnostic gray value originating from the elongate body.
- Fluctuations in the profile corresponding to original diagnostic gray values may however immerse the peak corresponding to a grid line and may therefore cause poor detectability of the grid lines.
- a horizontal box smoothing filter is applied to each sub-image S z to obtain S h / z.
- the signal to noise ratio for vertical gridlines is enhanced so that an image S v / z is obtained.
- the box filter is calculated in a recursive way, needing only one addition and one subtraction per pixel, irrespective of the kernel parameter K s .
- Fig. 3 shows an example of horizontal and vertical blocks used for integration, these blocks are represented by horizontal and vertical dashed lines (---) respectively.
- the centre line of each of the blocks is indicated with a horizontal resp. vertical dotted line E.
- the sequences of blocks associated with the central lines with coordinate m q resp. n q can be either spaced apart from one another or overlapping.
- the number of blocks Q h is in the range 4..M
- the number of blocks Q v is in the range 4..N.
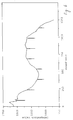
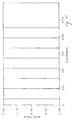
- Fig. 6 depicts a typical integration profile in a block of lines.
- the grid lines appear in the form of peaks in the block profiles. Because the size K s is much smaller than the image dimension M and N, the grid lines will form peaks even when the raster is tilted with an angle ⁇ . The effect of the rotation is a broadening of the peaks resulting in a decreased detectability.
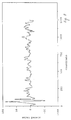
- the sequence of profiles is next submitted to a peak enhancement step by means of a Laplacian filter. Executed one-dimensionally on the profiles and it acts as a peak sharpening filter on the profiles, thereby enhancing the detectability of the peaks associated with the grid lines.
- the optimal Laplacian mask size depends on the pixel width of the peaks corresponding to grid lines, said size being a function of the thickness of the physical grid threads and the digitization resolution.
- the thickness of an attenuating grid line typically is in the range of 0.5 to 1 mm. This corresponds with 6 to 12 pixels when an image recorded in a photostimulable phosphor screen of 35x43 cm is digitized at a resolution of 2048x2496 pixels.
- the halfwidth K L of the Laplacian filter equals 11.
- Fig. 7 depicts the Laplacian enhanced profile of fig. 6.
- the peaks corresponding to grid lines are extracted using a known technique based on the sifting theory. This technique is for example described in "S. Herman, An introduction to sifting theory, SPIE Vol. 767, Medical Imaging (1987), pp. 332-337". Sifting is a nonlinear signal processing method with characteristic operation analogous to the operations in linear filter theory. In one dimension, a sifting filter is able to 'sieve' peaks so as to separate them according to their width. Depending on the hole size of the sieve, peaks with smaller base will fall through, peaks with larger base will be retained. Therefore, the analog of the low-pass linear filter is the long-pass sieve filter.
- a short-pass sieve favours short-duration signal components in analogy to a high pass linear filter and a band-pass sieve serves similar purposes as the band-pass linear filter.
- non-linear sieve filters and linear filters are that, although long-pass sieves will clip signal components smaller than the hole size, they will not alter the shapes of any signal components larger than the hole size, they will not change the edges of such long duration signals.
- linear filters operate on both positive and negative going signal features. Their non-linear sieve equivalent is called a bipolar sieve. However, it is also possible to have a monopolar sieve. Such a sieve will clip only the positive or negative going signals, but not both.
- the grid detection problem presents itself as one of sieving the peaks corresponding to grid lines only. These peaks are by their nature only directed in one sense, hence a monopolar sieve is needed to detect them and leave the peaks of other sense intact.
- a negative monopolar sieve is built composed of a sequence of a maximum operator followed by a minimum operator to eliminate negative going peaks.
- Fig. 8 depicts the result of sieving the signal represented in fig. 7. Analogously to the Laplacian halfwidth K L , the sieving halfwidth K M depends on the pixel width of the grid lines, hence on the physical dimensions of the grid threads, scanning resolution and processing resolution. In the context of the present invention, K M is in the range 3..9.
- a signal D containing negative going peaks only is obtained by subtracting the sieved signal H from the Laplacian enhanced signal
- q h 1,..,Q h
- q v 1,..,Q v
- the difference D contains zero or negative values only.
- Fig. 9 shows the difference profile as a result of subtracting the profile of fig. 8 from the profile of fig 7.
- the difference signal D is thresholded with an automatic threshold derived from the array of difference values, sorted e.g. in ascending order.
- a percentile of the cumulative histogram values can be used.
- the profile dependent automatic threshold T is determined as a fixed fraction entry of the sorted array E of difference values, multiplied by a factor ⁇ .
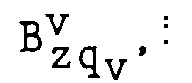
- T h zq h ⁇ E h zq h ( ⁇ N)
- q h 1,..,Q h
- T v zq v ⁇ E v zq v ( ⁇ M)
- q v 1,..,Q v in the context of the present invention
- ⁇ 0.05.
- the binary signal B is further processed to shrink the "1"-intervals to one pixel only to ease subsequent processing.
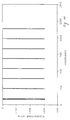
- Fig. 10 shows the thresholded and shrinked profile of fig. 9.
- the thresholded profile shows a marked presence of peaks according to gridlines; however, spurious peaks due to diagnostic detail may still be present.
- the pattern of peaks corresponding to grid lines has a periodicity.
- Mutual pixel distances are equal to an integral number of the periodicity numbers P h / z and P v / z searched for. Peaks not corresponding to grid lines will usually have interpixel distances different from an integral number of the periodicity number.
- a histogram of interpeak distances is built in which the distance between two peaks at coordinates m 1 and m 2 is divided by the number I(m 1 , m 2 ) of intermediate peaks to yield a normalized distance d(m 1 ,m 2 ).
- the index d of the maximum histogram entries h h / z(d) and h v / z(d) will equal the periodicity numbers P h / z resp. P v / z searched for.
- the grid is extracted from the series of peaks by an error minimization method.
- Each peak in the binary profile is subjected to the hypothesis that it corresponds to a physical grid line, and an accumulated error measure of the grid associated with said peak is computed.
- the peak with the least error attached to it is finally selected as the winner and the associated grid G is extracted by selecting all peaks in the profile within an small interval centered around an integral number r of periods from said winner peak.
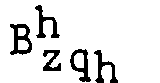
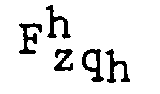
- G h zq h (n) 1 ⁇ (n i ,n j ):
- G v zq v (m) 1 ⁇ (m i ,m j ):
- the peak with the highest number of associated grid line peaks is selected.
- the grid sequences G are thus equal to the binary profiles B except for the removed non-grid peaks.
- Fig. 11 is identical to fig. 10 except that the non-grid peaks are removed by the disclosed grid detection algorithm.
- Parameters (P h / z,P v / z) are derived in the periodicity detection and grid lines determination section.
- the parameters (O h / zz,O v / z), ⁇ h / z are jointly derived from the sequences G as follows for a sequence of images, presented in top-down order, whereby image S z is assumed to lay on top of image S z-1 .
- Two grid matrices are determined, g h for the horizontal resp. g v for the vertical direction, storing the indexes of all grid lines detected from the sequences G h resp. G v .
- the grid matrices g h and g v have substantially smaller size than the sequences G h and G v . Due to the variability of the diagnostic detail in the image, it may happen that one or more grid lines are not detectable in the derived sequences G h and G v respectively. Therefore, whenever a gridline is missing in the sequences G h resp.
- G v a zero is inserted at the corresponding entry in g h and g v , such that the resulting arrangement of non-zero entries in a column of g h resp. a row of g v all correspond to the row resp. column locations of the same grid line passing through successive blocks.
- the overlap between two successive images S z-1 and S z can be partially derived from the matrices g h from the row position of the lowest horizontal grid line in S z-1 and the row position of the highest horizontal grid line in S z .
- different configurations of the screen borders with respect to the grid threads are possible and depicted in fig.5.
- the value of the actual overlap O h (z-1,z) is computed or verified by means of correlation and edge detection, discussed in the sections 'Overlap region image correlation' and 'Overlap region edge detection'. For the non-overlapping case, no strong correlation value is obtained, and a negative overlap is computed by subtracting an integral number of periods.
- Alternative embodiments such as line fitting and Hough transform grid line modelling are possible.
- Hough transform commonly known in the prior art such as e.g. W.K. Pratt, Digital Image Processing, Wiley, 1991, p. 613-622, Hough Transform Edge Linking. It is a basic property of the Hough Transform that each point in the image plane lying on a parameterizable curve, will transform into Hough space such that the Hough array point with coordinates equal to the parameters of the curve searched for will accumulate to a high value. The problem of extracting the grid lines is therefore reduced to a peak or maximum detection problem in Hough space, each peak representing a grid line.
- the peaks furthermore show the property that they will line up and will be spaced with an integral number of periods from one another, both properties being due to the fact that the corresponding lines are parallel and periodically arranged.
- the coordinates of each peak correspond to offset and slope (or angle) model parameters of the line.
- a second embodiment consists of subjecting each row resp. column of grid coordinates of the grid matrices g h and g v to a linear regression, commonly known in the prior art such as T.Pavlidis, Algorithms for Graphics and Image processing, Computer Science Press, 1982, pp. 281-292, Polygonal Approximations.
- a linear regression commonly known in the prior art such as T.Pavlidis, Algorithms for Graphics and Image processing, Computer Science Press, 1982, pp. 281-292, Polygonal Approximations.
- Each sub-image S z of which the grid shows an angle ⁇ h / z with the horizontal axis can be brought into alignment with the image borders by rotation over an angel - ⁇ h / z.
- Prior art is used to rotate a digita image artefact-free over a given angle, such as described in "G. Wolberg, Digital Imaging Warpint, IEEE Computer Society Press Monograph, 1990, Chapter 7.3. Rotation” and extended in "M. Republic, P. Thévenaz, L. Yaroslavsky, Convolution-Baser Interpolation for Fast, High-Quality Rotation of Images, IEEE. Trans. on Image Processing, Vol. 4, No. 10, Oct. 1995, pp. 1371-1381". Since the rotation angle is very small (e.g.
- the rotation is restricted in an alternative embodiment to a one-dimensional deskew or translation operation only, leading to a time-effective implementation.
- the offset parameters (O h / z, O v / z) are adjusted accordingly after rotation.
- the appropriate overlap formula depends on the overlap configuration and hence cannot be determined unambiguously on the basis of the quantities d g1 and d g2 alone.
- the overlap formula in each of the cases enumerated are completed and verified by a correlation computation. Therefore, the algorithm is refined as follows :
- the second term represents the sub-image correlation in the form of the average sum of absolute differences between A r (z-1,z) denoting the area of the hypothesized overlap region between sub-images S z-1 and S z at iteration r and with the domain of the indices i, j in the sums confined to said overlap region.
- Alternatives can be substituted for the correlation term by formulas commonly known in the prior art such as "W.K. Pratt, Digital Imaging Processing, 2nd ed., Wiley Interscience, 1991, pp. 662-671, Image Registration", "L.G. Brown, A Survey of Image Registration Techniques, ACM Computing Surveys, Vol, 24, No. 4, Dec. 1992, pp. 325-376.
- a mutual information measure is computed such as disclosed in the prior art in e.g. "P.A. Viola, Alignment by Maximization of Mutual Information, Massachusetts Institute of Technology, A.I. Technical Report No. 1548, June 1995".
- the measure C (z-1,z)r is maximal for overlapping image parts in register with one another.
- the overlap region is further characterized by the property that since the mean value ⁇ h (z-1)r of the image S z-1 is less exposed with respect to the mean value ⁇ h (z)r of the image S z , the screen corresponding to image S z will cause a gray value gradient to exist in image S z-1 .
- Said gray value gradient will extend over the full image width of image S z-1 and is slightly displaced in the upper direction with respect to the overlap value O h (z-1,z)r due to a non-scanned portion of the overlaying screen corresponding to image S z .
- the detection of the presence of the boundary of the overlap zone is therefore used as a verification means of the overlap determination.
- a threshold of 40 gray value increments on a 12 bit scale is used on the gradient magnitude between gray values of the attenuated overlap sub-region and the unattenuated sub-region of image S z-1 respectively, and a persistence of at least 95 % of the image width is required in order to attribute the edge to the overlap border.
Landscapes
- Physics & Mathematics (AREA)
- Health & Medical Sciences (AREA)
- Life Sciences & Earth Sciences (AREA)
- General Physics & Mathematics (AREA)
- High Energy & Nuclear Physics (AREA)
- Molecular Biology (AREA)
- Spectroscopy & Molecular Physics (AREA)
- Image Processing (AREA)
- Image Analysis (AREA)
- Conversion Of X-Rays Into Visible Images (AREA)
- Radiography Using Non-Light Waves (AREA)
- Apparatus For Radiation Diagnosis (AREA)
- Facsimiles In General (AREA)
- Facsimile Scanning Arrangements (AREA)
Abstract
Description
The stimulable phosphor sheets are circulated in the apparatus along a circulatory path through a recording unit, a read out unit and an erasure unit. Special features are provided to hold the sheets in position at the recording unit.
After having been exposed, the sheets are consecutively fed to a read out unit where a digital signal representation of the image stored in a sheet is obtained. Then, the image signals representing the images read out of the two sheets are processed so as to combine image portions corresponding to the superimposed portions of the two photostimulable phosphor sheets, with the result that a combined image signal is produced.
No details are given on the way in which this image processing is performed.
The method is based on the use of a plurality of elongated stimulable phosphor screens that are successively fed along a circulary path in a combined and dedicated exposure and read out device.
The disclosure generally relates to the handling of the sheets in such a dedicated combined exposure and read out device.
The way in which the partial images are assembled to form a complete image of the elongate body is guided by the way in which partial images of the pattern of reference marks are to be assembled to form the complete image of the pattern of reference marks. Further details on the way in which these images are formed is described extensively hereafter.
These functions may correct for incorrect sense of one or more of the images due to incorrect handling for the individual image screens by the radiology operator etc.
The grid is positioned in alignment with the cassette's borders. The grid covers the full surface of the cassette in a continuous way. The cassette holds a plurality of photostimulable phosphor screens. The screens may be positioned in a partially overlapping or non-overlapping arrangement.
The read out signal is applied to a workstation (not shown) for off-line image processing.
The stimulating rays are deflected into the main scanning direction by means of galvanometric deflection means 2. Subscanning is performed by transporting the phosphor screen in the subscanning direction indicated by arrow 7.
Upon stimulation, the photostimulable phosphor emits light within a second wavelength range which is different from the wavelength range of the stimulation light. The emitted light is directed by means of a light collector 3 onto a photomultiplier 4 for conversion into an electrical image representation.
Next, the signal is sampled by a sample and hold circuit 5, and converted into a digital raw image signal by means of an analog to digital convertor 6.
- dislocation of the grid in the transverse direction of one sub-image of the elongate body with regard to the grid of the next sub-image, said dislocation being due to dissimilar feed through of the screens,
- shortening or lengthening of a period of the grid in the longitudinal direction of the elongate body, said period covering partially one sub-image and partially the other subsequent sub-image,
- rotation of the grid of one sub-image with respect to the grid of the next sub-image, said rotation being due to minor differences in scanning angle in the longitudinal direction of successive sub-images and non-parallel alignment of individual imaging screens in the elongated cassette during exposure.
Z is the total number of sub-images to be stitched and is typically 3 or 4. The method however applies to any number of sub-images.
(M,N) denote the image dimensions. It is assumed without loss of generality that all sub-images have equal dimensions.
The sub-images are acquired by reading the individual phosphor screens.
In this context of this paragraph, since it is the object to detect the image of grid lines, the noise is composed of image fluctuations due to diagnostic detail whereas the relevant signals are the signal peaks representative of the grid lines .
In a similar way, by applying a vertical box smoothing filter, the signal to noise ratio for vertical gridlines is enhanced so that an image
Denoting by (2 Ks + 1) the size of the smoothing kernel that is used,
From the images

The effect of the rotation is a broadening of the peaks resulting in a decreased detectability. In order to cope with poor detectability, the sequence of profiles is next submitted to a peak enhancement step by means of a Laplacian filter.
Executed one-dimensionally on the profiles


In the context of the present embodiment, the halfwidth KL of the Laplacian filter equals 11. Fig. 7 depicts the Laplacian enhanced profile of fig. 6.
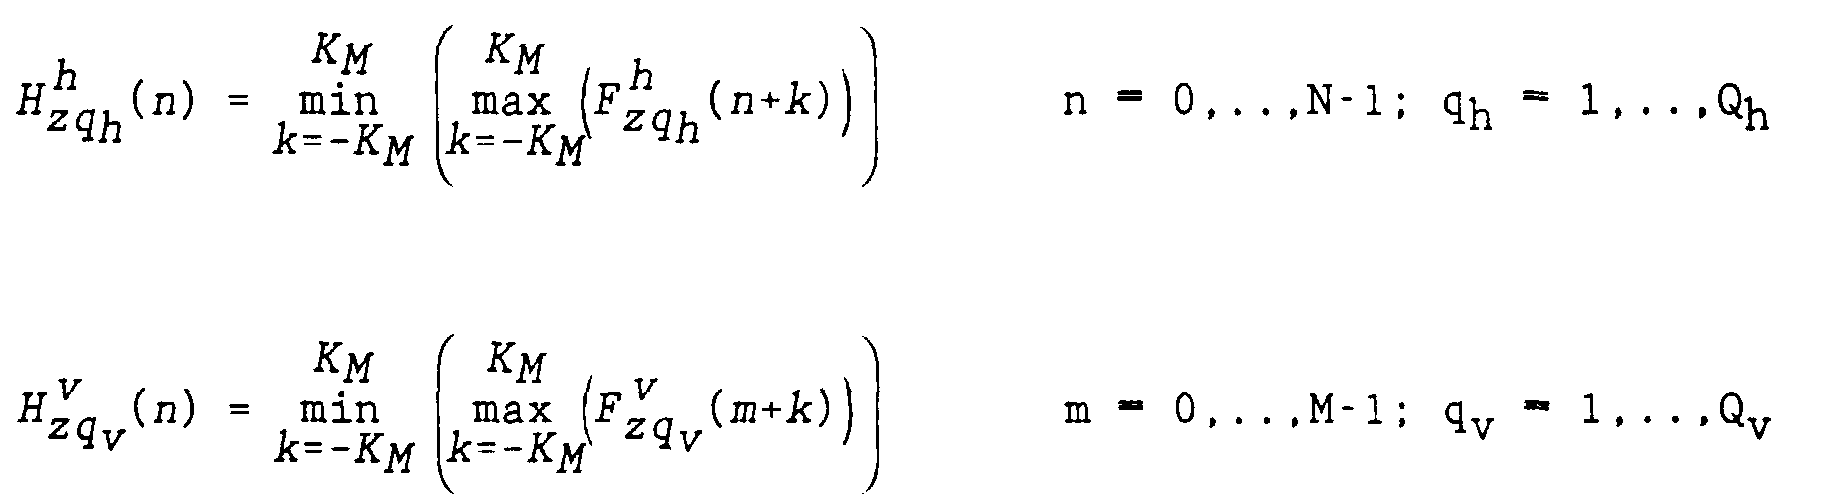
Fig. 8 depicts the result of sieving the signal represented in fig. 7. Analogously to the Laplacian halfwidth KL, the sieving halfwidth KM depends on the pixel width of the grid lines, hence on the physical dimensions of the grid threads, scanning resolution and processing resolution. In the context of the present invention, KM is in the range 3..9.
Alternatively, a percentile of the cumulative histogram values can be used.
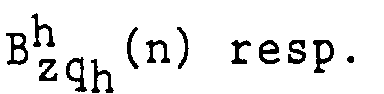
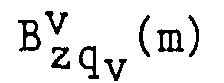

Obviously, the grid matrices gh and gv have substantially smaller size than the sequences Gh and Gv. Due to the variability of the diagnostic detail in the image, it may happen that one or more grid lines are not detectable in the derived sequences Gh and Gv respectively. Therefore, whenever a gridline is missing in the sequences Gh resp. Gv, a zero is inserted at the corresponding entry in gh and gv, such that the resulting arrangement of non-zero entries in a column of gh resp. a row of gv all correspond to the row resp. column locations of the same grid line passing through successive blocks. By denoting the number of detected grid lines in the sequences Gh and Gv by
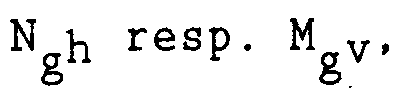


Denoting by dg1 the average distance between the lowest horizontal grid line and the lower border of the image Sz-1, and by dg2 the average distance between the upper border and the highest horizontal grid line of the image Sz, the following equations hold, recalling with reference to fig.4 that O h / z signifies the offset of the first horizontal grid line with respect to the horizontal sub-image border
Since the physical grid is periodic with the same period over all sub-images, it is further assumed that
It is further assumed that dg1 < Ph, dg2 < Ph, the former assumption meaning that all grid lines are visible and detected in the attenuated portion of each sub-image Sz, and both assumptions meaning that dg1 and dg2 represent integer fractions of the period. Should the latter assumption not be met, the integer number of pixels of the incomplete period at either the upper or lower side of the sub-image is easily derived by taking the remainder of the division by ph (dg1 ← dg1%Ph, dg2 ← dg2%Ph).
Table I summarizes the different cases. When no initial conditions are indicated for the case, dg1 and dg2 can each vary between O and Ph, and no value is imposed as to their sum. Invariably for all cases, a value referred to as the 'first overlap guess' is computed and is equal to (dg1 + dg2)%Ph. The value of the actual overlap Oh (z-1,z) is computed or verified by means of correlation and edge detection, discussed in the sections 'Overlap region image correlation' and 'Overlap region edge detection'. For the non-overlapping case, no strong correlation value is obtained, and a negative overlap is computed by subtracting an integral number of periods.
| Fig.5 | configuration | grid line inclusion | initial condition(s) | overlap O h / (z-1,z) |
| a | overlapping | one grid line, same | none | dg1+dg2 |
| b | overlapping | more grid lines, same | none | dg1+dg2+rPh,r>0 |
| c | overlapping | no common grid line | dg1+dg2>Ph | (dg1+dg2)%Ph |
| d | touching | no grid line involved | | 0 |
| e | touching | touching with grid line | | 0 |
| f | non-overlapping | no grid lines missing | dg1+dg2<Ph | dg1+dg2-Ph |
| g | non-overlapping | one/more grid lines | none | dg1+dg2-rPh,r>1 |
| missing |
It is a basic property of the Hough Transform that each point in the image plane lying on a parameterizable curve, will transform into Hough space such that the Hough array point with coordinates equal to the parameters of the curve searched for will accumulate to a high value. The problem of extracting the grid lines is therefore reduced to a peak or maximum detection problem in Hough space, each peak representing a grid line. The peaks furthermore show the property that they will line up and will be spaced with an integral number of periods from one another, both properties being due to the fact that the corresponding lines are parallel and periodically arranged. The coordinates of each peak correspond to offset and slope (or angle) model parameters of the line.
Therefore, the algorithm is refined as follows :
- compute the quantities
- augment the value Oh (z-1,z)0 with an integral number of periods
Ph
- the final amount of overlap is determined as the value Oh (z-1,z)r for which the corresponding correlation measure Ch (z-1,z)r is maximal and above some threshold and for which the mean value µh (z-1)r of the overlap sub-region of image Sz-1 corresponds to the less exposed situation with respect to the mean value µh (z)r of the overlap sub-region of image Sz, in the assumption that screen z is laid on top of screen (z-1) and hence screen z is attenuating the x-rays impinging on screen (z-1).
- when none of the correlation measure Ch (z-1,z)r,r = 0, ..R exceeds the threshold, it is concluded that no overlap is present and the images Sz-1 and Sz are separated by a negative overlap (a gap) of at least -(dg1 + dg2 - Ph).
With reference to fig.5:
- a positive overlap value Oh (z-1,z)r determines the number of rows to drop from the bottom part of image Sz-1,
- a negative overlap value Oh (z-1,z)r determines the number of rows to add in at the bottom part of image Sz-1,
- a positive shift value Ov (z-1,z)r determines the number of columns the image Sz-1 has to be moved to the left with respect to image Sz,
- a negative shift value Ov (z-l,z)r determines the number of columns the image Sz-1 has to be moved to the right with respect to image Sz in the composed image.
Claims (5)
- A method of recording and reading a radiation image of an elongate body, characterised by the steps of(a) simultaneously exposing a plurality of photostimulable phosphor screens each having a size which is smaller than the size of the elongate body, to distinct parts of a radiation image of the elongate body and of a pattern of reference marks,(b) scanning each of said screens by means of stimulating radiation, detecting light emitted upon stimulation and converting said light into signal representations of images stored in said screens,(c) extracting partial signal representations from said digital signal representations, said partial signal representations each representing a part of said pattern of reference marks that was stored in a screen,(d) determining from said partial signal representations the position of the image of the part of the pattern of reference marks stored in a screen.(e) stitching the signal representations obtained in step (b) in such a way that an image of the total pattern of reference marks is reconstructed making use of the determined positions of the parts of the pattern.
- A method according to claim 1 wherein said pattern of reference marks consists of a grid of threads of radiation attenuating material.
- A method according to claim 1 wherein said plurality of screens are conveyed in a cassette in a juxtaposed relationship.
- A method according to claims 2 wherein said grid is provided in said cassette.
- A method according to claim 2 wherein said grid is formed by mutually orthogonal horizontal and vertical threads and wherein said position is determined by determining offset of horizontal and vertical lines of the grid with respect to horizontal and vertical image borders, periodicity of said pattern in horizontal and vertical direction, inclination of grid lines relative to horizontal or vertical direction.
Priority Applications (4)
| Application Number | Priority Date | Filing Date | Title |
|---|---|---|---|
| EP19970200857 EP0866342B1 (en) | 1997-03-21 | 1997-03-21 | Method of recording and reading a radiation image of an elongate body |
| DE1997632829 DE69732829T2 (en) | 1997-03-21 | 1997-03-21 | Method for recording and reproducing a radiation image from an elongated body |
| US09/035,528 US5986279A (en) | 1997-03-21 | 1998-03-05 | Method of recording and reading a radiation image of an elongate body |
| JP10090625A JPH10268451A (en) | 1997-03-21 | 1998-03-20 | Method for recording and reading radiation image of slender object |
Applications Claiming Priority (1)
| Application Number | Priority Date | Filing Date | Title |
|---|---|---|---|
| EP19970200857 EP0866342B1 (en) | 1997-03-21 | 1997-03-21 | Method of recording and reading a radiation image of an elongate body |
Publications (2)
| Publication Number | Publication Date |
|---|---|
| EP0866342A1 true EP0866342A1 (en) | 1998-09-23 |
| EP0866342B1 EP0866342B1 (en) | 2005-03-23 |
Family
ID=8228136
Family Applications (1)
| Application Number | Title | Priority Date | Filing Date |
|---|---|---|---|
| EP19970200857 Expired - Lifetime EP0866342B1 (en) | 1997-03-21 | 1997-03-21 | Method of recording and reading a radiation image of an elongate body |
Country Status (3)
| Country | Link |
|---|---|
| EP (1) | EP0866342B1 (en) |
| JP (1) | JPH10268451A (en) |
| DE (1) | DE69732829T2 (en) |
Cited By (12)
| Publication number | Priority date | Publication date | Assignee | Title |
|---|---|---|---|---|
| WO2001089199A1 (en) * | 2000-05-16 | 2001-11-22 | Heidelberger Druckmaschinen Aktiengesellschaft | Method for combining scanned partial-image data |
| EP1231484A2 (en) | 2001-02-13 | 2002-08-14 | Eastman Kodak Company | Method for combining partial radiation images to reconstruct a full image |
| EP1291712A1 (en) * | 2001-09-11 | 2003-03-12 | Eastman Kodak Company | Apparatus for radiographically imaging elongated objects |
| US6793390B2 (en) | 2002-10-10 | 2004-09-21 | Eastman Kodak Company | Method for automatic arrangement determination of partial radiation images for reconstructing a stitched full image |
| EP1220021A3 (en) * | 2000-12-21 | 2005-01-12 | Eastman Kodak Company | Elongated radiography cassete with means for exposing reference marks |
| US6895106B2 (en) | 2001-09-11 | 2005-05-17 | Eastman Kodak Company | Method for stitching partial radiation images to reconstruct a full image |
| WO2007134769A3 (en) * | 2006-05-24 | 2009-12-03 | DüRR DENTAL AG | Memory unit for producing radiographic images, and method for reading such a memory unit |
| EP2497424A1 (en) | 2011-03-07 | 2012-09-12 | Agfa Healthcare | Radiographic imaging method and apparatus. |
| WO2012136520A1 (en) | 2011-04-07 | 2012-10-11 | Agfa Healthcare | Method of generating a radiation image of an elongate body |
| EP2535866A1 (en) | 2011-06-16 | 2012-12-19 | Agfa HealthCare | Method to detect and indicate inaccuracies in long length imaging |
| WO2017178363A1 (en) | 2016-04-15 | 2017-10-19 | Agfa Healthcare | Method for generating a radiation image of a region of interest of an object |
| CN110361017A (en) * | 2019-07-19 | 2019-10-22 | 西南科技大学 | A kind of full traverse path planing method of sweeping robot based on Grid Method |
Families Citing this family (8)
| Publication number | Priority date | Publication date | Assignee | Title |
|---|---|---|---|---|
| US7558438B1 (en) | 1998-12-15 | 2009-07-07 | Fujifilm Corporation | System for synthesizing divisional images based on information indicating relationship between a series of divisional images |
| US6600831B1 (en) | 1999-03-23 | 2003-07-29 | Fuji Photo Film Co., Ltd. | Connection processing method for radiation images |
| JP4040222B2 (en) | 1999-03-23 | 2008-01-30 | 富士フイルム株式会社 | Radiographic image connection processing method and radiographic image processing apparatus |
| JP4507325B2 (en) * | 2000-01-21 | 2010-07-21 | パナソニック株式会社 | X-ray equipment |
| US20040011976A1 (en) * | 2002-04-12 | 2004-01-22 | Kay George W. | Radiation sensitive recording plate and method of making and using same |
| JP4661209B2 (en) * | 2004-12-24 | 2011-03-30 | コニカミノルタエムジー株式会社 | Medical image output system |
| DE102007025448B4 (en) * | 2007-05-31 | 2010-10-07 | Siemens Ag | X-ray detector system with at least two X-ray detectors, X-ray recording system and method for taking a total X-ray image |
| JP5537190B2 (en) * | 2010-03-03 | 2014-07-02 | 富士フイルム株式会社 | Shading correction apparatus and method, and program |
Citations (4)
| Publication number | Priority date | Publication date | Assignee | Title |
|---|---|---|---|---|
| US4683377A (en) * | 1982-07-05 | 1987-07-28 | Fuji Photo Film Co., Ltd. | Subtraction processing method and apparatus for radiation images |
| US4710875A (en) * | 1982-03-20 | 1987-12-01 | Fuji Photo Film Co., Ltd. | Alignment procedure for radiation images undergoing subtraction processing |
| US5111045A (en) * | 1990-04-03 | 1992-05-05 | Fuji Photo Film Co., Ltd. | Apparatus for recording and reading radiation image information |
| US5130541A (en) * | 1990-05-21 | 1992-07-14 | Fuji Photo Film Co., Ltd. | Method of and apparatus for recording and reading radiation image |
-
1997
- 1997-03-21 DE DE1997632829 patent/DE69732829T2/en not_active Expired - Lifetime
- 1997-03-21 EP EP19970200857 patent/EP0866342B1/en not_active Expired - Lifetime
-
1998
- 1998-03-20 JP JP10090625A patent/JPH10268451A/en active Pending
Patent Citations (4)
| Publication number | Priority date | Publication date | Assignee | Title |
|---|---|---|---|---|
| US4710875A (en) * | 1982-03-20 | 1987-12-01 | Fuji Photo Film Co., Ltd. | Alignment procedure for radiation images undergoing subtraction processing |
| US4683377A (en) * | 1982-07-05 | 1987-07-28 | Fuji Photo Film Co., Ltd. | Subtraction processing method and apparatus for radiation images |
| US5111045A (en) * | 1990-04-03 | 1992-05-05 | Fuji Photo Film Co., Ltd. | Apparatus for recording and reading radiation image information |
| US5130541A (en) * | 1990-05-21 | 1992-07-14 | Fuji Photo Film Co., Ltd. | Method of and apparatus for recording and reading radiation image |
Cited By (19)
| Publication number | Priority date | Publication date | Assignee | Title |
|---|---|---|---|---|
| WO2001089199A1 (en) * | 2000-05-16 | 2001-11-22 | Heidelberger Druckmaschinen Aktiengesellschaft | Method for combining scanned partial-image data |
| EP1220021A3 (en) * | 2000-12-21 | 2005-01-12 | Eastman Kodak Company | Elongated radiography cassete with means for exposing reference marks |
| EP1231484A2 (en) | 2001-02-13 | 2002-08-14 | Eastman Kodak Company | Method for combining partial radiation images to reconstruct a full image |
| EP1291712A1 (en) * | 2001-09-11 | 2003-03-12 | Eastman Kodak Company | Apparatus for radiographically imaging elongated objects |
| US6744062B2 (en) | 2001-09-11 | 2004-06-01 | Eastman Kodak Company | Apparatus for radiographically imaging elongated objects |
| US6895106B2 (en) | 2001-09-11 | 2005-05-17 | Eastman Kodak Company | Method for stitching partial radiation images to reconstruct a full image |
| US6793390B2 (en) | 2002-10-10 | 2004-09-21 | Eastman Kodak Company | Method for automatic arrangement determination of partial radiation images for reconstructing a stitched full image |
| EP1408450A3 (en) * | 2002-10-10 | 2009-07-01 | Carestream Health, Inc. | Automatic arrangement determination of partial radiation images for reconstructing a stitched full image |
| WO2007134769A3 (en) * | 2006-05-24 | 2009-12-03 | DüRR DENTAL AG | Memory unit for producing radiographic images, and method for reading such a memory unit |
| EP2497424A1 (en) | 2011-03-07 | 2012-09-12 | Agfa Healthcare | Radiographic imaging method and apparatus. |
| WO2012119856A1 (en) | 2011-03-07 | 2012-09-13 | Agfa Healthcare | Radiographic imaging method and apparatus |
| CN103429157A (en) * | 2011-03-07 | 2013-12-04 | 爱克发医疗保健公司 | Radiographic imaging method and apparatus |
| CN103429157B (en) * | 2011-03-07 | 2017-01-18 | 爱克发医疗保健公司 | radiographic imaging method and apparatus |
| WO2012136520A1 (en) | 2011-04-07 | 2012-10-11 | Agfa Healthcare | Method of generating a radiation image of an elongate body |
| EP2535866A1 (en) | 2011-06-16 | 2012-12-19 | Agfa HealthCare | Method to detect and indicate inaccuracies in long length imaging |
| WO2012172006A2 (en) | 2011-06-16 | 2012-12-20 | Agfa Healthcare | Method to detect and indicate inaccuracies in long length imaging |
| WO2017178363A1 (en) | 2016-04-15 | 2017-10-19 | Agfa Healthcare | Method for generating a radiation image of a region of interest of an object |
| CN110361017A (en) * | 2019-07-19 | 2019-10-22 | 西南科技大学 | A kind of full traverse path planing method of sweeping robot based on Grid Method |
| CN110361017B (en) * | 2019-07-19 | 2022-02-11 | 西南科技大学 | A full traversal path planning method for sweeping robot based on grid method |
Also Published As
| Publication number | Publication date |
|---|---|
| JPH10268451A (en) | 1998-10-09 |
| EP0866342B1 (en) | 2005-03-23 |
| DE69732829T2 (en) | 2006-04-13 |
| DE69732829D1 (en) | 2005-04-28 |
Similar Documents
| Publication | Publication Date | Title |
|---|---|---|
| US5986279A (en) | Method of recording and reading a radiation image of an elongate body | |
| EP0866342B1 (en) | Method of recording and reading a radiation image of an elongate body | |
| AU595881B2 (en) | View-to-view image correction for object motion | |
| EP0919856B1 (en) | Method and assembly for recording a radiation image of an elongate body | |
| US6273606B1 (en) | Method and assembly for recording a radiation image of an elongate body | |
| US6704440B1 (en) | Method and apparatus for processing a medical image containing clinical and non-clinical regions | |
| US6775399B1 (en) | ROI segmentation image processing system | |
| JP2003126071A (en) | Method for stitching partial radiation image to reconstruct full image | |
| US5579402A (en) | Method for constructing a histogram in digital image processing by statistical pixel sampling | |
| JPH10133309A (en) | Method for correcting a defect in a radiographic image on a recording member | |
| EP0689794B1 (en) | Method for forming energy subtraction images | |
| US6563943B1 (en) | Connection processing method for radiation images | |
| EP0329191B1 (en) | A method of recognizing subdivision patterns of radiation images | |
| EP0919858B1 (en) | Method for reconstructing a radiation image of a body from partial radiation images | |
| US8913813B2 (en) | Method of determining spatial response signature of detector in computed radiography | |
| JP4307877B2 (en) | Image processing apparatus and image processing method | |
| JP2532940B2 (en) | False image signal detection method | |
| US7184062B2 (en) | Statistically-based image blending methods and systems for pasting multiple digital sub-images together | |
| US5633509A (en) | Energy subtraction processing method and apparatus | |
| JP2598636B2 (en) | Image processing condition determination method | |
| JPH0281278A (en) | Desired picture area determining method | |
| Forthmann et al. | Comparison of three sinogram restoration methods | |
| JPH0677576B2 (en) | Medical image capturing posture determination method | |
| JPH0620237B2 (en) | Image signal noise detection method | |
| JPH0693076B2 (en) | Radiation image information reading method |
Legal Events
| Date | Code | Title | Description |
|---|---|---|---|
| PUAI | Public reference made under article 153(3) epc to a published international application that has entered the european phase |
Free format text: ORIGINAL CODE: 0009012 |
|
| AK | Designated contracting states |
Kind code of ref document: A1 Designated state(s): BE DE FR GB |
|
| AX | Request for extension of the european patent |
Free format text: AL;LT;LV;RO;SI |
|
| 17P | Request for examination filed |
Effective date: 19990323 |
|
| AKX | Designation fees paid |
Free format text: BE DE FR GB |
|
| RBV | Designated contracting states (corrected) |
Designated state(s): BE DE FR GB |
|
| RAP1 | Party data changed (applicant data changed or rights of an application transferred) |
Owner name: AGFA-GEVAERT |
|
| 17Q | First examination report despatched |
Effective date: 20040421 |
|
| GRAP | Despatch of communication of intention to grant a patent |
Free format text: ORIGINAL CODE: EPIDOSNIGR1 |
|
| GRAS | Grant fee paid |
Free format text: ORIGINAL CODE: EPIDOSNIGR3 |
|
| GRAA | (expected) grant |
Free format text: ORIGINAL CODE: 0009210 |
|
| AK | Designated contracting states |
Kind code of ref document: B1 Designated state(s): BE DE FR GB |
|
| REG | Reference to a national code |
Ref country code: GB Ref legal event code: FG4D |
|
| REF | Corresponds to: |
Ref document number: 69732829 Country of ref document: DE Date of ref document: 20050428 Kind code of ref document: P |
|
| PLBE | No opposition filed within time limit |
Free format text: ORIGINAL CODE: 0009261 |
|
| STAA | Information on the status of an ep patent application or granted ep patent |
Free format text: STATUS: NO OPPOSITION FILED WITHIN TIME LIMIT |
|
| ET | Fr: translation filed | ||
| 26N | No opposition filed |
Effective date: 20051227 |
|
| REG | Reference to a national code |
Ref country code: GB Ref legal event code: 746 Effective date: 20070213 |
|
| REG | Reference to a national code |
Ref country code: GB Ref legal event code: 732E |
|
| REG | Reference to a national code |
Ref country code: FR Ref legal event code: TP |
|
| BECA | Be: change of holder's address |
Owner name: *AGFA HEALTHCARE N.V.SEPTESTRAAT 27, B-2640 MORTSE Effective date: 20070321 Owner name: *AGFA HEALTHCARE N.V.SEPTESTRAAT 27, B-2640 MORTSE Effective date: 20050323 |
|
| BECH | Be: change of holder |
Owner name: *AGFA HEALTHCARE N.V. Effective date: 20050323 |
|
| REG | Reference to a national code |
Ref country code: FR Ref legal event code: PLFP Year of fee payment: 20 |
|
| PGFP | Annual fee paid to national office [announced via postgrant information from national office to epo] |
Ref country code: DE Payment date: 20160212 Year of fee payment: 20 |
|
| PGFP | Annual fee paid to national office [announced via postgrant information from national office to epo] |
Ref country code: FR Payment date: 20160208 Year of fee payment: 20 Ref country code: GB Payment date: 20160208 Year of fee payment: 20 Ref country code: BE Payment date: 20160205 Year of fee payment: 20 |
|
| REG | Reference to a national code |
Ref country code: DE Ref legal event code: R071 Ref document number: 69732829 Country of ref document: DE |
|
| REG | Reference to a national code |
Ref country code: GB Ref legal event code: PE20 Expiry date: 20170320 |
|
| PG25 | Lapsed in a contracting state [announced via postgrant information from national office to epo] |
Ref country code: GB Free format text: LAPSE BECAUSE OF EXPIRATION OF PROTECTION Effective date: 20170320 |