Technical Field
The present invention relates to methods of diagnosing, screening or
prognosing diseases. More particularly, the present invention relates to a method of
diagnosing, screening or prognosing diseases in humans or animals, and for
determining the severity and cause of the disease.
The present invention further relates to a computer assisted method of
diagnosing, screening or prognosing diseases, utilizing one or multiple neural
networks to obtain a diagnostic index. In preferred embodiments of the present
invention, the method is used to diagnose, and prognose diseases such as osteoporosis
and cancers, including but not limited to ovarian, breast, testicular, colon and prostate
cancer. In another preferred embodiment, the invention includes a system to receive
patient data transmitted from data transmitting stations, to process these data through
the trained neural networks to produce a diagnostic value or prognostic value, and to
transmit these values to a remote data receiving means.
Background of the Invention
As used herein, the term "disease" is defined as a deviation from the normal
structure or function of any part, organ or system of the body (or any combination
thereof). A specific disease is manifested by characteristic symptoms and signs,
including both chemical and physical changes. A disease is often associated with a
variety of other factors including but not limited to demographic, environmental,
employment, genetic and medically historical factors. Certain characteristic signs,
symptoms, and related factors can be quantitated through a variety of methods to yield
important diagnostic information. For purposes of this application, the quantifiable
signs, symptoms and/or analytes in biological fluids characteristic of a particular
disease are defined as "biomarkers" for the disease. Current diagnostic and prognostic
methods depend on the identification and evaluation of these biomarkers, both
individually and as they relate to one another. Often the diagnosis of a particular
disease involves the subjective analysis by a clinician, such as a physician,
veterinarian, or other health care provider, of the data obtained from the measurement
of the factors mentioned above in conjunction with a consideration of many of the
traditionally less quantitative factors such as employment history. Unfortunately, this
subjective process of diagnosing or prognosing a disease usually cannot accommodate
all the potentially relevant factors and provide an accurate weighting of their
contribution to a correct diagnosis or prognosis.
Generally, the pathological process involves gradual changes that become
apparent only when overt change has occurred. In many instances, pathological
changes involve subtle alterations in multiple biomarkers. It is uncommon that a single
biomarker will be indicative of the presence or absence of a disease. It is the pattern of
those biomarkers relative to one another and relative to a normal reference range, that
is indicative of the presence of a disease. Additional factors including but not limited
to demographic, environmental, employment, genetic and medically historical factors
may contribute significantly to the diagnosis or prognosis of a disease, especially
when considered in conjunction with patterns of biomarkers. Unfortunately, the
subjective diagnostic process of considering the multiple factors associated with the
cause or presence of a disease is somewhat imprecise and many factors that may
contribute significantly are not afforded sufficient weight or considered at all.
When individual biomarkers do not show a predictable change and the patterns
and interrelationships among the biomarkers viewed collectively are not clear, the
accuracy of a physician's diagnosis is significantly reduced. Also, as the number of
biomarkers and demographic variables relevant for the diagnosis of a particular disease
increases, the number of relevant diagnostic patterns among these variables increases.
This increasing complexity decreases the clinician's ability to recognize patterns and
accurately diagnose or predict disease.
Prostate cancer affects numerous individuals each year and many of them are
killed by the disease. The early and accurate diagnosis of prostate cancer has been
very difficult to achieve with reliability and accuracy. However, early diagnosis of
prostate cancer is essential to maximizing the possibility of successfully treating the
disease. Current screening techniques include digital rectal examination (DRE),
transurethral prostatic biopsy, and measurement of prostate specific antigen (PSA) in
the blood. Reliance on serum PSA levels, especially low PSA levels, as a sole
diagnostic measure of prostate cancer often provides unacceptable levels of inaccurate
diagnosis. These screening techniques miss many cases of early stage prostate cancer
resulting in growth of the cancer within the prostate gland and also outside the capsule
of the gland. It is essential to diagnose this disease in the early stages, well before
metastases have occurred.
In addition, diagnostic methods should be capable of distinguishing between
benign prostatic hyperplasia (BPH) and prostate cancer and to distinguish between
cases of cancer and non-cancer. What is also needed is a valid, reliable, sensitive and
accurate technique that can diagnose or prognose prostate cancer at an early stage and
also distinguish the various stages of prostate cancer which can be characterized as
T1b, T2, T3 and TNxM1.
Osteoporosis and osteopenia provide another example of disease with multiple
biomarkers, the following biomarkers collectively show characteristic changes in the
presence of osteoporosis: calcium, phosphate, estradiol (follicular, mid-cycle, luteal,
or post-menopausal), progesterone (follicular, mid-cycle, luteal, mid-luteal, oral
contraceptive, or over 60 years), alkaline phosphatase, percent liver-ALP, and total
intestinal-ALP. After measuring these biomarkers, a diagnosing clinician would next
compare the measurements to a normal reference range. While some of the biomarkers
may fall outside the normal reference range, others may fall clearly within the normal
reference range. In some circumstances, all of the biomarker values may fall within a
normal reference range. Presented with such data, a clinician may suspect that a
patient has undergone some bone loss, but will be unable to reach a conclusive and
meaningful diagnosis as to the presence of the disease osteoporosis.
The characteristic changes in biomarkers associated with some diseases are
well documented; however, the quantitative interpretation of each particular biomarker
in diagnosing a disease and determining a prognosis is not well established. The
difficulties inherent in formulating a diagnosis from the analysis of a set of laboratory
data is best illustrated by looking closer at conventional diagnostic methods for a
specific disease. A discussion of the disease osteoporosis follows.
The term "osteopenia" as used herein means any decrease in bone mass below
the normal. The term "osteoporosis" as used herein means a specific form of
generalized osteopenia characterized by a decrease in bone density, low bone mass,
and microarchitectural deterioration of bone tissue.
Osteopenia encompasses a group of diseases with diverse etiologies typified by
reduction in bone mass per unit volume to a level below that which is necessary for
adequate mechanical support. Osteoporosis is the result of the gradual depletion of the
inorganic portion of the skeleton and can be caused by any number of factors.
Primary osteoporosis is an age related disorder that is particularly common in women
and is characterized by decreased bone mass in the absence of other recognizable
causes. However, osteoporosis occurs in both men and women. In women it is
recognized usually at the 5th or 6th decade, following menopause. In men
osteoporosis is often recognized around their 6th or 7th decade of life.
Several demographic parameters are associated with enhanced risk of
developing osteoporosis. The following is a partial list of individuals whose
demographics and behavior place them at risk for developing osteoporosis:
In addition to being female, the three most significant risk factors are poor diet,
lack of exercise, and being postmenopausal. Other risk factors which are associated
with osteoporosis include racial factors such as Caucasian or Oriental ancestry, a fair
complexion, and a family history of osteoporosis.
The onset of osteoporosis may be insidious or sudden, following trauma. The
most common complaint associated with osteoporosis is back pain. Eventually, the
pain may spread to the pelvis, the thorax, and the shoulders. In the spine, the
vertebrae can compress, and the back can take on a "bent" appearance. Conditions
such as kyphosis (humpback) or scoliosis may occur. If the spine becomes deformed,
other body parts can be affected as well. For example, the ribs can be pushed against
the pelvis, or the stomach can be pushed into the pelvis. In addition to spinal
problems, osteoporosis can also lead to fractures of the hip, wrist, and ribs. These
fractures can occur with only slight trauma and sometimes with no trauma at all.
Mazess B., et al., "Bone Density of the Radius, Spine, and Proximal Femur in
Osteoporosis," J. of Bone and Mineral Research, Vol. 3, pgs. 13-18, (1988); Riggs
B. L., et al., "Involutional Osteoporosis", New Engl. J. Med., Vol. 314, pgs. 1676-1686,
(1986). The changes associated with osteoporosis are gradual so osteoporosis
is often not detected in its early stages.
Calcium and phosphorus are the main components of the inorganic portion of
the skeleton. Chemical analysis of blood may reveal calcium, phosphorus, and
alkaline phosphatase within the normal range. However, an isoenzyme of alkaline
phosphatase may be significantly increased. Increased bone resorption seen in
osteoporotic patients, which occurs as a result of the action of osteoclasts, usually
involves the dissolution of both minerals and organic matrix eventually leading to
increased excretion of urinary hydroxyproline. Serum estradiol which is secreted
almost entirely by the ovary is significantly decreased in these patients.
An early decrease in bone mass can be measured by non-invasive assessment
of the skeleton by four widely available methods that are known to those skilled in the
art, including single photon absorptometry, dual photon absorptometry (DPA), dual-energy
x-ray absorptometry (DXA), and quantitative computed tomography
(CAT scan). Several of these methods are used to
measure mineral content in the bone, and some are relatively selective for certain bones
or trabecular versus cortical bone. These methods also provide different levels of
radiation exposure.
Magnetic resonance imaging (MRI) and positron emission tomographic (PET)
techniques may also reveal information useful in the diagnosis of various diseases
including osteopenia and osteoporosis by providing information concerning bone
density and vitality.
Radiographic absorptometry (RA) is a method for non-invasive measurement
of bone mineral x-rays of the hand. Radiographs, taken with a standard x-ray
machine, are sent to a central laboratory for computer-controlled analysis.
Current standard diagnostic techniques, are not effective for early detection of
osteoporosis. Changes seen in osteoporosis are very gradual, and often go undetected
in the early stages of the disease. Osteoporosis is often not detected in its early stages
because bone mass must be decreased by about 30% to 40% before it is apparent using
standard x-ray diagnostic techniques. Preventing osteoporosis by detecting early bone
loss is far better than identifying the disease at relatively advanced stages and
subsequently attempting to prevent its progression. Once major deterioration has
occurred and gaps exist between the ends of fractured trabecular bone, no current treatment
can be expected to restore the lost bone. Thus, therapeutic efforts must be directed
toward prevention and early recognition of the progressive disease so treatment can be
instituted before essentially irreversible structural damage ensues. Cummings S.R., et
al., "Should Perimenopausal Women Be Screened for Osteoporosis?", Ann. Int.
Med., Vol. 104, pgs. 817-823, (1986); Courpron P., "Bone Tissue Mechanisms
Underlying Osteoporosis," Orthop. Clin. North Am., Vol. 12, pgs. 513-545, (1981);
Frost H. M., "Mechanical Determinants of Bone Modeling," Metabol. Bone. Dis.
Rel. Res., Vol. 4, pgs. 217-229, (1982). What is needed is a method for early
detection and prediction of osteoporosis that considers the multiple biomarker and
demographic variables associated with the disease.
One of the problems with the current methods for diagnosing osteoporosis is
that the procedures do not give any information about the underlying cause of the
osteoporosis, making it difficult to prescribe an appropriate course of treatment for the
patient. For example, a common cause of postmenopausal osteoporosis is an estrogen
deficit, which x-ray techniques cannot measure. Another problem inherent in the
current diagnostic methods for osteopenia is that all of the current methods require
expensive, sophisticated medical instrumentation to perform the bone density
measurements. Additionally, patients must be exposed to x-rays. This makes a
general screening of high risk populations impractical due to the expense and
unavailability of the necessary instrumentation to the average clinic.
In view of the difficulties associated with extracting a diagnosis from the
laboratory data for a set of predictive biomarkers, and also from demographic data
optionally combined with biomarker data, there is need for automated diagnostic
systems that are capable of complex pattern recognition. There have been several
attempts at using computational models to achieve pattern recognition in diagnostics.
One of the most popular computational methods for making diagnoses from
multivariate laboratory data has been discriminate function analysis. However,
diagnostic systems that rely exclusively on classical pattern recognition technology
(geometric, syntactic, template, statistical) are not effective for evaluating the
characteristic biomarker patterns of many disease states partially due to the inherent
non-linear nature of the problem and a lack of known mathematical structure in the
observed data. There is no clear set of rules that accurately describes how to analyze a
set of biomarkers to reach a diagnosis.
In recent years, artificial neural networks have been gaining popularity as a
means for recognizing and analyzing subtle diagnostic patterns in multivariate
laboratory data. Neural networks possess the ability to discern patterns and trends too
subtle or too complex for humans and conventional computational methods to identify.
While humans can not easily assimilate more than two or three variables at once,
neural networks can perceive correlations among hundreds of variables. Examples of
areas in which neural networks have been explored for their value in clinical diagnosis
and/or prognosis include:
- psychiatry (See Mulsant, B.H., "A Neural Network as an Approach to
Clinical Diagnosis", MD Computing, Vol. 7, pp. 25-36 (1990));
- autism (See Cohen, I., et al., "Diagnosing Autism: A Neural Net-Based
Tool", PCAI, pp. 22-25 (May/June 1994);
- pediatric radiology (See Boone, J.M., et al., "Neural Networks in
Radiologic Diagnosis. I. Introduction and Illustration", Invest. Radiol., Vol. 25, pp.
1012-1016, (1990) and Gross, G.W., et al., "Neural Networks in Radiologic
Diagnosis. II. Interpretation of Neonatal Chest Radiographs", Invest. Radiol., Vol.
25, pp. 1017-1023 (1990));
- breast cancer (See Astion, M.L., et al., "Application of Neural
Networks to the Interpretation of Laboratory Data in Cancer Diagnosis", Clin. Chem.,
Vol. 38, No. 1, pp. 34-38 (1992); Wu, Y., et al., "Artificial Neural Networks in
Mammography: Application to Decision Making in the Diagnosis of Breast Cancer",
Radiology, Vol. 187, pp. 81-87 (1993); Kappen, H.J., et al., "Neural Network
Analysis to Predict Treatment Outcome", Annals of Oncology, Vol. 4, Supp. 4, pp.
S31-S34 (1993); and, Ravdin, P.M., et al., "A practical application of neural network
analysis for predicting outcome of individual breast cancer patients", Breast Cancer
Research and Treatment, Vol. 22, pp. 285-293 (1992));
- ovarian cancer (See Wilding, P., et. al., "Application of
backpropogation neural networks to diagnosis of breast and ovarian cancer", Cancer
Letters, Vol. 77, pp. 145-153 (1994));
- thyroid disease (See, Sharpe, P.K., et. al.; "Artifical Neural Networks
in Diagnosis of Thyroid Function from in Vitro Laboratory Tests," Clin. Chem., Vol.
39, No. 11, pps. 2248-2253 (1993));
- prostate cancer (See Snow, P.S. et al., " Artificial Neural Networks in
the Diagnosis and Prognosis of Prostate Cancer: A Pilot Study" J. Urology, Vol.
152: 1923-1926 (1994));
- cervical cancer (See U. S. Patent No. 4,965,725 to Rutenberg); and,
- cardiology (See U.S. Patent No. 5,280,792 to Leong et al. and
Furlong, J.W., "Neural Network of Serial Cardiac Enzyme Data: A Clinical
Application of Artifical Machine Intelligence", Am. J. Clin. Pathol., Vol. 96, No. 1, pp. 134-141
(July 1991).
Bassoe, C.F. describes in "Automated Diagnoses from Clinical Narratives:
a medical system based on computerized medical records, natural language
processing and neural network technology" (Neural Networks Vol. 8. No. 2
pp 313-319, 1995) a method for diagnosing diseases by use of a neural
network. Herein clinical narratives are transformed by natural language
processing to binary input vectors for artificial neural networks, which
are compared to vectors of a trained neural network, wherein the
presence and frequency of specific words is coordinated to a definite
disease. The outputs are calculated by a linear activation function.
Moneta, C. et al. reports in "Automated diagnosis and disease
characterization using neural network analysis", a paper at IEEE
International Conference on Systems, Man and Cybernetics, October 18-21,
1992, pp 123-128, on a neural network approach for analyzing and
diagnosing a disease (Lyme Borreliosis) for which at that time no
exhaustive diagnostic procedure existed. With the help of a standard
feedforward neural network various medical observations are ordered by
their importance leading to the selection of important and unimportant
features of the disease. By multiple connection of the values in a
trained neural network, running through a non-linear function an
estimation of "ill" or "unaffeted" of Lyme Borreliosis is attained.
Neural networks are capable of pattern recognition particularly suited to
making diagnoses. Unlike current methods for arriving at a diagnosis from a logical
set of rules, neural networks do not require explicit encoding of process knowledge in
a set of rules. Neural networks learn from examples. Neural networks learn more
efficiently when the data to be input into the neural network is preprocessed.
There are two basic approaches in computer assisted clinical pattern
classification techniques. The first approach applies known knowledge and facts
(physiological, anatomical, molecular biological, etc.) of a given disease process and
attempts to establish links between observed or measured data and one of several
possible classification classes. Such existing knowledge and facts are often expressed
as rules (e.g. clinical expert systems), certain forms of numerical functions (e.g.
statistical distributions in parametric statistical inferences), or even complex models
that can only be described with systems of equations (e.g. pharmacokinetic models).
The second approach uses numerical procedures to adaptively construct and
modify a numerical classification system based on available training data which are
essentially sets of input values paired with known classification results. In this
approach, the human expert knowledge is not or can not be expressed in an explicit
form. Instead, the knowledge is implicitly provided in the training data with
confirmed classifications. The extraction of such knowledge through supervised
learning (learning from examples) and the adaptive construction of the classification
system are left entirely to the learning algorithm. Classification systems with this
second approach include various forms of neural network classifiers such as
Multilayer Feedforward Perceptrons.
Both approaches have their shortcomings. The first approach uses explicit
knowledge in the subject area to associate observed unknown data with a known class.
However, in many practical situations, such knowledge is incomplete, or a portion of
it cannot be expressed in explicit and precise terms, so that it can be directly coded into
the classification system. On the other hand, the pure numerical pattern classification
approach places the burden of constructing the classification system entirely to the
adaptive learning process. The performance of the obtained system is limited to the
amount and extent of information contained in the training data and the effectiveness of
the learning algorithm in extracting such information, despite the fact that there may
exist a tremendous amount of prior knowledge about the subject area. In some cases
where there is no preprocessing such as preselection or scaling of the patient data, the
training of a neural network may be extremely difficult if not impossible since the
number of input variables may be too large and the relationship of these variables to a
specific disease may be too weak to achieve the desired predictive accuracy.
Accordingly what is needed is an approach to diagnosing and prognosing
disease that incorporates an apparatus and a system capable of accommodating a large
number of factors, such as biomarker and demographic factors. This system should
be capable of processing a large number of patients and patient variables such as
biomarker and demographic factors. This approach to diagnosis and prognosis of
disease should select factors with high predictive values, preprocess these factors, and
input the data into a computer-based neural network or multiple neural networks in
order to train the neural network(s) to predict or diagnose disease. These neural
network(s) should produce a diagnostic index comprised of one or several output
values indicative of the presence (diagnosis) or future occurrence (prognosis) of a
disease. The system should possess the capacity to input patient data into the trained
neural network and produce an output value to indicate if the patient has or will have
the disease.
Furthermore, since clinicians will rarely have such computer-based neural
network capabilities at their disposal, what is also needed is a system whereby patient
data can be transmitted to a computer-based neural network as described above, which
will receive the data, input it into the trained neural network, produce an output value
indicative of a diagnosis or prognosis and then transmit the information concerning the
diagnosis or prognosis to another location, such as the originating data transmitting
station, or perhaps directly to the clinician's office. Such a system would provide
access to sophisticated and highly trained prognostic and diagnostic neural networks
which would enhance the accuracy of clinician's diagnostic and prognostic capability.
This system should be capable of receiving high volumes of patient data and rapidly
processing the data through the neural networks to obtain diagnoses and prognoses of
disease.
Such a system could be used for diagnosis and prognosis of any disease or
condition for which a neural network may be specifically trained.
Summary of the Invention
The present invention relates to a method for diagnosing or
prognosing a disease in a patient to a method for training a computer
based neural network and to a system as set out in claims 1, 12.
More particularly, the present invention relates to a computer-based
method employing trained neural networks, and a process for diagnosing,
screening or prognosing diseases in patients such as humans or animals, and for
determining the severity and cause of the disease. This objective is accomplished by
performing the following steps: collecting data about patients, such types of data
optionally including biological, physical, demographic, racial, environmental, and
medical historical data; selecting those data that are associated with the diagnosis of a
disease; digitizing the data; scaling these digitized values; performing tests to analyze
the discriminating power of these data; grouping individual data values; preprocessing
these data to make preprocessed values; inputting selected data into a computer-based
neural network in order to train the neural network; analyzing the contributions of
individual data inputs to the neural network; selecting the optimally trained neural
network based on performance, accuracy and cost, the neural network being trained to
produce a diagnostic index; and inputting other patient data into the trained neural
network to produce an output value which indicates whether the patient may have or be
susceptible to the disease.
An embodiment of the present invention also includes an apparatus and process for rapidly
diagnosing, screening or prognosing diseases in large numbers of patients, wherein
the patient data is transmitted to a central facility from a remote location. At the central
facility, patient data is received and introduced into a computer system which performs
the following functions: analysis of the patient data to evaluate correctness of the data
format; scaling the data to provide values for different types of in similar ranges;
introduction of scaled patient data into a trained neural network for computation of an
output value; comparison of the output value to a diagnostic index produced by the
trained neural network; formulation of a diagnosis or prognosis based on this
comparison; transmission of the diagnosis or prognosis to a remote location,
optionally the location which sent the original patient data set or the office of a health
care provider.
This embodiment of the present invention permits the rapid evaluation of large
data sets comprised of patient data including biomarker data and demographic data,
formulation of a diagnosis or prognosis for a particular disease or for several diseases,
and rapid transmission of the results to the health care provider or facility responsible
for the patient. This system not only provides improved diagnostic capability
resulting in enhanced health to the patient, but also reduces cost due to wasted time,
delayed treatment and incorrect diagnosis. This system provides the capability to
screen numerous patient samples for diagnosis and prognosis of disease and enables
health care providers to access sophisticated computer-based neural networks
specifically trained to diagnose disease with high levels of precision and accuracy.
In a further embodiment, the present invention may be used to rapidly and
accurately diagnose and prognose prostate cancer, even at very early stages. In this
embodiment, large numbers of patient data sets comprised of biomarkers and
optionally demographic data, may be screened rapidly and economically to diagnose
and predict prostate cancer with high precision and accuracy. In addition, this
invention facilitates determination of the stage of prostate cancer and distinguishes
between benign prostatic hyperplasia and prostate cancer.
In another embodiment, the present invention may be used to rapidly and
accurately diagnose and prognose osteoporosis and osteopenia, even at very early
stages. In this embodiment, large numbers of patient data sets comprised of
biomarkers and optionally demographic data, may be screened rapidly and
economically to diagnose and predict osteoporosis and osteopenia with high precision
and accuracy. In addition, this invention facilitates determination of the extent of
osteoporosis and osteopenia and provides information about the causative variables.
It is an object of this invention to diagnose and prognose any disease in a
patient for which adequate data, such as biomarker and demographic data, exist in a
patient population to specifically train a neural network to produce a diagnostic index
with a high level of predictive utility, and to accurately and reliably diagnose the
disease in new sets of patient data. Large numbers of multivariable patient data sets
may be screened for the presence of a disease or to prognose a disease using this
system.
Accordingly, it is an object of the present invention to provide a method for
diagnosing, screening or prognosing and determining the severity of a disease.
Still another object of the present invention is to provide a system comprised of
a method and apparatus comprising a computer-based trained neural network system
that will diagnose, screen or prognose and determine the severity of a disease by
receiving patient data from another location through a data receiving means,
transmitting the data into a computer or through several computers containing a
computer-based trained neural network, processing the patient data through the trained
neural network, or optionally multiple trained neural networks, to produce an output
value, which is a diagnostic value, transmitting these diagnostic values to another
location, optionally to another computer for transmission to a remote location,
optionally comprising a computer, or other data receiving means. This system may
contain one or several computers and one or several trained neural networks.
It is another object of the present invention is to provide an apparatus for
diagnosing, screening or prognosing and determining the severity of a disease.
Still a further embodiment of the present invention provides a method for screening,
prognosing and diagnosing prostate cancer.
Another embodiment of the present invention provides a method for
screening, prognosing and diagnosing osteoporosis and osteopenia.
Still another embodiment of the present invention provides a method for
screening, prognosing and diagnosing breast cancer.
Yet another embodiment of the present invention provides a method for
screening and diagnosing ovarian cancer.
Another embodiment of the present invention provides a method for
screening, prognosing and diagnosing colon cancer.
An additional embodiment of the present invention provides method for
screening, prognosing and diagnosing testicular cancer.
An advantage of the present invention is that it provides a method for
diagnosing disease which will provide a better understanding of the probable cause of
the disease.
Another advantage of the present invention is that it provides a method for
diagnosing cancer which will provide a better understanding of the probable cause of
the cancer.
Another advantage of the present invention is that it provides a diagnostic test
for cancer which can be used to rapidly and economically screen data sets from large
numbers of patients.
Still another advantage of the present invention is that it provides a test for
osteoporosis which will also give information as to the underlying cause of the
osteopenic condition.
Another advantage of the present invention is that it provides a diagnostic test
for osteoporosis which can be used to screen large numbers of individuals.
An advantage of the present invention is to provide a method for diagnosing
osteoporosis and determining the underlying cause of the osteopenia without having to
subject the patient to radiation.
These and other objects, embodiments and advantages of the present invention will
become apparent after a review of the following detailed description of the disclosed
embodiment and the appended claims.
Brief Description of the Figures
Fig. 1 illustrates a feed forward neural network having multiple outputs.
Fig. 2 illustrates a feed forward neural network having a single output.
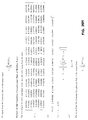
Fig. 3 is an equation illustrating the mathematical relationship between the
input and output of a typical neuron.
Fig. 4 is a schematic illustration of the second preferred embodiment of the
present invention.
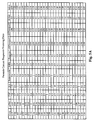
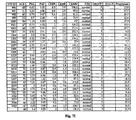
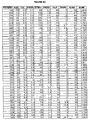
Fig. 5 shows the training data used to construct the prostate cancer neural
network prognostic system.
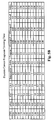
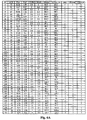
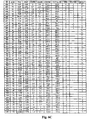
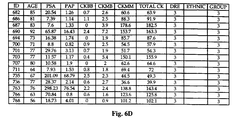
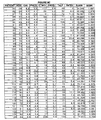
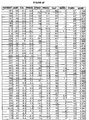
Fig. 6 shows the training data used to construct the neural network
ProstAsure™ system for prostate cancer detection.
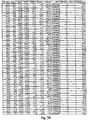
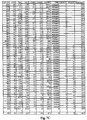
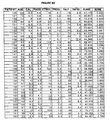
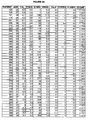
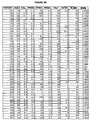
Fig. 7 shows the test data used to construct the neural network ProstAsure™
system for prostate cancer detection.
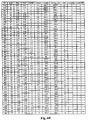
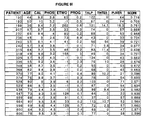
Fig. 8 shows the training data used to construct the QuiOs™ osteoporosis
neural network diagnostic system.
Fig. 9 shows the testing data used to test the QuiOs™osteoporosis neural
network diagnostic system.
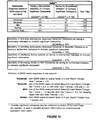
Fig. 10 demonstrates the sensitivity and specificity of the QuiOs™ system in
diagnosing osteopenia.
Fig. 11 is a scatterplot of 726 test samples showing that QuiOs™ values
correlate with bone mineral density (BMD) measurements at L2-L4 and Ward's
triangle in the form of T-scores.
Fig. 12 is a schematic representation of the simultaneous multi access
reasoning technology.
Fig. 13 provides an schematic representation of an approach for the
construction and training of a computer-based neural network based classifier for the
diagnosis and prognosis of disease
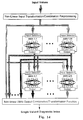
Fig. 14 shows a configuration of a neural network based diagnostic system
Fig. 15 is a schematic overview of the ProstAsure™ computer-based neural
network system architecture for receiving patient data, analyzing the patient data with a
trained neural network and transmitting results.
Fig. 16 is the system architecture for analyzing patient data input and
computation of ProstAsure™ diagnostic values.
Fig. 17 provides ProstAsure™ reference ranges for normal, BPH and
prostate cancer in different age groups.
Fig. 18 provides diagnostic guidelines for samples in the ProstAsure™ test
data set.
Fig. 19 shows statistically significant ProstAsure™ results in the diagnosis
normal, BPH and cancer patients.
Fig. 20 demonstrates ProstAsure™ results in 193 test cancer cases.
Fig. 21 is a scatterplot of ProstAsure™ values vs. PSA values in 416 test
samples. By non-linearly combining multiple biomarkers, ProstAsure™ effectively
separates normal, BPH and cancer patients better than using a single biomarker (PSA).
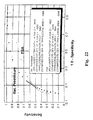
Fig. 22 shows receiver-operating characteristic (ROC) curves comparing the
diagnostic power of ProstAsure™ and PSA alone. The area under the curve is a
measure of the usefulness of the test. The Rel. ProstAsure™ refers to normalization
with age-specific reference ranges. ProstAsure™ significantly outperforms PSA
with statistical significance in separating cancer from normal and BPH.
Fig. 23 demonstrates ProstAsure™ sensitivities and specificities computed
with training and test data.
Fig. 24 shows the sensitivity and specificity of ProstAsure™ in detecting and
discriminating prostate cancer and identifying normal and BPH patients.
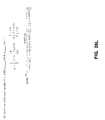
Fig. 25 is a mathmetical description of the ProstAsure™ algorithm.
Fig. 26 is a mathematical description of the QuiOs™ algorithm.
Detailed Description
The following patent applications are incorporated herein by reference in their
entirety: U.S. Provisional Application Serial Number 60/001,425 filed July 25, 1995;
U.S. Application Serial Number 08/472,632 filed June 7, 1995; PCT Application
PCT/US95/01379 filed February 2, 1995; U.S. Application Serial Number
08/323,446 filed on October 13, 1994; U.S. Application Serial Number 08/315,851
filed on September 30, 1994; U.S. Application Serial Number 07/990,772 filed on
December 14, 1992; PCT Application PCT/US92/10879 filed December 14, 1992;
U.S. Application Serial Number 07/964,486 filed on October 21, 1992; U.S.
Application Serial Number 07/806,980 filed on December 12, 1991.
As used herein, the term "disease" is defined as a deviation from the normal
structure or function of any part, organ or system of the body (or any combination
thereof). A specific disease is manifested by characteristic symptoms and signs,
including biological, chemical and physical changes and is often associated with a
variety of other factors including but not limited to demographic, environmental,
employment, genetic and medically historical factors. Certain characteristic signs,
symptoms, and related factors can be quantitated through a variety of methods to yield
important diagnostic information.
The term "patient" refers to any human or animal.
For purposes of this application, the quantifiable signs, symptoms and/or
analytes in biological fluids and tissues characteristic of a particular disease are defined
as "biomarkers" for the disease. Current diagnostic and prognostic methods depend
on the identification and evaluation of these biomarkers, both individually and as they
relate to one another. The term "biomarkers" includes all types of biological data from
a patient.
The patient data may include a variety of types of data which have some
association with the disease. The information may be biological. Such data may be
derived from measurement of any biological parameter. Such substances include, but
are not limited to, endocrine substances such as hormones, exocrine substances such
as enzymes, and neurotransmitters, electrolytes, proteins, carbohydrates, growth
factors, cytokines, monokines, fatty acids, triglycerides, and cholesterol.
Other types of biological data may be derived from histological analysis of
organs, tissues or cells removed from patients, including histological analyses
performed at the light microscopic and electron microscopic levels utilizing any
number of techniques including, but not limited to, structural analysis, histochemical,
immunocytochemical, in situ hybridization, and autoradiographic techniques.
Biological data may be derived from analysis of cells removed from patients
and grown in culture. Various characteristics of these cells may be examined
histologically and biochemically. For example, cells removed from a patient and
placed in culture may be examined for the presence of specific markers associated with
the presence of a disease. Cells may be examined for their metabolic activity or for the
products made and released into the culture medium.
Biological data about a patient includes results from genetic and molecular
biological analysis of the nuclear and cytoplasmic molecules associated with
transcription and translation such as various forms of ribonucleic acid,
deoxyribonucleic acid and other transcription factors, and the end product molecules
resulting from the translation of such ribonucleic acid molecules..
Also included in the category of biological data are the various structural and
anatomical analytical methods used with patients such as radiographs, mammograms,
fluorographs and tomographs, including but not limited to X-ray, magnetic resonance
imaging, computerized assisted tomography, visualization of radiopaque materials
introduced into the body, positron emission tomography, endoscopy, sonograms,
echocardiograms, and improvements thereof.
Biological data also includes data concerning the age, height, growth rate,
dental health, cardiovascular status, reproductive status (pre-pubertal, pubertal, post-pubertal,
pre-menopausal, menopausal, post-menopausal, fertile, infertile), body fat
percentage, and body fat distribution. Biological data also includes the results of
physical examinations, including but not limited to manual palpation, digital rectal
examination, prostate palpation, testicular palpation, weight, body fat amount and
distribution, auscultation, testing of reflexes, blood pressure measurements, heart and
related cardiovascular sounds, vaginal and other gynecologic examinations, including
cervical, uterine and ovarian palpation, evaluation of the uterine tubes, breast
examinations, and radiograpic and infrared examination of the breasts.
Additional biological data can be obtained in the form of a medical history of
the patient. Such data includes, but is not limited to the following: medical history of
ancestors including grandparents and parents, siblings, and descendants, their medical
problems, genetic histories, psychological profiles, psychiatric disease, age at death
and cause of death; prior diseases and conditions; prior surgeries; prior angioplasties,
vaccinations; habits such as exercise schedules, alcohol consumption, cigarette
consumption and drug consumption; cardiac information including but not limited to
blood pressure, pulse, electrocardiogram, echocardiogram, coronary arteriogram,
treadmill stress tests, thallium stress tests and other cardiovascular imaging techniques.
All of the aforementioned types of biological data are considered as "biomarkers" for
the purposes of the present application.
The term "biological fluid" includes, but is not limited to, blood, serum,
cerebrospinal, peritoneal, salivary, lacrimal, peritoneal, reproductive, intraocular,
digestive, respiratory, pleural, pericardial, lymphatic, urine, intracellular and
extracellular fluids, and neural fluids.
The term "demographic data" includes information concerning the patient's
race, species, sex, ethnicity, environment, exposure to environmental toxins and
radiation, stress level, behavioral patterns, previous occupations and current
occupation. Demographic data may also be used to provide patient information that is
useful in the diagnosis and prognosis of disease.
The present invention provides a method for diagnosing, screening or
prognosing a disease in a patient comprising the steps of measuring the concentrations
of a predetermined set of biomarkers known to be associated with the disease;
converting these concentrations to digitized values; preprocessing the digitized values
to make preprocessed values; and sending the preprocessed values to a computer-based
neural network in order to train the neural network to diagnose or prognose the
disease, whereby the diagnostic index from the neural network indicates when the
patient has the disease or may develop the disease.
The present invention also comprises an apparatus for diagnosing, screening or
prognosing a disease in a patient comprising a means for digitizing the concentrations
of a predetermined set of biomarkers known to be associated with the disease from the
patient; a means for preprocessing the digitized values; and a computer-based trained
neural network coupled to the digitizing and scaling means for generating network
output values; means for comparing the output values from the neural network to the
diagnostic index to produce a diagnostic value which indicates when the patient has the
disease or may develop the disease.
In accordance with the first embodiment of the present invention, a trained
neural network is utilized to determine a diagnostic index corresponding to the
presence and severity of a disease by analyzing a set of predetermined biomarkers or
demographic data for that disease. In accordance with the invention, the
concentrations of certain biomarkers or demographic data related to the incidence of a
particular disease are determined for a patient. These data are converted to digitized
values. These digitized values are then preprocessed (scaling, truncation, linear/nonlinear
combination, etc.) and the preprocessed values, optionally together with one or
several secondary values computed from the original values are then sent to a trained
neural network to yield a diagnostic index. Preprocessing of the data occurs at this
stage and serves to decrease the burden on the neural network and enhance the
accuracy and sensitivity of the neural network for diagnosis and prognosis of disease.
A neural network is trained by introducing a population of patients in which a disease
state is known, along with the biomarker values or demographic data for those patients
and "teaching" the neural network to recognize the patterns in the biomarkers. After
the neural network is trained, biomarker values from patients with unknown disease
states are introduced to the trained neural network. The neural network then processes
the information to produce an output value whereby the output values from the neural
network are diagnostic values which indicate whether the patient has the disease or
may develop the disease
Although not wanting to be bound by this statement, the inventors propose that
the artificial neural network, especially the multi-layer feedforward network, may,
through their weight connections, correspond to data patterns that are important for
categorizing diseases. Additionally, the neural network can identify unique patterns of
data associated with a variety of disorders that may help to classify borderline cases
that do not appear to fit into either a malignant or benign pattern.
Multiple Neural Networks
The present invention also comprises a method for diagnosing, screening or
prognosing a disease in a patient comprising the steps of measuring the concentrations
of a predetermined set of biomarkers known to be associated with the disease from the
patient, digitizing the concentrations, preprocessing the digitized values to make
preprocessed values, scaling the digitized values of the analytes, and introducing the
preprocessed values to a first trained neural network, and sending the output value
from the first neural network and a second set of predetermined biomarkers, which
could include one or more of the biomarkers in the first set of predetermined
biomarkers, to a second trained neural network, whereby the output values from the
second neural network are compared to the diagnostic index to produce a diagnostic
value which indicates when the patient has the disease or may develop the disease
A second embodiment of the present invention involves a two step analysis of
the biomarkers by neural network. This avoids the bias created by a dominant
predictive variable when training a network. The dominant biomarker or predictive
variable is excluded from the first analysis by neural network and is then included in a
second analysis by neural network. For example, if age is thought to be the dominant
predictive variable in the diagnosis of osteoporosis, that variable is not included in the
training of the first neural network, and the training data set is limited to the other
selected biomarkers. After obtaining a diagnostic index using the first set of
biomarkers, a second neural network is trained using the diagnostic index and the
entire set of input variables, including age, to yield another diagnostic index. The final
diagnostic index is a composition of an artificial neural network generated index and
results from heuristic analysis using other non-numerical patient information.
In another embodiment, the present invention provides a system, including the
ProstAsure™ system, comprising an apparatus and method for diagnosing, screening
or prognosing prostate cancer in patients. In this embodiment, data obtained from
analysis of biomarkers and optionally from demographic information is preprocessed
(e.g. scaled) and input into a trained neural network. Prostate specific antigen (PSA),
prostatic acid phosphatase (PAP), and three forms of creatine kinase (BB, MB, and
MM) are used as the biomarkers in this invention. It is to be understood that other
biomarkers and demographic data may be used in this invention. For example, the
results of a digital rectal examination in which the prostate is palpated may optionally
be combined with other biomarkers or demographic data. The trained neural network
provides an output value which indicates whether the patient has prostate cancer. The
trained neural network is capable of providing highly accurate diagnoses and
prognoses at early stages in the progression of prostate cancer, thereby displaying a
high degree of sensitivity and specificity. The stage of prostate cancer is determined,
even at very early stages in the disease. In addition, this invention distinguishes
benign prostatic hyperplasia from prostate cancer, and distinguishes prostate cancer
from non-cancerous conditions.
Another specific embodiment of the present invention includes a system
comprising a method and apparatus for diagnosing and determining the severity and
underlying cause of osteopenia and osteoporosis in a patient using a computer-based
trained neural network. In a preferred embodiment, the method comprises determining
the serum level of the following biomarkers: calcium, phosphate, total alkaline
phosphatase, an alkaline phosphatase isoenzyme, estradiol, and progesterone. The
alkaline phosphatase isoenzyme is preferably t-lymphocyte derived alkaline
phosphatase or blood, liver or intestinal alkaline phosphatase isoenzyme. Optionally,
the age of the patient or demographic data may be included in the trained neural
network. The bone density coefficient that is calculated by the algorithm correlates to a
very high degree to bone density as measured by standard methods, such as
radiographic absorptometry, quantitative computed tomography, dual photon
absorptometry and direct measurement of bone density. The bone density coefficient
that is measured is then compared to an osteopenic severity scale.
Another embodiment of the present invention is directed to a computer assisted
method for screening, prognosing and diagnosing diseases utilizing a neural network
to obtain a conclusive diagnosis. The present invention can be adapted to existing
diagnostic devices that have a collection means, a sample detecting means capable of
detecting the quantity of an analyte in a biological fluid and a means of either printing
or displaying the results of the tests on video display means.
The inventors have discovered that biomarkers collectively alter in response to
a disease process, and collectively constitute a new diagnostic biomarker with better
disease predictability than the individual biomarkers. When the biomarkers are
processed and analyzed as a group in a computer-based trained neural network to yield
a single diagnostic index, the sensitivity and specificity of the diagnosis is increased,
making it possible for a physician to detect the presence of a disease earlier and with
greater precision, or estimate a prognosis with greater precision, than by analysis of
the individual biomarkers.
In accordance with one embodiment of the present invention, a biological fluid
or several biological fluids are first collected from a patient. Biomarkers associated
with a specific disease are measured in the biological fluids using standard laboratory
techniques, to determine their concentrations, or in some cases their presence or
absence. It is to be understood that this process can be carried out automatically in
conventional diagnostic machines. For purposes of illustration, descriptions of the
methods for obtaining the values for the biomarkers for osteopenia and also for
prostate cancer are provided elsewhere in this section.
The biomarkers relied upon to diagnose a disease by the method of the present
invention must be predictive of the suspected disease and must be statistically
significant for analysis by a neural network. The selection of biomarkers that offers
statistically significant discriminating power in the diagnosis of disease involves
several steps. First an inventory of biomarkers that have shown certain relevancy in
the diagnosis of the disease of interest must be conducted. In general, only the
biomarkers that reflect different aspects of the disease process or other diagnostic
information need to be included. Second, the selected biomarkers need to have a
reasonable diagnostic value in terms of sensitivity, specificity, and positive and
negative predictive powers. The design and implementation of experimental protocol
from which the biomarkers are developed and evaluated should also be considered.
Third, if the number of candidate biomarkers is large, a formal discriminating power
analysis may be conducted. However, many of the standard statistical analysis
methods may not be adequate for highly nonlinear classification problems. Typically,
biomarker values and demographic data values are scaled to provide relatively similar
ranges of values between different biomarkers or demographic variables. In this
manner, the variances due to the different numerical ranges inherent in the
measurement of different variables are decreased. Preprocessing of the input variables
comprised of biomarkers and other demographic data is an important step in the
training of the neural network. If the number of candidates are not too large, they may
be all included in the initial attempt of neural network training. If one or several of the
input biomarkers to the network are irrelevant to the classification decision making
process, it will be reflected in the network connection weights of the trained neural
networks. These values may then be removed from the biomarker set for a particular
disease. Other methods for evaluating the statistical significance of a biomarker
selected for analysis by neural network and selecting biomarkers for training a neural
network are well known in the art.
Biomarkers which meet the criteria delineated above, namely, they are
predictive of a particular disease and statistically significant for analysis by neural
network, are identified below for several examples of diseases including prostate
cancer, osteoporosis, ovarian cancer, colon cancer, breast cancer, and testicular
cancer. It is to be understood that these biomarkers for the specific diseases described
below are examples of the present invention and are not to be construed as imposing
any limitation on the scope of the present invention.
| Ovarian Cancer I | Prostate Cancer I | Colon Cancer |
| LASA-P® | LASA-P® | LASA-P® |
| CA125 | PAP | CA 19-9 |
| DM/70K | PSA | CEA |
| Ovarian Cancer II | Prostate Cancer II |
| CA125 | PAP |
| MCSF | PSA |
| OVX1 | CK-MB |
| LASA | CK-MM |
| CA7-24 | CK-BB |
| CA19-9 |
| Breast Cancer | Testicular Cancer | Osteoporosis |
| LASA-P® | LASA-P® | Calcium |
| CEA | AFP | Phosphate |
| HER2/neu in Plasma | HCG-Beta | Estradiol |
| | CA 15-3® | Progesterone |
| | | ALP |
| | | ALP Isoenzyme |
| 1 |
| | | ALP Isoenzyme 2 |
A key to the abbreviations used above is provided below:
| AFP: | Alpha-Fetoprotein |
| CA125: | Cancer Antigen 125 |
| CA 15-3® | Breast Antigens 115D8/DF3 |
| CA 19-9: | Carbohydrate Antigen 19-9 |
| CEA: | Carcinoembryonic Antigen |
| CK-MM | Creatine kinase, MM subfraction |
| CK-MB | Creatine kinase, MB subfraction |
| CK-BB: | Creatine kinase, BB subfraction |
| DM/70K: | Ovarian marker NB/70K |
| HCG-Beta: | Human Chorionic Gonadotropin, Beta Sub-Unit |
| HER 2/neu in Plasma: | c-erb B-2 (HER2/neu) oncoprotein in plasma |
| LASA-P®: | Lipid-Associated Sialic Acid in Plasma |
| M-CSF | Macrophage colony-stimulating factor |
| PAP: | Prostatic Acid Phosphatase |
| PSA: | Prostate Specific Antigen |
A large number of diseases may be diagnosed in accordance with the method
of the present invention. To be suitable for diagnosis by the present method,
biomarkers and demographic data for the disease must be quantifiable. The
biomarkers and demographic data must also be predictive of the disease and must be
statistically significant relative to one another. The method of the present invention is
equally suited to the diagnosis of any disease in which biomarkers and demographic
data can be identified, including but not limited to infectious diseases, and genetic
abnormalities.
After determining the biomarkers for a disease, the biomarker values are
digitized, preprocessed and analyzed by a computer-based, trained neural network to
yield a single diagnostic value. The most common neural network architecture for
pattern classification problems is the feedforward network, which typically consists of
an input layer, one or more hidden layers, and an output layer. Figs. 1 and 2 illustrate
the arrangement of neurons in two different feedforward networks.
The elements that make up each layer of a neural network are referred to as
neurons or nodes. Inputs are fed forward from the input layer to the hidden layers and
then to the output layer. The number of neurons in each layer is determined before the
network is trained. Typically, there is one input neuron or node for each input
variable, and one output node for each output. The inputs to the neural network are
predictor variables. These predictor variables can be quantitative or qualitative.
Neural networks make no data distribution assumptions and can simultaneously use
both quantitative and qualitative inputs. In the present invention, the biomarker
values, and the optionally generated secondary values are rescaled during
preprocessing to values between 0.0 and 1.0 or between -1.0 and 1.0, constitute the
input variables.
The outputs of the network represent output categories. For example, a
malignancy may be represented by maximal output of the malignant output neuron and
silence of the benign neuron, whereas a benign process is represented by maximal
output of the benign neuron and silence of the malignant neuron. A simple arithmetic
function combines the outputs of the two neurons to yield a single diagnostic index. In the
alternative, a single output neuron may be used. An output of greater than 0.5 would
indicate a malignancy and an output of less than 0.5 would indicate a benign condition.
In this way a diagnostic index is directly obtained. Alternatively, a reversed denotation
could be used.
The number of hidden layers and the number of nodes in the hidden layers are
configurable parameters that have a significant influence on the performance of the
network. In practice, the optimal number of hidden neurons is determined empirically.
The means for determining the optimum number of hidden neurons is well known to
those skilled in the art and depends on the complexity of the problem being solved.
In the present invention, one embodiment of the neural network is a multi-layer
feedforward perceptron using a backpropogation training algorithm. The number of
hidden layers and the number of neurons in each hidden layer was determined to
adequately match the level of complexity of the diagnostic problem. With the
assumption that the samples in the training set are representative of all possible
situations encountered in real applications with no significant contradictions, and the
number and stratification of samples in the generalization and cross-validation test are
statistically adequate, the criteria outlined below are used to determine if a chosen
network configuration is appropriate.
If the network continues to fail to correctly classify large portions of the
samples in the training set, even after many adjustments of training algorithm
parameters, the network complexity should be increased.
On the other hand, if the network achieves a high rate of correctly classifying
the training set but fails to accurately classify a large number of samples in the testing
set, network structure is probably too complex for the problem being solved, i.e. it has
sufficient inherent flexibility to fit the training data set, but not sufficient predictive
power to classify the test data set. If this is the case, the number of neurons in the
hidden layers should gradually be reduced, or, if there are multiple hidden layers, the
hidden layers should be gradually reduced.
It is also possible to achieve generalization with a neural network of slightly
too many hidden neurons. This is done by periodically testing a partially trained
neural network with cross-validation test data during training, and stopping at the
moment when the cross-validation error reaches a minumum value and starts to
increase.
It is usually not always necessary to have a large training sample set. If the
samples in a training set have already represented all possible cases with adequate
statistical significance, the addition of new samples generally does not increase the
amount of information in the training samples. Instead it may decrease the useful
information to noise ratio in the samples. At the other extreme, too small a training set
will generally not be able to cover all possible variations in the population. The
resultant network often simply memorizes all the cases in the training set and does not
generalize at all.
The input and output layers are not directly connected. Every input neuron is
connected to every neuron in the following hidden layer and neuron in a hidden layer
is connected to every neuron in the following adjacent hidden layer or output layer,
depending on the number of hidden layers. Each of the multiple connections to a
particular neuron is weighted. In the hidden and output layers, each node sums the
input activations, multiplied by the respective connection weights plus a bias term.
The weighted sum then passes through a non-linear output function, typically a
sigmoidal function, which gives the network the ability to represent complex non-linear
relationships. A neuron fires if the sum of the weighted inputs to it are greater
than a threshold value. As illustrated in Fig. 3, once a neuron is above a threshold, the
magnitude of its output is a sigmoid function of the net input. The end result of
activity in the neural network is the net output, a complex nonlinear function of the
inputs.
In summary and in accordance with the present invention, first the values of
the biomarkers or demographic variables for a specific disease are determined and
scaled. The biomarkers are fed forward from the input layer to the hidden layer (or
layers) and then to the output layer of the neural network. The number of neurons in
the input layer is determined before the network is trained and corresponds to the
number of biomarkers predictive for a specific disease. The biomarkers are
preselected and biomarker values are preprocessed. There is one input neuron for each
diagnostic variable or biomarker, and one output neuron for each desired output.
Other than the identified biomarkers, diagnostic variables may include demographic
information. The number of neurons in the output layer depends on the type of output
desired. The number of neurons in the hidden layer is determined empirically during
training.
The neural network used for diagnosing a specific disease must be trained to
do so. In accordance with the present invention in one embodiment, the neural
network is trained by back propagation. Back propagation refers to the technique of
training a neural network to accurately model a set of input and output examples by
determining the best connection weights between the values, and is well known in the
art. Other techniques which may be used to train a neural network for purposes of this
invention may include any other non-linear global optimization technique, such as the
genetic search algorithm; however, the feed forward, back propagation network is
most popular.
At the initial stages of training the neural network, the connection weights in
the network are randomized. The training data are then presented to the network one
datum at a time. In accordance with the present invention, the training data consists of
the biomarker values or demographic values for a group of patients, and the diagnosis
for each of those patients. The biomarker values, and, optionally, demographic
values, are digitized and preprocessed and the preprocessed values are the input
variables used to train the network. For each patient, the network uses the patient's
preprocessed values to estimate a diagnosis, which is then compared to the actual
diagnosis. If the network's diagnosis is correct, then the connection strengths and
thresholds within the network are not changed, and the next patient is presented to the
network. If the estimate of the diagnosis is not correct, the connection weights and
thresholds in both the hidden layer and the output layer are adjusted to reduce the size
of the classification error. After adjustments are made, the next patient is presented.
Training proceeds until all patients in the training group are correctly classified or some
preset stopping criteria are satisified (e.g. a maximum number of iterations).
When training the neural network, the trainer may set the decision limits
regarding the definition of a classification error, i.e. an incorrect diagnosis. The
relevant parameter is the error tolerance, which specifies how close the estimated
output has to be to the actual output to be correct. For example, if two output neurons
are used and the training tolerance is set at 5%, the estimate of malignancy is
considered correct if the malignant output neuron fires at 95% of maximum and the
benign neuron fires at 5% of maximum. Similarly, a correct estimate of a benign
diagnosis means that the benign output neuron first at 95% of maximum, while the
malignant neuron fires at 5% of maximum. The methods for determining a
classification error are well known to those skilled in the art.
In a preferred embodiment of this invention, if a single output neuron is used,
a benign normal diagnosis is set at an output of 0.1 and a malignant or abnormal
diagnosis is set at an output of 0.9. Alternatively the reversed denotation can be used.
Error tolerance is an adjustable parameter and is significant in determining the success
of the network at making an accurate diagnosis.
After the neural network is trained for the desired disease, biomarker values
and optionally demographic values from patients with unknown disease conditions and
possibly no disease are digitized, preprocessed and introduced to the trained neural
network. The neural network then processes the information to produce a value
corresponding to a diagnosis of the presence or absence of the particular disease. In
accordance with the present invention, this is accomplished by using either one single
output neuron or multiple output neurons. If more than one output neuron are used,
the output from the neurons are combined to generate a single diagnostic index.
As illustrated by Fig. 4, in a second embodiment of the present invention, the
diagnostic value obtained by analysis of the biomarkers by a trained neural network is
further analyzed by a set of heuristic rules in combination with additional patient
information. The additional patient information includes things such as family medical
history and demographic information. This data is then processed to yield a second
single diagnostic value.
In another embodiment, the simultaneous, multi-access reasoning technology
system of the present invention utilizes both existing knowledge and implicit
information that can only be numerically extracted from training data. Use of existing
knowledge may be in the form of setting normal reference ranges of biomarkers
specific to the patient being diagnosed. The system has four major functional blocks
as described in Figure 12:
Such models are based on input data with the individual patient under
consideration, or information of a class of patients to which the individual patient
belongs. The simulation output of these models forms the basis for comparison with
the observed patient data and the detection of difference and abnormality in the next
functional block.
3. Detection of Differences and Abnormalities: One of the key concepts in
this simultaneous multi access reasoning technology system is the utilization of
existing knowledge (i.e. CADRS and above diagnostic methods) and facts of normal
and disease processes to avoid overloading the numerically oriented adaptive pattern
classification subsystem with normal variations in observed data due to differences in
patient conditions. In this block, the output results of the mechanistic models are
compared with the observed patient data. The differences (not necessarily the simple
numerical differences in values) are then fed as input into the adaptive pattern
classification subsystem to produce the desired clinical indicators. 4. Adaptive Pattern Classification Subsystem: The classification
functions/algorithms in this block, due to the complex nature of clinical problems, are
often non-linear in nature which include linear or stepwise linear systems as special
cases. The construction of the classification functions and the determination of their
parameters are based on known properties of the classification problem and most
importantly, the implicit information contained in the available training data. Examples
of such adaptive classification systems include various forms of artificial neural
networks which classify information.
This invention is further illustrated by the following examples, which are not to
be construed in any way as imposing limitations upon the scope thereof. On the
contrary, it is to be clearly understood that resort may be had to various other
embodiments, modifications, and equivalents thereof, which, after reading the
description herein, may suggest themselves to those skilled in the art without departing
from the spirit of the present invention and/or the scope of the appended claims.
In some of the following examples which utilize a neural network in the
analysis of the data, a Neural Shell 2, Release 1.5 (Ward Systems Group, Inc.) neural
network development program was used for the training of the neural network on a
Pentium 60 mhz computer (Magitronic, Inc.). In other Examples, different computer
hardware is used.
Example 1
The following example describes the training of a neural network to prognose
prostate cancer.
A total of 52 samples were divided into 2 groups, a training set and a
generalization testing set. The training set contained 40 samples (28 stable and 12
progressing) and the generalization testing set contained 12 samples (9 stable and 3
progressing).
The initial network architecture was selected based on the level of complexity
of the classification task. A multi-layer feedforward network was used. Selection of
the initial architecture involved the selection of the number of hidden layers and the
number of neurons in each hidden layer. Several trial iterations were performed to
determine an adequate configuration that showed good results on both the training
sample set and the generalization test sample set. The present network had one hidden
layer, having nine neurons, and two output neurons.
Initially, connection weights among the neurons were randomly set. The
neural network had five input neurons, corresponding to five input variables
significant for prostate cancer: TPS, PSA, PAP, CEA, and testosterone. The training
data are shown in Fig. 5. During training, the five input variables for each patient
were first linearly scaled into the continuous range between 0.0 and 1.0. The resultant
five numbers were then presented as an input vector to the input neurons of the
artificial neural network.
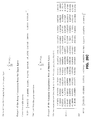
For each of the input vectors, the network generated an output based on the
connection weights among the network neurons. The output can be a single value or a
vector of numbers, depending on the number of output neurons used. The network
used had two output neurons. The outputs of the two neurons were processed by the
following mathematical equation to yield a single diagnostic index:
Index = (ANN2-ANN1)2 + 0.5
Each neuron in the network participated in the output calculation by passing the sum of
all inputs to the neuron through a non-linear s-shaped function (often a logistic
function) and sending the result to each and every one of the neurons in the following
adjacent layer. The generated output or each output neuron was compared to the
desired "target" output. A value of 0.1 corresponded to a diagnosis of stable and an
output of 0.9 corresponded to a diagnosis of progressing. The difference was used to
calculate an error term to guide the training algorithm, i.e., the back propagation
algorithm, in the adjustment of network connection weights in an attempt to reduce the
differences between network outputs and target values over the training sample set.
After training, the neural network correctly classified 100% of the samples.
When presented with the generalization test results, the trained neural network
correctly identified 100% of the stable samples and 66% of the samples where the
disease was progressing.
Example 2
The mathematical description of the ProstAsure™ Algorithm is provided in
Figure 25 which is attached hereto. The training data and test data for ProstAsure™
are provided in Figures 6 and 7, respectively. The training data set shows patient data
for age, PSA, PAP, CK-BB, CK-MB, CK-MM, total CK, digital rectal examination,
and ethnic group.
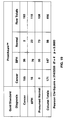
The ProstAsure™ system displayed the following sensitivities and specificities
(expressed as a percentage) for cancer detection in the test data and training data:
| Sensitivity for Detecting | Test | Training |
| Prostate Cancer (PC) | 80.3% | 84.4% |
| Stage |
| 2 PC | 85.3 | 85.1 |
| Stages T2, T3 and TNxM1(PC) | 87.9 | 87.9 |
| For detecting BPH as BPH | 66.1 | 68.9 |
| Specificity for Identifying | Percent |
| Non-Cancer as Non-Cancer | 92.8% | 91.8 |
| Presumed Normal as Normal | 67.6 | 69.2 |
*BPH = Benign prostatic hyperplasia
These results of the ProstAsure™ system were highly statistically significant
when analyzed with a Pearson Chi-Square test. Chi-Square value=128.8, with 4
degrees of freedom and a p value <0.00001. These results demonstrate the sensitivity
and specificity of the ProstAsure™ system to diagnose prostate cancer, to distinguish
stages of the disease, and to recognize benign prostatic hyperplasia and normals as
such.
Example 3
This example illustrates the construction and training of a neural network for
diagnosis of osteoporosis. The training and test data are shown in Figs. 8 and 9
respectively. The mathematical description of the QuiOs™ algorithm is attached hereto
as Figure 26. This example illustrates the construction and training of a neural
network for diagnosis of osteoporosis.
Fig. 8 provides the data used to train the neural network to diagnose
osteoporosis. The biomarkers selected included age, calcium, phosphate, estradiol
(ETWO), progesterone, total alkaline phosphatase, total intestinal alkaline
phosphatase, and % liver alkaline phosphatase. Fig. 8 further includes the diagnostic
index obtained by the neural network.
Fig. 9 provides the data use to test the network trained with the data in Fig. 9,
and the neural network diagnostic index obtained.
In practicing one aspect of the present invention, the severity of disease in a set
of humans or animals with varying severity of disease is measured by a standard
method or methods. The measurement is then assigned a numerical value
corresponding to a severity scale. The scale ranges from humans or animals with no
disease, to humans or animals with severe disease. The scale is preferably a numerical
scale. For example, one could assign a value which corresponds to normal or slight
disease, another value which corresponds to moderate disease and a third value which
corresponds to severe disease.
The concentration of a predetermined set of blood constituents in the set of
humans or animals with varying severity of disease is then determined. According to
the present invention, it is preferable to measure the blood constituents in the same set
of humans or animals in which the severity of disease was measured by the
conventional method or methods.
Osteopenia
An example of practicing one embodiment of the present invention is a method
for diagnosing osteopenia in a patient. The method preferably utilizes six blood
constituents. These constituents are calcium, phosphate, total alkaline phosphatase, an
alkaline phosphatase isoenzyme, estradiol, and progesterone. The alkaline
phosphatase isoenzymes preferred for practicing the present invention include
lymphocyte-derived alkaline phosphatase isoenzyme and bone, liver or intestinal
alkaline phosphatase isoenzymes. The present invention includes calculating a bone
density quotient using the aforementioned six blood constituents by entering the values
for the tests into an QuiOs™ algorithm which is attached hereto as Figure 26. Age,
weight and height are also included in the QuiOs™ algorithm.
In addition to diagnosing the osteopenic state of the patient, an indication of the
underlying cause of the osteopenia can be determined using the present invention. For
example, by practicing the present invention as described herein, one can determine
whether the osteopenia in a patient is caused by post-menopausal lack of estrogen or is
caused by some other condition, such as cancer. This allows the attending physician
to be better able to prescribe the appropriate treatment for the osteopenia.
Five of the serum tests that are used in the present invention are tests that are
commonly performed by clinical laboratories. The test for t-lymphocyte derived
alkaline phosphatase is experimental only; however, the test for blood, liver and
intestinal alkaline phosphatase isoenzymes are also known. The type of test used to
determine the six serum constituents is not critical to the present invention as long as
the tests give accurate blood concentrations of the constituents being measured. The
results are shown in Figures 10 and 11 and show excellent sensitivity and specificity
in the diagnosis of osteopenia.
Example 4
This example provides an explanation of an approach for the construction and
training of a computer-based neural network based classifier for the computer assisted
diagnosis and prognosis of disease. The lettered subsection headings refer to the
lettered labels in Figure 13.
Example 5
Procedure for Construction and Training of Neural Network Based Classifier for
Computer Assisted Diagnostic Apparatus
The following list describes the steps used in the construction and training
process as shown in Fig. 14.
Example 6
ProstAsure™ Computer-Based System for Neural Network Analysis of Patient Data
for Diagnosis of Prostate Cancer
This is a computer-based system which provides the capability to receive
patient data, analyze the data with a trained neural network, produce an output value
indicative of the presence or absence of prostate cancer, transmit the value to another
computer, and transmit the value to another location. The system is schematically
illustrated in Figure 15. The individual boxes in Fig. 15 are numbered and referred to
in the following description. This system provides high capacity to receive and
analyze a large volume of patient data, to rapidly produce output values to diagnose
prostate cancer and to optionally transmit these results to remote locations. This
system permits the rapid analysis of numerous sets of patient data and provides
diagnostic values to the clinical laboratory and to the health care provider. It is to be
understood that Figure 15 represents a preferred embodiment of the present invention
and that other system configurations, such as different hardware configurations
involving a single computer or multiple computers may be employed in the practice of
this invention for the diagnosis of any disease including prostate cancer.
The data files contain data from patient tests that are required for the
computation of the diagnostic index for prostate cancer. The data file is a standard
ASCII file. Each patient record consists of one line in the file. Lines in the file are
delimited with carriage return; line feed (CR/LF) pairs. The fields in a record are
delimited with an ASCII character ",", and each record contains the following seven
fields: 1) identification (ID)- alphanumeric; 2) Age - numeric; 3) prostate specific
antigen (PSA)- numeric; 4) PAP - numeric; 5) CKBB - numeric; 6) CKMB - numeric;
7) CKMM - numeric. Each alphanumeric field contains a string of characters
consisting of letters 'a' through 'z', 'A' through 'Z', digits '0' through '9', and the
characters '_', '.', '$'. A numeric field contains a string representation of a
decimal number. It may contain a single decimal point '.'. The space character ' ' and
comma character ',' are not allowed within a number.
Each patient record occupies a single line in the input data file. Data fields in a
record are separated by commas. In the result file to be returned to LabCorp, the input
values are repeated and then followed by two additional data fields also separated by
commas: the computed ProstAsure™ (HORUS Therapeutics, Rochester, NY) value,
and an integer valued error code.
Prior to the actual computation of the ProstAsure™ value, a patient record is
checked for errors according to the following error detection criteria in the order as
they are listed as shown in Fig. 16. Whenever an error other than code 130 happens,
error check stops. No ProstAsure™ Value is computed for the patient. The
ProstAsure™ field in the output file record is filled with "xxxx" and the first non-130
error code will attach as the last field. When all criteria have been checked and no
error or only code 130 has been detected, the ProstAsure™ value is computed and
reported in the result file record. The error code 0 or 130 is attached accordingly as the
last field.
Error codes are defined as follows:
The ProstAsure™ system consists of two computer workstations and
associated communication devices and links (Fig. 15). The following paragraphs
provide an overview of the system.
ProstAsure™ Station I (14) is primarily a communication control station. It
downloads test data from a remote computer system (LabCorp) (1) via a modem (2)
and a telephone line and uploads the ProstAsure™ results back to the remote system.
Station I (14) is linked to Station II (15) by a direct null modem cable (7) on their
corresponding serial ports. Station I (14) sends successfully downloaded data files to
Station II (15) and receives ProstAsure™ result files from Station II for uploading.
Station I controls the timing of download intervals. It processes error conditions (6)
by retrying and/or alarming operators (13) depending on the error conditions. Station
I compares the data portions of outgoing result files and incoming data files (5) before
uploading (4) and (3) to ensure integrity of the result files.
ProstAsure™ Station II (15) is the main computation station for ProstAsure™
algorithm computation (11) and houses the trained neural network (11). Station II
(15) receives data files from Station I (14) and sends (8 and 9) results files to Station I
(14). Station II (15) reads and verifies the data received from Station I. If invalid data
are detected (12 and 10), the ProstAsure™ result field will be marked with "x"
characters and a special error code will also reflect the condition. If the data values are
detected to be unusual but valid, the ProstAsure™ result will be provided; however, an
error code will indicate the condition. Station II invokes a dynamic link library (DLL)
from the commercial software package NSHELL2 release 2.0 (Ward Systems Group,
Inc., Frederick, MD) a leading neural network software, to perform the computations
of neural network structures. Station II contains error handling procedure (10) to
process various error conditions. It alarms (9 and 10) the operators (13) under critical
error conditions. Station II is also responsible for archiving the original data files and
result files.
The ProstAsure™ system uses Kermit software (Columbia University) for
communications between two Stations I and II and between Station I and remote
computer systems. Kermit is reliable, well tested communication protocol. The
ProstAsure™ system software runs under Microsoft Windows environment, which
provides a consistent, friendly user interface. ProstAsure™ software is designed to
execute in full screen mode to simplify the operations.
System Description
System Requirements:
A schematic overview of the system is provided in Figure 15.
- Station I 14:
- Station I requirements include the following: a Pentium computer 75
Mhz or higher, a minimum of 8 Mb RAM, a minimum of 1.0 Gb Hard Drive,
an internal modem at speed 9600 bps or higher, a SVGA monitor, and
Microsoft Windows for Work group (WFW) 3.11.
- Station II 15:
- Station II requirements include the following: a Pentium 75 Mhz or
higher, a minimum of 8 Mb RAM, a minimum of 1.0 Gb Hard Drive, an
internal 850 MB tape drive, a super VGA monitor, and Microsoft Windows for
Workgroup (WFW) 3.11.
The system requires a laser printer that has Microsoft Windows supported
printer driver. Also required is null modem 7 and RS-232 cable for connection
between Station I and II via serial ports.
Actually Installed System
An example of an actually installed system is as follows:
Functions of the Systems
In the following description of procedures, the term "emergent warning
procedure" defines an automated procedure to report an abnormal situation in the
computer software or hardware system, or in the data file transferring mechanism that
requires the immediate attention or intervention of a human operator and/or the Director
of Operation 13. In the "emergent warning procedure", 1) the affected computer
produces a loud siren that can be heard throughout the facility; 2) the affected computer
screen blinks and displays the error message and the corresponding error code; and 3)
the computer system automatically dials the pager number of the officer on duty.
Station I
14 downloads patient test data from and uploads computed results
back to the host computer (1) (a HP3000 UNIX based workstation) located at the
Laboratory Corporation of America (LabCorp) facility in Research Triangle Park,
North Carolina. Station I serves as a buffer and a firewall between the external data
source (LabCorp host computer) and the ProstAsure™ processing workstation
(Station II)
15. The following are detailed descriptions of functions provided by
Station I. These are also the functions tested during system validation.
Station II receives data from and sends data to Station I. Station II processes
data using the ProstAsure™ algorithm. The following functions are provided by
Station II. These functions are tested during system validation.
Example 7
The present invention includes use of a computer-assisted neural network to
diagnose ovarian cancer. This new version uses biomarkers listed above under the
heading of Ovarian Cancer II and includes CA125, M-CSF, OVX1, LASA, CAA7-24
and CA19-9. When tested with an independent data set of 186 subjects, the test
achieves a sensitivity of 89% and a specificity of 89%.
It should be understood, of course, that the foregoing relates only to preferred
embodiments of the present invention and that numerous modifications or alterations
may be made therein without departing from the spirit and the scope of the invention as
set forth in the appended claims.