EP0750431A2 - Visual characterization using display models - Google Patents
Visual characterization using display models Download PDFInfo
- Publication number
- EP0750431A2 EP0750431A2 EP96109739A EP96109739A EP0750431A2 EP 0750431 A2 EP0750431 A2 EP 0750431A2 EP 96109739 A EP96109739 A EP 96109739A EP 96109739 A EP96109739 A EP 96109739A EP 0750431 A2 EP0750431 A2 EP 0750431A2
- Authority
- EP
- European Patent Office
- Prior art keywords
- display
- patterns
- crt
- observer
- model
- Prior art date
- Legal status (The legal status is an assumption and is not a legal conclusion. Google has not performed a legal analysis and makes no representation as to the accuracy of the status listed.)
- Granted
Links
Images


Classifications
-
- G—PHYSICS
- G09—EDUCATION; CRYPTOGRAPHY; DISPLAY; ADVERTISING; SEALS
- G09G—ARRANGEMENTS OR CIRCUITS FOR CONTROL OF INDICATING DEVICES USING STATIC MEANS TO PRESENT VARIABLE INFORMATION
- G09G5/00—Control arrangements or circuits for visual indicators common to cathode-ray tube indicators and other visual indicators
- G09G5/02—Control arrangements or circuits for visual indicators common to cathode-ray tube indicators and other visual indicators characterised by the way in which colour is displayed
-
- H—ELECTRICITY
- H04—ELECTRIC COMMUNICATION TECHNIQUE
- H04N—PICTORIAL COMMUNICATION, e.g. TELEVISION
- H04N17/00—Diagnosis, testing or measuring for television systems or their details
- H04N17/04—Diagnosis, testing or measuring for television systems or their details for receivers
-
- G—PHYSICS
- G09—EDUCATION; CRYPTOGRAPHY; DISPLAY; ADVERTISING; SEALS
- G09G—ARRANGEMENTS OR CIRCUITS FOR CONTROL OF INDICATING DEVICES USING STATIC MEANS TO PRESENT VARIABLE INFORMATION
- G09G1/00—Control arrangements or circuits, of interest only in connection with cathode-ray tube indicators; General aspects or details, e.g. selection emphasis on particular characters, dashed line or dotted line generation; Preprocessing of data
- G09G1/28—Control arrangements or circuits, of interest only in connection with cathode-ray tube indicators; General aspects or details, e.g. selection emphasis on particular characters, dashed line or dotted line generation; Preprocessing of data using colour tubes
- G09G1/285—Interfacing with colour displays, e.g. TV receiver
-
- G—PHYSICS
- G09—EDUCATION; CRYPTOGRAPHY; DISPLAY; ADVERTISING; SEALS
- G09G—ARRANGEMENTS OR CIRCUITS FOR CONTROL OF INDICATING DEVICES USING STATIC MEANS TO PRESENT VARIABLE INFORMATION
- G09G2320/00—Control of display operating conditions
- G09G2320/06—Adjustment of display parameters
- G09G2320/0693—Calibration of display systems
Definitions
- This invention relates to the visual characterization of a display and more particularly to the characterization of a display without the use of calibration hardware.
- the method of their invention is also applicable to a measurement of the characteristic tone scale of a display. Such a measurement will be referred to herein as characterizing the display.
- characterizing the display To characterize a tone-scale of a display according to the method disclosed by Edgar et al., one must make many measurements of the output of the display device throughout the grey scale range. This approach is cumbersome, slow and leads to inaccuracies.
- the Arazi patent uses images as viewed by an observer, they are used to guide the observer in the decision making process of modifying the working image, as opposed to using images viewed by the observer in order to actually calibrate the display. So, rather than being an instrumentless calibrator for displays, this patent actually describes a way of aiding the observer in making mental transformations from CRT to print, so that when the observer makes changes on the CRT image, the observer can imagine what it will look like when displayed on hard copy.
- the problem with this approach is that it requires an observer having a relatively high level of training to be able to make the mental transformation. Additionally, the results are inconsistent from one observer to the next, or from one observation to the next.
- Comparison of the calibration target is intended to provide help in calibrating the CRT to achieve similar spatial image contrast in the hard copy and the CRT. No teaching is provided as to how to actually calibrate the display with regard to these tone and/or spatial parameters. A problem with this approach is that it requires an experienced technician to adjust the CRT in response to the comparison of the targets.
- a method for detecting the characteristics of a display comprises the steps of: creating a model of the display having multiple parameters relating the physical output of the display to an input signal creating the display; employing a model of the human visual system, generating a set of control signals for producing patterns in the display that enable an observer to employ visual selection criteria to identify specific patterns corresponding to specific values of the parameters; applying the set of control signals to the display to produce the patterns; selecting specific patterns from the display; determining the values of the parameters from the patterns selected; and determining the characteristics of the display by applying the values of the parameters to the model.
- a unique attribute common to the methods of display characterization according to the present invention is the use of a display model in conjunction with visual models. These methods use psychophysical procedures to determine the observer's response to specifically generated visual patterns. The characterization of the device is determined from an analysis of the observer's responses.
- the underlying basic sciences include visual psychophysics, visual modeling, and display modeling.
- a key underlying technology is the interactive computer window system, although some implementations of this invention minimize this need.
- One advantage of the method of the present invention over the prior art is that it is more flexible than the methods of the prior art.
- the observer may set up the display in any favored configuration, and the display can then be characterized by the methods of the present invention.
- the prior art has not made an attempt to fully characterize the existing display behavior, but rather has used visual calibration to force the display (via re-adjustment) to have a certain behavior.
- the prior art of Edgar et al. could be applied to the problem of characterizing the grey scale of a display, that method required experiments at many different grey levels.
- Another important advantage of the present invention is that the use of a display model provides a way of determining the entire grey scale behavior of a display with a minimum number of tests. In addition to the extra time required by the multiplicity of tests required by the prior art, the errors resulting from the test procedure lead to more serious errors, such as non-monotonicity, which is prevented by using the method including a display model according to the present invention.
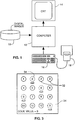
- the imaging system includes a source of digital images 10, for example an optical disk storage such as PhotoCDTM, a digital camera, or a scanner.
- the digital images are supplied to a computer 12 such as a personal computer or a set-top box, and displayed on a digital display such as a CRT 14 or a hardcopy printer.
- the CRT 14 may be a computer monitor connected to a personal computer, or a television monitor connected to a set-top box.
- An observer interface such as a keyboard 16, a mouse 18 or a television remote control device is connected to the computer or set-top box to enable an observer to interact with the computer or set-top box.
- a characterization of the display in the system shown in Figure 1 it is desirable to provide a characterization of the display in the system shown in Figure 1, such that given the characterization another display device can be used to produce an image that visually matches the display device produced by the system.
- Such a visual match is desirable for example when using a CRT to simulate the effects that will appear on a print produced by a hardcopy output device (softproofing).
- a characterization of the tone scale is required. For monochromatic displays, this entails measuring luminance, transmittance, or reflectance as a function of grey level. For color displays, the tone scales of the component colors must be measured. To understand the present invention in the context of color science, we will describe the display modeling, visual modeling and psychophysics that relate to the parameters of the display model.
- a model of the display is created 20 having a plurality of parameters.
- a test pattern for each parameter is generated 22 for testing an observer to determine the value of the display parameter using a human visual model.
- the test patterns are applied to the display 24 and an observer is instructed to select a component of the pattern that meets a specified visual criteria 26.
- the observer's responses are then used to determine the display parameter values 28.
- the values of the display parameters are used in conjunction with the display model to characterize the display 30.
- V code value
- ⁇ the gain
- ⁇ the offset
- ⁇ usually having a negative value.
- the external light flare within the CRT glass face plate is addressed by the term ⁇ , and we assume this is zero when the CRT is used in a completely darkened room. The value of light coming from the CRT cannot be less than zero, so if ( ⁇ V+ ⁇ ) ⁇ 0, it is set to zero in this equation.
- U.S. Patent No. 4,862,265 issued Aug. 29, 1989 to Bartow et al. discloses a device for calibrating a CRT that employs a light metering device for measuring the output of the CRT.
- a model of the CRT (without the flare component ⁇ ) similar to that described above is used to extrapolate the performance of the CRT from the measured data.
- the models will vary depending on the physics of the display. All such models will have the common feature of a series of parameters that can be sequentially estimated.
- the goal of visual characterization according to the present invention is to determine the parameters of the display model (in the case of the CRT, ⁇ , ⁇ , ⁇ , and ⁇ ) without using any specialized light measuring equipment other than the visual system of the observer. This is done by having the observer look at test patterns and make choices based on what is observed. The choices made by the observer are used to determine the parameters of the display model, which in turn is employed to perform the characterization of the display.
- the visual system can be modeled at a number of levels of detail. For the context of this invention we consider four levels of increasing sophistication.
- the first level model assumes that while a human observer may have difficulty assigning numbers to various perceived brightnesses, the observer's visual system can make comparisons (such as judging which of the two presented patches is the lighter) that are as accurate as needed for this problem.
- the first level model is then just a simple comparator, with some noise error when the light levels to be compared are nearly equivalent.
- the second level model takes into account the blurring due to the optics of the observer's eye. It also utilizes the fact that this blurring occurs in the linear domain of luminance (i.e. the blur can be simulated as a filtering operation acting on the luminance signal). The rest of the visual system is assumed to be a perfect comparator, as in the first level model.
- the third level model attempts to model the effects occurring in the neural mechanisms of the retina and the cortex. From psychophysical threshold data, a threshold model of the visual system can be constructed. The model uses the fact that the visual system transduces light into a neural response in a nonlinear fashion. The model also assumes that a threshold response corresponds to a certain size neural response, regardless of its location in the grey scale. Since this threshold response is very small, the model concentrates on the local slope of the nonlinear neural response.
- the fourth level of visual modeling that we are concerned with for this invention utilizes a similar visual model as the nonlinear threshold model (third level model), only it does not limit the visual response to threshold. It attempts to model the perceived brightness as a function of luminance, which is a suprathreshold response. The task imposed on the observer is to judge a consistency of brightness differences.
- the four major psychophysical procedures used in the method of this invention include method of adjustment (MOA), two-alternative forced choice (2AFC), multiple-alternative forced choice (MAFC), and method of constant stimuli (MCS).
- MOA method of adjustment
- 2AFC two-alternative forced choice
- MAFC multiple-alternative forced choice
- MCS constant stimuli
- the observer simply adjusts a parameter with a computer input device (e.g. using a mouse to adjust a window slider) until some desired visual result is achieved.
- a computer input device e.g. using a mouse to adjust a window slider
- the desired result will be a match between two stimuli.
- the two-alternative forced choice procedure (2AFC) is an approach where the observer is forced to choose between two stimuli, based on a criteria.
- this criteria is the presence of a signal, which is contained within only one of the stimuli.
- the signal is gradually reduced based on the observers' responses to repeated iterations and the psychophysical procedure can be programmed to find the observers' threshold (where their chance of seeing the signal is only 50% after correction for guessing).
- MAFC Multiple alternative forced choice
- MCS constant stimuli
- the sequence of parameter estimation is to estimate the normalized offsets, ⁇ R ⁇ R , ⁇ G ⁇ G , and, ⁇ B ⁇ B
- the first parameter that needs to be estimated is the normalized offset parameter, ⁇ ⁇ , since the other estimation steps depend on its result. From a series of preliminary studies, we concluded that code value changes of 1 (out of the typical 256 levels for an 8-bit display) can be discerned if the shape of the stimulus meets certain criteria. Thus the visual model used to estimate this parameter is a comparator (the first level model discussed above), and we assume its inaccuracy or noise level is on the order of one code value.
- V min is the code value which results in the minimum luminance.
- this test can be presented in a step-through fashion as shown in Figure 4.
- the generated pattern is displayed 38 to the observer. The observer is instructed 40 to select the first visible disk in the displayed pattern.
- k is checked to determine if it is at its defined minimum value (k min ) 42 and if it is not at its minimum value, k is reduced 44 for example by a factor of 2.
- a new pattern is then generated and shown to the observer.
- this normalized offset parameter ⁇ ⁇ does not have a strong effect on the other parameters as calculated through the display and visual models, it does not necessarily need to be calculated down to the nearest single code value.
- An option is to have the observer step through the series of disk-stimuli patterns commensurate with the degree to which the observer cares about image quality. As shown in phantom in Figure 4, the observer can choose to truncate the test 48 at any point after the first selection is made. This approach can be applied to the other techniques described in this application.
- the preferred approach utilizes a visual model that takes into account the blurring due to the optics of the eye. It also utilizes the fact that this blurring occurs in the linear domain of luminance (i.e., the blur can be simulated as a filtering operation acting on the luminance signal).
- the rest of the visual system is assumed to be a comparator capable of making matches.
- a high frequency pattern 50 of two code values V 1 and V 2 are displayed contiguous to a patch 52 of an adjustable code value grey level V A , as shown in Figure 5.
- the high frequency pattern 50 will be perceived as a uniform field due to the blurring of the optics of the eye.
- V A - ⁇ ⁇ + 1 2 V 1 + ⁇ ⁇ ⁇ + V 2 + ⁇ ⁇ ⁇ 1 ⁇
- a series of patches 54 as shown in Figure 6 are generated using constant values of V 1 and V 2 , contiguous to various values V A , which are calculated by equation 5 assuming various values for ⁇ .
- the observer selects the patch comparison (corresponding to the various assumed ⁇ values) in which the contiguous patches appear most equal (note that this method is combining the psychophysical techniques of MCS and MAFC). This percept is often accompanied by the disappearance of the edge separating them. It is necessary for the observer to view the patches at a sufficiently large viewing distance so that the high frequency pattern blurs into a uniform field.
- the chosen patch determines ⁇ to an accuracy one half that of the quantization of ⁇ values used to create the series.
- ⁇ it is assumed that while the observer may have difficulty assigning absolute numbers to various perceived brightnesses, the observer can make comparisons that are as accurate as needed for this problem.
- the visual system is modeled as a comparator with the capability of detecting a match by default. That is, a match occurs when no comparison judgment can be made because the difference between stimuli is smaller than the accuracy of the visual system to detect a difference.
- This approach makes use of a transparency 55 of known density (or as preferred, a transparency with two known densities 56 and 58 as shown in Figure 7).
- two patches 60 and 62 of differing code values are displayed on an interactive display (e.g.
- the transparency 55 is held over one of the patches while the other's code value is adjusted by the observer (i.e. MOA is used) until the light transmitted through the transparency from patches 60 and 62 appear to match in brightness.
- MOA the observer
- the observer indicates the match is made and the code value of the adjustable patch is saved.
- the densities of the transparency patches 56 and 58 are known along with the code values of the two patches 60 and 62, and the luminances of the light transmitted to the eye are assumed to be equal. In general they are not, and this is due to the noisiness of the visual system in making these comparisons. However, the error introduced by this noise can be quantified, and kept low enough that the technique can determine the ⁇ parameter to about 5%, which is sufficient accuracy for the intended applications.
- a second alternative approach to calculating ⁇ utilizes an even more detailed model of the visual system. Although it does not probe the spatial attributes of the visual system as does the preferred approach described above, it attempts to model the processes occurring in the neural mechanism of the retina and the cortex. From psychophysical threshold data, a threshold model of the visual system can be constructed. The visual system transduces light into a neural response in a nonlinear fashion. The threshold (essentially a contrast where a signal is just detectable) is assumed to give rise to a constant neural response magnitude throughout the grey scale range, despite the fact that the threshold contrasts may vary widely throughout the grey scale range. The visual response to luminance is shown in Figure 9a, where R is the visual response and L is luminance from the display.
- R+ and R- indicate the threshold deviations in visual response, while L+ and L- correspond to the luminances which give rise to R+ and R-.
- Figure 9b shows the luminance resulting from the code value of the display for the CRT model of equation (1). In Figure 9b, the code values V + and V - result in luminances L + and L - , which in turn result in the thresholds R + and R - shown in Figure 9a.
- the observer's threshold is measured at two different grey levels, V 1 and V 2 , and the code values associated with these thresholds are V 1 + and V 2 + , (either the plus or minus threshold may be used, and only one of them is needed to calculate ⁇ ).
- Various improvements in visual model can be substituted for equation 8 (Response vs.
- Luminance as well as various improvements in display model (equation 1).
- This technique can work for many visual patterns and an example is shown in Figure 10.
- a test region 64 is displayed on a background 66.
- the observer is instructed to adjust the level of the test region 64 until it matches the background 66.
- the visual threshold must be greater than a single code value throughout the grey scale range. As mentioned earlier, this criteria is not met for an 8-bit display. Consequently, this technique is limited to displays with 9-bits or higher.
- the visual system is modeled in terms of the perceived brightness as a function of luminance, where brightness is a suprathreshold response. The observer is instructed to judge a consistency of brightness differences.
- Each patch includes a circular portion having a brighter upper half with brightness B i and a darker lower half with brightness B i+1 surrounded by a background having a brightness B i,i+1 equal to the average of B i and B i+1 .
- the observer is instructed to select the row that has the most uniform brightness differences across the row.
- V 0 is the starting code value of the series of patches in a row
- V n is the last code value of the series of patches, consisting of n total steps
- V i is the code value to be calculated for the ith step of the series.
- the observer is instructed to select the row where the brightness differences (as judged across the two halves of each patch 70) is the most consistent.
- this task utilizes a combination of the MAFC and MCS psychophysical techniques.
- a CRT color display uses three phosphors to produce three primary colors: red, green, and blue.
- the mixture of these three primary colors can produce a large number of colors with different hue, saturation, and brightness.
- Physical specification of color reproduction is usually done through the use of the CIE 1931 (X,Y,Z) tristimulus values.
- the relative magnitudes of the ⁇ parameters relate to color balance, and given the chromaticities of the display phosphors, will relate to color temperature. In this step of the visual characterization, it is necessary to have extra information about the chromaticities of the display phosphors, as it is extremely difficult to obtain these in a method of visual characterization.
- the visual characterization program can be set up to have the chromaticity coordinate data available for all the CRTs of interest to the application, and the observers task is simplified to selecting their particular display from a menu. Since the observer will have the display right in front of them, it is not difficult for them to perform this task. Finally, it is not possible to estimate the absolute ⁇ values for color nor even monochrome systems without more exhaustive psychophysical techniques than is reasonable for these applications. However, it is possible to estimate the ratios of ⁇ R , ⁇ G , and ⁇ B ;
- the matrix A has to be determined.
- the four pairs of corresponding chromaticities are usually chosen to be the chromaticities of the phosphors and the chromaticity of the white point.
- the N.T.S.C. chromaticity transformation between the phosphor primaries and the CIE XYZ primaries are listed below in Table 1.
- Table 1 Stimulus r g b x y z red phosphor 1 0 0 0.67 0.33 0.00 green phosphor 0 1 0 0.21 0.71 0.08 blue phosphor 0 0 1 0.14 0.08 0.78
- CRT display manufacturers usually specify the chromaticity coordinates of the phosphors they use, the only unknown is the chromaticity of the white point.
- a color temperature test pattern comprising 5 series (partially shown) of grey scales 80 for visually estimating color temperature is shown.
- Each grey scale 80 consists of 12 disks 82 against a grey background 84.
- the left five disks in each grey scale are colored with 5 primary hues of the Munsell Color System: 5R5/14, 5Y7/12, 5G5/12, 5B7/8, and 5P7/8. These 5 primary hues are included in the grey scale pattern to prevent complete chromatic adaptation to the grey disks G 1 -G 7 .
- Table 2 lists the CIE 1931 (x,y) values associated with these Munsell color values.
- the other seven disks of the grey scale are a series of greys of different Munsell values: 8, 7, 6, 5, 4, 3, and 2 (from left to right). If the maximum luminance of the display is 1.0, then these Munsell values will be 0.9, 0.7866, 0.5910, 0.4306, 0.3005, 0.1977, and 0.1200.
- the grey background 84 is 0.16.
- Each grey scale is calculated to be the same chromaticity of the CIE illuminant C, based on the assumption that the display is white-balanced at a particular chromaticity, say, 5000 K, 6500 K, and 9300 K CIE daylight illuminant. If the display phosphor chromaticities are known and the assumed white balance is correct, the color conversion matrix A will be correct and the grey scale will appear as a good neutral grey to the observer. If the assumed white balance is incorrect, the calculated A will also be incorrect, and the display grey scale will not appear neutral grey (in general it will appear either too yellow or too blue).
- the preferred implementation is to display 5 grey scales (consisting of series of disks from dark to light) on the display and they are calculated to be the same as illuminant C, based on 5 white points: 4062 K, 5000 K, 6500 K, 9300 K, and 18000 K. This is shown in black and white in Figure 12.
- the second grey scale i.e. the one based on 5000 K
- the visual characterization system will output the pre-calculated matrix A as the color conversion matrix. This information can then be sent to any color reproduction system to which it is connected.
- the display's actual color balance lies between these tested color temperatures, it will be estimated with an error less than or equal to half the difference between these 5 temperatures. For the applications relevant to this invention, this degree of accuracy is sufficient.
- the actual ratios of ⁇ R , ⁇ G , and ⁇ B can be determined from the L R , L G , and L B ratios by solving equation 1 for ⁇ .
- the visual characterization method is implemented within the overall color reproduction system.
- Several of the components of the color reproduction system are employed in the visual characterization method, but are used in a different manner and to different end purposes than when reproducing color images.
- the function of the color reproduction system is to acquire an image 90 in step 92, commonly including either A/D or digital transfer, decompression, and format conversion and input calibration.
- the image 90 is transformed 94 using a color reproduction transform which prepares the image for display on a display device 96 such that the image 90 has a desired appearance to an observer 98.
- These steps are shown above the horizontal dashed line 99 in FIG. 13.
- the color reproduction transform 94 must include parameters or data modeling the behavior of the display 96.
- the present invention addresses the determination of these parameters (or values in a LUT), and is shown as lying below the horizontal dashed line 99, yet within the color reproduction system 114.
- the first step 100 of the present invention is to initiate the characterization process.
- the next step 102 is to generate a test pattern according to the display model for a first parameter i of a set of parameters, and to send this test pattern to the display 96 for viewing by observer 98.
- Observer 98 makes a selection response based on instructed criteria, and inputs this response to the visual characterization system in an observer selection input step 104.
- the visual characterization method takes this input from step 104 and calculates the display parameter i in step 106. The method then increments 108 to the next parameter of the display model.
- the next step 110 is to check to see if the previous parameter was the last parameter of the set of parameters for the display model. If not, the process continues with the next display parameter and after determining the next display parameter in step 112, a test pattern is generated for the new parameter 102 and it is displayed 96. If the previous parameter was the last parameter at step 110, the visual characterization procedure sends the list of parameters to the color reproduction transform 94 and the characterization process is complete.
Landscapes
- Engineering & Computer Science (AREA)
- Health & Medical Sciences (AREA)
- Biomedical Technology (AREA)
- General Health & Medical Sciences (AREA)
- Multimedia (AREA)
- Signal Processing (AREA)
- Physics & Mathematics (AREA)
- Computer Hardware Design (AREA)
- General Physics & Mathematics (AREA)
- Theoretical Computer Science (AREA)
- Testing, Inspecting, Measuring Of Stereoscopic Televisions And Televisions (AREA)
- Controls And Circuits For Display Device (AREA)
Abstract
Description
- This invention relates to the visual characterization of a display and more particularly to the characterization of a display without the use of calibration hardware.
- We shall refer to the use of the human visual system to achieve an instrumentless display characterization as visual characterization. The advantages in using a human observer rather than an instrument include the savings in cost and training. The disadvantages are that visual characterization is less accurate than an instrument based technique. As a result, there arise various applications where one may be more suited than the other. The key issue is a cost/quality trade-off. Some of the applications include softcopy proofing, desktop-publishing, calibration of display tone scales for teleconferencing or any general image exchange, and calibrating images for scientific visualization.
- Several prior art techniques for visual calibration of displays have been proposed. U. S. Patent 5,298,993 issued Mach 29, 1994 to Edgar et al., "Display Calibration" describes the use of matching a high frequency binary pattern to a region of a solid grey level, which is a method that relies on the optics of the eye to average a high frequency pattern. Edgar et al. describe the use of this technique for setting a hardware knob, such as contrast, for calibrating the tone scale of a display. A number of displays are mentioned, including LCDs, raster displays, printers, and copiers. Edgar et al. purport to provide the first objective instrumentless display calibration system or method. Edgar et al. point out that the method of their invention is also applicable to a measurement of the characteristic tone scale of a display. Such a measurement will be referred to herein as characterizing the display. To characterize a tone-scale of a display according to the method disclosed by Edgar et al., one must make many measurements of the output of the display device throughout the grey scale range. This approach is cumbersome, slow and leads to inaccuracies.
- U. S. Patent 5,212,546 issued May 18, 1993 to Arazi et al for "Color Correction System Employing Reference Pictures" describes the use of reference pictures in a softproofing application. These reference pictures are intended to be actual images (as opposed to test targets). The approach is to have a calibrated system print several reference images. Then the calibrated reference images are displayed on the desired CRT display, which is manually adjusted (with whatever controls are available to the observer - typically gain and offset) to match as closely as possible their corresponding versions in print form. No guidance is given toward the method of actually calibrating (adjusting) the display to achieve such a goal. Once the matching is completed, then the system displays the reference image along with the actual image the observer is working on. The idea is that the observer can see the comparison of the print and CRT image for the reference picture, then mentally extrapolate how the actual image displayed on the CRT will look when printed out with the same system. Though the Arazi patent uses images as viewed by an observer, they are used to guide the observer in the decision making process of modifying the working image, as opposed to using images viewed by the observer in order to actually calibrate the display. So, rather than being an instrumentless calibrator for displays, this patent actually describes a way of aiding the observer in making mental transformations from CRT to print, so that when the observer makes changes on the CRT image, the observer can imagine what it will look like when displayed on hard copy. The problem with this approach is that it requires an observer having a relatively high level of training to be able to make the mental transformation. Additionally, the results are inconsistent from one observer to the next, or from one observation to the next.
- U. S. Patent No. 4,760,447, issued July 26, 1988 to Koka et al, "Calibration Pattern and Method for Matching Characteristics of Video Monitors and Cameras" describes a calibration target for calibrating an imaging system that captures and prints an image. The calibration target includes a contrast detail (CD) diagram and some patches of various spatial frequencies. The CD diagram is commonly used in the field of medical imaging and comprises a series of disks of different size and contrast. The calibration target is used to guide the adjustment of the analog gain and offset knobs of a CRT to match the hardcopy version of the same captured image. Calibration is attempted by comparing the number of visible disks in contrast detail (CD) diagrams between the printed target and the target as displayed on the CRT. Comparison of the calibration target is intended to provide help in calibrating the CRT to achieve similar spatial image contrast in the hard copy and the CRT. No teaching is provided as to how to actually calibrate the display with regard to these tone and/or spatial parameters. A problem with this approach is that it requires an experienced technician to adjust the CRT in response to the comparison of the targets.
- U. S. Patent 5,296,947 issued March 22, 1994 to H. Bowers, "System for Softproofing a Color Reproduction" is in the field of softproofing (i.e. using a computer monitor to simulate the appearance of a halftone offset process in color printing) and describes the use of color patches that address the subtractive primaries of the 3 or 4 dyes (CMYK), as well as the "additive" primaries due to dye overlap (RGB), and the paper's white value. The method described in the Bowers patent is to set up the display such that these 8 colors are matched from the CRT to the hard copy. The preferred embodiment is to use a colorimeter, but they also mention the possibility of settling for a less accurate version by having the observer make a visual match. No statements are actually made regarding the characterization of the display. The shortcoming of this approach is that an accurate visual match of a limited set of colors is difficult, inaccurate and non repeatable for a non trained observer. Furthermore, even if the representative colors are matched, the rest of the color space may not be accurately calibrated.
- Therefore there is a need for an improved visual display calibration method that fully characterizes the display.
- The present invention is directed to overcoming one or more of the problems set forth above. According to the present invention, a method for detecting the characteristics of a display, comprises the steps of: creating a model of the display having multiple parameters relating the physical output of the display to an input signal creating the display; employing a model of the human visual system, generating a set of control signals for producing patterns in the display that enable an observer to employ visual selection criteria to identify specific patterns corresponding to specific values of the parameters; applying the set of control signals to the display to produce the patterns; selecting specific patterns from the display; determining the values of the parameters from the patterns selected; and determining the characteristics of the display by applying the values of the parameters to the model.
- A unique attribute common to the methods of display characterization according to the present invention is the use of a display model in conjunction with visual models. These methods use psychophysical procedures to determine the observer's response to specifically generated visual patterns. The characterization of the device is determined from an analysis of the observer's responses. The underlying basic sciences include visual psychophysics, visual modeling, and display modeling. A key underlying technology is the interactive computer window system, although some implementations of this invention minimize this need.
- One advantage of the method of the present invention over the prior art is that it is more flexible than the methods of the prior art. The observer may set up the display in any favored configuration, and the display can then be characterized by the methods of the present invention. The prior art has not made an attempt to fully characterize the existing display behavior, but rather has used visual calibration to force the display (via re-adjustment) to have a certain behavior. Although the prior art of Edgar et al. could be applied to the problem of characterizing the grey scale of a display, that method required experiments at many different grey levels. Another important advantage of the present invention is that the use of a display model provides a way of determining the entire grey scale behavior of a display with a minimum number of tests. In addition to the extra time required by the multiplicity of tests required by the prior art, the errors resulting from the test procedure lead to more serious errors, such as non-monotonicity, which is prevented by using the method including a display model according to the present invention.
- These and other aspects, objects, features and advantages of the present invention will be more clearly understood and appreciated from a review of the following detailed description of the preferred embodiments and appended claims, and by reference to the accompanying drawings.
-
- FIG. 1 is a block diagram of an imaging system having a display that can be characterized according to the present invention;
- FIG. 2 is a flow chart showing the steps of calibrating a display according to the present invention;
- FIG. 3 represents a display pattern for visually estimating the offset parameter used in the method of the present invention;
- FIG. 4 is a flow chart showing the steps for estimating the offset parameter of the display model;
- FIG. 5 shows a display pattern for visually estimating the gamma parameter of the display model;
- FIG. 6 shows a display pattern consisting of a series of the display patterns of FIG. 5, where the parameters are changed from one single display pattern to the next;
- FIG. 7 shows a display pattern used in an alternative method for calibrating gamma, using a transparency;
- FIG. 8 shows a transparency overlaid on the display pattern of FIG. 7;
- FIG. 9a and 9b are a set of graphs showing the relationship between luminance and code value of the display and the relationship between visual response and luminance useful in describing a further alternative method of calibrating gamma using a threshold visual model;
- FIG. 10 is a display pattern used in the alternative method of calibrating gamma with the threshold visual model;
- FIG. 11 is a display pattern used in a further alternative method for calibrating gamma using a visual brightness model;
- FIG. 12 shows a display pattern for visually estimating the color temperature; and
- FIG. 13 is a more detailed flow chart showing the steps of calibrating a display according to the present invention, including the calibration environment and the use of the calibration information in a color reproduction process.
- Referring first to Figure 1, an imaging system having a display that can be characterized by the present invention is shown. The imaging system includes a source of
digital images 10, for example an optical disk storage such as PhotoCD™, a digital camera, or a scanner. The digital images are supplied to acomputer 12 such as a personal computer or a set-top box, and displayed on a digital display such as aCRT 14 or a hardcopy printer. TheCRT 14 may be a computer monitor connected to a personal computer, or a television monitor connected to a set-top box. An observer interface, such as akeyboard 16, amouse 18 or a television remote control device is connected to the computer or set-top box to enable an observer to interact with the computer or set-top box. - It is desirable to provide a characterization of the display in the system shown in Figure 1, such that given the characterization another display device can be used to produce an image that visually matches the display device produced by the system. Such a visual match is desirable for example when using a CRT to simulate the effects that will appear on a print produced by a hardcopy output device (softproofing). In another example, it may be desirable to match the appearance of the display device to an object, for example to match the color of clothing for sale in a home shopping application on a customer's television.
- To perform any generic imaging task involving matching an image from one display device to another display device or to a physical object, a characterization of the tone scale is required. For monochromatic displays, this entails measuring luminance, transmittance, or reflectance as a function of grey level. For color displays, the tone scales of the component colors must be measured. To understand the present invention in the context of color science, we will describe the display modeling, visual modeling and psychophysics that relate to the parameters of the display model.
- Referring to Figure 2, the method of display characterization according to the present invention will be described. First, a model of the display is created 20 having a plurality of parameters. Next, a test pattern for each parameter is generated 22 for testing an observer to determine the value of the display parameter using a human visual model. The test patterns are applied to the
display 24 and an observer is instructed to select a component of the pattern that meets a specifiedvisual criteria 26. The observer's responses are then used to determine the display parameter values 28. Finally, the values of the display parameters are used in conjunction with the display model to characterize thedisplay 30. - According to the
first step 20 outlined above, a model of the display device is created. A CRT display may be modeled as follows:
- U.S. Patent No. 4,862,265 issued Aug. 29, 1989 to Bartow et al. discloses a device for calibrating a CRT that employs a light metering device for measuring the output of the CRT. In the luminance range of the CRT that is too low to measure with the device, a model of the CRT (without the flare component φ) similar to that described above is used to extrapolate the performance of the CRT from the measured data.
- For other displays such as continuous tone hard copy, the models will vary depending on the physics of the display. All such models will have the common feature of a series of parameters that can be sequentially estimated. Although the present invention will be described with a CRT as the display, it will be understood that the present invention may be employed to characterize any display. The goal of visual characterization according to the present invention is to determine the parameters of the display model (in the case of the CRT, α, β, γ, and φ) without using any specialized light measuring equipment other than the visual system of the observer. This is done by having the observer look at test patterns and make choices based on what is observed. The choices made by the observer are used to determine the parameters of the display model, which in turn is employed to perform the characterization of the display.
- In performing the visual characterization of display devices, one needs to consider the behavior of the visual system. The visual system can be modeled at a number of levels of detail. For the context of this invention we consider four levels of increasing sophistication.
- The first level model assumes that while a human observer may have difficulty assigning numbers to various perceived brightnesses, the observer's visual system can make comparisons (such as judging which of the two presented patches is the lighter) that are as accurate as needed for this problem. The first level model is then just a simple comparator, with some noise error when the light levels to be compared are nearly equivalent.
- The second level model takes into account the blurring due to the optics of the observer's eye. It also utilizes the fact that this blurring occurs in the linear domain of luminance (i.e. the blur can be simulated as a filtering operation acting on the luminance signal). The rest of the visual system is assumed to be a perfect comparator, as in the first level model.
- The third level model attempts to model the effects occurring in the neural mechanisms of the retina and the cortex. From psychophysical threshold data, a threshold model of the visual system can be constructed. The model uses the fact that the visual system transduces light into a neural response in a nonlinear fashion. The model also assumes that a threshold response corresponds to a certain size neural response, regardless of its location in the grey scale. Since this threshold response is very small, the model concentrates on the local slope of the nonlinear neural response.
- The fourth level of visual modeling that we are concerned with for this invention utilizes a similar visual model as the nonlinear threshold model (third level model), only it does not limit the visual response to threshold. It attempts to model the perceived brightness as a function of luminance, which is a suprathreshold response. The task imposed on the observer is to judge a consistency of brightness differences.
- There are a number of psychophysical procedures employed to obtain responses from an observer. The four major psychophysical procedures used in the method of this invention include method of adjustment (MOA), two-alternative forced choice (2AFC), multiple-alternative forced choice (MAFC), and method of constant stimuli (MCS).
- In the method of adjustment procedure (MOA), the observer simply adjusts a parameter with a computer input device (e.g. using a mouse to adjust a window slider) until some desired visual result is achieved. In the present invention, the desired result will be a match between two stimuli.
- The two-alternative forced choice procedure (2AFC) is an approach where the observer is forced to choose between two stimuli, based on a criteria. Usually this criteria is the presence of a signal, which is contained within only one of the stimuli. Generally the signal is gradually reduced based on the observers' responses to repeated iterations and the psychophysical procedure can be programmed to find the observers' threshold (where their chance of seeing the signal is only 50% after correction for guessing).
- Multiple alternative forced choice (MAFC) is a variation of 2AFC procedure, where the number of choices is increased to more than two. Though it generally does not give the best data, it can be the quickest of these psychophysical procedures. We will use this procedure in several embodiments of our invention, as its advantage of being the quickest procedure outweighs its disadvantage of being less accurate.
- Finally the method of constant stimuli (MCS) is a procedure that can be used with any of the alternative-forced choice procedures. Rather than having the stimulus be programmed to find the observers threshold based on their responses in these tasks, this procedure tests specific stimuli at a number of levels. The observer is instructed to select the component of a test pattern that most closely meets the visual criteria. Often, when these levels are chosen properly, the observer's responses to these can be used to determine the visual response at threshold. In our case we do not find the threshold per se, but get only as close to threshold as the application of the method of the invention necessitates.
- Since separate techniques are necessary to determine the four model parameters α, β, γ, and φ, we will address them one at a time in the next four subsections.
- A color CRT display model requires three equations:

αR, αG, and αB are the gains of the red, green, and blue channels,
VR, VG, and VB are the code values for the red, green, and blue channels,
βR, βG, and βB are the offsets of the red, green, and blue channels,
γR, γG, and γB are the gammas of the red, green, and blue channels of the CRT,


φR, φG, and φB are the red, green, and blue components of flare due to external lighting. - Of course, for a monochromatic CRT, only one of the above equations is needed for the model.
- The sequence of parameter estimation is to estimate the normalized offsets,

- Next we use the estimated normalized offsets, and some visual test patterns to estimate the gammas, γR, γG, and γB. Then, we use these estimated parameters and additional visual test patterns to estimate the gain parameters, αR,
αG, and αB. Finally, we estimate the flare components, φR, φG, and φB. The detailed procedures for estimating these parameters according to the present invention are described in the following sections. For a color CRT, the procedures are repeated three times, once for each channel. For a monochrome CRT the procedures need to be performed only once.
Estimation of normalized offset
- The first parameter that needs to be estimated is the normalized offset parameter,

- From the CRT equation:


- The value of


- We determine the ratio

disks 32 are displayed on ablack background 34 produced by a code value of zero. Thedisks 32 are arranged in a sequence, preferably in normal reading fashion (left-to-right, top-to-bottom) in increasing order from low code value to high code value. The observer is instructed to select the first disk which is visible (i.e. the darkest visible disk). One way of achieving this interrogation is to instruct the observer to use the mouse to click on the first visible disk in the sequence. Note that the use of disk shape is not essential; other geometric shapes may be employed. For noisy displays or those with more than 8 bits, the uniform disks could be replaced with a frequency pattern (i.e. around 4 cycles per visual degree). - It has been noted by the inventors that when a number of disks are presented in a regular pattern, some observers will extrapolate the pattern of observable disks to lower light levels than they can actually see. The result of this is that the offset parameter will be underestimated. We avoid this problem by randomly inserting disks of offset value =0 (null disks 34) throughout the series. This technique reduces pattern extrapolation, and the observer's response can be checked to ensure they did not select a null disk. If they did select a null disk, this means they are still choosing based on pattern extrapolation rather than actual visual response. The system can then instruct them to choose only the first disk which is actually visible, and/or insert null disks at different locations and instruct the observer to repeat the observation. Since a pattern of 64 disks (where Vmin=64) plus the null disks takes up a major portion of screen space and/or forces the disks to be a small size, this test can be presented in a step-through fashion as shown in Figure 4. The first step is to generate 36 a pattern of disks having code values spaced apart by some incremental code value k (e.g. k=4). This presents a smaller subset of the disks. Next, the generated pattern is displayed 38 to the observer. The observer is instructed 40 to select the first visible disk in the displayed pattern. Based on the observers response to this pattern, k is checked to determine if it is at its defined minimum value (kmin) 42 and if it is not at its minimum value, k is reduced 44 for example by a factor of 2. A new pattern is then generated and shown to the observer. The new pattern halves the size of the code value increments (k) and includes disks having code values centered around the code value of the previously chosen disk. This process is continued until the increments between the disks is equal to kmin (e.g. kmin=1). Finally, the normalized offset parameter


- Since this normalized offset parameter

test 48 at any point after the first selection is made. This approach can be applied to the other techniques described in this application. - We have developed four methods of determining the g parameter.
- The preferred approach utilizes a visual model that takes into account the blurring due to the optics of the eye. It also utilizes the fact that this blurring occurs in the linear domain of luminance (i.e., the blur can be simulated as a filtering operation acting on the luminance signal). The rest of the visual system is assumed to be a comparator capable of making matches. A
high frequency pattern 50 of two code values V1 and V2 are displayed contiguous to apatch 52 of an adjustable code value grey level VA, as shown in Figure 5. Thehigh frequency pattern 50 will be perceived as a uniform field due to the blurring of the optics of the eye. Using the notation of L1, L2, and LA for the luminances associated with the code values V1, V2, and VA, we have:
- This relationship holds at the retina of the visual system (i.e. after the blurring by the optics of the eye). For the two luminance levels L1 and L2, a complete blurring is mathematically described by the averaging operation in
equation 3. If we nowsubstitute equation 1 for the CRT luminance L as a function of these three associated code values V1, V2, and VA, we have:

- With this technique, a series of
patches 54 as shown in Figure 6, are generated using constant values of V1 and V2, contiguous to various values VA, which are calculated byequation 5 assuming various values for γ. The observer then selects the patch comparison (corresponding to the various assumed γ values) in which the contiguous patches appear most equal (note that this method is combining the psychophysical techniques of MCS and MAFC). This percept is often accompanied by the disappearance of the edge separating them. It is necessary for the observer to view the patches at a sufficiently large viewing distance so that the high frequency pattern blurs into a uniform field. The chosen patch determines γ to an accuracy one half that of the quantization of γ values used to create the series. A range of 1.5 to 3.2 seems more than sufficient to encompass all displays of which we are aware, and the increments of 0.1 will allow the determination of γ to within 5%. This leads to a γ value which is accurate enough for color reproduction for all but the most discriminating observers (i.e. some professional applications). The γ calculation is performed in a series of steps like those shown in Figure 4 for the calculation of offset, with the exception that the previously calculated offset parameters for each primary are provided as inputs to thegeneration 36 of the pattern shown in Figure 6. - According to a first alternate approach for determining γ, it is assumed that while the observer may have difficulty assigning absolute numbers to various perceived brightnesses, the observer can make comparisons that are as accurate as needed for this problem. As a result of this assumption, the visual system is modeled as a comparator with the capability of detecting a match by default. That is, a match occurs when no comparison judgment can be made because the difference between stimuli is smaller than the accuracy of the visual system to detect a difference. This approach makes use of a
transparency 55 of known density (or as preferred, a transparency with two knowndensities patches transparency 55 is held over one of the patches while the other's code value is adjusted by the observer (i.e. MOA is used) until the light transmitted through the transparency frompatches transparency patches patches 
patches transparency 55, and ΔD is the density difference of the two halves of thetransparency 55 placed overpatches 
equation 1. Note that the normalized offset
- A second alternative approach to calculating γ utilizes an even more detailed model of the visual system. Although it does not probe the spatial attributes of the visual system as does the preferred approach described above, it attempts to model the processes occurring in the neural mechanism of the retina and the cortex. From psychophysical threshold data, a threshold model of the visual system can be constructed. The visual system transduces light into a neural response in a nonlinear fashion. The threshold (essentially a contrast where a signal is just detectable) is assumed to give rise to a constant neural response magnitude throughout the grey scale range, despite the fact that the threshold contrasts may vary widely throughout the grey scale range. The visual response to luminance is shown in Figure 9a, where R is the visual response and L is luminance from the display. R+ and R- indicate the threshold deviations in visual response, while L+ and L- correspond to the luminances which give rise to R+ and R-. A simple model of the visual response, shown in Figure 9a, as function of luminance is:

equation 8 is negative. Figure 9b shows the luminance resulting from the code value of the display for the CRT model of equation (1). In Figure 9b, the code values V+ and V- result in luminances L+ and L-, which in turn result in the thresholds R+ and R- shown in Figure 9a. If the observer's threshold is measured at two different grey levels, V 1 and V 2, and the code values associated with these thresholds are V 1 + and V 2 +, (either the plus or minus threshold may be used, and only one of them is needed to calculate γ). The γ value can be determined by numerically solving the following equation:
test region 64 is displayed on abackground 66. The observer is instructed to adjust the level of thetest region 64 until it matches thebackground 66. However, the visual threshold must be greater than a single code value throughout the grey scale range. As mentioned earlier, this criteria is not met for an 8-bit display. Consequently, this technique is limited to displays with 9-bits or higher. - Finally, according to another alternative embodiment for determining γ, the visual system is modeled in terms of the perceived brightness as a function of luminance, where brightness is a suprathreshold response. The observer is instructed to judge a consistency of brightness differences. In this approach we assume that perceived brightness is a function of physical luminance as follows:

- With this approach, a series of rows of
patches 68, as shown in Figure 11, are created according to assumptions of various γ values. Each patch includes a circular portion having a brighter upper half with brightness Bi and a darker lower half with brightness Bi+1 surrounded by a background having a brightness Bi,i+1 equal to the average of Bi and Bi+1. Bi is generated as follows:
- The observer is instructed to select the row that has the most uniform brightness differences across the row. The code values of a row corresponding to a specific γ are determined using the following equation for patch i (70) in row γ (72):

- The estimation of the normalized offset parameter


- A CRT color display uses three phosphors to produce three primary colors: red, green, and blue. The mixture of these three primary colors can produce a large number of colors with different hue, saturation, and brightness. Physical specification of color reproduction is usually done through the use of the CIE 1931 (X,Y,Z) tristimulus values. The relative magnitudes of the α parameters relate to color balance, and given the chromaticities of the display phosphors, will relate to color temperature. In this step of the visual characterization, it is necessary to have extra information about the chromaticities of the display phosphors, as it is extremely difficult to obtain these in a method of visual characterization. This is not a serious problem because if the observer knows the make and model of the display they are using then this information can be input to the visual characterization program. The visual characterization program can be set up to have the chromaticity coordinate data available for all the CRTs of interest to the application, and the observers task is simplified to selecting their particular display from a menu. Since the observer will have the display right in front of them, it is not difficult for them to perform this task. Finally, it is not possible to estimate the absolute α values for color nor even monochrome systems without more exhaustive psychophysical techniques than is reasonable for these applications. However, it is possible to estimate the ratios of αR, αG, and αB;
- The conversion between the CRT phosphor excitations, (R,G,B) and the colorimetric tristimulus values (X,Y,Z) is achieved by a 3x3 matrix:

- The color conversion matrix A is usually specified by stating four pairs of corresponding chromaticities in the (R,G,B) and the (X,Y,Z) color spaces. For example, if (r1, g1, b1) is mapped by A to (x1, y1, z1), (r2, g2, b2) to (x2, y2, z2), (r3, g3,b3) to (x3, y3, z3) and (r4, g4, b4) to (x4, y4, z4), then A can be determined up to a constant factor, c, thus preventing absolute estimation of αR, αG, and αB. It can be shown that A=cVDU-1:


- The four pairs of corresponding chromaticities are usually chosen to be the chromaticities of the phosphors and the chromaticity of the white point. For example, the N.T.S.C. chromaticity transformation between the phosphor primaries and the CIE XYZ primaries are listed below in Table 1.
Table 1 Stimulus r g b x y z red phosphor 1 0 0 0.67 0.33 0.00 green phosphor 0 1 0 0.21 0.71 0.08 blue phosphor 0 0 1 0.14 0.08 0.78 White (Illuminant C) 1/3 1/3 1/3 0.310 0.316 0.374 
- Since CRT display manufacturers usually specify the chromaticity coordinates of the phosphors they use, the only unknown is the chromaticity of the white point. There are three white points that are most frequently used by CRT display manufacturers. They are specified by the correlated color temperatures of the CIE daylight definitions: 5000 K, 6500 K, and 9300 K, and their CIE 1931 (x,y) chromaticities are (0.3457, 0.3587), (0.3128, 0.3292), and (0.2831, 0.2971). Given a known CRT display (as per the input obtained from the observer) with known phosphors, we can calculate matrix A for each possible white point.
- For visual color characterization of CRT displays, an assumption has to be made about human color perception. Through various experiments, it was found that for displays with maximum luminance between 40 and 90 cd/m2, CIE illuminant C with chromaticity at (0.3101, 0.3162) against a dark surround appears to be a very good neutral to most observers. This finding can be used for visual color characterization of CRT displays using, a combination of the MAFC and MCS procedures. On the display screen, a number of grey scales are displayed and the observer is asked to select the best neutral grey.
- Referring to Figure 12, a color temperature test pattern comprising 5 series (partially shown) of grey scales 80 for visually estimating color temperature is shown. Each
grey scale 80 consists of 12disks 82 against agrey background 84. The left five disks in each grey scale are colored with 5 primary hues of the Munsell Color System: 5R5/14, 5Y7/12, 5G5/12, 5B7/8, and 5P7/8. These 5 primary hues are included in the grey scale pattern to prevent complete chromatic adaptation to the grey disks G1-G7. Table 2 lists the CIE 1931 (x,y) values associated with these Munsell color values.Table 2 Munsell value x value y value 5R5/14 0.5342 0.3158 5Y7/12 0.4677 0.4857 5G5/12 0.2104 0.4578 5B7/8 0.2204 0.2729 5P7/8 0.2918 0.2504 CIE illuminant C 0.3101 0.3162 - The other seven disks of the grey scale are a series of greys of different Munsell values: 8, 7, 6, 5, 4, 3, and 2 (from left to right). If the maximum luminance of the display is 1.0, then these Munsell values will be 0.9, 0.7866, 0.5910, 0.4306, 0.3005, 0.1977, and 0.1200. The
grey background 84 is 0.16. - Each grey scale is calculated to be the same chromaticity of the CIE illuminant C, based on the assumption that the display is white-balanced at a particular chromaticity, say, 5000 K, 6500 K, and 9300 K CIE daylight illuminant. If the display phosphor chromaticities are known and the assumed white balance is correct, the color conversion matrix A will be correct and the grey scale will appear as a good neutral grey to the observer. If the assumed white balance is incorrect, the calculated A will also be incorrect, and the display grey scale will not appear neutral grey (in general it will appear either too yellow or too blue). Therefore, only one out of the many displayed grey scales will appear to be a good grey and that is the one that is based on the actual white point of the display (i.e. the assumed matrix A used in the calculation of the grey scale matches the matrix A inherent in the tested color CRT at its current state of adjustment).
- The preferred implementation is to display 5 grey scales (consisting of series of disks from dark to light) on the display and they are calculated to be the same as illuminant C, based on 5 white points: 4062 K, 5000 K, 6500 K, 9300 K, and 18000 K. This is shown in black and white in Figure 12. For example, if the display current state of adjustment gives it a color balance of 5000 K, the second grey scale (i.e. the one based on 5000 K), will look the most neutral among the set of 5 grey scales. Consequently, the observer will choose that grey scale. Based on that choice, the visual characterization system will output the pre-calculated matrix A as the color conversion matrix. This information can then be sent to any color reproduction system to which it is connected. If the display's actual color balance lies between these tested color temperatures, it will be estimated with an error less than or equal to half the difference between these 5 temperatures. For the applications relevant to this invention, this degree of accuracy is sufficient. From the matrix A, the ratios of LR, LG, and LB can be determined for the case when

equation 1 for α. - Referring to FIG. 13, we can see how the visual characterization method is implemented within the overall color reproduction system. Several of the components of the color reproduction system are employed in the visual characterization method, but are used in a different manner and to different end purposes than when reproducing color images. The function of the color reproduction system is to acquire an
image 90 in step 92, commonly including either A/D or digital transfer, decompression, and format conversion and input calibration. Next, theimage 90 is transformed 94 using a color reproduction transform which prepares the image for display on adisplay device 96 such that theimage 90 has a desired appearance to anobserver 98. These steps are shown above the horizontal dashed line 99 in FIG. 13. To accomplish the desired color appearance, the color reproduction transform 94 must include parameters or data modeling the behavior of thedisplay 96. The present invention addresses the determination of these parameters (or values in a LUT), and is shown as lying below the horizontal dashed line 99, yet within thecolor reproduction system 114. Thefirst step 100 of the present invention is to initiate the characterization process. Thenext step 102 is to generate a test pattern according to the display model for a first parameter i of a set of parameters, and to send this test pattern to thedisplay 96 for viewing byobserver 98.Observer 98 makes a selection response based on instructed criteria, and inputs this response to the visual characterization system in an observerselection input step 104. The visual characterization method takes this input fromstep 104 and calculates the display parameter i instep 106. The method thenincrements 108 to the next parameter of the display model. Thenext step 110 is to check to see if the previous parameter was the last parameter of the set of parameters for the display model. If not, the process continues with the next display parameter and after determining the next display parameter instep 112, a test pattern is generated for thenew parameter 102 and it is displayed 96. If the previous parameter was the last parameter atstep 110, the visual characterization procedure sends the list of parameters to the color reproduction transform 94 and the characterization process is complete. - The invention has been described with reference to a preferred embodiment. However, it will be appreciated that variations and modifications can be effected by a person of ordinary skill in the art without departing from the scope of the invention.
-
- 10
- source of digital images
- 12
- computer
- 14
- CRT
- 16
- keyboard
- 18
- mouse
- 20
- create display model step
- 22
- generate test pattern step
- 24
- apply pattern to display step
- 26
- select pattern step
- 28
- determine display parameter values step
- 30
- determine display characteristics step
- 32
- disks
- 34
- black background
- 36
- generate pattern step
- 38
- display pattern step
- 40
- select pattern step
- 42
- termination decision step
- 44
- reduce sampling increment step
- 46
- calculate parameter step
- 48
- continue characterization decision step
- 50
- high frequency pattern
- 52
- adjustable code value pattern
- 54
- series of patches
- 55
- transparency
- 56-58
- known density portions of transparency
- 60-62
- patches displayed on CRT
- 64
- test region displayed on CRT
- 66
- background on CRT
- 68
- patch on a background
- 70
- patch
- 72
- row of patches
- 80
- grey scale
- 82
- disks
- 84
- grey background
- 90
- image
- 92
- input and formatting step
- 94
- transform step
- 96
- display device
- 98
- observer
- 99
- dashed line separating color reproduction steps from visual characterization steps
- 100
- first step
- 102
- generate test pattern step
- 104
- selection input step
- 106
- determine display parameter step
- 108
- increment display parameters step
- 110
- check for last parameter step
- 112
- determine next display parameter step
Claims (16)
- A method for detecting the characteristics of a display (14), comprising the steps of:(a) creating a model of the display having multiple parameters relating the physical output of the display to an input signal creating the display;(b) employing a model of the human visual system, generating a set of control signals for producing patterns (32, 54, 60, 72, 80) in the display that enable an observer to employ visual selection criteria to identify specific patterns corresponding to specific values of the parameters;(c) applying the set of control signals to the display to produce the patterns;(d) selecting specific patterns from the display;(e) determining the values of the parameters from the patterns selected; and(f) determining the characteristics of the display by applying the values of the parameters to the model.
- The method for detecting the characteristics of a display (14) as claimed in claim 1, wherein the display is a monochromatic CRT, and the model of the CRT is as follows:

α is the gain,
V is the code value,
β is the offset,
γ is the gamma of the CRT, and
φ is the flare due to external lighting. - The method for detecting the characteristics of a display as claimed in claim 1, wherein the display (14) is a color CRT, and the model of the CRT is as follows:

αR, αG, and αB are the gains of the red, green, and blue channels,
VR, VG, and VB are the code values for the red, green, and blue channels,
βR, βG, and βB are the offsets of the red, green, and blue channels,
γR, γG, and γB are the gammas of the red, green, and blue channels of the CRT, and
φR, φG, and φB are the red, green, and blue components of flare due to external lighting. - Apparatus for detecting the characteristics of a display (14), comprising:(a) means (12) for generating a set of patterns (34, 50, 60, 72, 80) that enable an observer to employ visual selection criteria to identify specific patterns corresponding to specific values of parameters in a model of the display having multiple parameters relating the physical output of the display to input signal creating the display;(b) means (16) for enabling an observer to select specific patterns from the display;(c) means (12) for determining the values of the parameters from the patterns selected; and(d) means (12) for determining the characteristics of the display by applying the values of the parameters to the model.
- The method claimed in claim 2, wherein one of said patterns is a series of uniform grey level disks (32) on a black background (34) for measuring the offset β.
- The method claimed in claim 5, wherein disks (34) of grey level equal to the black background are randomly interspersed in the pattern to frustrate pattern extrapolation.
- The method claimed in claim 2, wherein one of said patterns (34) is a series of frequency patterns (32) on a black background for measuring the offset β.
- The method claimed in claim 3, wherein one of said patterns (80) is a series of uniform grey level disks (G1, G2 ...) on a grey background (84) for measuring the gains αR, αG, and αB.
- The method claimed in claim 8, wherein the series of uniform grey level disks (G1, G2 ...) is accompanied by series of color for preventing complete color adaptation to the grey level patches.
- The method claimed in claim 3, wherein one of said patterns is a series of patterns (54) including a flat field (52) contiguous to a high frequency pattern (50) for measuring γ.
- The method claimed in claim 3, wherein one of said patterns is a pair of rectangular CRT primary color patches (60, 62) employed with a transparency (55) of known density for measuring γ.
- The method claimed in claim 3, wherein one of said patterns is a rectangle (64) of a CRT primary color surrounded by a background (66) of similar color for measuring γ.
- The method claimed in claim 2, wherein one of said patterns is a series of uniform grey level disks (32) on a black background (34) for measuring the flare parameter φ.
- The method claimed in claim 13, wherein disks (34) of grey level equal to the black background are randomly interspersed in the pattern to frustrate pattern extrapolation.
- The method claimed in claim 2, wherein one of said patterns is a series of frequency patterns (32) on a black background (34) for measuring the flare parameter φ.
- The method claimed in claim 1, wherein the patterns are displayed in step-through fashion to allow an observer to terminate the characterization of the display at a desired image quality for any given parameter.
Applications Claiming Priority (4)
| Application Number | Priority Date | Filing Date | Title |
|---|---|---|---|
| US68995P | 1995-06-21 | 1995-06-21 | |
| US689 | 1995-06-21 | ||
| US612530 | 1996-03-08 | ||
| US08/612,530 US5754222A (en) | 1996-03-08 | 1996-03-08 | Visual characterization using display model |
Publications (3)
| Publication Number | Publication Date |
|---|---|
| EP0750431A2 true EP0750431A2 (en) | 1996-12-27 |
| EP0750431A3 EP0750431A3 (en) | 1998-10-21 |
| EP0750431B1 EP0750431B1 (en) | 2004-03-24 |
Family
ID=26668003
Family Applications (1)
| Application Number | Title | Priority Date | Filing Date |
|---|---|---|---|
| EP19960109739 Expired - Lifetime EP0750431B1 (en) | 1995-06-21 | 1996-06-18 | Visual characterization using display models |
Country Status (3)
| Country | Link |
|---|---|
| EP (1) | EP0750431B1 (en) |
| JP (1) | JPH0918902A (en) |
| DE (1) | DE69631927T2 (en) |
Cited By (3)
| Publication number | Priority date | Publication date | Assignee | Title |
|---|---|---|---|---|
| FR2774498A1 (en) * | 1998-02-05 | 1999-08-06 | Ge Medical Syst Sa | METHOD FOR CONTROLLING THE CALIBRATION OF A DISPLAY SYSTEM, PARTICULARLY A PRINTER |
| EP1043708A2 (en) * | 1999-04-04 | 2000-10-11 | Fujitsu Limited | Recognising and adjusting display characteristics |
| WO2007071604A1 (en) * | 2005-12-22 | 2007-06-28 | Thomson Licensing | Image display method for the determination or the adjustment of the electro-optical response of a screen or projector |
Citations (1)
| Publication number | Priority date | Publication date | Assignee | Title |
|---|---|---|---|---|
| EP0562971A1 (en) * | 1992-03-23 | 1993-09-29 | Eastman Kodak Company | Method and apparatus for adaptive color characterization and calibration |
-
1996
- 1996-06-14 JP JP15455096A patent/JPH0918902A/en not_active Withdrawn
- 1996-06-18 EP EP19960109739 patent/EP0750431B1/en not_active Expired - Lifetime
- 1996-06-18 DE DE1996631927 patent/DE69631927T2/en not_active Expired - Lifetime
Patent Citations (1)
| Publication number | Priority date | Publication date | Assignee | Title |
|---|---|---|---|---|
| EP0562971A1 (en) * | 1992-03-23 | 1993-09-29 | Eastman Kodak Company | Method and apparatus for adaptive color characterization and calibration |
Non-Patent Citations (1)
| Title |
|---|
| SCHUCHARD: "evaluation of uniform crt display scales with usual threshold data" APPLIED OPTICS, vol. 29, no. 4, February 1990, pages 570-578, XP000094501 NEW-YORK (US) * |
Cited By (7)
| Publication number | Priority date | Publication date | Assignee | Title |
|---|---|---|---|---|
| FR2774498A1 (en) * | 1998-02-05 | 1999-08-06 | Ge Medical Syst Sa | METHOD FOR CONTROLLING THE CALIBRATION OF A DISPLAY SYSTEM, PARTICULARLY A PRINTER |
| EP0935232A1 (en) * | 1998-02-05 | 1999-08-11 | Ge Medical Systems Sa | Method of checking the calibration of a display system |
| US6133950A (en) * | 1998-02-05 | 2000-10-17 | Ge Medical Systems, S.A. | Method of checking the calibration of a display system in particular a printer |
| EP1043708A2 (en) * | 1999-04-04 | 2000-10-11 | Fujitsu Limited | Recognising and adjusting display characteristics |
| EP1043708A3 (en) * | 1999-04-04 | 2003-11-19 | Fujitsu Limited | Recognising and adjusting display characteristics |
| US6850245B1 (en) | 1999-04-07 | 2005-02-01 | Fujitsu Limited | Display characteristics recognition apparatus, display characteristics recognition program storage medium, computer system, display characteristics adjusting apparatus and display characteristics adjusting program storage medium |
| WO2007071604A1 (en) * | 2005-12-22 | 2007-06-28 | Thomson Licensing | Image display method for the determination or the adjustment of the electro-optical response of a screen or projector |
Also Published As
| Publication number | Publication date |
|---|---|
| DE69631927D1 (en) | 2004-04-29 |
| EP0750431A3 (en) | 1998-10-21 |
| DE69631927T2 (en) | 2005-01-05 |
| EP0750431B1 (en) | 2004-03-24 |
| JPH0918902A (en) | 1997-01-17 |
Similar Documents
| Publication | Publication Date | Title |
|---|---|---|
| US5754222A (en) | Visual characterization using display model | |
| US5298993A (en) | Display calibration | |
| US9767763B2 (en) | Methods and apparatus for calibrating a color display | |
| EP0767445A2 (en) | Image processing apparatus and method | |
| EP1662477A1 (en) | Test or calibration of displayed greyscales | |
| US20030142374A1 (en) | Digital camera for image device calibration | |
| US20020131634A1 (en) | Method of reproducing a gray scale image in colors | |
| US6700627B2 (en) | Method of characterizing a video display | |
| US20030091230A1 (en) | Display characterization method and apparatus | |
| US6078309A (en) | System and method for visually measuring color characteristics of a display | |
| US7312799B2 (en) | Visual determination of gamma for softcopy display | |
| EP0750431B1 (en) | Visual characterization using display models | |
| Hardeberg et al. | Colorimetric characterization of projection displays using a digital colorimetric camera | |
| US20030025711A1 (en) | System and method for visually calibrating a display based on just-noticeable-difference of human perception response | |
| US7265778B2 (en) | Visual display characterization | |
| Nezamabadi et al. | Effect of image size on the color appearance of image reproductions using colorimetrically calibrated LCD and DLP displays | |
| US7425965B2 (en) | Colour calibration | |
| Cviljušac et al. | A method for evaluating human observer's perception of color differences | |
| Motta | Visual characterization of color CRTs | |
| Oskoui et al. | Determination of adapted white points for various viewing environments | |
| Braun et al. | Psychophysical generation of matching images for cross‐media color reproduction | |
| Klassen et al. | Visually determining gamma for softcopy display | |
| To et al. | 17.3: Visual calibration of displays for accurate contrast reproduction | |
| Green | Sensor Adjustment | |
| Arslan | Development of a softcopy environment for banding visibility assessment experiments and identification of inkjet printers for forensic applications |
Legal Events
| Date | Code | Title | Description |
|---|---|---|---|
| PUAI | Public reference made under article 153(3) epc to a published international application that has entered the european phase |
Free format text: ORIGINAL CODE: 0009012 |
|
| AK | Designated contracting states |
Kind code of ref document: A2 Designated state(s): DE FR GB |
|
| PUAL | Search report despatched |
Free format text: ORIGINAL CODE: 0009013 |
|
| AK | Designated contracting states |
Kind code of ref document: A3 Designated state(s): DE FR GB |
|
| 17P | Request for examination filed |
Effective date: 19990414 |
|
| GRAP | Despatch of communication of intention to grant a patent |
Free format text: ORIGINAL CODE: EPIDOSNIGR1 |
|
| GRAS | Grant fee paid |
Free format text: ORIGINAL CODE: EPIDOSNIGR3 |
|
| GRAA | (expected) grant |
Free format text: ORIGINAL CODE: 0009210 |
|
| AK | Designated contracting states |
Kind code of ref document: B1 Designated state(s): DE FR GB |
|
| REG | Reference to a national code |
Ref country code: GB Ref legal event code: FG4D |
|
| REF | Corresponds to: |
Ref document number: 69631927 Country of ref document: DE Date of ref document: 20040429 Kind code of ref document: P |
|
| ET | Fr: translation filed | ||
| PLBE | No opposition filed within time limit |
Free format text: ORIGINAL CODE: 0009261 |
|
| STAA | Information on the status of an ep patent application or granted ep patent |
Free format text: STATUS: NO OPPOSITION FILED WITHIN TIME LIMIT |
|
| 26N | No opposition filed |
Effective date: 20041228 |
|
| REG | Reference to a national code |
Ref country code: DE Ref legal event code: R082 Ref document number: 69631927 Country of ref document: DE Representative=s name: MUELLER-BORE & PARTNER PATENTANWAELTE, EUROPEA, DE |
|
| REG | Reference to a national code |
Ref country code: DE Ref legal event code: R082 Ref document number: 69631927 Country of ref document: DE Representative=s name: MUELLER-BORE & PARTNER PATENTANWAELTE PARTG MB, DE Effective date: 20130430 Ref country code: DE Ref legal event code: R082 Ref document number: 69631927 Country of ref document: DE Representative=s name: MUELLER-BORE & PARTNER PATENTANWAELTE, EUROPEA, DE Effective date: 20130430 Ref country code: DE Ref legal event code: R081 Ref document number: 69631927 Country of ref document: DE Owner name: INTELLECTUAL VENTURES FUND 83 LLC (N.D.GES.D.S, US Free format text: FORMER OWNER: EASTMAN KODAK CO., ROCHESTER, N.Y., US Effective date: 20130430 Ref country code: DE Ref legal event code: R081 Ref document number: 69631927 Country of ref document: DE Owner name: INTELLECTUAL VENTURES FUND 83 LLC (N.D.GES.D.S, US Free format text: FORMER OWNER: EASTMAN KODAK CO., ROCHESTER, US Effective date: 20130430 |
|
| REG | Reference to a national code |
Ref country code: GB Ref legal event code: 732E Free format text: REGISTERED BETWEEN 20130711 AND 20130717 |
|
| REG | Reference to a national code |
Ref country code: FR Ref legal event code: TP Owner name: INTELLECTUAL VENTURES FUND 83 LLC, US Effective date: 20130919 |
|
| REG | Reference to a national code |
Ref country code: FR Ref legal event code: PLFP Year of fee payment: 20 |
|
| PGFP | Annual fee paid to national office [announced via postgrant information from national office to epo] |
Ref country code: GB Payment date: 20150526 Year of fee payment: 20 |
|
| PGFP | Annual fee paid to national office [announced via postgrant information from national office to epo] |
Ref country code: FR Payment date: 20150528 Year of fee payment: 20 |
|
| PGFP | Annual fee paid to national office [announced via postgrant information from national office to epo] |
Ref country code: DE Payment date: 20150630 Year of fee payment: 20 |
|
| REG | Reference to a national code |
Ref country code: DE Ref legal event code: R071 Ref document number: 69631927 Country of ref document: DE |
|
| REG | Reference to a national code |
Ref country code: GB Ref legal event code: PE20 Expiry date: 20160617 |
|
| PG25 | Lapsed in a contracting state [announced via postgrant information from national office to epo] |
Ref country code: GB Free format text: LAPSE BECAUSE OF EXPIRATION OF PROTECTION Effective date: 20160617 |