EP0706287B1 - Method and apparatus for computing color transformation tables - Google Patents
Method and apparatus for computing color transformation tables Download PDFInfo
- Publication number
- EP0706287B1 EP0706287B1 EP95420269A EP95420269A EP0706287B1 EP 0706287 B1 EP0706287 B1 EP 0706287B1 EP 95420269 A EP95420269 A EP 95420269A EP 95420269 A EP95420269 A EP 95420269A EP 0706287 B1 EP0706287 B1 EP 0706287B1
- Authority
- EP
- European Patent Office
- Prior art keywords
- spacing
- point
- grid
- index
- interest
- Prior art date
- Legal status (The legal status is an assumption and is not a legal conclusion. Google has not performed a legal analysis and makes no representation as to the accuracy of the status listed.)
- Expired - Lifetime
Links
Images


Classifications
-
- H—ELECTRICITY
- H04—ELECTRIC COMMUNICATION TECHNIQUE
- H04N—PICTORIAL COMMUNICATION, e.g. TELEVISION
- H04N1/00—Scanning, transmission or reproduction of documents or the like, e.g. facsimile transmission; Details thereof
- H04N1/46—Colour picture communication systems
- H04N1/56—Processing of colour picture signals
- H04N1/60—Colour correction or control
- H04N1/6058—Reduction of colour to a range of reproducible colours, e.g. to ink- reproducible colour gamut
Definitions
- the present invention is directed to a system for creating transformation tables that are used to convert color values from one type of device, such as a scanner, to another type of device, such as a printer, and, more particularly, to a system in which the input and output table grid points increase in spacing from some area of importance, such as neutral, allowing tables to be reduced in size while maintaining transform accuracy in a region of interest.
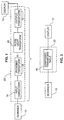
- Color signals or values produced by or for one device often need to be output to or represented by another device, such as a printer or display. Even though these devices may operate within the same color space such as RGB or u'v'L * the color values or signals produced by the first device need to be transformed into color values or signals suitable for the second device. To perform this transformation, several different sub-transformations are generally performed. Typical transformations that could be performed are illustrated in figure 1 when a system is providing color signals from a scanner to a display.
- This figure shows a transformation from a scanner 10 to a display 12 which includes input 14 and output 16 transforms and intermediate transforms 18 and 20 which make the image displayed on display 12 as close a visual match as possible to the input image scanned scanner 10 (See U.S. Patent 5,208,911).
- These transforms are typically multiterm equations represented in a computer 22 as a series of transform look-up and interpolation tables as depicted in figure 2 rather than as a series of formulas. This is because table look-ups and interpolations are much faster than formula computations for the computer formulas required in obtaining high quality color.
- Each transformation table includes a set of one-dimensional input tables 30, a three-dimensional grid table 32 and a set of one-dimensional output tables 34.
- the grid tables 32 are used for interpolation, they need to be large in order to provide a desired level of accuracy in the final result.
- table sizes can become prohibitive.
- a pleasing transform which modifies the color of flesh tones while leaving other colors unmodified.
- Such a transform has a high degree of curvature in color space yet must be tightly controlled.
- the grid size must grow to 32x32x32 (or 32,768 points) to achieve the degree of accuracy required in typical graphic arts applications.
- FIGS 4 and 5 graphically illustrate the nature of the problem.
- Each figure shows a two-dimensional slice through color space. The particular space they show is the CIE u'v'L * space.
- the two-dimensional slice is perpendicular to the luminance axis, so that it indicates chrominance.
- the curved dotted line indicates the set of all physically realizable colors, while the grids 36 and 38 indicate the coverage given by a 16x16 point and a 32x32 point uniform grid.
- the distance between adjacent grid points in figure 4 is large enough to introduce unacceptable inaccuracies when representing pleasing transforms as interpolation tables.
- European Patent Application publication number 0 615 379 describes an apparatus which connects RGB input to CMYK using an interpolation table.
- the interpolation table uses a grid whose intervals vary in a way which depends on the behavior of the transfer function employed. Thus determining the proper grid spacing requires an analysis of the particular transformation being modeled, and results in different grid spacings for different transformations. Having different grid spacings for different transformations can make the process of composition of color transformations more difficult.
- a transformation can be represented as a set of one-dimensional input look-up tables, a set of three-dimensional intermediate tables, and a set of one-dimensional output look-up tables. Because of interactions between the three types of tables, there is some ambiguity in how any given total transformation can be represented. In other words it is possible to modify the input tables, for instance, and compensate for the modification by making corresponding modifications to the output and/or intermediate tables. For any given transformation, as described in this application, this ambiguity can be exploited to produce a table representation which minimizes the size of the interpolation tables required to achieve a given level of accuracy. This minimization is often desirable for two reasons. First, it reduces the storage and memory required to use the table. Second, it reduces the amount of time required to compute the table. In situations where the table is being used to represent an interactive color move, this table computation time can be significant.
- the present invention is particularly useful in color spaces in which neutral parallels a coordinate system axis.
- the present invention solves the problem of reducing the size of the grid table for spaces in which all of the chrominance information is restricted to two color channels while maintaining accuracy in a desired region by creating non-linear grid spacing around a central point of a region of interest. This is shown in figure 6 for u'v'L * space with the luminance axis coming out of the paper.
- a point 60 is selected in the color gamut 62 in the color space 64, and particularly, in the center of a region of interest in a chrominance space such as a u'v'.
- the point 60 shown in figure 6 is the point representing D50, an illuminant commonly used for specifying neutral. Using a neutral point improves saturation-dependant transformation computations.
- the interpolation grid 68 is arranged relative to this selected point 60, so that the grid spacing along each axis increases with distance from the point 60. In the example, the grid spacing increases roughly linearly with distance from point 60 along each chrominance axis.
- the grid 68 in figure 6 has also been arranged so that the number of grid points on each side of point 60 in the u' dimension is roughly proportional to the length of the u axis on each side of point 60, and so that the number of grid points above point 60 is roughly 40% of the total number of grid points.
- the fine spacing or high resolution of the grid points in the region of interest maintains the desired accuracy of color transformations in this region at the sacrifice of lower resolution transformations in the periphery of the grid.
- the growth of grid point separation linearly with distance from point 60 when the point 60 is D50 results in a wedge 66 of constant hue going through roughly an equal number of grid points of the grid 68 as the wedge expands as it moves further away from neutral. This results in greater control over hue transformation. As can be seen by visual inspection of figures 4 and 5 this is not the case in a uniformly spaced grid.
- the nonuniform grid spacing around D50 is 1/3 the size of the spacing for a grid with the same number of uniformly spaced points. Thus, the accuracy is three times greater in the region of interest for a nonuniform grid than a uniform grid.
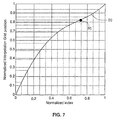
- the present invention starts with the one dimensional quadratic grid point transform curves or functions for the output transform for the u' and v' chromaticity coordinates. Since the grid point transform curves or functions of the u' and v' curves usually do not match in range, for example, the v' coordinates in figure 6 range from about .17 to about .58 while the u' coordinates range from about .07 to about .48, the curves need to be normalized to those ranges.
- the normalized grid point transform curve 80 for v' is shown in figure 7 and the normalized transform curve 82 for u' is shown in figure 8.
- the method of producing the non-uniformity can use any function that creates a spacing that increases as the distance from the point of interest increases.
- the preference is to use a function whose slope increases roughly linearly with distance from the point of interest.
- Figures 6-8 illustrate grid points for an output table. The input tables are created by inverting the output transform curves.
- grid points is 16 in the example being discussed
- dw is the distance from the neutral point
- the neutral point is the center of the region of interest
- remapped is the remapped grid point value
- slope is the slope at the point of interest, D50 or neutral in this example and which slope is 1/3 in this example
- Aplus and Aminus are normalization offset parameters that ensure that 0 maps to 0 and 1 maps to 1.
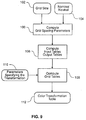
- the above-described step of computing or remapping the grid spacing from uniform to non-uniform from the input grid size 102 and the point of interest 104 is depicted in the flowchart of figure 9.
- the desired grid size 102 and neutral value 104 have been specified, they are used to compute 100 the grid remapping function for each table dimension, as described previously.
- the input and output tables are then computed 106.
- Each output table is made proportional to the corresponding grid remapping function. The constant of proportionality depends on how the tables are encoded.
- the inputs and outputs of each transformation are 8 bit numbers, while each grid table is a 12 bit number.
- the output tables map the range 0-4095 to the range 0-255.
- each input table is computed by inverting the corresponding output table.
- the grid table can be computed 108 using the following procedure. For each grid point: 1) use the output tables to compute the physical value corresponding to that grid point; 2) apply the desired transformation to that physical value; 3) use the input tables to compute the grid value corresponding to that result; and 4) use the result of (3) to populate the grid table at that point.
- the system combines or composes the input, output and intermediate tables into the final color transformation table 112 (for example, table 36). The steps of producing the intermediate tables and composing all the tables into a single table are also conventional.
- the present invention typically operates in an environment, as illustrated in figure 10, which includes a computer 150, such as an Apple Macintosh II, coupled to receive an input transform for an input device 152, such as a scanner, and an output transform for an output device 154, such as a display or printer.
- the computer system includes a storage device 156, such as a hard disk drive, which stores the tables and transforms used to create the composite table.
- a user interface 158 such as a keyboard with a display, can be used to specify the intermediate transforms and the desired grid size.
- non-uniform spacings of grid points can also be created. For example, two regions of interest in a color space can be defined and the number of grid points in each region can be increased over a uniform spacing with the areas between the regions receiving a sparser number of points.
- the invention has also been described with a constant slope characteristic being used to determine spacing. It is possible for the slope to vary with distance in a complex function.
Description
- The present invention is directed to a system for creating transformation tables that are used to convert color values from one type of device, such as a scanner, to another type of device, such as a printer, and, more particularly, to a system in which the input and output table grid points increase in spacing from some area of importance, such as neutral, allowing tables to be reduced in size while maintaining transform accuracy in a region of interest.
- Color signals or values produced by or for one device, such as a color scanner, often need to be output to or represented by another device, such as a printer or display. Even though these devices may operate within the same color space such as RGB or u'v'L* the color values or signals produced by the first device need to be transformed into color values or signals suitable for the second device. To perform this transformation, several different sub-transformations are generally performed. Typical transformations that could be performed are illustrated in figure 1 when a system is providing color signals from a scanner to a display. This figure shows a transformation from a
scanner 10 to adisplay 12 which includesinput 14 andoutput 16 transforms andintermediate transforms display 12 as close a visual match as possible to the input image scanned scanner 10 (See U.S. Patent 5,208,911). These transforms are typically multiterm equations represented in acomputer 22 as a series of transform look-up and interpolation tables as depicted in figure 2 rather than as a series of formulas. This is because table look-ups and interpolations are much faster than formula computations for the computer formulas required in obtaining high quality color. Each transformation table includes a set of one-dimensional input tables 30, a three-dimensional grid table 32 and a set of one-dimensional output tables 34. - Because the grid tables 32 are used for interpolation, they need to be large in order to provide a desired level of accuracy in the final result. For pleasing transforms in particular, table sizes can become prohibitive. For example, consider a pleasing transform which modifies the color of flesh tones while leaving other colors unmodified. Such a transform has a high degree of curvature in color space yet must be tightly controlled. When such a function is represented as an interpolation table using a linear grid, the grid size must grow to 32x32x32 (or 32,768 points) to achieve the degree of accuracy required in typical graphic arts applications.
- Figures 4 and 5 graphically illustrate the nature of the problem. Each figure shows a two-dimensional slice through color space. The particular space they show is the CIE u'v'L* space. The two-dimensional slice is perpendicular to the luminance axis, so that it indicates chrominance. The curved dotted line indicates the set of all physically realizable colors, while the
grids - European Patent
Application publication number 0 615 379 describes an apparatus which connects RGB input to CMYK using an interpolation table. The interpolation table uses a grid whose intervals vary in a way which depends on the behavior of the transfer function employed. Thus determining the proper grid spacing requires an analysis of the particular transformation being modeled, and results in different grid spacings for different transformations. Having different grid spacings for different transformations can make the process of composition of color transformations more difficult. - What is needed is a system that reduces the size of the table yet maintains the accuracy desired by the color industry without making the process of composition of color transformations more difficult.
- As noted above a transformation can be represented as a set of one-dimensional input look-up tables, a set of three-dimensional intermediate tables, and a set of one-dimensional output look-up tables. Because of interactions between the three types of tables, there is some ambiguity in how any given total transformation can be represented. In other words it is possible to modify the input tables, for instance, and compensate for the modification by making corresponding modifications to the output and/or intermediate tables. For any given transformation, as described in this application, this ambiguity can be exploited to produce a table representation which minimizes the size of the interpolation tables required to achieve a given level of accuracy. This minimization is often desirable for two reasons. First, it reduces the storage and memory required to use the table. Second, it reduces the amount of time required to compute the table. In situations where the table is being used to represent an interactive color move, this table computation time can be significant.
- In practice, this optimization is often not performed. There are two reasons for this. The first is that there is no simple algorithmic procedure for optimizing the tables for a particular transformation. The second is that composing two transforms is more difficult when they have different input tables. For these reasons it is desirable to be able to use a standard set of input tables which work well for a broad class of transformations.
- What is needed is a method for producing transform representations which do a good job of representing transformations whose output values depend strongly on the hue of the input and less strongly on other aspects of the input color. It is also desirable that the representations reduce the size of the grid tables.
- Large color transform tables take a long time to compute and compose as well as access and also occupy a substantial region of random access memory space during real time transformations. As a result, what is needed is a table that is fast to compute and use and occupies less space than conventional tables.
- It is an object of the present invention to provide a system that reduces the size of the grid table.
- It is another object of the present invention to maintain color transform accuracy in regions of importance, such as near neutral.
- The above objects can be attained as set out in the claims. So input and output tables are created that have a variable grid point spacing around a region or point of interest, such as neutral, such that the spacing is fine or provides high color resolution in the region of interest and sparse and of lower resolution in regions away from the region of interest. This spacing can be accomplished by providing a grid spacing that increases the farther the particular grid point is away from the region of interest.
- These together with other objects and advantages which will be subsequently apparent, reside in the details of construction and operation as more fully hereinafter described and claimed, reference being had to the accompanying drawings forming a part hereof, wherein like numerals refer to like parts throughout.
-
- Figure 1 depicts the transformations which occur when color signals for a scanner are converted into color signals for a display;
- Figure 2 depicts the tables used to accomplish the transformation of figure 1;
- Figure 3 depicts the composition or combining of the tables/transforms of figures 1 and 2 into a single table/transform;
- Figures 4 and 5 illustrate a uniform output transformation grids of different grid spacings or resolution;
- Figure 6 depicts a non-uniform output grid in accordance with the present invention;
- Figures 7 and 8 illustrate transfer curves with non-uniform point spacing in accordance with the present invention;
- Figure 9 depicts the operations of the present invention; and
- Figure 10 illustrates typical hardware used in the present invention.
-
- The present invention is particularly useful in color spaces in which neutral parallels a coordinate system axis. The present invention solves the problem of reducing the size of the grid table for spaces in which all of the chrominance information is restricted to two color channels while maintaining accuracy in a desired region by creating non-linear grid spacing around a central point of a region of interest. This is shown in figure 6 for u'v'L* space with the luminance axis coming out of the paper. In the present invention a point 60 (see figure 6) is selected in the
color gamut 62 in thecolor space 64, and particularly, in the center of a region of interest in a chrominance space such as a u'v'. Thepoint 60 shown in figure 6 is the point representing D50, an illuminant commonly used for specifying neutral. Using a neutral point improves saturation-dependant transformation computations. Theinterpolation grid 68 is arranged relative to this selectedpoint 60, so that the grid spacing along each axis increases with distance from thepoint 60. In the example, the grid spacing increases roughly linearly with distance frompoint 60 along each chrominance axis. Thegrid 68 in figure 6 has also been arranged so that the number of grid points on each side ofpoint 60 in the u' dimension is roughly proportional to the length of the u axis on each side ofpoint 60, and so that the number of grid points abovepoint 60 is roughly 40% of the total number of grid points. The reason for handling the u' and v' directions differently is that the v' coordinate for D50 is high enough so that handling v' like u' would result in too few points in the yellow region of the chrominance plane. This grid point spacing will result in the size of the table being reduced to 16x16x32 or 8,142 points. This will also result in substantially maintaining the desired accuracy in the region of interest aroundpoint 60. This can be seen by comparing the 32 point grid of figure 5 with the nonuniform grid of figure 6 around the neutral point (u'=.209 and v'=.488). As can be seen the number of grid points in the region ofpoint 60 is approximately the same in both grid spacings. The fine spacing or high resolution of the grid points in the region of interest maintains the desired accuracy of color transformations in this region at the sacrifice of lower resolution transformations in the periphery of the grid. The growth of grid point separation linearly with distance frompoint 60 when thepoint 60 is D50 results in awedge 66 of constant hue going through roughly an equal number of grid points of thegrid 68 as the wedge expands as it moves further away from neutral. This results in greater control over hue transformation. As can be seen by visual inspection of figures 4 and 5 this is not the case in a uniformly spaced grid. The nonuniform grid spacing around D50 is 1/3 the size of the spacing for a grid with the same number of uniformly spaced points. Thus, the accuracy is three times greater in the region of interest for a nonuniform grid than a uniform grid. - To create the look-up table for the
non-uniform output grid 68 of figure 6, the present invention starts with the one dimensional quadratic grid point transform curves or functions for the output transform for the u' and v' chromaticity coordinates. Since the grid point transform curves or functions of the u' and v' curves usually do not match in range, for example, the v' coordinates in figure 6 range from about .17 to about .58 while the u' coordinates range from about .07 to about .48, the curves need to be normalized to those ranges. The normalized gridpoint transform curve 80 for v' is shown in figure 7 and the normalizedtransform curve 82 for u' is shown in figure 8. For figure 8, 0 corresponds to u'=.07 and 1 corresponds to u'=.48. These output transfer curves map 16 uniformly spaced normalized values to 16 non-uniformly spaced normalized values using quadratic curves. To create the two dimensional table of figure 6 the point in the center of the region of interest is determined. In the example previously described the neutral point D50 is the center of the region of interest. Theneutral point 86 for v' corresponds to .77 in figure 7 and theneutral point 88 for u' corresponds to .34. Once the center of the region of interest is known the number of grid points to be allowed is used to determine the spacing to create the nonuniform grid point spacing. The method of producing the non-uniformity can use any function that creates a spacing that increases as the distance from the point of interest increases. The preference is to use a function whose slope increases roughly linearly with distance from the point of interest. Figures 6-8, illustrate grid points for an output table. The input tables are created by inverting the output transform curves. - When the number of grid points, for example 16, are known a linearly increasing spacing, with distance from neutral, of the points on either side of the point of interest in each dimension with respect to a uniformly spaced grid, such as is shown in figures 7 and 8, can be determined by:
Forgrid value 0 to (grid points -1)
dw=grid value - neutral point
if (dw >=0)
remapped value = neutral point value + dw * (slope + dw * Aplus)
else
remapped value = neutral point value + dw * (slope - dw * Aminus)
where grid value is the value of the grid point in the uniformly spaced grid with values of 0, 1/16, 2/16 ... in this example, grid points is 16 in the example being discussed, dw is the distance from the neutral point, the neutral point is the center of the region of interest, remapped is the remapped grid point value, slope is the slope at the point of interest, D50 or neutral in this example and which slope is 1/3 in this example, and Aplus and Aminus are normalization offset parameters that ensure that 0 maps to 0 and 1 maps to 1. The above procedure is performed for both the u' and v' axes and produces new grid values from the grid values of a uniform or standard grid having the desired accuracy. As noted above, figures 7 and 8 illustrate the results of the procedure. - The above-described step of computing or remapping the grid spacing from uniform to non-uniform from the
input grid size 102 and the point ofinterest 104 is depicted in the flowchart of figure 9. Once the desiredgrid size 102 andneutral value 104 have been specified, they are used to compute 100 the grid remapping function for each table dimension, as described previously. The input and output tables are then computed 106. Each output table is made proportional to the corresponding grid remapping function. The constant of proportionality depends on how the tables are encoded. In the preferred implementation, the inputs and outputs of each transformation are 8 bit numbers, while each grid table is a 12 bit number. Thus, the output tables map the range 0-4095 to the range 0-255. In this case the output table is determined by:
output_table(i)=255*normalized_grid_ remapping_function(i/4095)
Once the output tables have been computed, each input table is computed by inverting the corresponding output table. One way of producing this inversion is to use a low order interpolation on the output table. Once the input and output tables have been computed, and once the desired color transformation has been specified 110, the grid table can be computed 108 using the following procedure. For each grid point: 1) use the output tables to compute the physical value corresponding to that grid point; 2) apply the desired transformation to that physical value; 3) use the input tables to compute the grid value corresponding to that result; and 4) use the result of (3) to populate the grid table at that point. Once these intermediate transform tables are known the system combines or composes the input, output and intermediate tables into the final color transformation table 112 (for example, table 36). The steps of producing the intermediate tables and composing all the tables into a single table are also conventional. - The present invention typically operates in an environment, as illustrated in figure 10, which includes a
computer 150, such as an Apple Macintosh II, coupled to receive an input transform for aninput device 152, such as a scanner, and an output transform for anoutput device 154, such as a display or printer. The computer system includes astorage device 156, such as a hard disk drive, which stores the tables and transforms used to create the composite table. Auser interface 158, such as a keyboard with a display, can be used to specify the intermediate transforms and the desired grid size. - Other non-uniform spacings of grid points can also be created. For example, two regions of interest in a color space can be defined and the number of grid points in each region can be increased over a uniform spacing with the areas between the regions receiving a sparser number of points.
- The invention has also been described with a constant slope characteristic being used to determine spacing. It is possible for the slope to vary with distance in a complex function.
- The many features and advantages of the invention are apparent from the detailed specification and, thus, it is intended by the appended claims to cover all such features and advantages of the invention which fall within the true spirit and scope of the invention. Further, since numerous modifications and changes will readily occur to those skilled in the art, it is not desired to limit the invention to the exact construction and operation illustrated and described, and accordingly all suitable modifications and equivalents may be resorted to, falling within the scope of the invention.
Claims (7)
- A method of creating a color transformation table, comprising:designating nonuniform index point spacing (100) for the table around a neutral point (60) so that the spacing is fine in the region of interest and sparce in the regions away from the region of interest; anddetermining entries (106) in the table using a transformation function responsive to the index points.
- A method as recited in claim 1 wherein the step of designating non uniform index point spacing comprises:
determining index points (100) with a nonuniform index point spacing for input and output tables having a rectilinear coordinate system with the index points most densely clustered at a neutral point so that a portion of a color space where the human eye is sensitive is emphasized; and
wherein the step of determining entries in the table comprises:determining entries (106) in the input and output tables using a transformation function responsive to the index points;producing (110) an intermediate transform table using an intermediate transform function responsive to the entries; andcombining (112) the input, intermediate and output tables into a single color transformation table. - A method as recited in claim 2, wherein the spacing between index points increases linearly with distance from the neutral point.
- A method as recited in claim 2, wherein the spacing between index points increases quadratically with distance from the neutral point.
- A method as recited in claim 1 wherein the step of designating non uniform index point spacing comprises:designating a neutral point (104) as a center point of a region of interest in a luminance color space so that portions of a color space where the human eye is sensitive are emphasized; anddesignating index points (100) in the color space with a nonuniform spacing relation to the center point.
- A method as recited in claim 1 wherein the step of designating non uniform index point spacing comprises:inputting a table grid spacing (102) having index values with uniform spacing; anddetermining new index values (100) having a nonuniform spacing a neutral point so that portions of a color space where the human eye is sensitive are emphasized.
- An apparatus for creating a color transformation table, comprising:a disk storage unit (156) storing a transformation function; anda computer (150) coupled to the disk storage unit and creating table index points having a nonuniform spacing clustered around a neutral point so that the spacing is fine in the region of interest and sparce in the regions away from the region of interest and determining entries for the index points using the transformation function.
Applications Claiming Priority (2)
| Application Number | Priority Date | Filing Date | Title |
|---|---|---|---|
| US08/320,023 US5644509A (en) | 1994-10-07 | 1994-10-07 | Method and apparatus for computing color transformation tables |
| US320023 | 1994-10-07 |
Publications (3)
| Publication Number | Publication Date |
|---|---|
| EP0706287A2 EP0706287A2 (en) | 1996-04-10 |
| EP0706287A3 EP0706287A3 (en) | 1996-12-27 |
| EP0706287B1 true EP0706287B1 (en) | 2001-08-01 |
Family
ID=23244552
Family Applications (1)
| Application Number | Title | Priority Date | Filing Date |
|---|---|---|---|
| EP95420269A Expired - Lifetime EP0706287B1 (en) | 1994-10-07 | 1995-09-25 | Method and apparatus for computing color transformation tables |
Country Status (4)
| Country | Link |
|---|---|
| US (1) | US5644509A (en) |
| EP (1) | EP0706287B1 (en) |
| JP (1) | JPH08194817A (en) |
| DE (1) | DE69521958T2 (en) |
Families Citing this family (32)
| Publication number | Priority date | Publication date | Assignee | Title |
|---|---|---|---|---|
| US6434266B1 (en) * | 1993-12-17 | 2002-08-13 | Canon Kabushiki Kaisha | Image processing method and apparatus for converting colors in a color image |
| US6046118A (en) * | 1996-08-02 | 2000-04-04 | E. I. Du Pont De Nemours And Company | Composite sheet material |
| US6118549A (en) * | 1997-03-26 | 2000-09-12 | Sharp Kabushiki Kaisha | Color conversion device |
| JPH1188709A (en) * | 1997-09-05 | 1999-03-30 | Fujitsu Ltd | Color conversion table constitution converting method and computer readable record medium recording color conversion table constitution converting program |
| US6501850B2 (en) | 1998-02-04 | 2002-12-31 | Eastman Kodak Company | Method for including traditional photographic calibration into digital color management |
| JP3912903B2 (en) * | 1998-07-02 | 2007-05-09 | キヤノン株式会社 | Data conversion method and apparatus |
| JP2000278546A (en) * | 1999-01-22 | 2000-10-06 | Sony Corp | Device and method for image processing, device and method for color gamut conversion table preparation, recording medium recording image processing program and recording medium recording color gamut conversion table preparation program |
| US6278805B1 (en) * | 1999-05-13 | 2001-08-21 | Eastman Kodak Company | System for composing color transforms using class information |
| US6775028B1 (en) | 2000-02-24 | 2004-08-10 | Lexmark International, Inc. | Non-linear method of mapping the lightness and chroma of a display device gamut onto a printing device gamut |
| JP2002077661A (en) * | 2000-09-05 | 2002-03-15 | Fujitsu Ltd | Extraction method for color signal values and creation method for color conversion table |
| US6731796B2 (en) | 2000-12-06 | 2004-05-04 | Xerox Corporation | Graphical user interface for color transformation table editing that avoids reversal artifacts |
| US7233695B2 (en) * | 2002-07-01 | 2007-06-19 | Xerox Corporation | Scan color conversion method |
| US7433080B2 (en) | 2004-09-28 | 2008-10-07 | Toshiba Corporation | System and method for conversion of duotone images for display |
| US20060268297A1 (en) * | 2005-05-25 | 2006-11-30 | Lexmark International, Inc. | Method for constructing a lookup table for converting data from a first color space to a second color space |
| US7855802B2 (en) * | 2006-04-06 | 2010-12-21 | Canon Kabushiki Kaisha | Time-efficient generation of color look-up table |
| US8913073B2 (en) | 2006-08-09 | 2014-12-16 | Adobe Systems Incorporated | Interpolation according to a function represented using unevenly spaced samples of the function |
| US7990588B2 (en) * | 2006-12-12 | 2011-08-02 | Canon Kabushiki Kaisha | Method of finding look-up table structures in color device sampling data |
| JP5230118B2 (en) * | 2007-03-30 | 2013-07-10 | キヤノン株式会社 | Gradation evaluation apparatus and gradation evaluation method |
| JP5025323B2 (en) | 2007-05-10 | 2012-09-12 | キヤノン株式会社 | Color processing apparatus and method |
| US8237990B2 (en) | 2007-06-28 | 2012-08-07 | Adobe Systems Incorporated | System and method for converting over-range colors |
| US7952756B1 (en) | 2007-07-12 | 2011-05-31 | Adobe Systems Incorporated | Methods and systems for encoding over-range color values using in-range values |
| US7869088B2 (en) * | 2007-12-28 | 2011-01-11 | Infoprint Solutions Company, Llc | Methods and apparatus for determining a lookup table size for an AFP link CMR |
| US8456709B2 (en) * | 2009-11-17 | 2013-06-04 | Canon Kabushiki Kaisha | Image processing apparatus, image processing method, and lookup table generation method |
| JP5775338B2 (en) * | 2011-03-17 | 2015-09-09 | キヤノン株式会社 | Color processing apparatus and method, and image processing apparatus |
| JP2014219724A (en) * | 2013-05-01 | 2014-11-20 | キヤノン株式会社 | Image processor, method for controlling image processor, and program |
| ES2707703T3 (en) | 2015-05-15 | 2019-04-04 | Hewlett Packard Development Co | Print cartridges and memory devices that contain compressed multidimensional color tables 523 |
| EP3459236B1 (en) | 2016-07-08 | 2021-04-21 | Hewlett-Packard Development Company, L.P. | Color look up table compression |
| US9992382B2 (en) | 2016-07-08 | 2018-06-05 | Hewlett-Packard Development Company, L.P. | Color table compression |
| US10674043B2 (en) | 2016-07-08 | 2020-06-02 | Hewlett-Packard Development Company, L.P. | Color table compression |
| US10516809B2 (en) | 2018-02-28 | 2019-12-24 | Ricoh Company, Ltd. | Optimizing number of grid points in multi-dimensional color lookup table |
| EP4211891A1 (en) * | 2020-09-08 | 2023-07-19 | InterDigital CE Patent Holdings, SAS | Device and method for applying a look-up table |
| CN117597913A (en) * | 2021-06-23 | 2024-02-23 | 交互数字Ce专利控股有限公司 | Apparatus and method for applying lookup tables |
Family Cites Families (9)
| Publication number | Priority date | Publication date | Assignee | Title |
|---|---|---|---|---|
| JPS6052429B2 (en) * | 1979-02-28 | 1985-11-19 | 大日本スクリ−ン製造株式会社 | Color correction calculation method |
| WO1981001065A1 (en) * | 1979-10-05 | 1981-04-16 | Hell R Gmbh | Process for transforming chrominance numerical signals of an orthogonal system of colour coordinates into numerical colour signals and into saturation signals of a system of colour coordinates and transformation circuit |
| US4929978A (en) * | 1987-10-23 | 1990-05-29 | Matsushita Electric Industrial Co., Ltd. | Color correction method for color copier utilizing correction table derived from printed color samples |
| US5321797A (en) * | 1990-06-11 | 1994-06-14 | Eastman Kodak Company | Apparatus and method for performing coordinate transformation employing stored values and interpolation |
| JPH04246690A (en) * | 1990-08-29 | 1992-09-02 | Xerox Corp | Method of displaying image having high quality by normal resolution |
| US5208911A (en) * | 1990-09-28 | 1993-05-04 | Eastman Kodak Company | Method and apparatus for storing and communicating a transform definition which includes sample values representing an input/output relation of an image transformation |
| US5185661A (en) * | 1991-09-19 | 1993-02-09 | Eastman Kodak Company | Input scanner color mapping and input/output color gamut transformation |
| US5231504A (en) * | 1991-12-30 | 1993-07-27 | Xerox Corporation | Method for improved color reproduction using linear mixing calculations based on positional relationships between an original color and an achromatic region in a linear mixing space |
| DE69418512T2 (en) * | 1993-03-08 | 1999-10-28 | Canon Kk | Color conversion device |
-
1994
- 1994-10-07 US US08/320,023 patent/US5644509A/en not_active Expired - Lifetime
-
1995
- 1995-09-25 EP EP95420269A patent/EP0706287B1/en not_active Expired - Lifetime
- 1995-09-25 DE DE69521958T patent/DE69521958T2/en not_active Expired - Fee Related
- 1995-10-04 JP JP7257904A patent/JPH08194817A/en active Pending
Also Published As
| Publication number | Publication date |
|---|---|
| EP0706287A3 (en) | 1996-12-27 |
| JPH08194817A (en) | 1996-07-30 |
| DE69521958D1 (en) | 2001-09-06 |
| US5644509A (en) | 1997-07-01 |
| EP0706287A2 (en) | 1996-04-10 |
| DE69521958T2 (en) | 2002-04-04 |
Similar Documents
| Publication | Publication Date | Title |
|---|---|---|
| EP0706287B1 (en) | Method and apparatus for computing color transformation tables | |
| US6724507B1 (en) | Image processing method and image processing apparatus | |
| US5692071A (en) | Color image processing method and apparatus for generating device-dependent color signals | |
| US5202935A (en) | Color conversion apparatus for altering color values within selected regions of a reproduced picture | |
| US7333237B2 (en) | Color adjustment method, color adjustment apparatus, color conversion definition editing apparatus, image processing apparatus, program, and storage medium | |
| US5731818A (en) | Method and apparatus for constrained gamut clipping | |
| US6724500B1 (en) | Piecewise color transformation by gamut partitioning | |
| US6734851B2 (en) | Analytic warping | |
| US6882445B1 (en) | Color gamut compression apparatus and method | |
| EP0611231A1 (en) | Method for cross-device color calibration and enhancement using explicit constraints | |
| EP0611230A1 (en) | Method and associated apparatus for transforming input color values in an input color space to output color values in an output color space | |
| US20030112454A1 (en) | Color transform method for preferential gamut mapping of colors in images | |
| US5596510A (en) | Table-based linear interpolation for color correction system and method | |
| EP0732844B1 (en) | Contrast correcting apparatus | |
| JPH07222011A (en) | Method for color reproduction range expression method, and method and device for processing image | |
| EP0566915B1 (en) | Sharpness processing apparatus | |
| US5564006A (en) | Real time transformation between color spaces | |
| EP0626781A2 (en) | Method and apparatus for mapping between color spaces and creating a three dimensional inverse look-up table | |
| EP0481525B1 (en) | Color conversion apparatus for altering color values within selected regions of a reproduced picture | |
| US20030020934A1 (en) | Color region compressing method | |
| JPH09186905A (en) | Color correction device | |
| JPH056427A (en) | Color image processor | |
| JP2004104603A (en) | Image processor, image processing method, storage medium and program | |
| JP2005167503A (en) | Image processor and image forming apparatus provided with the same | |
| JPH1070669A (en) | Color conversion device |
Legal Events
| Date | Code | Title | Description |
|---|---|---|---|
| PUAI | Public reference made under article 153(3) epc to a published international application that has entered the european phase |
Free format text: ORIGINAL CODE: 0009012 |
|
| AK | Designated contracting states |
Kind code of ref document: A2 Designated state(s): DE FR GB |
|
| PUAL | Search report despatched |
Free format text: ORIGINAL CODE: 0009013 |
|
| AK | Designated contracting states |
Kind code of ref document: A3 Designated state(s): DE FR GB |
|
| 17P | Request for examination filed |
Effective date: 19970529 |
|
| 17Q | First examination report despatched |
Effective date: 19990211 |
|
| GRAG | Despatch of communication of intention to grant |
Free format text: ORIGINAL CODE: EPIDOS AGRA |
|
| GRAG | Despatch of communication of intention to grant |
Free format text: ORIGINAL CODE: EPIDOS AGRA |
|
| GRAH | Despatch of communication of intention to grant a patent |
Free format text: ORIGINAL CODE: EPIDOS IGRA |
|
| GRAH | Despatch of communication of intention to grant a patent |
Free format text: ORIGINAL CODE: EPIDOS IGRA |
|
| GRAA | (expected) grant |
Free format text: ORIGINAL CODE: 0009210 |
|
| AK | Designated contracting states |
Kind code of ref document: B1 Designated state(s): DE FR GB |
|
| REF | Corresponds to: |
Ref document number: 69521958 Country of ref document: DE Date of ref document: 20010906 |
|
| ET | Fr: translation filed | ||
| REG | Reference to a national code |
Ref country code: GB Ref legal event code: IF02 |
|
| PLBE | No opposition filed within time limit |
Free format text: ORIGINAL CODE: 0009261 |
|
| STAA | Information on the status of an ep patent application or granted ep patent |
Free format text: STATUS: NO OPPOSITION FILED WITHIN TIME LIMIT |
|
| 26N | No opposition filed | ||
| PGFP | Annual fee paid to national office [announced via postgrant information from national office to epo] |
Ref country code: GB Payment date: 20020808 Year of fee payment: 8 |
|
| PGFP | Annual fee paid to national office [announced via postgrant information from national office to epo] |
Ref country code: FR Payment date: 20020903 Year of fee payment: 8 |
|
| PGFP | Annual fee paid to national office [announced via postgrant information from national office to epo] |
Ref country code: DE Payment date: 20020930 Year of fee payment: 8 |
|
| PG25 | Lapsed in a contracting state [announced via postgrant information from national office to epo] |
Ref country code: GB Free format text: LAPSE BECAUSE OF NON-PAYMENT OF DUE FEES Effective date: 20030925 |
|
| PG25 | Lapsed in a contracting state [announced via postgrant information from national office to epo] |
Ref country code: DE Free format text: LAPSE BECAUSE OF NON-PAYMENT OF DUE FEES Effective date: 20040401 |
|
| GBPC | Gb: european patent ceased through non-payment of renewal fee |
Effective date: 20030925 |
|
| PG25 | Lapsed in a contracting state [announced via postgrant information from national office to epo] |
Ref country code: FR Free format text: LAPSE BECAUSE OF NON-PAYMENT OF DUE FEES Effective date: 20040528 |
|
| REG | Reference to a national code |
Ref country code: FR Ref legal event code: ST |