EP0663182B1 - Ultrasonic measurement system for the determination of bone density and structure - Google Patents
Ultrasonic measurement system for the determination of bone density and structure Download PDFInfo
- Publication number
- EP0663182B1 EP0663182B1 EP95100385A EP95100385A EP0663182B1 EP 0663182 B1 EP0663182 B1 EP 0663182B1 EP 95100385 A EP95100385 A EP 95100385A EP 95100385 A EP95100385 A EP 95100385A EP 0663182 B1 EP0663182 B1 EP 0663182B1
- Authority
- EP
- European Patent Office
- Prior art keywords
- aforesaid
- designed
- electronic means
- block
- fact
- Prior art date
- Legal status (The legal status is an assumption and is not a legal conclusion. Google has not performed a legal analysis and makes no representation as to the accuracy of the status listed.)
- Expired - Lifetime
Links
- 238000005259 measurement Methods 0.000 title claims description 34
- 230000037182 bone density Effects 0.000 title description 3
- 210000000988 bone and bone Anatomy 0.000 claims description 49
- 238000002604 ultrasonography Methods 0.000 claims description 44
- 210000004872 soft tissue Anatomy 0.000 claims description 26
- 239000003550 marker Substances 0.000 claims description 13
- 238000007619 statistical method Methods 0.000 claims description 5
- 238000000034 method Methods 0.000 claims description 4
- 238000004364 calculation method Methods 0.000 claims 13
- 230000000063 preceeding effect Effects 0.000 claims 3
- 239000002184 metal Substances 0.000 claims 1
- 230000006870 function Effects 0.000 description 22
- 238000001514 detection method Methods 0.000 description 5
- 208000001132 Osteoporosis Diseases 0.000 description 4
- 230000007423 decrease Effects 0.000 description 3
- 230000005540 biological transmission Effects 0.000 description 2
- 238000003745 diagnosis Methods 0.000 description 2
- 230000001575 pathological effect Effects 0.000 description 2
- 230000007170 pathology Effects 0.000 description 2
- 238000000926 separation method Methods 0.000 description 2
- 208000029725 Metabolic bone disease Diseases 0.000 description 1
- 238000012217 deletion Methods 0.000 description 1
- 230000037430 deletion Effects 0.000 description 1
- 230000001747 exhibiting effect Effects 0.000 description 1
- 230000000284 resting effect Effects 0.000 description 1
- 210000001519 tissue Anatomy 0.000 description 1
- 238000012795 verification Methods 0.000 description 1
Images




Classifications
-
- G—PHYSICS
- G01—MEASURING; TESTING
- G01B—MEASURING LENGTH, THICKNESS OR SIMILAR LINEAR DIMENSIONS; MEASURING ANGLES; MEASURING AREAS; MEASURING IRREGULARITIES OF SURFACES OR CONTOURS
- G01B17/00—Measuring arrangements characterised by the use of infrasonic, sonic or ultrasonic vibrations
- G01B17/02—Measuring arrangements characterised by the use of infrasonic, sonic or ultrasonic vibrations for measuring thickness
-
- A—HUMAN NECESSITIES
- A61—MEDICAL OR VETERINARY SCIENCE; HYGIENE
- A61B—DIAGNOSIS; SURGERY; IDENTIFICATION
- A61B8/00—Diagnosis using ultrasonic, sonic or infrasonic waves
- A61B8/08—Clinical applications
- A61B8/0875—Clinical applications for diagnosis of bone
-
- G—PHYSICS
- G01—MEASURING; TESTING
- G01B—MEASURING LENGTH, THICKNESS OR SIMILAR LINEAR DIMENSIONS; MEASURING ANGLES; MEASURING AREAS; MEASURING IRREGULARITIES OF SURFACES OR CONTOURS
- G01B3/00—Measuring instruments characterised by the use of mechanical techniques
- G01B3/20—Slide gauges
- G01B3/205—Slide gauges provided with a counter for digital indication of the measured dimension
Definitions
- This invention refers to an ultrasonic measurement system for determining the density and structure of bone.
- the known systems are further equipped with computer circuits that calculate the time elapsing between the emission of the impulse by the first transducer and its detection, and which calculate, on the basis of the known distance between the transducers, the velocity with which the ultrasounds pass through the body segment under examination.
- Examples of known systems for determining bone density may be found in PCT WO 87/07494 and GB-A-2.257.253
- the transmission velocity of the ultrasound signal is strongly influenced by the characteristics of the bone tissue placed between the transducers and varies with the variations in bone structure and density.
- the known systems therefore compare the value of the measured velocity with a reference value, for the purpose of detecting a variation in the structure and density of the bone, which normally indicates decalcification of the bone tissue (caused, for example, by osteoporosis).
- Comparison between the measured value and the reference value is not always adequate to permit an accurate examination, because the velocity with which the ultrasounds are transmitted through the tissue varies strongly from one subject to another or in a single subject if the measurement sites cannot be located repeatedly with great accuracy.
- the purpose of this invention is to create an ultrasonic measurement system for the determination of the density and structure of bone that will overcome the drawbacks of the known systems.
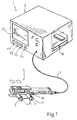
- the number 1 indicates, in its entirety, an ultrasonic measurement system for the determination of the density and structure of bone, in which an electronic central unit 3 is connected to ultrasonic calipers 5 by a flexible cable 7.
- the calipers 5 (shown below in greater detail) include an ultra-sound-generating transducer 9 and an ultrasound-receiving transducer 11, placed so as to face one another and separated by a manually adjustable distance D.
- the calipers 5 are equipped with a linear position transducer, specifically a potentiometer (shown in detail below), designed to detect the value of distance D and to transmit the value thus detected to the central unit 3.
- the calipers 5 are also equipped with a button 13 (FREEZE) which, when pressed, is designed to send to the central unit 3 a command to temporarily memorize the signals arriving from the calipers 5.
- FREEZE button 13
- the electronic central unit 3 includes a signal-generating circuit (not shown), designed to provide transducer 9 with a sequence of simple pulses (having a frequency, for example, ranging from 1 to 1.25 MHz) and a signal-receiving circuit (not shown) designed to receive the pulses received from the transducer 11.
- the electronic central unit 3 also includes a microprocessor computer circuit 15 designed to process the signals picked up from the receiver circuit (not shown).
- the central unit 3 is equipped with a display device 17, appropriately consisting of a monochrome screen which is designed to display to a system user (not shown), by means that will be clarified below, the measurements calculated by the circuit 15.
- the central unit 3 is further equipped with four manually operable function keys, F1, F2, F3 and F4, which operate in conjunction with the circuit 15 for the selection of the functions performed by the system 1.
- the number 5 indicates, overall, the ultrasonic calipers 5 which comprise a first external tubular body 20, telescopically connected to a second internal tubular body 21.
- This body 21 is coaxial with body 20 and slides, with respect to the latter, along an axis 22.
- the first tubular body 20 has a first threaded free end 20a, from which extends a first radial attachment 23, which includes a portion of a rectangular base 23a equipped with a threaded through hole 24 engaged by end 20a and a rectilinear portion 23b which extends radially from a portion of the base 23a.
- the rectilinear piece 23b also has at one of its free ends a through hole, 25, which houses the transducer 11.
- the second tubular body 21 extends for a certain distance beyond body 20 and terminates with a portion of end 21a that carries a second radial attachment 26, placed so as to face the first attachment 23 and including a portion of rectangular base 26a joined to end 21a and a rectilinear piece 26b that extends radially from the portion of base 26a.
- the rectilinear portion 26b has at one of its free ends a through hole, 27, which houses the ultrasound transducer 9 placed facing transducer 11 at a distance D from the latter.
- the first and second attachments 23 and 26 have respectively a dead hole 28 and a through hole 29 placed in the vicinity of holes 25 and 27 respectively. Holes 28 and 29 are also close to a rectilinear border 23c, 26c of the attachment (Fig. 5a).
- Hole 28 houses a portion of the end of a cylindrical rod 30 that extends between the first and the second attachments 23, 26, parallel to axis 22 and sliding through hole 29.
- Rod 30 constitutes a element of verification that permits the correct positioning (by means to be clarified hereunder) of a portion of the human body, in particular a finger, with respect to attachments 23, 26 and to transducers 9, 11.
- Hole 29 is so located that, when a finger is placed in the calipers with a part lying on rod 30, the bony portion of the finger is centered between transducers 9 and 11.
- the calipers 5 are further equipped with a manual device 31 with which to set the distance D between the transducers 9 and 11.
- Device 31 includes a rectangular plate 32 characterized by a first free end 32a, permanently affixed to a portion of the base 26a by four screws 33, and a second free end 32b seated in a rectangular groove 34 made in the base portion 23a.
- the plate 32 has a slightly curved shape and presses on the bottom portion (not shown) of groove 34.
- the plate 32 is also equipped with a toothed middle part 32c.
- the calipers 5 are equipped with a tube 35 carried on body 20 and extending along an axis 36 parallel to axis 22.
- tube 35 is characterized by a first portion of end 35a carried on a radial flange 37 which is joined to a second end 20b of tubular body 20 and an intermediate portion that passes through a hole 38 realized in attachment 23 and coaxial with axis 36.
- the tube 35 also has a second portion of its end 35b in close proximity to portion 21a of body 21 and terminating with an opening plugged by a perforated stopper 39.
- end 35b is also designed to pass through a hole 40 made in attachment 26 and coaxial with axis 36.
- Tube 35 has at one end a base 41 from which issues a first cable 42 that extends inside tube 35 for the entire length of the aforesaid tube and passes through stopper 39, whence it arrives at transducer 9 after making an elbow bend (Figure 5b).
- Tube 35 also carries a second cable 43 which extends from base 41 to a through hole 44 in tube 35, through which cable 43 exits from the above tube 35 to reach transducer 11.
- Tube 35 also carries button 13, which is connected to base 41 by a cable (not shown) housed in tube 35.
- a connector 45 is also screwed onto base 41, from which exits cable 7.
- the calipers 5 are further equipped with a linear potentiometer 46 housed within the tubular bodies 20 and 21 and designed to detect the relative position of these bodies.
- potentiometer 46 comprises an external tubular case 47 coaxially housed in tubular body 20 and comprising a resistor (not shown) along which runs a slider (not shown) connected to a first end (not shown) of a shaft 48, coaxial with axis 22 and presenting a second end screwed to a stopper 49 which closes the end portion 21a of tubular body 21.
- the potentiometer 46 has an exit cable 50 that leaves the tubular body by way of a through hole 51 and penetrates tube 35 through a hole 52 in proximity to hole 51 and reaches base 41.
- the calipers 5 are further equipped with an elastic element 53 placed between tubes 20 and 21 and consisting of a helical extension spring housed coaxially in tube 21 and having portions of its ends 53a and 53b connected respectively to stopper 49 and to a portion of the end of tubular body 47.
- This elastic element 53 is designed to generate a force tending to move attachments 23 and 26 closer together.
- spring 53 has a rigidity of approximately 400 newton/meter (or ranging from 300 to 500 newton/meter).
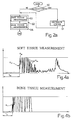
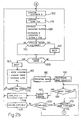
- Figure 2a specifically illustrates a flow chart of the operations performed by the electronic central unit 3.
- the initial stage leads to a block 90 which asks - and this question is displayed on the screen 17 - whether the user wishes to calibrate the system or proceed instead to a measuring session.
- block 91 which activates the process of calibrating the system in the known manner. Otherwise it leads to a block 92 which performs a set of operations designed to measure the density and structure of bone. Once the calibration process is completed, block 91 leads to block 92.
- Block 92 includes a first block 93 (MEASURE SOFT TISSUE - described in detail hereunder), in which a set of measurements is performed on a portion of soft tissue of the human body, and a block 94 (MEASURE BONE TISSUE - described in detail hereunder), which follows block 93 and commands a set of measurements on a portion of bone tissue of the human body.
- a first block 93 MEASURE SOFT TISSUE - described in detail hereunder
- a block 94 MEASURE BONE TISSUE - described in detail hereunder
- attachments 23 and 26 are separated from one another by manually operating device 31 and the elastic element 53 is wound up.
- a portion of soft tissue of the human body is then placed between transducers 9 and 11; specifically, the interphalangeal space between the first and second finger of the hand (first intermetacarpal space), device 31 is released and attachments 23 and 26, propelled by the elastic element 53, come to rest against the portion of soft tissue with transducers 9 and 11 in contact with the skin 8 (with the possible interposition of gel).
- the attachments 23 and 26 are separated from one another by manually operating device 31 and the elastic element 53 is wound up.
- a proximal phalanx of the last four fingers of the hand is then placed between the transducers 9, 11 with the back of said phalanx resting on rod 30. In this position the transducers 9 and 11 are positioned in the metaphyseal area in contact with the condyles.
- the thickness of the bone tissue in this phalanx is predominant with respect to the thickness of the skin (soft tissue). For this reason, that portion of skin will be overlooked in the following description, since it is automatically taken into account by the measurement system 1.
- the positioning of the finger in the manner described above permits the correct positioning of the bone tissue in relation to the transducers 9 and 11 for all measurements performed.
- block 93 (SOFT TISSUE MEASUREMENT) includes a block 100 that automatically logs the distance D between the transducers 9 and 11.
- Block 100 is followed by a block 110, in which the time Ttm elapsed between the generation of an impulse and the receiving of that impulse by transducer 11 is detected; block 110 therefore detects the time Ttm taken by the ultrasound signals to pass from transducer 9 to transducer 11 and through the portion of soft tissue lying between transducers 9 and 11.
- Block 110 is followed by a block 120 in which the previously processed information is commanded to be displayed on the screen 17; specifically, block 120 commands the screen display of the value of distance D (THICKNESS) expressed in millimeters, the velocity of the ultrasound signal in the soft tissues (VELOCITY) expressed in meters per second, and the wave form of the ultrasound signal received by transducer 11.
- distance D TICKNESS
- VELOCITY the velocity of the ultrasound signal in the soft tissues
- this figure illustrates an example of a Cartesian graph, displayed on the screen 17, of the wave form of the ultrasound signal received by transducer 11 and processed by the processor 15, in which the y -axis shows the amplitude of the signal received, and the x -axis shows the time scale.
- the received signal includes multiple successive peaks Ptm, of which the first peak to reach a reference amplitude is used to calculate the time Ttm and the subsequent peaks are due to the reflections of the impulse through the walls of the soft tissue.
- D a reference value corresponding to an optimum distance for measurement
- Block 150 awaits a command for the temporary memorization of the image displayed on the screen 17; if this command is not given, block 150 leads back to block 100, otherwise (button 13 pressed) it leads to a block 160 which commands the emission of an acoustic signal (BEEP).
- Block 160 is followed by a block 165 that implements the temporary memorization of the wave form displayed on the screen 17, corresponding to the signal received from transducer 11.
- the data relating to the on/off state of the points (pixels) that form the image displayed on the screen are memorized in a transitional memory (BUFFER) (not shown) and the image of the wave form is thus "frozen" (FREEZE).
- BAFFER transitional memory
- Block 165 further commands the display on the screen of a vertical marker line Rtm ( Figure 4a) placed in a position corresponding to the first predetermined amplitude peak of the signal displayed on the screen 17.
- the distance Ttm of this line Rtm from the origin of the time scale therefore represents the time required by the ultrasound signal to pass-through the soft tissue.
- Block 165 is followed by a block 170 which awaits a command confirming memorization of the data related to the "frozen" wave form; if the operator wishes to request this permanent memorization, he presses function key F1 (confirm data) and block 170 then leads to a block 180 which executes the permanent memorization of the data. Otherwise the operator again presses button 13, the contents of the buffer are deleted and block 170 leads back to block 100.
- Block 180 permanently memorizes, for example in a RAM memory (not shown), the velocity of the ultrasound signal in soft tissue, the distance D and the wave form logged in the preceding measurement.
- Block 180 is followed by a block 195 which calculates the mean Vm of the velocities memorized from previous measurements.
- Block 195 is followed by a block 196 which awaits a command to reset the data currently logged; if the operator wishes to reset the data, he presses function key F2 (reset data) and block 196 then leads to a block 197. Otherwise (confirm data), block 196 is followed by a block 210.
- Block 197 performs the total deletion of the data logged (RESET MEMORY) and is followed by a block 198.
- Block 210 asks, and this query is displayed on the screen 17, whether the operator wishes to take another measurement of soft tissue. If so, the operator presses function key F2 (soft tissue) and block 210 then leads to a block 220; otherwise the operator presses function key F3 (bone tissue) and block 210 leads back to block 94.
- function key F2 soft tissue
- F3 bone tissue
- a pre-defined value for example three
- block 180 memorizes, in memory addresses distinct from RAM memory, the velocity values V1, V2 and V3 detected in successive measurements, and block 195 calculates the mean Vm of the velocities (V1, V2, V3) memorized in successive measurements.
- block 94 includes block 250 which performs the automatic gathering of data relating to the distance D between the transducers 9 and 11.
- Block 250 is followed by a block 280, in which the time Tto elapsed between the generation of an impulse and the detection of the first predetermined amplitude peak of the impulse received by transducer 11 is detected.
- Block 280 thus detects the time Tto required by the ultrasound signal to move from transducer 9 to transducer 11 and to pass through the portion of bone tissue lying between transducers 9 and 11.
- Block 290 commands the display on the screen 17 of the information previously processed; in particular, block 290 commands the screen display of the value of distance D (THICKNESS) expressed in millimeters, the velocity of the ultrasound signal in the bone tissues (VELOCITY) expressed in meters per second, and the wave form of the ultrasound signal transmitted through the bone tissue and detected by transducer 11.
- TICKNESS the value of distance D
- VELOCITY velocity of the ultrasound signal in the bone tissues
- this figure illustrates an example of a Cartesian graph of the wave form of the received ultrasound signal, in which the y -axis shows the amplitude of the signal received, and the x -axis shows the time scale.
- Block 290 is followed by a block 300 that awaits a command for the temporary memorization of the image on the screen 17; if this command is not given, block 300 leads back to block 250, otherwise ("FREEZE" key pressed) it leads to a block 310 which commands the emission of an acoustic signal (BEEP).
- Block 310 is followed by a block 311 that implements the memorization of the wave form displayed on the screen 17. Specifically, the data relating to the on/off state of the points (pixels) that constitute the wave form in the image displayed on the screen are memorized in a transitional memory (BUFFER) (not shown) and the image of the wave form is thus "frozen” (FREEZE).
- BEEP acoustic signal
- Block 311 also commands the display on the screen of a vertical marker line Rto ( Figure 4b) placed in a position corresponding to the first amplitude peak displayed on the screen.
- the distance Tto of this line Rto from the origin of the time scale therefore represents the time required by the ultrasound signal to pass through the bone tissue.
- Block 311 is followed by a block 312 in which the mode of signal detection is selected.
- an automatic signal-detection mode (AUTOMATIC TRIGGER) (block 312a) is automatically selected.
- AUTOMATIC TRIGGER automatic signal-detection mode
- this mode of selection any received signal that displays on screen 17 a reference amplitude greater than a pre-established number of dots (pixels), for example 32 pixels, is recognized as the first significant peak.
- Block 312 it is possible to manually select a block 314 that commands a substantially manual mode of detection (MANUAL TRIGGER) in which any received signal that displays on screen 17 a reference amplitude greater than a manually set number of pixels is recognized as the first peak.
- Block 314 includes a first block 314a that commands the manual selection of the reference amplitude and a block 314b that commands the re-positioning of the vertical marker line Rto placed in a position corresponding to the detected peak on the basis of the previously established reference amplitude.
- Blocks 314 and 312a are followed by a block 315 in which the operator is asked if he wishes to retrieve the data relating to the soft tissues; in the affirmative case, block 315 leads to a block 330; otherwise it leads to block 341.
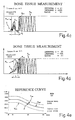
- Block 330 displays on the screen ( Figure 4c) the wave form of the ultrasound signal S transmitted through the bone tissue and the line Rtm, both previously memorized.
- Block 330 is followed by a block 331 in which the pressing of function key F3 (bone tissue) is awaited.
- Block 331 is followed by a block 332 which displays on the screen ( Figure 4c) the wave form of the ultrasound signal S transmitted through the bone tissue, line Rto and line Rtm. Since the velocity of the ultrasound passing through soft tissue is always less than its velocity through bone tissue, line Rtm is farther from the origin of the time scale than line Rto.
- the portion of the signal S shown on the screen 17 and included in the interval between lines Rto and Rtm therefore represents the ultrasound signal received after passing through the bone tissue.
- Marker lines Rto and Rtm provide for defining on the signal on screen 17 the limits of an "observation window" containing signal portion S.
- block 332 calculates the integral of the signal S shown on the screen 17 in the interval I that falls between lines Rto and Rtm, and displays the value of that integral and of interval I on the screen.
- Block 332 also calculates and shows on the screen 17 the ratio between the value of the integral and the amplitude of the interval I.
- Block 332 then leads back to block 312.
- block 341 the operator is asked if he wishes to print the data shown on the screen 17; if so, the operator presses function key F2, in which case block 341 leads to a block 342; otherwise it leads to a block 343.
- Block 342 commands the printing of the data currently shown on the screen 17; block 342 is then followed by block 312.
- Block 343 awaits a command confirming the permanent memorization of the data relating to the wave form shown on the screen 17. If the operator wishes to perform this permanent memorization, he presses function key F1 (confirm data), and block 343 leads to a block 344; otherwise the operator once again presses button 13 (data not confirmed) and block 343 leads back to block 312.
- a pre-defined threshold for example four
- Block 346 performs the permanent memorization, for example in a RAM memory (not shown), of the set of data shown by blocks 330 and 332, that is the velocity of the ultrasound signals in bone tissue and in soft tissue, the distance D, the size of interval I, the value of the integral, the ratio between the integral and the interval I and the wave form of the signal transmitted through the bone tissue.
- Block 345 commands an acoustic signal (BEEP) and is also followed by block 350.
- BEEP acoustic signal
- Block 350 asks, and this query is displayed on the screen 17, whether the operator wishes to take another measurement of bone tissue. If so, the operator presses function key F3 (another bone tissue measurement) and block 350 then leads back to block 250; otherwise (end of measurement) the operator presses function key F2 and block 350 leads to a block 370.
- function key F3 another bone tissue measurement
- block 350 then leads back to block 250; otherwise (end of measurement) the operator presses function key F2 and block 350 leads to a block 370.
- the data shown on the screen 17, from blocks 330 through 332, make it possible to immediately and accurately evaluate the condition of the analyzed bone tissue and to highlight possible pathologies of that bone tissue.
- Figure 4c shows a typical signal S curve detected in a "healthy" bone, not affected by pathological conditions of any kind.
- the velocity observed through the bone tissue is equal to 2214 meters per second, the breadth of the interval I (measured during presentation of soft tissue) is 57 pixels, the value of the integral is 3295 and the ratio between the integral and the interval I is 57.
- Lines Rto and Rtm mark off a portion of the signal in which multiple Pto peaks (bone tissue peaks) are present, exhibiting a smaller amplitude than the Ptm peaks (soft tissue peaks) that follow line Rtm.
- Figure 4d shows a typical signal S curve detected in a "pathological" bone suffering from osteoporosis.
- the velocity observed through the bone tissue is equal to 1800 meters per second (considerably lower than that observed in healthy bone tissue), the breadth of the interval I (measured during presentation of soft tissue) is 35 pixels, the value of the integral is 953 and the ratio between the integral and the interval I is 27.
- Block 370 performs a statistical analysis of the data observed and is followed by a block 400 in which the operator is asked whether he wishes to perform a new cycle of measurements. If the answer is affirmative, block 400 leads back to block 100, after having reset all the data memorized in a block 410. Otherwise the program exits.
- Figure 3 shows a detail of block 370 which performs the statistical analysis on the data detected during the previous measurements.
- Block 370 comprises an initial block 371, which enters the age of the subject on whom the measurement is being performed, and a second block 372 in which the data measured for the subject, as a function of age, are compared with previously memorized statistical data.
- Block 373 is followed by a block 374 that awaits a command to increase by one unit the current value of YRS; if the operator wishes to increase the YRS value he presses function key F1 and block 374 leads to a block 374a. Otherwise he presses no key and block 374 leads to block 375.
- Block 375 awaits a command to decrease the current value of YRS by one unit; if the operator wishes to decrease the YRS value he presses function key F2 and block 375 leads to a block 375a. Otherwise he presses no key and block 375 leads to a block 376.
- Block 376 awaits a command to confirm the current YRS value; if the operator wishes to confirm this age value he presses function key F3, and block 376 leads to block 372. Otherwise the operator presses function key F4 and block 376 leads back to block 374.
- Block 372 comprises a first block 377 in which multiple previously memorized data are recalled. These data express a graph which shows the curve of the velocity of transmission of the ultrasound signals through bone tissue as a function of age.
- block 377 commands a Cartesian graph in which increasing age values (from 35 to 80 years) are indicated on the x -axis and velocity values are indicated on the y -axis (expressed in meters per second).
- the graph includes a first curve Vmax which represents the trend, as a function of age, of the maximum velocity values observed in a reference population, a second curve Vmin that represents, as a function of age, the trend of the minimum velocity values observed in the reference population, and a third curve Vmed that represents the trend, as a function of age, of the mean velocity values observed in the reference population.
- Block 377 is followed by a block 378 in which a velocity value for bone tissue measured in block 94 is recalled; this value is shown as a point: P on the Cartesian plane as a function of the age set in block 371.
- Block 378 is further followed by a block 379 in which the operator is asked if he wishes to print the statistical data thus processed and displayed on the screen 17; if the answer is affirmative, block 379 leads to a block 379a that commands a printer (not shown) connected to the central unit 3; otherwise it leads directly to block 400.
- This system in fact makes it possible to calculate and display not only the velocity of ultrasound signals in bone tissue, but also the velocity of ultrasound in soft tissue, and also permits the joint display of these data (blocks 330 and 332), thus providing the user of the system with images of the sort described above and illustrated in Figures 4c and 4d.
- the statistical analysis commanded in block 370 permits a rapid and immediate comparison of the observed data with the reference data.
- transducers 9 and 11 could have a different placement from that illustrated in Figure 5a: for example, transducers 9 and 11 could be placed side by side and carried on the same attachment or integrated in a single case.
Landscapes
- Health & Medical Sciences (AREA)
- Life Sciences & Earth Sciences (AREA)
- Physics & Mathematics (AREA)
- General Physics & Mathematics (AREA)
- Engineering & Computer Science (AREA)
- Medical Informatics (AREA)
- Biophysics (AREA)
- Nuclear Medicine, Radiotherapy & Molecular Imaging (AREA)
- Pathology (AREA)
- Radiology & Medical Imaging (AREA)
- Orthopedic Medicine & Surgery (AREA)
- Biomedical Technology (AREA)
- Heart & Thoracic Surgery (AREA)
- Rheumatology (AREA)
- Molecular Biology (AREA)
- Surgery (AREA)
- Animal Behavior & Ethology (AREA)
- General Health & Medical Sciences (AREA)
- Public Health (AREA)
- Veterinary Medicine (AREA)
- Ultra Sonic Daignosis Equipment (AREA)
- Investigating Or Analyzing Materials By The Use Of Ultrasonic Waves (AREA)
- Length Measuring Devices Characterised By Use Of Acoustic Means (AREA)
Description
- This invention refers to an ultrasonic measurement system for determining the density and structure of bone.
- There are known electronic systems for determining bone density, equipped with a first ultrasonic transducer designed to send multiple impulses into a body segment under examination (for example, a finger) and a second transducer designed to detect the impulses that actually pass through that body segment.
- The known systems are further equipped with computer circuits that calculate the time elapsing between the emission of the impulse by the first transducer and its detection, and which calculate, on the basis of the known distance between the transducers, the velocity with which the ultrasounds pass through the body segment under examination. Examples of known systems for determining bone density may be found in PCT WO 87/07494 and GB-A-2.257.253
- The transmission velocity of the ultrasound signal is strongly influenced by the characteristics of the bone tissue placed between the transducers and varies with the variations in bone structure and density.
- The known systems therefore compare the value of the measured velocity with a reference value, for the purpose of detecting a variation in the structure and density of the bone, which normally indicates decalcification of the bone tissue (caused, for example, by osteoporosis).
- Comparison between the measured value and the reference value is not always adequate to permit an accurate examination, because the velocity with which the ultrasounds are transmitted through the tissue varies strongly from one subject to another or in a single subject if the measurement sites cannot be located repeatedly with great accuracy.
- For this reason, the known systems do not permit an accurate or, especially, a reproducible examination.
- The purpose of this invention is to create an ultrasonic measurement system for the determination of the density and structure of bone that will overcome the drawbacks of the known systems.
- This purpose is fulfilled by the present invention, in that it pertains to a system such as the one described in
claim 1. - The invention will now be illustrated with specific reference to the attached drawings, which represent a preferred, but not exclusive, form of realization, in which:
- Figure 1 illustrates an ultrasonic measurement system for the determination of the density and structure of bone;
- Figures 2a, 2b, and 2c are flow charts showing the function of the system illustrated in Figure 1 broken down into logical blocks;
- Figure 3 details a single block of the flow chart illustrated in Figure 2C;
- Figures 4a, 4b, 4c, 4d and 4e show some images displayed by the system represented by the present invention; and
- Figures 5a and 5b illustrate ultrasonic calipers used in the system represented by the present invention.
-
- In Figure 1, the
number 1 indicates, in its entirety, an ultrasonic measurement system for the determination of the density and structure of bone, in which an electroniccentral unit 3 is connected toultrasonic calipers 5 by aflexible cable 7. The calipers 5 (shown below in greater detail) include an ultra-sound-generatingtransducer 9 and an ultrasound-receivingtransducer 11, placed so as to face one another and separated by a manually adjustable distance D. Thecalipers 5 are equipped with a linear position transducer, specifically a potentiometer (shown in detail below), designed to detect the value of distance D and to transmit the value thus detected to thecentral unit 3. Thecalipers 5 are also equipped with a button 13 (FREEZE) which, when pressed, is designed to send to the central unit 3 a command to temporarily memorize the signals arriving from thecalipers 5. - The electronic
central unit 3 includes a signal-generating circuit (not shown), designed to providetransducer 9 with a sequence of simple pulses (having a frequency, for example, ranging from 1 to 1.25 MHz) and a signal-receiving circuit (not shown) designed to receive the pulses received from thetransducer 11. The electroniccentral unit 3 also includes amicroprocessor computer circuit 15 designed to process the signals picked up from the receiver circuit (not shown). - The
central unit 3 is equipped with adisplay device 17, appropriately consisting of a monochrome screen which is designed to display to a system user (not shown), by means that will be clarified below, the measurements calculated by thecircuit 15. Thecentral unit 3 is further equipped with four manually operable function keys, F1, F2, F3 and F4, which operate in conjunction with thecircuit 15 for the selection of the functions performed by thesystem 1. - With reference to figures 5a and 5b, the
number 5 indicates, overall, theultrasonic calipers 5 which comprise a first externaltubular body 20, telescopically connected to a second internaltubular body 21. Thisbody 21 is coaxial withbody 20 and slides, with respect to the latter, along anaxis 22. - The first
tubular body 20 has a first threadedfree end 20a, from which extends a firstradial attachment 23, which includes a portion of arectangular base 23a equipped with a threaded throughhole 24 engaged byend 20a and arectilinear portion 23b which extends radially from a portion of thebase 23a. Therectilinear piece 23b, also has at one of its free ends a through hole, 25, which houses thetransducer 11. - The second
tubular body 21 extends for a certain distance beyondbody 20 and terminates with a portion ofend 21a that carries a secondradial attachment 26, placed so as to face thefirst attachment 23 and including a portion ofrectangular base 26a joined toend 21a and arectilinear piece 26b that extends radially from the portion ofbase 26a. Therectilinear portion 26b has at one of its free ends a through hole, 27, which houses theultrasound transducer 9 placed facingtransducer 11 at a distance D from the latter. - The first and
second attachments dead hole 28 and a throughhole 29 placed in the vicinity ofholes Holes rectilinear border 23c, 26c of the attachment (Fig. 5a). -
Hole 28 houses a portion of the end of acylindrical rod 30 that extends between the first and thesecond attachments axis 22 and sliding throughhole 29. -
Rod 30 constitutes a element of verification that permits the correct positioning (by means to be clarified hereunder) of a portion of the human body, in particular a finger, with respect toattachments -
Hole 29 is so located that, when a finger is placed in the calipers with a part lying onrod 30, the bony portion of the finger is centered betweentransducers - The
calipers 5 are further equipped with amanual device 31 with which to set the distance D between thetransducers -
Device 31 includes arectangular plate 32 characterized by a firstfree end 32a, permanently affixed to a portion of thebase 26a by fourscrews 33, and a secondfree end 32b seated in arectangular groove 34 made in thebase portion 23a. Theplate 32 has a slightly curved shape and presses on the bottom portion (not shown) ofgroove 34. - The
plate 32 is also equipped with atoothed middle part 32c. Thecalipers 5 are equipped with atube 35 carried onbody 20 and extending along anaxis 36 parallel toaxis 22. In particular,tube 35 is characterized by a first portion ofend 35a carried on aradial flange 37 which is joined to asecond end 20b oftubular body 20 and an intermediate portion that passes through ahole 38 realized inattachment 23 and coaxial withaxis 36. Thetube 35 also has a second portion of itsend 35b in close proximity toportion 21a ofbody 21 and terminating with an opening plugged by aperforated stopper 39. - The portion of
end 35b is also designed to pass through ahole 40 made inattachment 26 and coaxial withaxis 36. - Tube 35 has at one end a
base 41 from which issues afirst cable 42 that extends insidetube 35 for the entire length of the aforesaid tube and passes throughstopper 39, whence it arrives attransducer 9 after making an elbow bend (Figure 5b). - Tube 35 also carries a
second cable 43 which extends frombase 41 to a throughhole 44 intube 35, through whichcable 43 exits from theabove tube 35 to reachtransducer 11. Tube 35 also carriesbutton 13, which is connected tobase 41 by a cable (not shown) housed intube 35. - A
connector 45 is also screwed ontobase 41, from which exitscable 7. - The
calipers 5 are further equipped with alinear potentiometer 46 housed within thetubular bodies potentiometer 46 comprises an externaltubular case 47 coaxially housed intubular body 20 and comprising a resistor (not shown) along which runs a slider (not shown) connected to a first end (not shown) of ashaft 48, coaxial withaxis 22 and presenting a second end screwed to astopper 49 which closes theend portion 21a oftubular body 21. - The
potentiometer 46 has anexit cable 50 that leaves the tubular body by way of a throughhole 51 and penetratestube 35 through ahole 52 in proximity tohole 51 and reachesbase 41. - The
calipers 5 are further equipped with anelastic element 53 placed betweentubes tube 21 and having portions of itsends tubular body 47. - This
elastic element 53 is designed to generate a force tending to moveattachments spring 53 has a rigidity of approximately 400 newton/meter (or ranging from 300 to 500 newton/meter). - Figure 2a specifically illustrates a flow chart of the operations performed by the electronic
central unit 3. - The initial stage leads to a
block 90 which asks - and this question is displayed on the screen 17 - whether the user wishes to calibrate the system or proceed instead to a measuring session. - In the former case, the next step leads to a
block 91 which activates the process of calibrating the system in the known manner. Otherwise it leads to ablock 92 which performs a set of operations designed to measure the density and structure of bone. Once the calibration process is completed,block 91 leads toblock 92. -
Block 92 includes a first block 93 (MEASURE SOFT TISSUE - described in detail hereunder), in which a set of measurements is performed on a portion of soft tissue of the human body, and a block 94 (MEASURE BONE TISSUE - described in detail hereunder), which followsblock 93 and commands a set of measurements on a portion of bone tissue of the human body. - Specifically, in order to take the measurements illustrated in
block 93,attachments operating device 31 and theelastic element 53 is wound up. - A portion of soft tissue of the human body is then placed between
transducers device 31 is released andattachments elastic element 53, come to rest against the portion of soft tissue withtransducers - In order to take the measurements diagrammed in
block 94, theattachments operating device 31 and theelastic element 53 is wound up. - A proximal phalanx of the last four fingers of the hand is then placed between the
transducers rod 30. In this position thetransducers - The thickness of the bone tissue in this phalanx is predominant with respect to the thickness of the skin (soft tissue). For this reason, that portion of skin will be overlooked in the following description, since it is automatically taken into account by the
measurement system 1. -
Device 31 is released, andattachments elastic element 53, come to rest against opposite sides of the finger with thetransducers calipers 5 since it cannot move sideways owing to the impediment created byattachments calipers 5 cannot move downward, toward the palmar side of the hand because of the obstacle constituted by therod 30. Nor can thecalipers 5 move distally toward the second phalanx due to the anatomic impediment constituted by the condyles of the phalanges. - The positioning of the finger in the manner described above permits the correct positioning of the bone tissue in relation to the
transducers - With specific reference to Figure 2b, block 93 (SOFT TISSUE MEASUREMENT) includes a
block 100 that automatically logs the distance D between thetransducers -
Block 100 is followed by ablock 110, in which the time Ttm elapsed between the generation of an impulse and the receiving of that impulse bytransducer 11 is detected; block 110 therefore detects the time Ttm taken by the ultrasound signals to pass fromtransducer 9 totransducer 11 and through the portion of soft tissue lying betweentransducers - Block 110 also calculates the velocity Vtm of the ultrasounds in the soft tissue as Vtm=D/Ttm.
-
Block 110 is followed by ablock 120 in which the previously processed information is commanded to be displayed on thescreen 17; specifically, block 120 commands the screen display of the value of distance D (THICKNESS) expressed in millimeters, the velocity of the ultrasound signal in the soft tissues (VELOCITY) expressed in meters per second, and the wave form of the ultrasound signal received bytransducer 11. - With specific reference to Figure 4a, this figure illustrates an example of a Cartesian graph, displayed on the
screen 17, of the wave form of the ultrasound signal received bytransducer 11 and processed by theprocessor 15, in which the y-axis shows the amplitude of the signal received, and the x-axis shows the time scale. The received signal includes multiple successive peaks Ptm, of which the first peak to reach a reference amplitude is used to calculate the time Ttm and the subsequent peaks are due to the reflections of the impulse through the walls of the soft tissue. -
Block 120 is followed by ablock 130, in which the current value of distance D is compared with a reference value Dthreshold corresponding to an optimum distance for measurement; if the distance D corresponds to the threshold (D= Dthreshold), the flow chart leads fromblock 130 to ablock 140 that commands the emission of an acoustic signal (BEEP) to denote the attainment of the optimum distance. If distance D does not correspond to the threshold, block 130 leads directly to block 150, which is in any case the point of arrival afterblock 140. -
Block 150 awaits a command for the temporary memorization of the image displayed on thescreen 17; if this command is not given, block 150 leads back to block 100, otherwise (button 13 pressed) it leads to ablock 160 which commands the emission of an acoustic signal (BEEP).Block 160 is followed by ablock 165 that implements the temporary memorization of the wave form displayed on thescreen 17, corresponding to the signal received fromtransducer 11. Specifically, the data relating to the on/off state of the points (pixels) that form the image displayed on the screen are memorized in a transitional memory (BUFFER) (not shown) and the image of the wave form is thus "frozen" (FREEZE). -
Block 165 further commands the display on the screen of a vertical marker line Rtm (Figure 4a) placed in a position corresponding to the first predetermined amplitude peak of the signal displayed on thescreen 17. The distance Ttm of this line Rtm from the origin of the time scale therefore represents the time required by the ultrasound signal to pass-through the soft tissue. -
Block 165 is followed by ablock 170 which awaits a command confirming memorization of the data related to the "frozen" wave form; if the operator wishes to request this permanent memorization, he presses function key F1 (confirm data) and block 170 then leads to ablock 180 which executes the permanent memorization of the data. Otherwise the operator again pressesbutton 13, the contents of the buffer are deleted and block 170 leads back to block 100. -
Block 180 permanently memorizes, for example in a RAM memory (not shown), the velocity of the ultrasound signal in soft tissue, the distance D and the wave form logged in the preceding measurement. -
Block 180 is followed by ablock 195 which calculates the mean Vm of the velocities memorized from previous measurements. -
Block 195 is followed by ablock 196 which awaits a command to reset the data currently logged; if the operator wishes to reset the data, he presses function key F2 (reset data) and block 196 then leads to ablock 197. Otherwise (confirm data), block 196 is followed by ablock 210. -
Block 197 performs the total deletion of the data logged (RESET MEMORY) and is followed by ablock 198. -
Block 198 re-initializes the counter CNT1_MIS, that is (CNT1_MIS=1); block 198 then leads back to block 100. -
Block 210 asks, and this query is displayed on thescreen 17, whether the operator wishes to take another measurement of soft tissue. If so, the operator presses function key F2 (soft tissue) and block 210 then leads to ablock 220; otherwise the operator presses function key F3 (bone tissue) and block 210 leads back to block 94. - In
block 220, the contents of counter CNT1_MIS are compared with a pre-defined value, for example three; if the value of the counter is equal to the predefined value (CNT1_MIS=pre-defined value), block 220 leads back to block 196. Otherwise it leads to ablock 230. -
Block 230 increases the contents of counter CNT1_MIS by one unit, using the logical operation CNT1_M-IS=CNT1_MIS+ 1; and the chart returns fromblock 230 to block 100. It is thus possible to perform multiple measurements on soft tissue, up to the threshold value of the counter CNT1_MIS, and to gather a corresponding number of data sets (distance D, velocity V, wave form) that are memorized in succession atblock 180. - Specifically, block 180 memorizes, in memory addresses distinct from RAM memory, the velocity values V1, V2 and V3 detected in successive measurements, and block 195 calculates the mean Vm of the velocities (V1, V2, V3) memorized in successive measurements.
- With specific reference to Figure 2c, block 94 includes
block 250 which performs the automatic gathering of data relating to the distance D between thetransducers -
Block 250 is followed by a block 280, in which the time Tto elapsed between the generation of an impulse and the detection of the first predetermined amplitude peak of the impulse received bytransducer 11 is detected. Block 280 thus detects the time Tto required by the ultrasound signal to move fromtransducer 9 totransducer 11 and to pass through the portion of bone tissue lying betweentransducers - Block 280 is followed by a
block 290 that calculates the velocity Vto of the ultrasounds in bone tissue as Vto=D/Tto.Block 290 commands the display on thescreen 17 of the information previously processed; in particular, block 290 commands the screen display of the value of distance D (THICKNESS) expressed in millimeters, the velocity of the ultrasound signal in the bone tissues (VELOCITY) expressed in meters per second, and the wave form of the ultrasound signal transmitted through the bone tissue and detected bytransducer 11. - With specific reference to Figure 4b, this figure illustrates an example of a Cartesian graph of the wave form of the received ultrasound signal, in which the y-axis shows the amplitude of the signal received, and the x-axis shows the time scale.
-
Block 290 is followed by ablock 300 that awaits a command for the temporary memorization of the image on thescreen 17; if this command is not given, block 300 leads back to block 250, otherwise ("FREEZE" key pressed) it leads to ablock 310 which commands the emission of an acoustic signal (BEEP).Block 310 is followed by ablock 311 that implements the memorization of the wave form displayed on thescreen 17. Specifically, the data relating to the on/off state of the points (pixels) that constitute the wave form in the image displayed on the screen are memorized in a transitional memory (BUFFER) (not shown) and the image of the wave form is thus "frozen" (FREEZE). -
Block 311 also commands the display on the screen of a vertical marker line Rto (Figure 4b) placed in a position corresponding to the first amplitude peak displayed on the screen. The distance Tto of this line Rto from the origin of the time scale therefore represents the time required by the ultrasound signal to pass through the bone tissue. -
Block 311 is followed by ablock 312 in which the mode of signal detection is selected. - In
block 312, an automatic signal-detection mode (AUTOMATIC TRIGGER) (block 312a) is automatically selected. In this mode of selection any received signal that displays on screen 17 a reference amplitude greater than a pre-established number of dots (pixels), for example 32 pixels, is recognized as the first significant peak. - In addition, at
block 312 it is possible to manually select ablock 314 that commands a substantially manual mode of detection (MANUAL TRIGGER) in which any received signal that displays on screen 17 a reference amplitude greater than a manually set number of pixels is recognized as the first peak.Block 314 includes afirst block 314a that commands the manual selection of the reference amplitude and ablock 314b that commands the re-positioning of the vertical marker line Rto placed in a position corresponding to the detected peak on the basis of the previously established reference amplitude. -
Blocks 314 and 312a are followed by ablock 315 in which the operator is asked if he wishes to retrieve the data relating to the soft tissues; in the affirmative case, block 315 leads to ablock 330; otherwise it leads to block 341. - Block 330 displays on the screen (Figure 4c) the wave form of the ultrasound signal S transmitted through the bone tissue and the line Rtm, both previously memorized.
-
Block 330 is followed by ablock 331 in which the pressing of function key F3 (bone tissue) is awaited. -
Block 331 is followed by ablock 332 which displays on the screen (Figure 4c) the wave form of the ultrasound signal S transmitted through the bone tissue, line Rto and line Rtm. Since the velocity of the ultrasound passing through soft tissue is always less than its velocity through bone tissue, line Rtm is farther from the origin of the time scale than line Rto. - The portion of the signal S shown on the
screen 17 and included in the interval between lines Rto and Rtm therefore represents the ultrasound signal received after passing through the bone tissue. Marker lines Rto and Rtm provide for defining on the signal onscreen 17 the limits of an "observation window" containing signal portion S. Specifically, block 332 calculates the integral of the signal S shown on thescreen 17 in the interval I that falls between lines Rto and Rtm, and displays the value of that integral and of interval I on the screen. Block 332 also calculates and shows on thescreen 17 the ratio between the value of the integral and the amplitude of the interval I. It is also possible to analyze the incremental ratios between the amplitudes of the peaks that fall between the two marker lines Rto and Rtm and to generate, on the basis of all the parameters calculated, a summary index (SONIC INDEX) whose numeric value describes the density and structure of the bone tissue. -
Block 332 then leads back to block 312. - In
block 341 the operator is asked if he wishes to print the data shown on thescreen 17; if so, the operator presses function key F2, in which case block 341 leads to ablock 342; otherwise it leads to ablock 343. -
Block 342 commands the printing of the data currently shown on thescreen 17; block 342 is then followed byblock 312. -
Block 343 awaits a command confirming the permanent memorization of the data relating to the wave form shown on thescreen 17. If the operator wishes to perform this permanent memorization, he presses function key F1 (confirm data), and block 343 leads to ablock 344; otherwise the operator once again presses button 13 (data not confirmed) and block 343 leads back to block 312. - In
block 344, the contents of counter CNT2_MIS are compared with a pre-defined threshold, for example four; if the value of the counter is equal to the threshold (CNT1_MIS=threshold), block 344 leads to ablock 345. Otherwise it leads to ablock 346. -
Block 346 performs the permanent memorization, for example in a RAM memory (not shown), of the set of data shown byblocks -
Block 346 is followed by ablock 348 that increases the contents of counter CNT2_MIS by one unit, using the logical operation CNT2_MIS=CNT2_MIS+ 1; block 348 then leads to ablock 350. -
Block 345 commands an acoustic signal (BEEP) and is also followed byblock 350. -
Block 350 asks, and this query is displayed on thescreen 17, whether the operator wishes to take another measurement of bone tissue. If so, the operator presses function key F3 (another bone tissue measurement) and block 350 then leads back to block 250; otherwise (end of measurement) the operator presses function key F2 and block 350 leads to ablock 370. - From the above description, it will be understood how it is possible to perform multiple measurements on different bones (for example, the first phalanges of the last four fingers of the hand) up to the threshold value of the counter CNT2_MIS, and gather a corresponding number of data sets.
- The data shown on the
screen 17, fromblocks 330 through 332, make it possible to immediately and accurately evaluate the condition of the analyzed bone tissue and to highlight possible pathologies of that bone tissue. - Specifically, it is possible to recognize a bone of low density due to osteoporosis.
- Figure 4c shows a typical signal S curve detected in a "healthy" bone, not affected by pathological conditions of any kind.
- The velocity observed through the bone tissue is equal to 2214 meters per second, the breadth of the interval I (measured during presentation of soft tissue) is 57 pixels, the value of the integral is 3295 and the ratio between the integral and the interval I is 57. Lines Rto and Rtm mark off a portion of the signal in which multiple Pto peaks (bone tissue peaks) are present, exhibiting a smaller amplitude than the Ptm peaks (soft tissue peaks) that follow line Rtm.
- Between the Pto peaks and the Ptm peaks, there is a zone of separation P5 of lesser amplitude.
- Figure 4d shows a typical signal S curve detected in a "pathological" bone suffering from osteoporosis.
- The velocity observed through the bone tissue is equal to 1800 meters per second (considerably lower than that observed in healthy bone tissue), the breadth of the interval I (measured during presentation of soft tissue) is 35 pixels, the value of the integral is 953 and the ratio between the integral and the interval I is 27.
- Lines Rto and Rtm and much closer together than in the previous example.
- It can be clearly seen, also, that there is no area of separation between the Pto peaks and the Ptm peaks.
- Block 370 (described in detail below) performs a statistical analysis of the data observed and is followed by a
block 400 in which the operator is asked whether he wishes to perform a new cycle of measurements. If the answer is affirmative, block 400 leads back to block 100, after having reset all the data memorized in ablock 410. Otherwise the program exits. - Figure 3 shows a detail of
block 370 which performs the statistical analysis on the data detected during the previous measurements. -
Block 370 comprises aninitial block 371, which enters the age of the subject on whom the measurement is being performed, and asecond block 372 in which the data measured for the subject, as a function of age, are compared with previously memorized statistical data. -
Block 371 comprises afirst block 373, which is designed to read from a memory (not shown) the numerical value corresponding to a reference age YRS, for example fifty years, YRS=50; block 373 is also designed to display this age value YRS on the screen 17 (Figure 3a). -
Block 373 is followed by ablock 374 that awaits a command to increase by one unit the current value of YRS; if the operator wishes to increase the YRS value he presses function key F1 and block 374 leads to a block 374a. Otherwise he presses no key and block 374 leads to block 375. - Block 374a increases the age value by one unit, using the logical operation YRS=YRS+1; block 374a also leads to a
block 375. -
Block 375 awaits a command to decrease the current value of YRS by one unit; if the operator wishes to decrease the YRS value he presses function key F2 and block 375 leads to ablock 375a. Otherwise he presses no key and block 375 leads to ablock 376. -
Block 375a decreases the age value by one unit, using the logical operation YRS=YRS-1;block 375a also leads to ablock 376. -
Block 376 awaits a command to confirm the current YRS value; if the operator wishes to confirm this age value he presses function key F3, and block 376 leads to block 372. Otherwise the operator presses function key F4 and block 376 leads back to block 374. -
Block 372 comprises afirst block 377 in which multiple previously memorized data are recalled. These data express a graph which shows the curve of the velocity of transmission of the ultrasound signals through bone tissue as a function of age. - With specific reference to Figure 4e, block 377 commands a Cartesian graph in which increasing age values (from 35 to 80 years) are indicated on the x-axis and velocity values are indicated on the y-axis (expressed in meters per second). The graph includes a first curve Vmax which represents the trend, as a function of age, of the maximum velocity values observed in a reference population, a second curve Vmin that represents, as a function of age, the trend of the minimum velocity values observed in the reference population, and a third curve Vmed that represents the trend, as a function of age, of the mean velocity values observed in the reference population.
-
Block 377 is followed by ablock 378 in which a velocity value for bone tissue measured inblock 94 is recalled; this value is shown as a point: P on the Cartesian plane as a function of the age set inblock 371. - Specifically, if this value falls between the Vmax and Vmin curves, it may be presumed that the subject on whom the analysis was performed presents no pathologies of any kind, whereas if the velocity of the ultrasound is lower (points below the Vmin curve, showing low bone density) the subject is probably suffering from osteoporosis.
-
Block 378 is further followed by ablock 379 in which the operator is asked if he wishes to print the statistical data thus processed and displayed on thescreen 17; if the answer is affirmative, block 379 leads to ablock 379a that commands a printer (not shown) connected to thecentral unit 3; otherwise it leads directly to block 400. - A comparison is later made between the calculated index (SONIC INDEX) and a memorized reference index.
- From the above description it will be clear that the system realized in the present invention overcomes the drawbacks of the known systems.
- This system in fact makes it possible to calculate and display not only the velocity of ultrasound signals in bone tissue, but also the velocity of ultrasound in soft tissue, and also permits the joint display of these data (
blocks 330 and 332), thus providing the user of the system with images of the sort described above and illustrated in Figures 4c and 4d. - These images provide multiple information not provided by the known systems.
- Diagnosis in bone tissue is therefore performed by observing:
- the value of the velocity in bone tissue;
- the amplitude of interval I falling between the marker lines Rto and Rtm;
- the value of the integral calculated in
block 330; - the wave form of the signal falling between the marker lines Rto and Rtm;
- the reference index (SONIC INDEX) that sums up multiple data in a single numeric value.
- From the above observations it will be clear that the above-described system provides multiple information that is not provided by the known systems, and therefore permits a more accurate diagnosis.
- The statistical analysis commanded in
block 370, moreover, permits a rapid and immediate comparison of the observed data with the reference data. - It is clear, finally, that changes and variations may be made in the described system without departing from the protected sphere of the invention.
- The
transducers transducers
Claims (27)
- Ultrasonic measuring system for determining the density and structure of bone, comprising:characterized in that the aforesaid electronic means of calculation comprise:an electronic control unit (3)ultrasonic calipers (5) connected to the aforesaid unit (3) and equipped with at least a first and a second transducer (9, 11), respectively a generator and a receiver of ultrasound signals, said transducers (9, 11) placed facing one another at an adjustable distance (D);
the above calipers (5), being designed to be connected to a segment of the human body placed between the above-mentioned first (9) and the above-mentioned second (11) transducer;said electronic unit (3) comprising electronic means of calculation designed to measure the time taken by the ultrasound signals to pass through the aforesaid segment from the aforesaid first (9) to the aforesaid second (11) transducer,the electronic means of processing and display command (330, 332) being designed to provide said means of display (17) with a graph of said wave form;first electronic means of calculation (93; 100, 110, 120) designed to take at least a first measurement of a first portion of the human body, consisting of soft tissue, and designed to calculate a first time (Ttm) taken by the ultrasound signal to pass through the soft tissue and to calculate the velocity (Vtm) of the ultrasound in soft tissue;second electronic means of calculation (94; 250,280,290) designed to take at least a second measurement of a second portion of the human body, containing predominantly bone tissue to be diagnosed, and designed to calculate a second time (Tto) taken by the ultrasound signal to pass through said second portion and to calculate and show the velocity of the ultrasound in said second portion;electronic means of processing and display command (330, 332) designed to process the ultrasound signal detected by said second electronic means of calculation in said second measurement, and designed to present on display devices (17), the wave form of the above ultrasound signal detected by the aforesaid second electronic means jointly with aforesaid first (Ttm) and second (Tto) time; said electronic means of processing and display command (330, 332) defining on said display devices (17) at least the markers (Rto, Rtm) of an observation window containing a portion of said ultrasound signal received following passage through said second portion and detected by said second electronic means of calculation (94) ;
said electronic means of processing and display command (330, 332) being, moreover, designed to show, together with the aforesaid wave form, a, first (Rtm) and a second (Rto) marker placed in a position corresponding with the aforesaid first and second time, in correlation with the aforesaid velocity (Vtm, Vto) of the ultrasound measured respectively through the soft tissue and the second portion. - System as described in claim 1, characterized by the fact that the aforesaid electronic means of processing and display command (330, 332) are designed to calculate the amplitude of the interval (I) falling between the first (Rto) and the second (Rtm) marker and are designed to show the value of said amplitude on the aforesaid display device (17).
- System as described in claim 1 or 2, characterized by the fact that said electronic means of processing and display command (330, 332) are designed to calculate the integral of the wave form (S) in the interval (I) falling between the first (Rto) and the second (Rtm) marker and are designed to show on said display device (17) the value of said integral.
- System as described in claim 3, characterized by the fact that said electronic means of processing and display command (330, 332) are designed to calculate the ratio of the value of said integral to the value of the amplitude of said interval (I) and are designed to show the value of said ratio on the aforesaid display device (17).
- System as described in claim 1 or 2, characterized by the fact that said electronic means of processing and display command (330, 332) are designed to analyze the ratio of the amplitudes of the signal peaks falling between the aforesaid first (Rto) and second (Rtm) markers;
Said electronic means of processing and display command (330, 332) being designed to generate a summary index whose numeric value describes the density and structure of bone tissue. - System as described in any or all of the preceding claims, characterized by the fact that said first electronic means of calculation (93) comprise:first means of comparison (130) designed to compare the value of distance (D) logged by said third electronic means (100) with a reference value (Dthreshold) corresponding to an optimum distance for measurement;third electronic means (100) designed to automatically log the distance D between the above-mentioned transducers (9, 11);fourth electronic means (120) designed to command the display of the value of said distance (D) on the above-mentioned display device;
the aforesaid first means of comparison (130) being designed to emit a signal of agreement (140, BEEP) if the above-mentioned distance (D) is substantially equal to said reference value (Dthreshold). - System as described in any or all of the preceeding claims 7, characterized by the fact that the first electronic means of-calculation (93) include:fifth electronic means (150, 165) designed to log, at least temporarily, the wave form of the ultrasound signal detected by said first electronic means (93);said fifth electronic means (150, 165) being designed, further, to show on said display device (17) the aforesaid first marker (Rtm) placed in a position corresponding to the first peak of the wave form of the ultrasound signal detected by said first electronic means (93).
- System as described in any or all of the preceding claims, characterized by the fact that said first electronic means of calculation (93) include:sixth electronic means (198, 210, 220, 230) designed to repeat, for a pre-established number of cycles, the measurements taken on a first portion of the human body to calculate a multiple number of first times (Ttm).
- System as described in claim 8, characterized by the inclusion of seventh electronic means (195) designed to calculate a mean value of said multiple first times (Ttm).
- System as described in any or all of the preceding claims, characterized by the fact that said second electronic means of calculation (94) include:eighth electronic means (280) designed to detect the above-mentioned second time (Tto) when the first peak (Pto) of the received signal exceeds a threshold value;said eighth electronic means (280) include means for the manual setting (314) of said threshold value and means for the automatic selection (312a) of said threshold value.
- System as described in any or all of the preceeding claims from 2 through 11, characterized by the fact that the above-mentioned second electronic means of calculation (94) include:ninth electronic means (311) designed to log, at least temporarily, the wave form of the ultrasound signal detected by said second electronic means (94);said ninth electronic means (311) being designed, further, to show on the aforesaid display device (17) the aforesaid second marker (Rto) placed in a position corresponding to the first peak of the wave form of the ultrasound signal detected by said first electronic means (93);said ninth electronic means (311) being further designed to display the aforesaid first marker (Rto) on said wave form.
- System as described in any or all of the preceding claims, characterized by the fact that the aforesaid first electronic means of calculation (93) are designed to calculate the velocity of the ultrasound signal passing through the aforesaid first portion, and the aforesaid second electronic means of calculation (94) are designed to calculate the velocity of the ultrasound signal passing through the aforesaid second portion.
- System as described in claim 12, characterized by the fact of including means of statistical analysis (370) designed to compare a value detected for the velocity of the ultrasound passing through said second portion with reference values.
- System as described in claim 13, characterized by the fact that said means of statistical analysis (370) include tenth electronic means (378) designed to show, on the above-mentioned display device (17) a Cartesian graph of previously memorized reference curves;
said Cartesian graph showing on its axes, respectively, increasing age values and increasing velocity values;
said tenth electronic mens (378) being designed, further, to display on said Cartesian graph an element of comparison (P) having as its coordinates a velocity value calculated by said second electronic means (94) and a manually-set age value. - System as described in any or all of the preceding claims, characterized by the fact that the above-mentioned calipers (5) include:the aforesaid attachments (23, 26) being positioned so as to face one another and carrying the aforesaid first and second transducers (11, 9), placed so as to face one another, at a distance (D) that is adjustable as a function of the relative position of the aforesaid first (20) and second (21) bodies.a first tubular body (20);a second tubular body (21) coaxial with the first body (20) and sliding axially with respect to the latter;a first rectilinear attachment (23) extending radially from a portion of the end (20a) of the aforesaid first tubular body (20);a second rectilinear attachment (26) extending radially from a portion of the end (21a) of the aforesaid second tubular body (21);
- System as described in claim 15, characterized by the fact that the aforesaid first attachment (23) has at one of its free ends a hole (25) within which one of the aforesaid transducers (11) is housed;
the aforesaid second attachment (26) has at one of its free ends a hole (27) within which one of the aforesaid transducers (9) is housed. - System as described in claim 15 or 16, characterized by the fact of including means for setting (31) the relative position of the aforesaid second tubular body (21) with respect to the aforesaid first tubular body (20);
the aforesaid means of adjustment (31) comprise an elongated metal plate (32) having a first end (32a) joined to an end of one (21) of the aforesaid tubular bodies and a second flat end (32b) placed in contact with one portion (34) of the other (20) of the aforesaid tubular bodies. - System as described in any one of the claims 15 to 17, characterized by the fact of including elastic means (53) placed between the aforesaid first and second tubular bodies (20, 21) and designed to generate a force tending to move the aforesaid attachments (23, 26) closer together.
- System as described in claim 18, characterized by the fact that the aforesaid elastic means (53) comprise a helical spring (53) having a rigidity of approximately 400-500 newton/meter.
- System as described in any one of the claims 15 to 18, characterized by the fact of including electrical means (46) for measuring the relative position of the aforesaid second body (21) with respect to the aforesaid first body (20).
- System as described in claim 20, characterized by the fact that the aforesaid electrical means of measurement include potentiometric means (46) interposed between the aforesaid tubular bodies (20, 21).
- System as described in claim 21, characterized by the fact that the aforesaid potentiometric means (46) include sliding means carried on the aforesaid second tubular body (21) and resistor devices carried on the aforesaid first tubular body (20).
- System as described in claim 22, characterized by the fact that the aforesaid potentiometric means (46) include a casing (47) of said resistor means housed in the aforesaid first body (20) and a shaft (48) that moves the aforesaid sliding means;
the aforesaid shaft (48) being coaxial with the aforesaid second tubular body (21) and having one end connected to the aforesaid second body (49, 21). - System as described in any or all of the claims 15 to 23, characterized by the fact of including a third tubular body (35) extending parallel to the aforesaid first (20) and second (21) body; the middle portion of said third tubular body (35) passing through a hole (38) made through the aforesaid first attachment (23) and having a portion of its end (35b) designed to pass through a hole (40) made in the aforesaid second attachment (26);
said third tubular body (35) being designed to contain and guide exit cables (42, 43) from the aforesaid ultrasound transducers (9, 11). - System as described in any or all of the claims 15 to 24, characterized by the fact of including means of relative positioning (30) capable of precisely positioning a portion of the human body, specifically the phalanx of a finger, in relation to the aforesaid attachments (23, 26) and to the aforesaid transducers (9, 11).
- System as described in claim 25, characterized by the fact that the aforesaid means of relative positioning (30) include a movable cylindrical rod (30) that extends between the first and the second attachment (23, 26) parallel to the aforesaid first and second tubular bodies (20, 21).
- System as described in any one of the preceeding claims, characterized in that said second portion of the human body consists of the distal metaphysis of the first phalanx of the last four fingers of the hand on the lateromedial plane.
Applications Claiming Priority (2)
| Application Number | Priority Date | Filing Date | Title |
|---|---|---|---|
| IT94TO000014A IT1268599B1 (en) | 1994-01-14 | 1994-01-14 | ULTRASONIC MEASURING SYSTEM FOR DETECTION OF DENSITY AND BONE STRUCTURE. |
| ITTO940014 | 1994-01-14 |
Publications (2)
| Publication Number | Publication Date |
|---|---|
| EP0663182A1 EP0663182A1 (en) | 1995-07-19 |
| EP0663182B1 true EP0663182B1 (en) | 2002-04-10 |
Family
ID=11412024
Family Applications (1)
| Application Number | Title | Priority Date | Filing Date |
|---|---|---|---|
| EP95100385A Expired - Lifetime EP0663182B1 (en) | 1994-01-14 | 1995-01-12 | Ultrasonic measurement system for the determination of bone density and structure |
Country Status (8)
| Country | Link |
|---|---|
| US (1) | US5564423A (en) |
| EP (1) | EP0663182B1 (en) |
| JP (1) | JPH07270385A (en) |
| AU (1) | AU691213B2 (en) |
| CA (1) | CA2140188A1 (en) |
| DE (1) | DE69526268T2 (en) |
| ES (1) | ES2173929T3 (en) |
| IT (1) | IT1268599B1 (en) |
Families Citing this family (66)
| Publication number | Priority date | Publication date | Assignee | Title |
|---|---|---|---|---|
| US5720290A (en) * | 1993-04-07 | 1998-02-24 | Metra Biosystems, Inc. | Apparatus and method for acoustic analysis of bone using optimized functions of spectral and temporal signal components |
| US5672172A (en) * | 1994-06-23 | 1997-09-30 | Vros Corporation | Surgical instrument with ultrasound pulse generator |
| US5749363A (en) * | 1994-12-14 | 1998-05-12 | Sekisui Kagaku Kogyo Kabushiki Kaisya | Osteoporosis diagnosing apparatus and method |
| US5755228A (en) * | 1995-06-07 | 1998-05-26 | Hologic, Inc. | Equipment and method for calibration and quality assurance of an ultrasonic bone anaylsis apparatus |
| US6004272A (en) * | 1995-06-07 | 1999-12-21 | Hologic, Inc. | Ultrasonic bone testing apparatus with repeatable positioning and repeatable coupling |
| US6352512B1 (en) | 1995-06-07 | 2002-03-05 | Hologic, Inc. | Bone analysis apparatus and method for calibration and quality assurance of an ultrasonic bone analysis apparatus |
| US5895357A (en) * | 1996-01-29 | 1999-04-20 | Aloka Co., Ltd. | Bone assessment apparatus |
| US5879301A (en) * | 1996-02-16 | 1999-03-09 | Orthologic Corp. | Ultrasonic bone assessment method and apparatus |
| US5785041A (en) * | 1996-03-26 | 1998-07-28 | Hologic Inc. | System for assessing bone characteristics |
| NO963175D0 (en) * | 1996-07-30 | 1996-07-30 | Vingmed Sound As | Method of analysis and measurement |
| IT1292288B1 (en) * | 1997-04-24 | 1999-01-29 | Igea Srl | ULTRASONIC MEASURING DEVICE FOR DETECTION OF BONE DENSITY AND STRUCTURE. |
| EP1014859A4 (en) | 1997-08-19 | 2007-05-02 | Philipp Lang | Measurement of capillary related interstitial fluid using ultrasound methods and devices |
| US6083166A (en) | 1997-12-02 | 2000-07-04 | Situs Corporation | Method and apparatus for determining a measure of tissue manipulation |
| US6030221A (en) * | 1998-02-11 | 2000-02-29 | Cavitat, Inc. | Ultrasonic apparatus and for precisely locating cavitations within jawbones and the like |
| US6013031A (en) * | 1998-03-09 | 2000-01-11 | Mendlein; John D. | Methods and devices for improving ultrasonic measurements using anatomic landmarks and soft tissue correction |
| US6077224A (en) * | 1998-03-23 | 2000-06-20 | Lang; Philipp | Methods and device for improving broadband ultrasonic attenuation and speed of sound measurements using anatomical landmarks |
| US6585649B1 (en) * | 1998-05-02 | 2003-07-01 | John D. Mendlein | Methods and devices for improving ultrasonic measurements using multiple angle interrogation |
| US6217518B1 (en) | 1998-10-01 | 2001-04-17 | Situs Corporation | Medical instrument sheath comprising a flexible ultrasound transducer |
| CA2333345A1 (en) * | 2000-01-31 | 2001-07-31 | David Gibbs | Device for determining a suitable location for catheterized delivery of medications |
| WO2002071949A2 (en) * | 2001-02-28 | 2002-09-19 | Research Foundation Of State University Of New York | Method and apparatus for scanning confocal acoustic diagnostic for bone quality |
| WO2003009762A1 (en) * | 2001-07-24 | 2003-02-06 | Sunlight Medical, Ltd. | Joint analysis using ultrasound |
| WO2003009758A1 (en) | 2001-07-24 | 2003-02-06 | Sunlight Medical, Ltd. | Bone age assessment using ultrasound |
| EP1465530B1 (en) * | 2002-01-07 | 2007-05-23 | GE Medical Systems Israel Ltd. | A system and method of mapping irregularities of hard tissue |
| US7285093B2 (en) * | 2003-10-10 | 2007-10-23 | Imadent Ltd. | systems for ultrasonic imaging of a jaw, methods of use thereof and coupling cushions suited for use in the mouth |
| US8202219B2 (en) * | 2004-02-23 | 2012-06-19 | Cyberlogic, Inc. | Ultrasonic bone assessment apparatus and method |
| DE102004029902B4 (en) * | 2004-06-19 | 2010-01-21 | Universitätsklinikum Schleswig-Holstein | Device for determining bone density by means of ultrasound |
| US7033321B1 (en) * | 2004-10-25 | 2006-04-25 | Artann Laboratories, Inc. | Ultrasonic water content monitor and methods for monitoring tissue hydration |
| IL166115A (en) * | 2005-01-03 | 2012-06-28 | Dan Adam | Interactive ultrasound-based depth measurement for medical applications |
| US8764664B2 (en) * | 2005-11-28 | 2014-07-01 | Vizyontech Imaging, Inc. | Methods and apparatus for conformable medical data acquisition pad and configurable imaging system |
| US20070238992A1 (en) * | 2006-02-01 | 2007-10-11 | Sdgi Holdings, Inc. | Implantable sensor |
| US7328131B2 (en) | 2006-02-01 | 2008-02-05 | Medtronic, Inc. | Implantable pedometer |
| WO2007092054A2 (en) | 2006-02-06 | 2007-08-16 | Specht Donald F | Method and apparatus to visualize the coronary arteries using ultrasound |
| US8473239B2 (en) | 2009-04-14 | 2013-06-25 | Maui Imaging, Inc. | Multiple aperture ultrasound array alignment fixture |
| US7993269B2 (en) | 2006-02-17 | 2011-08-09 | Medtronic, Inc. | Sensor and method for spinal monitoring |
| US8016859B2 (en) * | 2006-02-17 | 2011-09-13 | Medtronic, Inc. | Dynamic treatment system and method of use |
| US20070197895A1 (en) | 2006-02-17 | 2007-08-23 | Sdgi Holdings, Inc. | Surgical instrument to assess tissue characteristics |
| US7918796B2 (en) * | 2006-04-11 | 2011-04-05 | Warsaw Orthopedic, Inc. | Volumetric measurement and visual feedback of tissues |
| US20090112094A1 (en) * | 2006-04-13 | 2009-04-30 | The Research Foundation Of State University Of New York | Phased Apply Ultrasound With Electronically Controlled Focal Point For Assessing Bone Quality Via Acoustic Topology And Wave Transmit Functions |
| EP2088932B1 (en) | 2006-10-25 | 2020-04-08 | Maui Imaging, Inc. | Method and apparatus to produce ultrasonic images using multiple apertures |
| US7901356B2 (en) * | 2006-12-13 | 2011-03-08 | Cyberlogic, Inc. | Ultrasonic bone assessment apparatus and method |
| US9615814B2 (en) * | 2006-12-13 | 2017-04-11 | Cyberlogic, Inc. | Ultrasonic bone assessment apparatus and method |
| US7862510B2 (en) * | 2007-02-09 | 2011-01-04 | Cyberlogic, Inc. | Ultrasonic bone assessment apparatus and method |
| US20080228072A1 (en) * | 2007-03-16 | 2008-09-18 | Warsaw Orthopedic, Inc. | Foreign Body Identifier |
| US9282945B2 (en) | 2009-04-14 | 2016-03-15 | Maui Imaging, Inc. | Calibration of ultrasound probes |
| US9788813B2 (en) | 2010-10-13 | 2017-10-17 | Maui Imaging, Inc. | Multiple aperture probe internal apparatus and cable assemblies |
| JP5377166B2 (en) * | 2009-09-01 | 2013-12-25 | 古野電気株式会社 | Ultrasound bone analyzer |
| EP2536339B1 (en) | 2010-02-18 | 2024-05-15 | Maui Imaging, Inc. | Point source transmission and speed-of-sound correction using multi-aperture ultrasound imaging |
| US9668714B2 (en) | 2010-04-14 | 2017-06-06 | Maui Imaging, Inc. | Systems and methods for improving ultrasound image quality by applying weighting factors |
| JP6092109B2 (en) | 2010-10-13 | 2017-03-08 | マウイ イマギング,インコーポレーテッド | Concave ultrasonic transducer and 3D array |
| US10004474B2 (en) | 2010-10-27 | 2018-06-26 | Siemens Medical Solutions Usa, Inc. | Tissue density quantification using shear wave information in medical ultrasound scanning |
| US9179843B2 (en) | 2011-04-21 | 2015-11-10 | Hassan Ghaderi MOGHADDAM | Method and system for optically evaluating proximity to the inferior alveolar nerve in situ |
| ITPI20110054A1 (en) | 2011-05-16 | 2012-11-17 | Echolight S R L | ULTRASOUND APPARATUS TO ASSESS THE STATE OF THE BONE STRUCTURE OF A PATIENT |
| WO2013082455A1 (en) | 2011-12-01 | 2013-06-06 | Maui Imaging, Inc. | Motion detection using ping-based and multiple aperture doppler ultrasound |
| JP2015503404A (en) | 2011-12-29 | 2015-02-02 | マウイ イマギング,インコーポレーテッド | Arbitrary path M-mode ultrasound imaging |
| JP6438769B2 (en) | 2012-02-21 | 2018-12-19 | マウイ イマギング,インコーポレーテッド | Determination of material hardness using multiple aperture ultrasound. |
| WO2014026185A1 (en) | 2012-08-10 | 2014-02-13 | Maui Imaging, Inc. | Calibration of multiple aperture ultrasound probes |
| CN103676827A (en) | 2012-09-06 | 2014-03-26 | Ip音乐集团有限公司 | System and method for remotely controlling audio equipment |
| EP3893022B1 (en) | 2012-09-06 | 2025-02-12 | Maui Imaging, Inc. | Ultrasound imaging system memory architecture |
| WO2014160291A1 (en) | 2013-03-13 | 2014-10-02 | Maui Imaging, Inc. | Alignment of ultrasound transducer arrays and multiple aperture probe assembly |
| US9883848B2 (en) | 2013-09-13 | 2018-02-06 | Maui Imaging, Inc. | Ultrasound imaging using apparent point-source transmit transducer |
| KR102617888B1 (en) | 2014-08-18 | 2023-12-22 | 마우이 이미징, 인코포레이티드 | Network-based ultrasound imaging system |
| CN104636622B (en) * | 2015-02-12 | 2017-08-04 | 无锡海斯凯尔医学技术有限公司 | Analysis on the health status method and system based on elastomeric check equipment |
| KR102681141B1 (en) | 2015-03-30 | 2024-07-02 | 마우이 이미징, 인코포레이티드 | Ultrasonic imaging systems and methods for detecting object motion |
| EP4697068A3 (en) | 2016-01-27 | 2026-04-22 | Maui Imaging, Inc. | Ultrasound imaging with sparse array probes |
| JP7724853B2 (en) | 2020-10-21 | 2025-08-18 | マウイ イマギング,インコーポレーテッド | Systems and methods for tissue characterization using multiple aperture ultrasound |
| CN116635162A (en) | 2020-11-02 | 2023-08-22 | 毛伊图像公司 | Systems and methods for improving ultrasound image quality |
Family Cites Families (11)
| Publication number | Priority date | Publication date | Assignee | Title |
|---|---|---|---|---|
| GB299906A (en) * | 1927-08-03 | 1928-11-05 | British Thomson Houston Co Ltd | Improvements in and relating to insulating material |
| US3847141A (en) * | 1973-08-08 | 1974-11-12 | Nasa | Ultrasonic bone densitometer |
| GB2067761B (en) * | 1980-01-22 | 1984-01-25 | Servier Nederland Bv | Measuring caliper |
| JPS59127114U (en) * | 1983-02-16 | 1984-08-27 | 株式会社ミツトヨ | Digital display type measuring device |
| US4913157A (en) * | 1986-06-03 | 1990-04-03 | Analog Devices, Inc. | Ultrasound method and apparatus for evaluating, in vivo, bone conditions |
| US4802487A (en) * | 1987-03-26 | 1989-02-07 | Washington Research Foundation | Endoscopically deliverable ultrasound imaging system |
| EP0299906A3 (en) * | 1987-07-16 | 1990-06-13 | The University Of Melbourne | In-vivo bone quality measurement |
| US5054490A (en) * | 1988-05-11 | 1991-10-08 | Lunar Corporation | Ultrasonic densitometer device and method |
| US4926870A (en) * | 1988-08-30 | 1990-05-22 | Osteo-Technology, Inc. | Method and apparatus for ultrasonic analysis of bone strength in vivo |
| GB2257253B (en) * | 1991-06-17 | 1995-01-11 | Christian Mcdonald Langton | Ultrasound bone analyser |
| US5396891A (en) * | 1993-04-07 | 1995-03-14 | Osteo Sciences Corporation | System and method for external acoustic bone velocity measurement |
-
1994
- 1994-01-14 IT IT94TO000014A patent/IT1268599B1/en active IP Right Grant
-
1995
- 1995-01-11 US US08/371,150 patent/US5564423A/en not_active Expired - Lifetime
- 1995-01-12 ES ES95100385T patent/ES2173929T3/en not_active Expired - Lifetime
- 1995-01-12 EP EP95100385A patent/EP0663182B1/en not_active Expired - Lifetime
- 1995-01-12 DE DE69526268T patent/DE69526268T2/en not_active Expired - Fee Related
- 1995-01-13 CA CA002140188A patent/CA2140188A1/en not_active Abandoned
- 1995-01-13 AU AU10193/95A patent/AU691213B2/en not_active Ceased
- 1995-01-17 JP JP7004980A patent/JPH07270385A/en not_active Ceased
Also Published As
| Publication number | Publication date |
|---|---|
| ITTO940014A0 (en) | 1994-01-14 |
| JPH07270385A (en) | 1995-10-20 |
| DE69526268D1 (en) | 2002-05-16 |
| AU691213B2 (en) | 1998-05-14 |
| US5564423A (en) | 1996-10-15 |
| EP0663182A1 (en) | 1995-07-19 |
| IT1268599B1 (en) | 1997-03-06 |
| ITTO940014A1 (en) | 1995-07-14 |
| AU1019395A (en) | 1995-07-27 |
| DE69526268T2 (en) | 2002-09-05 |
| CA2140188A1 (en) | 1995-07-15 |
| ES2173929T3 (en) | 2002-11-01 |
Similar Documents
| Publication | Publication Date | Title |
|---|---|---|
| US5564423A (en) | Ultrasonic measurement system for the determination of bone density and structure | |
| US5452722A (en) | Ultrasound bone analyser | |
| US7106043B1 (en) | Low capacitance measurement probe | |
| US5158088A (en) | Ultrasonic diagnostic systems for imaging medical instruments within the body | |
| EP0054062B1 (en) | Automatic backfat meter | |
| EP1121574B1 (en) | Telemedicine weighing scale | |
| US6364837B1 (en) | Contact digital ultrasonic densitometer | |
| US5423332A (en) | Device and method for determining the mass or volume of a body part | |
| AU708795B2 (en) | Ultrasonic apparatus and method for measuring animal backfat | |
| JPH09501068A (en) | External acoustic bone velocity measuring device and method | |
| US20060025690A1 (en) | Acoustic body examination | |
| US6436042B1 (en) | Ultrasonic measuring device for determining bone density and structure | |
| US4993427A (en) | Heart contraction monitor | |
| US4475397A (en) | Method and means for attaining ultrasonic attenuation by vector sample averaging | |
| US5717142A (en) | Ultrasound image freezing apparatus and method for animal backfat measuring instruments | |
| JP4037961B2 (en) | Bone mineral meter | |
| JP2970884B2 (en) | Probe device for vascular elasticity measurement | |
| AU7327081A (en) | Automatic digital backfat meter | |
| EP0224543B1 (en) | Sway monitor | |
| JPS6019683Y2 (en) | sebum thickness meter | |
| JPH0560524B2 (en) | ||
| HU202396B (en) | Echo-impulse testing set | |
| HK1156826B (en) | Ultrasonic bone assessment apparatus and method | |
| Westwood | A NEW PORTABLE EQUIPMENT FOR | |
| Gas et al. | No disturbances in gas flow measurement |
Legal Events
| Date | Code | Title | Description |
|---|---|---|---|
| PUAI | Public reference made under article 153(3) epc to a published international application that has entered the european phase |
Free format text: ORIGINAL CODE: 0009012 |
|
| AK | Designated contracting states |
Kind code of ref document: A1 Designated state(s): DE ES FR GB IT |
|
| 17P | Request for examination filed |
Effective date: 19951201 |
|
| 17Q | First examination report despatched |
Effective date: 19991019 |
|
| GRAG | Despatch of communication of intention to grant |
Free format text: ORIGINAL CODE: EPIDOS AGRA |
|
| GRAG | Despatch of communication of intention to grant |
Free format text: ORIGINAL CODE: EPIDOS AGRA |
|
| GRAH | Despatch of communication of intention to grant a patent |
Free format text: ORIGINAL CODE: EPIDOS IGRA |
|
| RAP1 | Party data changed (applicant data changed or rights of an application transferred) |
Owner name: IGEA S.R.L. |
|
| GRAH | Despatch of communication of intention to grant a patent |
Free format text: ORIGINAL CODE: EPIDOS IGRA |
|
| REG | Reference to a national code |
Ref country code: GB Ref legal event code: IF02 |
|
| GRAA | (expected) grant |
Free format text: ORIGINAL CODE: 0009210 |
|
| AK | Designated contracting states |
Kind code of ref document: B1 Designated state(s): DE ES FR GB IT |
|
| REF | Corresponds to: |
Ref document number: 69526268 Country of ref document: DE Date of ref document: 20020516 |
|
| ET | Fr: translation filed | ||
| REG | Reference to a national code |
Ref country code: ES Ref legal event code: FG2A Ref document number: 2173929 Country of ref document: ES Kind code of ref document: T3 |
|
| PLBE | No opposition filed within time limit |
Free format text: ORIGINAL CODE: 0009261 |
|
| STAA | Information on the status of an ep patent application or granted ep patent |
Free format text: STATUS: NO OPPOSITION FILED WITHIN TIME LIMIT |
|
| 26N | No opposition filed |
Effective date: 20030113 |
|
| PGFP | Annual fee paid to national office [announced via postgrant information from national office to epo] |
Ref country code: GB Payment date: 20071227 Year of fee payment: 14 Ref country code: ES Payment date: 20080111 Year of fee payment: 14 |
|
| PGFP | Annual fee paid to national office [announced via postgrant information from national office to epo] |
Ref country code: DE Payment date: 20080115 Year of fee payment: 14 Ref country code: IT Payment date: 20080123 Year of fee payment: 14 |
|
| PGFP | Annual fee paid to national office [announced via postgrant information from national office to epo] |
Ref country code: FR Payment date: 20080131 Year of fee payment: 14 |
|
| GBPC | Gb: european patent ceased through non-payment of renewal fee |
Effective date: 20090112 |
|
| PG25 | Lapsed in a contracting state [announced via postgrant information from national office to epo] |
Ref country code: DE Free format text: LAPSE BECAUSE OF NON-PAYMENT OF DUE FEES Effective date: 20090801 |
|
| REG | Reference to a national code |
Ref country code: FR Ref legal event code: ST Effective date: 20091030 |
|
| PG25 | Lapsed in a contracting state [announced via postgrant information from national office to epo] |
Ref country code: GB Free format text: LAPSE BECAUSE OF NON-PAYMENT OF DUE FEES Effective date: 20090112 |
|
| REG | Reference to a national code |
Ref country code: ES Ref legal event code: FD2A Effective date: 20090113 |
|
| PG25 | Lapsed in a contracting state [announced via postgrant information from national office to epo] |
Ref country code: FR Free format text: LAPSE BECAUSE OF NON-PAYMENT OF DUE FEES Effective date: 20090202 Ref country code: ES Free format text: LAPSE BECAUSE OF NON-PAYMENT OF DUE FEES Effective date: 20090113 |
|
| PG25 | Lapsed in a contracting state [announced via postgrant information from national office to epo] |
Ref country code: IT Free format text: LAPSE BECAUSE OF NON-PAYMENT OF DUE FEES Effective date: 20090112 |