EP0525592A2 - Système de traitement d'information avec des dimensions fractales - Google Patents
Système de traitement d'information avec des dimensions fractales Download PDFInfo
- Publication number
- EP0525592A2 EP0525592A2 EP92112449A EP92112449A EP0525592A2 EP 0525592 A2 EP0525592 A2 EP 0525592A2 EP 92112449 A EP92112449 A EP 92112449A EP 92112449 A EP92112449 A EP 92112449A EP 0525592 A2 EP0525592 A2 EP 0525592A2
- Authority
- EP
- European Patent Office
- Prior art keywords
- data
- fractal dimension
- prediction
- result
- information processing
- Prior art date
- Legal status (The legal status is an assumption and is not a legal conclusion. Google has not performed a legal analysis and makes no representation as to the accuracy of the status listed.)
- Withdrawn
Links
Images


Classifications
-
- G—PHYSICS
- G06—COMPUTING; CALCULATING OR COUNTING
- G06N—COMPUTING ARRANGEMENTS BASED ON SPECIFIC COMPUTATIONAL MODELS
- G06N3/00—Computing arrangements based on biological models
- G06N3/02—Neural networks
- G06N3/04—Architecture, e.g. interconnection topology
- G06N3/0418—Architecture, e.g. interconnection topology using chaos or fractal principles
Definitions
- the present invention relates generally to an information processing system. More particularly, the present invention is concerned with an information processing system imparted with a capability of making clear characteristics or properties of data to be used for the purpose of control, prediction or the like when they are unknown in precedence to the use.
- the dimension dealt with in Euclidean geometry is of an integer value.
- the dimension extended to the non-integral value range is termed the Hausdorf dimension or fractal dimension (hereinafter referred to as the fractal dimension).
- the fractal dimension D is defined as follows.
- a volume of an object in an N-dimensional space is represented by V when measured by filling up the volume with N-dimensional hyper cubes each having a side of "1" " (unity) while it is V' when measured more finely by filling up with N-dimensional hyper cubes reduced by a reduction ratio r (r ⁇ 1)
- the fractal dimension D is given by the following expression (1).
- the fractal theory attracts attention as a tool or method for analyzing shapes in many and diverse fields of the natural science or as a drawing method of natural organization in the field of computer graphics.
- the fractal dimension is positively made use of for the control, prediction or the like purpose.
- an information processing system which comprises a facility for determining a fractal dimension of data inputted to the information processing system, and a facility for executing predetermined data processing on the input data by using the fractal dimension as determined.
- a prediction system which comprises a facility for performing prediction processing by using a predetermined prediction logic on the basis of time-series input data supplied to the prediction system, a facility for determining a fractal dimension of the time-series input data, a facility for determining a confidence of the result of prediction processing on the basis of the fractal dimension as determined, and a facility for outputting the prediction confidence together with the result of the prediction processing.
- a prediction system which comprises on input facility for inputting time-series data, a facility for performing a predetermined conversion on the time-series input data, a facility for determining a fractal dimension of the data obtained through the conversion, a facility for selecting the data resulting from the conversion in dependence on a value of the fractal dimension, a facility for performing prediction processing on the basis of the selected data by using a predetermined prediction logic, and a facility for performing a conversion reverse to the abovementioned predetermined conversion on the data resulting from the prediction processing.
- an alarm generating system which comprises a facility for determining a fractal dimension of monitoring data inputted to the alarm system, and a facility for generating an alarm signal on the basis of data selected from the monitoring data in dependence on a value of the fractal dimension as determined.
- the fractal dimension as an index indicating a trend or nature of input data
- condition parameters of a processing module for processing the input data so that appropriate output can be obtained by using the input data.
- a system which is capable of evaluating in advance the output of the processing module on the basis of the fractal dimension of the input data.
- economical data such as stock price can be considered as having the dynamics which undergo variation in the course of time lapse. If dynamics of data changes frequently during a short span of time, it is naturally expected that prediction of value of such data will fall of the mark because the dynamic predicted immediately after occurrence of a change in the value of the data can not be regarded as an extension of the dynamic observed at the current time point. In other words, some predicted value may hit the mark while some predicted value may mishit, the hit ratio being determined in dependence of the nature or trend of the data to be subjected to the prediction.
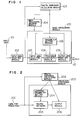
- Fig. 1 is a functional block diagram showing a general arrangement of an information processing system in which the concept of the fractal dimension is adopted.
- the information processing system includes as major constituent parts an input data modifying part (or module) 102, a fractal dimension calculating part (or module) 103, a main processing decision part (or module) 104 and a main processing part (or module) 105, wherein the system generates output data 110 in response to input data 101.
- the input data modifying part 102 generates requisite data from the input data 101 or convert the latter into the former in dependence on a task to be executed by the system.
- the fractal dimension calculating part 103 determines a fractal dimension of the modified data.
- the main processing decision part 104 makes decision as to whether or not the main processing part 105 is to be activated and activates the latter as the occasion requires it.
- the main processing part 105 includes an input data selecting part (or module) 107, a processing execution part (or module) 108, a parameter setting part (or module) 106 and an output data modifying part (or module) 109 and performs selection of the requisite data from the input data, execution of processing, setting of parameters and modification of the output data.
- the input data modifying part 102 performs a system-oriented conversion of the input data 101 such as Fourier transformation, analogue-to-digital (A/D) conversion, logarithm transformation or the like and serves to generate the requisite data such as difference values or the like from the input data 101.
- the fractal dimension calculating part 103 a fractal dimension of the data obtained as the result of the transformation or conversion or generation mentioned above is determined as the index to be utilized in subsequent processing.
- the main processing decision part 104 makes decision as to whether the main processing part 105 is to be activated or not on the basis of the fractal dimension determined by the fractal dimension calculating part 103. When the answer of this decision is affirmative (YES), the main processing part 105 is activated.
- abnormality analysis processing or fault removal processing is activated as the main processing part 105, whereupon requisite input data is determined by the input data selecting part 107 on the basis of the fractal dimension outputted from the fractal dimension calculating part 103 with the requisite parameters being set by the parameter setting part 106, which is then followed by execution of predetermined processing by the processing execution part or module 108.
- the data outputted from the processing execution part 108 is converted into a predetermined output form by the output data modifying part 109 to be outputted as indicated at 110.
- a part or parts of the system shown in Fig. 1 may be spared in dependence on the types of applications in which the system is actually employed.
- Fig. 2 is a functional block diagram showing an exemplary arrangement of a time-series data prediction system in which the concept of the fractal dimension is adopted.
- the time-series data prediction system comprises a fractal dimension calculating part (or module) 202 and a prediction processing part (or module) 203 which correspond to the fractal dimension calculating part (module) 103 and the main processing part (module) 105 shown in Fig. 1, respectively.
- the prediction processing part (module) 202 includes a neural network 205 for performing prediction, a learning parameter setting part (or module) 204 for setting parameters useful for the learning of the neural network and an output processing part (or module) 206 for determining the reliability or confidence of the result of prediction on the basis of the fractal dimension for thereby outputting information of the confidence together with the result of prediction.
- values of the fractal dimension of given time-series data are determined from a time point in the past to the present by the fractal dimension calculating part 202.
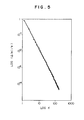
- the values of the fractal dimension are determined through a processing flow illustrated in Fig. 3 in accordance with Higuchi method described in "Journal of the Institute of Electronics, Information and Communication Engineers of Japan", Vol. J73-D-II, No. 4 (1991. 4), p. 497. Now, let's suppose (N + 1) data Xo, X 1 , X 2 , ..., X N , as illustrated in Fig.
- a relation between a common logarithm “log (k)” of the interval k and a common logarithm “log ( ⁇ (k))/k)” is plotted (step 305). If the data is fractal, points as plotted will represent a straight line as illustrated in Fig. 5. A slope D of this straight line is then determined by a least square method in a step 306 (Fig. 3). The slope D thus determined represents the fractal dimension.
- the further prediction is performed by the neural network 205 in the system shown in Fig. 2.
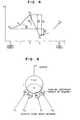
- the neural network is constituted by a plurality of units referred to as the neuron and each having a multiplicity of inputs and one output, as can be seen in Fig. 6.
- Each of the neurons has a characteristic given by the following expression (7).
- f represents an output function
- U j represents a weighted sum of outputs from the other neurons i.
- the weighted sum U j can be expressed as follows:
- the neurons are disposed in such a manner as shown in Fig. 7 to thereby constitute a multi-layer neural network, in which an input layer 705 has no neuron input and can be realized in most cases by a linear element capable of performing the operation given by the undermentioned expression (10).
- V represents a value resulting from normalization of the input data to a range of "0" to "1".
- the neural network used for the prediction in the system according to the instant embodiment of the invention differs slightly from the structure shown in Fig. 7 and has a structure in which the outputs of the multi-layer network are fed back to the input layer, as known in Fig. 8, which structure is very profitable when applied to the prediction of the time-series data among others.
- values of the time-series data 801 supplied to the neural network are normalized so as to fall within a range of "0" to "1".
- Operations of the neural network can be classified into a learning process and a prediction process.
- the learning process is effectuated by using the back-propagation method such that when time-series data X n-S , X n-S+1, ..., X n-1 are inputted as the input data 807 by paying attention to one data X n of the time-series data 801, the corresponding output data assume the same values as the correct (teacher) data 802 of X n-r+1, X n-r+2, ..., X n , as shown in Fig. 8, where s represents the number of the neurons in the input layer and r represents the number of the neuron in the output layer.
- the learning process is completed by adjusting the coupling coefficients (weights of synapses) so that the similar input-versus-output relation can be obtained even when the data point X n of concern is progressively shifted backward to X n - 1 , X n - 2 and so forth.
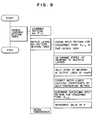
- the learning process described above is illustrated in a flow chart of Fig. 9.
- the input to the neurons in the input layer to which the feedback is applied becomes approximately zero when the learning process has advanced sufficiently.
- zero is inputted to those neurons having the feedback applied as described previously by reference to Fig. 8 upon starting the prediction process while X n-(s-r)+1, X n -( s - r ) +2 , ..., X n are inputted to the other neurons in the input layer (as indicated at 1005 in Fig. 10).
- the output data obtained in this manner represents the result of prediction, i.e., Xn", X n+2 , ..., X n+r (1001 in Fig. 10).
- r predicted values are made to be available, starting from a point Xn + which succeeds to the current point X n .
- the use of the neural network necessitates determination of parameters such as the number of the neurons in each layer, the number of learning patterns, the number of times the learning is to be effectuated and others.
- the number of the neurons in the output layer plays an essential role in determining how far the point for which the prediction is to be made is distanced from the current point. It is however doubtful whether the prediction made for a time point in the far future by providing a greater number of neurons in the output layer is of any practical significance.
- the number of the neurons to be incorporated in the output layer should preferably be determined by estimating the farthest time point in the future which can assure high accuracy or reliability (confidence) for the prediction on the basis of the intermediate result obtained in the course of determining the fractal dimension. This operation can be performed by the learning parameter determining part 204.
- Fig. 11 is a view which illustrates graphically a relation between "log (k)” and "log (A (k)/k) for determining the fractal dimension of change in the price of stock of a certain brand.
- points as plotted do not represent a straight line but is bent at an intermediate point. More specifically, the slope of the straight line segment (i.e., the fractal dimension) determined within a range where the value of k is from “1" " to "5" is "1.51 ", while the fractal dimension determined within the range of values of k beyond "6" is "1.96". This means that data observed locally exhibit a characteristic different from that observed globally.
- the fractal dimension can be regarded as an index indicating randomness of data. More specifically, the data illustrated in Fig. 11 changes very randomly on the whole although the randomness of the data is negligible on a local survey. Accordingly, in the case of the instant example, the reliability or confidence of the prediction can be ensured within a range in which the fractal dimension is low, e.g., up to a point in the future which is distanced about five points from the current point. However, beyond that future point, the result of prediction lacks the reliability. Thus, it can be understood that about five neurons are sufficient for the output layer.
- Fig. 12 shows, by way of example, a result of prediction performed eight points (days) ahead on the above-mentioned data (dotted broken line plot 1202) together with a result of prediction performed eighteen points (days) ahead (solid line plot 1203).
- a broken line plot 1201 shows real changes in the stock price data.
- the result of prediction up to the eighteenth future point (day) represented by the plot 1203 well coincides with the real changes in that the stock price of concern is once lowered and rises again in the earlier half while showing significant discrepancy in the latter half.
- the output processing part 206 in the system shown in Fig. 2 serves for displaying the result of prediction performed by the neural network 205 as well as for calculating the reliability or confidence of the result of prediction on the basis of the fractal dimension calculated by the fractal dimension calculating part 203.
- the fractal dimension can be considered as an index indicating the randomness.
- the fractal dimension of time-series data which increases in proportion to the time lapse such as given by the undermentioned expression (11) is "1"
- the fractal dimension of a random variable sequence approaches "2" very closely.
- Fig. 13 shows a relation between a fractal dimension of data to be predicted and a prediction error. It will be seen from this figure that the prediction error increases as the fractal dimension approaches "2" more closely or as the randomness of the data becomes more significant.
- Fig. 14 shows a relation between a fractal dimension of data subjected to the prediction and the prediction hit ratio. For determining the prediction hit ratio, changes in the data are classified into five patterns monotonous increase , "rise followed by fall”, “no change”, “fall followed by rise” and “monotonous fall”. When the pattern resulting from the prediction coincides with the pattern of the real data, it is said that the prediction makes hit.
- the prediction hit ratio is 100 %. However, the prediction hit ratio lowers as the fractal dimension increases. In the case of the random variable sequence (whose fractal dimension is "2"), the prediction hit ratio is 20 %, a probability value indicating that the prediction makes hit on one of the five patterns.
- An expected prediction hit ratio of the neural network can be derived on the basis of the fractal dimension of the data subjected to the prediction by consulting the plot shown in Fig. 14 and displayed simultaneously with the result of prediction.
- Fig. 15 shows a result of prediction performed by using the neural network for predicting changes in the price of stock of a certain brand.
- a broken line plot shows real changes in the stock price while a solid line plot shows the result of prediction.
- the prediction was performed five times for different days, respectively. Since the fractal dimension determined on the basis of the changes in the stock price in the past is 1.57, it is expected from Fig. 14 that the prediction hit ratio will be about 60 %.
- the result of the prediction performed actually also shows that three of the five predictions made hits, meaning that the real hit ratio is 60 %.
- Fig. 16 shows the result of the prediction performed for the changes in the highest daily atmospheric temperature in the winter of 1981 in Sendai district of Japan.
- a broken line plot indicates the actual temperatures with solid line plot indicating the predicted temperature degrees.
- the prediction was also performed five times for different days, respectively.
- the fractal dimension of the temperature data is 1.86. Accordingly, the expected hit ratio of the prediction is about 30 %.
- the result of the prediction actually performed shows that two of the five predictions made hit, meaning that the real hit ratio is 40 %.
- the prediction is difficult to perform with a high hit ratio for the data of which fractal dimension is high.
- the prediction should be performed notwithstanding of the difficulty.
- it is expected that the accuracy or reliability of the prediction can be improved if the fractal dimension of data which is difficult to predict can be lowered by modifying the data in some way.
- several embodiments of the invention will be described which are directed to improvement of the prediction accuracy or reliability by modifying the data conversion (translation) method so that the fractal dimension can be lowered.
- Fig. 17 is a functional block diagram showing a structure of the prediction system according to a second embodiment of the invention.
- input data to be subjected to the prediction is supplied to an input data modifying part (or module) 1702 which serves for generation of data such as a difference, a moving average, a distance (or deviation) ratio from the moving average or the like.
- the fractal dimension of the data outputted from the input data modifying part (or module) 1702 is arithmetically determined by a fractal dimension calculating part (or module) 1703, which is then followed by selection of those data which can be expected to ensure a high prediction accuracy by an input data select part (or module) 1705.
- a neural network 1706 performs prediction.
- Parameters required for the learning are set by a learning parameter setting part (or module) 1704.
- Operations of the neural network 1706 and the learning parameter setting part 1704 are same as those of the corresponding parts described hereinbefore in conjunction with the first embodiment.
- the result of the prediction performed by the network then undergoes conversion reverse to that performed by the input data modifying part, whereby a predicted value of the data as aimed can be determined.
- the reverse conversion mentioned above is carried out by a reverse conversion processing part (or module) 1707.
- Fig. 18 shows graphically a result of the prediction performed for predicting change in the price of stock of a certain brand by the prediction system according to the second embodiment.
- a broken line plot 1801 represents the real changes
- a dotted broken line plot 1802 and a solid line plot 1803 represent predicted changes, respectively.
- the change data of the stock price has a fractal dimension of 1.96. Accordingly, it is expected that the hit ratio of the prediction will be about 20 %, representing an accidental hit ratio.
- the result of the prediction performed by using the data intact are utterly out of the mark when compared with the real change of the stock price.
- the prediction accuracy can be enhanced by deriving from the stock price change data the moving average data and data of the distance ratio from the moving average, performing the predictions separately on the basis of these data, respectively, and by synthesizing the results of the two predictions. More specifically, the fractal dimension of the moving average data determined for ten days is 1.20 while that of the distance ratio data is 1.55, both being lower than the fractal dimension of the stock price change data.
- the plot 1803 in Fig. 18 shows the result of the stock price change prediction which is determined on the data obtained by synthesizing or combining the moving average data and the distance ratio data mentioned above. As can be seen from the plot 1803, the prediction based on the separate data (i.e.
- a third embodiment of the invention will be described which is applied to an alarm system of such a configuration as shown in Fig. 19.
- a typical control system it is a common practice to sample data from an object 1901 to be controlled and input the sampled data 1902 to a controller 1906 which is designed to process the input data to thereby generate a control signal 1907 for controlling the object 1901.
- the data inputted to the controller 1906 is also supplied to a fractal dimension calculating part 1903 to determine the fractal dimension of the input data for the purpose of detecting abnormality taking place in the system and generating an alarm.
- the sampled data is such as illustrated in Fig.
- the fractal dimension of the data is 1.97.
- the fractal dimension decreases to 1.87.
- an alarm signal generating part 1904 detects a symptom of abnormality occurrence in the system and/or makes decision as to the level of abnormality and generate an alarm signal 1905, as occasion requires it. In this way, it is possible to detect abnormality of a system by checking the fractal dimension.
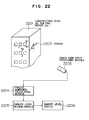
- a fourth embodiment of the invention which is applied to a measuring system for detecting a level of break-down danger of aged constructions.
- time-worn constructions such as building, bridges and the like suffer from generation of numerous crevices and cracks and will eventually encounter the danger of collapse. Under the circumstances, it is very useful if the level of danger at which a construction of concern stands can be detected or determined.
- the fourth embodiment of the invention is directed to a system for determining the level of danger of a construction by checking the fractal dimension of data sampled from cracks produced in a construction.
- Fig. 22 shows a structure of this system.
- This data input can be realized by taking a picture of the construction and reading the cracks by means of an image scanner, by way of example.
- the crack data to be inputted is not necessarily of the whole construction but may be sample data obtained by sampling the crack data from a part of the construction.
- a fractal dimension of the crack data is then determined by a fractal dimension calculating part (or module) 2204.
- a danger-level decision part (or module) 2205 arithmetically determines the level of danger of the construction concerned to thereby display the danger level on a display unit 2206.
Landscapes
- Engineering & Computer Science (AREA)
- Theoretical Computer Science (AREA)
- Physics & Mathematics (AREA)
- General Health & Medical Sciences (AREA)
- Computing Systems (AREA)
- Biomedical Technology (AREA)
- Biophysics (AREA)
- Computational Linguistics (AREA)
- Data Mining & Analysis (AREA)
- Evolutionary Computation (AREA)
- Life Sciences & Earth Sciences (AREA)
- Molecular Biology (AREA)
- Artificial Intelligence (AREA)
- General Engineering & Computer Science (AREA)
- General Physics & Mathematics (AREA)
- Mathematical Physics (AREA)
- Software Systems (AREA)
- Health & Medical Sciences (AREA)
- Management, Administration, Business Operations System, And Electronic Commerce (AREA)
- Complex Calculations (AREA)
Applications Claiming Priority (2)
| Application Number | Priority Date | Filing Date | Title |
|---|---|---|---|
| JP187254/91 | 1991-07-26 | ||
| JP3187254A JPH0535768A (ja) | 1991-07-26 | 1991-07-26 | フラクタル次元を応用した情報処理装置 |
Publications (2)
| Publication Number | Publication Date |
|---|---|
| EP0525592A2 true EP0525592A2 (fr) | 1993-02-03 |
| EP0525592A3 EP0525592A3 (en) | 1994-06-08 |
Family
ID=16202755
Family Applications (1)
| Application Number | Title | Priority Date | Filing Date |
|---|---|---|---|
| EP19920112449 Withdrawn EP0525592A3 (en) | 1991-07-26 | 1992-07-21 | Information processing system using fractal dimension |
Country Status (2)
| Country | Link |
|---|---|
| EP (1) | EP0525592A3 (fr) |
| JP (1) | JPH0535768A (fr) |
Cited By (3)
| Publication number | Priority date | Publication date | Assignee | Title |
|---|---|---|---|---|
| WO1994028500A1 (fr) * | 1993-05-27 | 1994-12-08 | Max-Planck-Gesellschaft zur Förderung der Wissenschaften e.V., Berlin | Procede et systeme de filtrage spatial |
| WO1995006927A1 (fr) * | 1993-08-31 | 1995-03-09 | Shell Internationale Research Maatschappij B.V. | Procede de prevention des reponses erronees de systemes optiques de detection, et appareil associe |
| WO2001043067A2 (fr) * | 1999-12-10 | 2001-06-14 | Durand Technology Limited | Ameliorations relatives a des applications des techniques fractales et/ou chaotiques |
Families Citing this family (1)
| Publication number | Priority date | Publication date | Assignee | Title |
|---|---|---|---|---|
| JP6034892B2 (ja) | 2015-01-27 | 2016-11-30 | ファナック株式会社 | ロボットの設置台の輝度が変化するロボットシステム |
Citations (1)
| Publication number | Priority date | Publication date | Assignee | Title |
|---|---|---|---|---|
| US5029475A (en) * | 1989-05-22 | 1991-07-09 | Agency Of Industrial Science And Technology | Measuring spatial distribution of spacings between point scatterers |
-
1991
- 1991-07-26 JP JP3187254A patent/JPH0535768A/ja active Pending
-
1992
- 1992-07-21 EP EP19920112449 patent/EP0525592A3/en not_active Withdrawn
Patent Citations (1)
| Publication number | Priority date | Publication date | Assignee | Title |
|---|---|---|---|---|
| US5029475A (en) * | 1989-05-22 | 1991-07-09 | Agency Of Industrial Science And Technology | Measuring spatial distribution of spacings between point scatterers |
Non-Patent Citations (4)
| Title |
|---|
| IEEE AEROSPACE AND ELECTRONIC SYSTEMS MAGAZINE vol. 6, no. 7 , 1 July 1991 , NEW YORK US pages 10 - 14 BUTTERFIELD 'Fractal interpolation of radar signatures for detecting stationary targets in ground clutter' * |
| PHYSICA D vol. 31 , 1988 , NORTH HOLLAND , AMSTERDAM pages 277 - 283 HIGUCHI 'Approach to an irregular time series on the basis of the fractal theory' * |
| PROCEEDINGS APPLICATIONS OF ARTIFICIAL NEURAL NETWORKS vol. 1294 , 18 April 1990 , ORLANDO , USA pages 86 - 93 KOUTSOUGERAS 'Neural networks in scene analysis' * |
| PROCEEDINGS DATACOMPRESSION CONFERENCE 8 April 1991 , SNOWBIRD , USA page 446 INDJIC 'Reduction in power system load data training sets size using fractal approximation theory' * |
Cited By (6)
| Publication number | Priority date | Publication date | Assignee | Title |
|---|---|---|---|---|
| WO1994028500A1 (fr) * | 1993-05-27 | 1994-12-08 | Max-Planck-Gesellschaft zur Förderung der Wissenschaften e.V., Berlin | Procede et systeme de filtrage spatial |
| US5822466A (en) * | 1993-05-27 | 1998-10-13 | Max-Planck-Gesselschaft Zur Forderburg Der Wissenschaften E. V | Method and means of spatial filtering |
| WO1995006927A1 (fr) * | 1993-08-31 | 1995-03-09 | Shell Internationale Research Maatschappij B.V. | Procede de prevention des reponses erronees de systemes optiques de detection, et appareil associe |
| SG97742A1 (en) * | 1993-08-31 | 2003-08-20 | Shell Int Research | A method and apparatus for preventing the occurence of false responses in optical detection devices |
| WO2001043067A2 (fr) * | 1999-12-10 | 2001-06-14 | Durand Technology Limited | Ameliorations relatives a des applications des techniques fractales et/ou chaotiques |
| WO2001043067A3 (fr) * | 1999-12-10 | 2002-05-10 | Durand Technology Ltd | Ameliorations relatives a des applications des techniques fractales et/ou chaotiques |
Also Published As
| Publication number | Publication date |
|---|---|
| JPH0535768A (ja) | 1993-02-12 |
| EP0525592A3 (en) | 1994-06-08 |
Similar Documents
| Publication | Publication Date | Title |
|---|---|---|
| Iqbal et al. | Fault detection and isolation in industrial processes using deep learning approaches | |
| Cabrera et al. | Automatic feature extraction of time-series applied to fault severity assessment of helical gearbox in stationary and non-stationary speed operation | |
| Zhang et al. | An adaptive neural-wavelet model for short term load forecasting | |
| Serdio et al. | Fault detection in multi-sensor networks based on multivariate time-series models and orthogonal transformations | |
| Raptodimos et al. | Application of NARX neural network for predicting marine engine performance parameters | |
| Khelif et al. | RUL prediction based on a new similarity-instance based approach | |
| US12067501B2 (en) | Localized temporal model forecasting | |
| Yang et al. | A control chart pattern recognition system using a statistical correlation coefficient method | |
| Javadpour et al. | A fuzzy neural network approach to machine condition monitoring | |
| CN112288021B (zh) | 一种医疗废水监测数据质控方法、装置及系统 | |
| Jeong et al. | Machine learning methodology for management of shipbuilding master data | |
| CN114386521A (zh) | 时间序列数据的异常检测方法、系统、设备和存储介质 | |
| CN115841255B (zh) | 基于在线分析的建筑工程现场预警方法及系统 | |
| Guo et al. | A CNN‐BiLSTM‐Bootstrap integrated method for remaining useful life prediction of rolling bearings | |
| CN111476278A (zh) | 一种气体浓度智能化检测系统 | |
| CN116481791A (zh) | 钢结构连接稳定性监测系统及其方法 | |
| Zhou et al. | Functional networks and applications: A survey | |
| CN116894211A (zh) | 用于生成能由人类感知的解释性输出的系统及用于监控异常识别的方法和计算机程序 | |
| Rawal et al. | Feature selection for electrical demand forecasting and analysis of pearson coefficient | |
| Gamero et al. | Process diagnosis based on qualitative trend similarities using a sequence matching algorithm | |
| EP0525592A2 (fr) | Système de traitement d'information avec des dimensions fractales | |
| JP3631118B2 (ja) | プラント診断装置 | |
| CN115017015B (zh) | 一种边缘计算环境下程序异常行为检测方法及系统 | |
| Cook et al. | Environmental statistical process control using an augmented neural network classification approach | |
| Almohsen et al. | Integrated artificial and deep neural networks with time series to predict the ratio of the low bid to owner estimate |
Legal Events
| Date | Code | Title | Description |
|---|---|---|---|
| PUAI | Public reference made under article 153(3) epc to a published international application that has entered the european phase |
Free format text: ORIGINAL CODE: 0009012 |
|
| AK | Designated contracting states |
Kind code of ref document: A2 Designated state(s): DE GB |
|
| PUAL | Search report despatched |
Free format text: ORIGINAL CODE: 0009013 |
|
| AK | Designated contracting states |
Kind code of ref document: A3 Designated state(s): DE GB |
|
| 17P | Request for examination filed |
Effective date: 19941026 |
|
| 17Q | First examination report despatched |
Effective date: 19950206 |
|
| STAA | Information on the status of an ep patent application or granted ep patent |
Free format text: STATUS: THE APPLICATION IS DEEMED TO BE WITHDRAWN |
|
| 18D | Application deemed to be withdrawn |
Effective date: 19990202 |