EP0519975B1 - Electro-optical methods and apparatus for high speed, multivariate measurement of individual entities in fiber or other samples - Google Patents
Electro-optical methods and apparatus for high speed, multivariate measurement of individual entities in fiber or other samples Download PDFInfo
- Publication number
- EP0519975B1 EP0519975B1 EP91905936A EP91905936A EP0519975B1 EP 0519975 B1 EP0519975 B1 EP 0519975B1 EP 91905936 A EP91905936 A EP 91905936A EP 91905936 A EP91905936 A EP 91905936A EP 0519975 B1 EP0519975 B1 EP 0519975B1
- Authority
- EP
- European Patent Office
- Prior art keywords
- light
- particles
- fiber
- sensors
- sensor
- Prior art date
- Legal status (The legal status is an assumption and is not a legal conclusion. Google has not performed a legal analysis and makes no representation as to the accuracy of the status listed.)
- Expired - Lifetime
Links
Images



Classifications
-
- G—PHYSICS
- G01—MEASURING; TESTING
- G01N—INVESTIGATING OR ANALYSING MATERIALS BY DETERMINING THEIR CHEMICAL OR PHYSICAL PROPERTIES
- G01N15/00—Investigating characteristics of particles; Investigating permeability, pore-volume or surface-area of porous materials
- G01N15/10—Investigating individual particles
- G01N15/14—Optical investigation techniques, e.g. flow cytometry
- G01N15/1456—Optical investigation techniques, e.g. flow cytometry without spatial resolution of the texture or inner structure of the particle, e.g. processing of pulse signals
- G01N15/1459—Optical investigation techniques, e.g. flow cytometry without spatial resolution of the texture or inner structure of the particle, e.g. processing of pulse signals the analysis being performed on a sample stream
-
- D—TEXTILES; PAPER
- D01—NATURAL OR MAN-MADE THREADS OR FIBRES; SPINNING
- D01G—PRELIMINARY TREATMENT OF FIBRES, e.g. FOR SPINNING
- D01G31/00—Warning or safety devices, e.g. automatic fault detectors, stop motions
- D01G31/003—Detection and removal of impurities
-
- D—TEXTILES; PAPER
- D01—NATURAL OR MAN-MADE THREADS OR FIBRES; SPINNING
- D01G—PRELIMINARY TREATMENT OF FIBRES, e.g. FOR SPINNING
- D01G31/00—Warning or safety devices, e.g. automatic fault detectors, stop motions
- D01G31/006—On-line measurement and recording of process and product parameters
-
- G—PHYSICS
- G01—MEASURING; TESTING
- G01B—MEASURING LENGTH, THICKNESS OR SIMILAR LINEAR DIMENSIONS; MEASURING ANGLES; MEASURING AREAS; MEASURING IRREGULARITIES OF SURFACES OR CONTOURS
- G01B11/00—Measuring arrangements characterised by the use of optical techniques
- G01B11/02—Measuring arrangements characterised by the use of optical techniques for measuring length, width or thickness
- G01B11/04—Measuring arrangements characterised by the use of optical techniques for measuring length, width or thickness specially adapted for measuring length or width of objects while moving
- G01B11/043—Measuring arrangements characterised by the use of optical techniques for measuring length, width or thickness specially adapted for measuring length or width of objects while moving for measuring length
-
- G—PHYSICS
- G01—MEASURING; TESTING
- G01N—INVESTIGATING OR ANALYSING MATERIALS BY DETERMINING THEIR CHEMICAL OR PHYSICAL PROPERTIES
- G01N33/00—Investigating or analysing materials by specific methods not covered by groups G01N1/00 - G01N31/00
- G01N33/36—Textiles
- G01N33/362—Material before processing, e.g. bulk cotton or wool
-
- G—PHYSICS
- G01—MEASURING; TESTING
- G01N—INVESTIGATING OR ANALYSING MATERIALS BY DETERMINING THEIR CHEMICAL OR PHYSICAL PROPERTIES
- G01N15/00—Investigating characteristics of particles; Investigating permeability, pore-volume or surface-area of porous materials
- G01N2015/0042—Investigating dispersion of solids
- G01N2015/0053—Investigating dispersion of solids in liquids, e.g. trouble
- G01N2015/0057—Investigating dispersion of solids in liquids, e.g. trouble of filaments in liquids
-
- G—PHYSICS
- G01—MEASURING; TESTING
- G01N—INVESTIGATING OR ANALYSING MATERIALS BY DETERMINING THEIR CHEMICAL OR PHYSICAL PROPERTIES
- G01N15/00—Investigating characteristics of particles; Investigating permeability, pore-volume or surface-area of porous materials
- G01N15/02—Investigating particle size or size distribution
- G01N15/0205—Investigating particle size or size distribution by optical means
- G01N2015/0238—Single particle scatter
-
- G—PHYSICS
- G01—MEASURING; TESTING
- G01N—INVESTIGATING OR ANALYSING MATERIALS BY DETERMINING THEIR CHEMICAL OR PHYSICAL PROPERTIES
- G01N15/00—Investigating characteristics of particles; Investigating permeability, pore-volume or surface-area of porous materials
- G01N15/10—Investigating individual particles
- G01N2015/1027—Determining speed or velocity of a particle
-
- G—PHYSICS
- G01—MEASURING; TESTING
- G01N—INVESTIGATING OR ANALYSING MATERIALS BY DETERMINING THEIR CHEMICAL OR PHYSICAL PROPERTIES
- G01N15/00—Investigating characteristics of particles; Investigating permeability, pore-volume or surface-area of porous materials
- G01N15/10—Investigating individual particles
- G01N15/14—Optical investigation techniques, e.g. flow cytometry
- G01N2015/1497—Particle shape
-
- G—PHYSICS
- G01—MEASURING; TESTING
- G01N—INVESTIGATING OR ANALYSING MATERIALS BY DETERMINING THEIR CHEMICAL OR PHYSICAL PROPERTIES
- G01N21/00—Investigating or analysing materials by the use of optical means, i.e. using sub-millimetre waves, infrared, visible or ultraviolet light
- G01N21/84—Systems specially adapted for particular applications
- G01N21/88—Investigating the presence of flaws or contamination
- G01N21/94—Investigating contamination, e.g. dust
-
- G—PHYSICS
- G01—MEASURING; TESTING
- G01N—INVESTIGATING OR ANALYSING MATERIALS BY DETERMINING THEIR CHEMICAL OR PHYSICAL PROPERTIES
- G01N33/00—Investigating or analysing materials by specific methods not covered by groups G01N1/00 - G01N31/00
- G01N33/36—Textiles
Definitions
- the present invention relates to an apparatus for rapidly transporting, classifying and measuring characteristics of single particles like textile fibers, neps or trash and particularly relates to measuring the speed, length, width characteristics and surface characteristics of single fibers in a fluid flow.
- this invention is in the field of electro-optical measurement of the physical properties of fibers and aerosols; the invention is part of and enables a system whereby heretofore impossibly accurate, precise, reliable, fast, and cost-effective information can be generated on a wide variety of physical properties of fibers and aerosols.
- AFIS Advanced Fiber Information Systems
- Another objective is to provide a fiber testing system and method which, in combination with other features and measurements, such as single fiber strength or color, enables a single operator HVI System with test zone environmental control and which can ultimately operate at test times of 1/4 minute.
- a further objective is to provide aerosol testing apparatus and methods which enable laboratory quality control instruments or ultimately, on-line, closed-loop control systems for aerosol manufacturing.
- a more specific objective of this electro-optical invention is to enable measurement of fiber or aerosol speed and acceleration in the scattering zone and to use this data to provide more absolute readings of length and improved readings of other physical characteristics such as diameter, fineness, maturity, color, shape, and surface roughness and the like.
- a still further objective of the invention is to provide for simultaneous measurement of 2 or more scattering angles.
- a similar further objective is to provide for measurement suing simultaneously-emitted electromagnetic radiation components having 2 or more principal or mean wavelengths and 2 or more states of polarization.
- the ultimate objective is to optimally combine these new electro-optical sensor means with suitable fiber or aerosol individualizer means and modern electronics means into systems which provide more and better fiber or aerosol information, as demanded by modern manufacturing.
- an apparatus for rapidly transporting, classifying and measuring characteristics of single particles like textile fibers, neps or trash is defined in claim 1 and claim 2.
- the light beam is a collimated beam and the light sensor means are comprised of a first and a second light sensor both disposed for receiving light from the collimated beam and being dimensioned and positioned to detect the extinction of light caused by the particles passing through the collimated beam of light and for generating an extinction signal.
- the extinction signals do not only furnish information of the speed of the particles but they also contain information as to the amount of light extinguished by the particle and this information corresponds to the ribbon width of the particle. Since most cotton fibers are not circular they will not have a uniform width when viewed from one side. Rather, they will appear more like a twisted ribbon and, thus, the width of the fiber will vary depending upon the angle at which it is viewed. However, as the fiber passes through the sample chamber, an average or mean ribbon width may be determined by observing the amount of light extintion caused by the fiber as it passes through the sample chamber.
- a second preferred embodiment of the apparatus is characterised by a third light sensor being dimensioned and positioned for receiving forward light scattering caused by particles passing through the light beam, and for generating a scattered light signal.
- the forward light scattering contains information as to the surface properties of the fiber, and in particular, the forward light scattering corresponds well to the micronaire value for the fiber and, therefore corresponds to fiber circularity and maturity.
- the first and second sensors provide extinction mode signals and they correspond proportionately with the micronaire value of a fiber and inversely with circularity and maturity. Thus, by using combinations of the signals from the first and/or second sensor and the third sensor (extinction and scattered mode combined) one may generate signals corresponding to circularity, cross sectional area, maturity, geometric shape and other parameters.
- FIG. 1 a block diagram of apparatus 10 which constitutes a preferred embodiment of the present invention.
- apparatus 10 is intended for measuring fibers, it will be understood that the apparatus 10 also measures properties of non-fiber entities such as aerosols.
- a fiber sample 12 such as a sample of cotton
- the fiber individualizer 14 is manufactured by Zellweger Uster of Knoxville, Tennessee as part of the AFIS 0 system.
- a fluid stream, preferably an air stream, is formed in the conduit 16 flowing from the fiber individualizer 14 to a sensor and sample region 18.
- the conduit 16 delivers single fibers, one at a time, to the sensor and sample region 18 wherein the fibers are sensed and electronic signals are generated corresponding to properties of each fiber. These signals are transmitted through lines 20 to an electronic system 22 that conditions and analyzes the signals and stores information corresponding to received signals which also correspond to the properties of the fibers being analyzed.
- a conduit 24 extends between the sensor and sample region 18 and a suction source 26.
- the suction source 26 applies a suction to the conduit 24 which in turn creates a suction in the region 18 and the conduit 16 thereby creating the fluid stream.
- FIG. 2a there is shown a somewhat diagrammatic side view of a portion of region 18.
- a nozzle block 28 is provided for holding a pair of nozzles 20 and 32 in a spaced apart facing relationship.
- Nozzle 30 is connected to receive fluid flow and fibers from conduit 16 and is referred to herein as an accelerating nozzle 30 because the fluid and fibers are accelerated as they pass through nozzle 30.
- nozzle 32 is connected with conduit 24 and is referred to herein as a decelerating nozzle 32 because fibers and fluid are decelerated as they enter into the nozzle 32.
- Nozzles 30 and 32 are facing one another at their tapered ends so that the suction applied by the conduit 24 creates a fluid flow that is aligned with the conduits 24 and 26 and is aligned with the center axes of the conically shaped nozzles 30 and 32, since the nozzles 30 and 32 are aligned, the accelerated fibers exit the accelerating nozzle 30, travel directly across the gap between the nozzles 30 and 32 and enter the decelerating nozzles 32.
- a beam of collimated light 34 that illuminates the gap between the nozzles 30 and 32.
- the gap between nozzles 30 and 32 is sometimes herein referred to as the measurement zone.
- the region 18 includes a sample chamber 36 that seals the area around the nozzles 30 and 32 ( Figure 2a) so that the suction provided by the conduit 24 ( Figure 1 and 2a) creates fluid flow in the nozzle 30 and conduit 16 ( Figures 1 and 2a).
- a collimated beam of light 34 preferably having a wavelength of 880mm, enters the sample chamber 36 through an optical window 38 formed therein. The collimated beam of light 34 then passes through the aperture 34 which is formed in the block 28 and impinges upon the gap between the nozzles 30 and 32 (best shown in Figure 2a).
- the fibers that pass between the nozzles 30 and 32 will cause extinction of some of the light of the collimated beam 34 and will cause scattering of the light.
- Zero degree forward scattering of the light is illustrated by the dashed lines 42 and forward scattering caused by the fibers at an angle of about forty (40°) degrees is illustrated by the dashed line 44.
- Zero degree forward scattered light is primarily indicative of the light extinction caused by the fibers and extinction sensors such as light sensor 46b are disposed to receive and sense such zero degree forward scattered light. Although there are two extinction sensors, only the one sensor 46b is shown in Figure 2a and the other sensor is hidden behind sensor 46b.
- a circular shield 48 and a lens 50 are disposed behind the extinction sensor 46b and are operable to collect and focus any forty (40°) degree scattered light 44 onto a light sensor 52.
- a plan view of the sensors 46a and 46b are shown in Figure 3.
- the fluid flow is indicated by arrows 51 and 54 and a fiber 56 is shown exiting the nozzle 30 and passing in front of the sensors 46a and 46b.
- sensors 46a and 46b will respond to the full intensity of the collimated light beam 34 in the absence of any fibers disposed in the beam 34 and, in the presence of fibers in the beam 34, the sensors 46a and 46b will receive the full intensity of the light beam 34 less the amount of light extinction caused by the fiber 56 and less the amount of light scattered around the sensors 46a and 46b by the fiber 56.
- the reduction in light received by the sensors 46a and 46b in the presence of a fiber 56 will be primarily due to the extinction of light caused by the fiber 56.
- the circular shield 48 and the lens 50 are shown in Figure 3 . It will appreciated that the shield 48 and lens 50 form an annular aperture 58 that receives forward scattered light at an angle of about forty (40°) degrees with respect to the direction of the collimated beam 34 wherein the forty (40°) degree angle is rotated three hundred and sixty (360°) degrees about the directional axis of the collimated beam 34.
- sensors 46a and 46b are matched solid state photo detectors that are manufactured on a single chip by Silicon Detector Corp.
- the distance 60 between the left edge of sensor 46a and the left edge of 46b is 530 microns.
- the distance between the centers of sensors 46a and 46b and the right edges of sensors 46a and 46b is also 530 microns.
- the distance 62 between the right edge of sensor 46a and the left edge of sensor 46b is approximately 20 microns, and the distance 64 between the tops and bottoms of the sensors 46a and 46b is 4.57 millimeters.
- Sensors 46a and 46b are used primarily to detect light extinction caused by the fibers, such as fiber 56 shown in Figure 3. However, it is not intuitively apparent that the sensors 46a and 46b would be capable of measuring such extinction with sufficient accuracy to determine the position of fiber 56.
- a cotton fiber has a ribbon width of approximately 20 micrometers. Because of this small ribbon width, when light impinges upon the cotton fiber, it rapidly diffracts behind the fiber and creates a diffuse diffraction pattern. In other words, because the fiber is so small, it does not cast a shadow with sharp edges as one might expect with a larger object. The diffraction pattern or the near zero degrees forward scattered light does not resemble a shadow in the ordinary sense of the word.
- the sensors 46a and 46b will, in fact, detect the extinction caused by the fibers with sufficient accuracy to enable one to determine the presence of the leading and trailing edges of the fiber and the presence of other physical characteristics of the fiber. In other words, even though the diffraction and extinction effects of the fiber may be spread over a relatively large region of the sensors 46a and 46b as compared to the ribbon width of the fiber, the sensors 46a and 46b are still capable of producing signals indicating when the leading and trailing edges of the fibers pass in front of the sensors 46a and 46b. Also, the signals from the sensors 46a and 46b may be compared based on peaks and valleys in the two signals and, thus, the speed of the fiber may be repetitively calculated for different positions of the fiber in time and space.
- the dimensions of the sensors 46a and 46b are relatively small in a direction parallel to the travel of the fibers. However, in a direction perpendicular to the travel direction of the fibers, the sensors have a relatively large dimension which will enable the sensors to sense light extinction even if the fibers do not pass through the same general area each time. Also, even though the diffraction pattern created by a sensor may be much larger than the fiber itself, the entire pattern will still fall on the sensors 46a and 46b, at least in a direction perpendicular to the travel of the fiber. In other words, the fibers will be traveling in the x-direction as indicated in Figure 4, and the diffraction pattern created by the fiber will be blurred and magnified in the z-direction.
- the sensors 46a and 46b will still receive the extinction data along the z-direction. It is the receipt of this extinction data in the z-dimension that allows detection of physical features of the fiber with sufficient resolution to enable precise timing of the fiber flight.
- the fiber 56 has a leading end 66 and trailing end 68. When the leading end 66 first enters the beam 34, it scatters light and causes light extinction.
- the dashed line 70 represents light that is scattered by the fiber 56 from the left-most side of the beam 34 at a forward scattering angle of fifty (50) degrees.
- dashed line 72 represents thirty (30°) degree forward scattered originating at the left side of the light beam 34.
- dashed line 74 represents fifty (50°) degree scattered light originating at the right side of the beam 34 and dashed line 76 represents thirty (30°) degree scattered light originating at the right side of beam 34.
- the light between dashed lines 70 and 72 and between dashed lines 74 and 76 is collected by the lens 50 and focused upon the sensor 52.
- the lens 50 will collect forward scattered light in an annular pattern as best shown in Figure 3 that is scattered at an angle of between thirty and fifty degrees.
- the light detected by sensors 46a and 46b is converted into electrical signals which are transmitted through lines 78 and 80 to amplifiers 82 and 84 and then to conditioning electronics 86.
- the light that is focused by the lens 50 onto the sensor 52 is converted to an electrical signal which is transmitted through line 88 and amplifier 90 to the conditioning electronics 86.
- the electronics 86 are conditioned to detect decreases in voltages which correspond to the extinction of light caused by fibers 56 passing in front of the sensors 46a and 46b.
- the signal received from the sensors 46a and 46b may be displayed in the analog domain on display 92 which, preferably, is an oscilloscope.
- the signals are converted to digital form and are transmitted to the computer 94 where they are stored and further analyzed.
- a display 96 is also connected to the computer 94 so that visual displays may also be generated from the digital data corresponding to the signals from sensors 46a and 46b.
- the signal from sensor 52 will increase in voltage in the presence of a fiber 56 which is opposite to the effect that the fiber 56 has on the light received by sensors 46a and 46b.
- the conditioning electronics 86 is adapted to detect increases in the voltage of the signal from the sensor 52.
- the signals from sensor 52 may be shown on display 92 in the analog domain and are converted to digital form and stored in the computer 94. Again, the digital data corresponding to the signals from the sensor 52 may be shown on display 96.
- Figure 6 shows an oscilloscope display of two signals 100 and 102 that represent signals received from the sensors 46a and 46b, respectively.
- the x-axis of the graph represents time and the y-axis of the graph represents the voltage of the signal.
- signal 100 is shifted significantly above signal 102, it should be understood that the base line voltages of two signals are very nearly the same.
- the graph of signal 100 has been shifted upwardly with respect to the graph of signal 102 for the purpose of illustration. In other words, the zero base line of signal 100 is significantly above the zero base line of signal 102.
- the graph of signal 100 rises rapidly and after the signal has risen to a predetermined level, indicated by reference character 104, one assumes that the leading end of the fiber is passing a predetermined point in space immediately in front of the detector 46a.
- the signal 102 increases to a predetermined voltage indicated by reference character 106
- the leading end of the fiber is positioned at a predetermined point immediately in front of the sensor 46b.
- the reference characters 104 and 106 indicate points on the two graphs that are the same predetermined voltage above a zero voltage reference line for the particular graph, and it will be appreciated that the signal 100 reaches the predetermined level indicated by character 104 slightly before signal 102 reaches the predetermined level indicated by character 106. This difference represents the time that is required for the leading end of the fiber to travel from a predetermined point in front of the sensor 46a to a corresponding point in front of the sensor 46b.
- the difference in time between the positions indicated by characters 108 and 110 represents the time required for the trailing end of the fiber 56 to travel from a predetermined point in front of sensor 46a to a corresponding point in front of sensor 46b. Also, by observing the characteristic peaks and valleys of the two signals, it will be observed that the peaks and valleys of signal 100 occur before the peaks and valleys of the signal 102. These peaks and valleys represent physical characteristics of the fiber and the occurrence of the peak in signal 100 indicates that a particular physical feature has appeared in front of the sensor 46a. Then, the corresponding peak or valley in signal 102 indicates that the same physical feature has appeared in front of the sensor 46b. By comparing the time positions of the peaks and valleys as between signals 100 and 102, one may again calculate the time required for these physical characteristics to pass from the sensor 46a to the sensor 46b.
- the two peaks indicated by character 112 are further apart than the peaks indicated by the character 114. This means that the leading end of the fiber requires greater time than the trailing end of the fiber to travel the same distance. Thus, the leading end of the fiber was traveling more slowly when it passed sensors 46a and 46b than the trailing end of the fiber.
- the computer 94 By measuring the time distance between corresponding peaks in the two signals all along the signals, one may accurately determine the actual speed of the fiber at different time and space positions and acceleration is calculated by the computer 94 based upon the change in speed and the time between the two measurements based upon the knowledge that the change in speed equals acceleration multiplied by time. It has been discovered that the acceleration of the fiber is not linear; it is slightly parabolic.
- the acceleration is sufficiently close to linear that the length of a fiber can be accurately determined by measuring the leading end speed, the trailing end speed and averaging the two speeds to determined a mean speed of the fiber.
- the length of a fiber In order to determine the length of a fiber, one first determines the time difference between when the leading end passes a particular point in front of one of the sensors 46a or 46b and when the trailing end passes that same point. Multiplying this time difference by the mean speed will produce a product that is equal to the length of the fiber.
- Another method of finding the fiber speed is to determine the times required for the leading end to travel from a point in front of sensor 46a to a point in front of sensor 46b (the leading end time) and to determine the time required for the trailing end to pass between the same two points (the trailing end time). Then, the leading end time and trailing end time are averaged to determine an average time. Fiber speed is then determined by dividing the distance between the two points by the time average. Since the acceleration of the fiber is not constant, the average or assumed fiber speed differs depending on which of the above two methods are used to calculate speed, but either is more accurate than assuming constant speed or measuring speed once. Also, other mathematical models may be used to predict average speed, fiber speed or fiber length based on two or more time measurements.
- the integrated area beneath the graphs of signals 102 and 104 corresponds well to the average or mean ribbon width of the fiber.
- the average amplitude of the signal generated by sensors 46a or 46b constitutes or indicates the mean ribbon width of the fiber.
- the computer 94 generates data corresponding to mean ribbon width by calculating and storing the average amplitude of the signal received from one of the sensors 46a or 46b.
- fiber length and ribbon width have been determined by computer 94, it further calculates the aspect ratio of the fiber (length/ribbon width) which constitutes shape information.
- the computer 94 also records the average frequency of the signals from sensors 46a and 46b and this is further shape information because the frequency indicates the amount of low frequency convolutions in the fiber.
- both Figures 6 and 7 show increasing voltages in the presence of a fiber 56 in the light beam 34 and in front of the sensors 46a and 46b.
- the amount or intensity of the light on the sensors 46a and 46b is decreased by the presence of a fiber 56 in front of the sensors.
- the conditioning electronics inverts the signals so that a decreasing signal from sensors 46a and 46b is represented by an increasing signal on the display 92 which is preferably an oscilloscope.
- the computer 94 records V s and V e for each fiber in addition to the other information discussed above such as length and ribbon width. After all sample fibers are tested, the computer 94 then makes the appropriate calculations to determine A - , ⁇ - and Mic, if desired, using V s and V e .
- FIG 8 there is shown another embodiment of the present invention in which a pair of backscattering sensors 100 and 102 are disposed to receive light that is backscattered from the beam 34 by the fiber 56.
- the light source 33 provides a collimated beam 34 of white light (a broad wavelength distribution) to facilitate color measurements.
- a filter 104 is placed in front of the detector 100 and a lens 106 is provided to focus light that is transmitted by the filter 104 onto the detector 100.
- a filter 108 is disposed in front of the detector 102 and a lens 110 is provided for focusing light that is transmitted through the filter 108 onto the detector 102.
- a filter 112 is disposed in front of the detectors 46a and 46b and a filter 114 is positioned in front of the detector 52.
- all the detectors in the embodiment in Figure 8 receive light through a filter.
- the filters 104, 108, 112 and 114 are controlled by the conditioning electronics 86 and the computer 94 through lines 116, 118, 120 and 122. By applying signals through these lines, the conditioning electronics 86 may control the polarity and the wavelength responses of the filters 104, 108, 112 and 114. In this manner, the apparatus of Figure 8 is operable to observe polarity characteristics and color characteristics produced by the fiber 56 in a forward scattering mode (filter 114 and detector 52), an extinction mode or near zero forward scattering mode (sensors 46a and 46b and filter 112), and in a backscattering mode (filters 104 and 108 and detectors 100 and 102). Although all of the filters may be used to detect color or polarization information, it is preferred to use filter 104 and detector 110 to observe the grayness of cotton fibers and it is preferred to use filter 108 and detector 102 to observe the yellowness of cotton fibers.
- polarity information primarily through filters 112 and 114 and detectors 46a and 46b and 52.
- the information concerning grayness, yellowness and polarity is transmitted through the conditioning electronics and stored in the computer 94 for each fiber tested.
- the present invention is capable of very accurately measuring the speed of a fiber and using the speed to calculate the length of the fiber.
- the mean ribbon width is rapidly determined and, using forward scattered light information, a surface data signal is generated that is indicative of fiber surface properties.
- the surface data signal (V s ) is directly related to micronaire and, using formulas 1, 2 and 3, ⁇ - and A - may be calculated.
- the present invention is capable of analyzing single fibers from a sample with rapidity and, since characteristics of each fiber are measured, multivariate data is generated by computer 94.
- the computer calculates length vs. diameter distribution for the sample and may also calculate other multivariate distributions based on any of the characteristics measured such as color, shape, micronaire, A - , ⁇ - or others.
Landscapes
- Chemical & Material Sciences (AREA)
- Engineering & Computer Science (AREA)
- General Physics & Mathematics (AREA)
- Textile Engineering (AREA)
- Life Sciences & Earth Sciences (AREA)
- Physics & Mathematics (AREA)
- Health & Medical Sciences (AREA)
- Analytical Chemistry (AREA)
- Biochemistry (AREA)
- General Health & Medical Sciences (AREA)
- Immunology (AREA)
- Pathology (AREA)
- Dispersion Chemistry (AREA)
- Food Science & Technology (AREA)
- Medicinal Chemistry (AREA)
- Investigating Or Analysing Materials By Optical Means (AREA)
- Treatment Of Fiber Materials (AREA)
- Length Measuring Devices By Optical Means (AREA)
- Sampling And Sample Adjustment (AREA)
Abstract
Description
- The present invention relates to an apparatus for rapidly transporting, classifying and measuring characteristics of single particles like textile fibers, neps or trash and particularly relates to measuring the speed, length, width characteristics and surface characteristics of single fibers in a fluid flow.
- Demands for more and better information on fiber properties have steadily risen fromm the beginning of the industrial revolution until today. Production rates of textile processing machinery have dramatically increased, especially in the past 25 years. Tolerances for variations in fiber properties have, correspondingly, dramatically decreased as speed and quality demands have risen. To achieve better control over quality, while increasing production speed, represents a major challenge for modern manufacturing, a challenge which can only be met with improved information, in vastly increased quantities, about the raw materials of textile manufacturing, fibers, both natural (cotton, wool, etc.) and man-made (polyester, nylon, etc.).
- These observations about modern textile manufacturing apply as well to modern aerosol manufacturing. Production rate increases and decreases in tolerance for variations in particular sizes demand more and better information as well.
- Accordingly, this invention is in the field of electro-optical measurement of the physical properties of fibers and aerosols; the invention is part of and enables a system whereby heretofore impossibly accurate, precise, reliable, fast, and cost-effective information can be generated on a wide variety of physical properties of fibers and aerosols.
- A brief historical overview of prior art in the fiber testing will clarify the relation of this system to it and especially the major improvements this invention makes in fiber testing. A similar overview could beset forth for aerosol testing.
- In the mid-1800s, when only natural fibers were available, the revolutionary technology of that period, water-or steam-powered machinery, already demanded more and better information.
- Standards for cotton, for example, were established and cotton classers or graders painstakingly learned and applied their trade to assure that "smooth and even-running" lots were delivered to the mills. The Liverpool Staple Standards became the most widely used until, in the early 1900's, the United States Department of Agriculture began to dominate, world-wide, the definition, preparation, and supply of standard cotton materials, which they do even today.
- In the 1960's, in response to demands for more and better information, the USDA began to consolidate developments in instrumental fiber testing. One approach, conducted by Stanford Research Institute for the USDA, was to measure cotton fiber length and diameter electro-optically. The fibers were individually presented to the measurement zone by a combination of aerodynamic and electro-static forces. Severe difficulties with the generation and the presentation of single fibers and low data rate, less than 1 fiber/second, led to abandonment of this approach.
- The successful approach to so-called "High Volume Instrument" lines simply used faster-operating versions of already-existing laboratory instruments. These instruments indirectly measure fiber length, strength, diameter, and color. Prototypes were completed by the mid-1970's but the technology was rejected by certain parties in the trade and lay dormant until 1980 when pressure from dissatisfactions with manual classing caused farmers in Lamesa, Texas to insist on HVI. Today about 50% of US cotton is classed by HVI; by 1992, almost 100% will be. It is expected that most of the world cotton crop will be instrument-classed by around the year 2000, not necessarily with current-generation, but with improved fiber testing instrument technology, some of which is the subject matter of this invention.
- The basic technology for current generation HVI measurements is 25-75 years old except for the computers used to automate them and to process the data. It is becoming clear, unfortunately, that these older test methods do not and cannot provide the advanced fiber information, the "more and better information" required by modern textile processing.
- Two or more operators are required and testing time averages about 1/2 minute. Never-the-less, current generation HVI has enabled a major marketing breakthrough.
- It was recognized in the early 1980's that Research and Development upon the next generation HVI must begin as soon as possible and even before HVI was widely accepted or even widely known. The concept advanced by the first-named inventor of this invention, that of measuring, directly and at high speed, physical properties of single entities in the fiber sample, were accepted by forward-looking leaders in fiber testing and marketing as a candidate technology. These more basic measurements provide the more and better information needed by modern textile manufacturing. They are more basic because single entities (single fibers, single neps, single trash particles, single microdust particles, etc.) are directly measured rather than indirectly by measuring bulk or bundle properties.
- Equally importantly, they are more basic because statistical distributions are easily formed with the aid of modern electronics technology. These concepts led to various prototype systems that are called the Advanced Fiber Information Systems (AFIS) and consist of: (1) aeromechanical separator or fiber individualizer, (2) high speed, single entity sensors, and (3) high information rate, personal-type computer. Only the latter is well-known in the art of modern electronics.
- The aeromechanical separator is described in US Patents 4,512,060; 4,631,781: and 4,686,744.
- Prior art electro-optical sensors are described in US Patents 4,249,244; 4,396,286; 4,473,296; and 4,885,473.
- For AFIS fiber testing applications, various open literature contributions have been made such as:
- 1. "Advanced Fiber Information Systems: A New Technology for Evaluating Cotton:, by F.M. Shofner, G.F. Williams, C.K. Bragg, and P.E. Sasser (December 88 presented at the Textile Institute Conference Fiber Science Group, U.K.).
- 2. "Advanced Technology for Measuring Cotton Fiber Length, Diameter, and Trash Content" by C.K. Bragg (March 88).
- 3. Objective Method for Counting and Sizing Neps" by P.F. Sasser (March 88).
For simplicity, we refer to our prior art, prototypical, electro-optical (E-O) fiber testing technology and embodiments as AFIS-0. AFIS-0 included a fiber individualizer, a fluid stream, a nozzle for accelerating the fluid stream, a converging beam of light and a forward light scattering detector. It did not include, among other things, a speed sensor, an extinction mode sonsor or a substantially collimated beam of light. We refer to the improved E-O technology for fiber and aerosol testing of this invention as AFIS-1. It will be seen that AFIS 1 provides new data products, some previously impossible, and new E-O means, over AFIS-0. - Practical experience with AFIS-0 demonstrated that the concepts of high speed measurement of single entities, followed by calculation of statistical distributions, are urgently needed. Prior art measurements are inceasingly seen as inadequate and even misleading for modern textile manufacturing. Indeed, recently-accelerating demands for more and better information provided the motivation to research and to develop these AFIS-1 improvements over AFIS-0, which itself already provided improvements over current-generation HVI.
- Other prior art devices for the measurement of various properties of fibers are incapable of operating at the high processing speeds of the AFIS-1 device which is the subject of this disclosure. For example, Duncan, U,S. Patent No. 3,816,001, discloses an apparatus and method for measuring length of textile staple filament specimens which consists of a capillary tube through which fibers are transported by an airflow. The capillary tube has a diameter on the order of the size of the fiber and orients and straightens the fiber by virtue of this size. Multiple light source/detector units are spaced along the length of the capillary in order to measure the speed of the fiber. However, this Duncan device is incapable of operating at the speeds of the AFIS-1 apparatus, and would be incapable of handling the fiber neps and trash which are likely to be present in samples tested by an apparatus such as AFIS-1 apparatus.
- A different type of particle measurement system is disclosed in International Application No. WO89/01619. This device utilizes the well-known aerodynamic particle sizing technique which correlates the size of a particle to its time of flight over a predeterminded distance. This device relies on the principle that the cross-sectional characteristics of a particle will determine the aerodynamic properties of the particle and thus, larger particles will experience greater aerodynamic drag and take a longer time to traverse the set distance.
- Other particle and fiber measurement systems which are similarly not adaptable to the AFIS-1 objective are disclosed in U.S. Patent No. 4,027,162; French Patent Application No.2408117 which discloses apparatus comprising a capillary tube through which fibers are transported by a flow of a liquid. As the capillary tube has a diameter on the order of the size of a fiber, this apparatus is incapable of handling fiber neps and trash and it is also incapable of operating at the speeds of AFIS-1 apparatus. European Patent Application No. 0255009, and in "Faserforschung und Textiltechnik", vol. 25, no. 2, 1975, article by E.W. Unger, pages 528-536.
- Accordingly, it is the broadest objective of this invention to provide improved fiber and aerosol measurements over prior art, including AFIS 0. The improvements are in all major categories of accuracy, precision, reliability, speed, and cost-effectiveness. Most importantly, the E-O improvements herein disclosed provide more basic information than previously possible. Said improvements also take into account the fact that particles in the AFIS art accelerating in the sample region. In this manner, the results of calculations based on time delay measurements are improved.
- Another objective is to provide a fiber testing system and method which, in combination with other features and measurements, such as single fiber strength or color, enables a single operator HVI System with test zone environmental control and which can ultimately operate at test times of 1/4 minute.
- A further objective is to provide aerosol testing apparatus and methods which enable laboratory quality control instruments or ultimately, on-line, closed-loop control systems for aerosol manufacturing.
- Another objective is to provide monovariate statistical distribution information on at least these entities in fiber samples: length, diameter, fineness, maturity, color, shape, surface roughness, for the fibers themselves; neps; trash particles; dust and microdust particles. Neps, trash, dust and microdust are regarded as undesirable elements in the fibrous mass. Yet another objective is provision of multivariate statistical distribution information as, for example, bivariate distributions in fiber length and diameter or trivariate distributions in particle diameter, shape, and surface roughness. Whereas the broader user-related objectives provide for more and better information on physical characteristics of fibers or aerosols, a more specific objective of this electro-optical invention is to enable measurement of fiber or aerosol speed and acceleration in the scattering zone and to use this data to provide more absolute readings of length and improved readings of other physical characteristics such as diameter, fineness, maturity, color, shape, and surface roughness and the like. A still further objective of the invention is to provide for simultaneous measurement of 2 or more scattering angles.
- A similar further objective is to provide for measurement suing simultaneously-emitted electromagnetic radiation components having 2 or more principal or mean wavelengths and 2 or more states of polarization.
- The ultimate objective is to optimally combine these new electro-optical sensor means with suitable fiber or aerosol individualizer means and modern electronics means into systems which provide more and better fiber or aerosol information, as demanded by modern manufacturing.
- In accordance with the present invention, an apparatus is provided for rapidly transporting, classifying and measuring characteristics of single particles like textile fibers, neps or trash is defined in claim 1 and claim 2.
- In the apparatus the light beam is a collimated beam and the light sensor means are comprised of a first and a second light sensor both disposed for receiving light from the collimated beam and being dimensioned and positioned to detect the extinction of light caused by the particles passing through the collimated beam of light and for generating an extinction signal.
- The extinction signals do not only furnish information of the speed of the particles but they also contain information as to the amount of light extinguished by the particle and this information corresponds to the ribbon width of the particle. Since most cotton fibers are not circular they will not have a uniform width when viewed from one side. Rather, they will appear more like a twisted ribbon and, thus, the width of the fiber will vary depending upon the angle at which it is viewed. However, as the fiber passes through the sample chamber, an average or mean ribbon width may be determined by observing the amount of light extintion caused by the fiber as it passes through the sample chamber.
- A second preferred embodiment of the apparatus is characterised by a third light sensor being dimensioned and positioned for receiving forward light scattering caused by particles passing through the light beam, and for generating a scattered light signal.
- The forward light scattering contains information as to the surface properties of the fiber, and in particular, the forward light scattering corresponds well to the micronaire value for the fiber and, therefore corresponds to fiber circularity and maturity. The first and second sensors provide extinction mode signals and they correspond proportionately with the micronaire value of a fiber and inversely with circularity and maturity. Thus, by using combinations of the signals from the first and/or second sensor and the third sensor (extinction and scattered mode combined) one may generate signals corresponding to circularity, cross sectional area, maturity, geometric shape and other parameters.
- The present invention may best be understood by reference to a Detailed Description of preferred embodiments when considered in conjuntion with the DRAWINGS in which:
- Figure 1 is a block diagram of the single particle measuring apparatus;
- Figures 2a and 2b are somewhat diagrammatic side views of the sensor and sample region of the apparatus in which Figure 2b is rotated in a horizontal plane approximately ninety (90°) degrees with respect to Figure 2a;
- Figure 3 is a partial diagrammatic view of the nozzles and sensors that are disposed in the sample region;
- Figure 4 is an illustration of two spaced apart extinction sensors used in the sensor and sample region of the apparatus;
- Figure 5 is a diagrammatic plan view illustrating the operation of the sensors and the interconnection of the sensors with conditioning electronics and a computer;
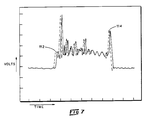
- Figure 6 is a graph of typical signals produced by two extinction sensors when a fiber passes in front of them;
- Figure 7 is a graph showing the signals of the two extinction sensor superimposed one on the other illustrating the time delay between the two signals; and
- Figure 8 is a diagrammatic view of an embodiment showing sensors for backscattered light and filters for determining color and polarization properties of the fibers.
- Referring now to the drawings in which like reference characters designate like or corresponding parts throughout the several views, there is shown in Figure 1 a block diagram of
apparatus 10 which constitutes a preferred embodiment of the present invention. Although thisapparatus 10 is intended for measuring fibers, it will be understood that theapparatus 10 also measures properties of non-fiber entities such as aerosols. Afiber sample 12, such as a sample of cotton, is provided to afiber individualizer 14 which separates single fibers from thesample 12 and delivers the single fibers to aconduit 16. Thefiber individualizer 14 is manufactured by Zellweger Uster of Knoxville, Tennessee as part of the AFIS 0 system. A fluid stream, preferably an air stream, is formed in theconduit 16 flowing from thefiber individualizer 14 to a sensor andsample region 18. Thus, theconduit 16 delivers single fibers, one at a time, to the sensor andsample region 18 wherein the fibers are sensed and electronic signals are generated corresponding to properties of each fiber. These signals are transmitted throughlines 20 to anelectronic system 22 that conditions and analyzes the signals and stores information corresponding to received signals which also correspond to the properties of the fibers being analyzed. - A
conduit 24 extends between the sensor andsample region 18 and asuction source 26. Thesuction source 26 applies a suction to theconduit 24 which in turn creates a suction in theregion 18 and theconduit 16 thereby creating the fluid stream. - Referring now to Figure 2a, there is shown a somewhat diagrammatic side view of a portion of
region 18. Anozzle block 28 is provided for holding a pair ofnozzles Nozzle 30 is connected to receive fluid flow and fibers fromconduit 16 and is referred to herein as an acceleratingnozzle 30 because the fluid and fibers are accelerated as they pass throughnozzle 30. In a similar manner,nozzle 32 is connected withconduit 24 and is referred to herein as a deceleratingnozzle 32 because fibers and fluid are decelerated as they enter into thenozzle 32.Nozzles conduit 24 creates a fluid flow that is aligned with theconduits nozzles nozzles nozzle 30, travel directly across the gap between thenozzles nozzles 32. - Also illustrated in Figure 2a is a beam of collimated light 34 that illuminates the gap between the
nozzles nozzles - Referring to Figure 2b, additional details of the sensor and sample region are shown diagrammatically. The
region 18 includes asample chamber 36 that seals the area around thenozzles 30 and 32 (Figure 2a) so that the suction provided by the conduit 24 (Figure 1 and 2a) creates fluid flow in thenozzle 30 and conduit 16 (Figures 1 and 2a). A collimated beam oflight 34, preferably having a wavelength of 880mm, enters thesample chamber 36 through an optical window 38 formed therein. The collimated beam of light 34 then passes through theaperture 34 which is formed in theblock 28 and impinges upon the gap between thenozzles 30 and 32 (best shown in Figure 2a). The fibers that pass between thenozzles beam 34 and will cause scattering of the light. Zero degree forward scattering of the light is illustrated by the dashedlines 42 and forward scattering caused by the fibers at an angle of about forty (40°) degrees is illustrated by the dashedline 44. Zero degree forward scattered light is primarily indicative of the light extinction caused by the fibers and extinction sensors such aslight sensor 46b are disposed to receive and sense such zero degree forward scattered light. Although there are two extinction sensors, only the onesensor 46b is shown in Figure 2a and the other sensor is hidden behindsensor 46b. Acircular shield 48 and alens 50 are disposed behind theextinction sensor 46b and are operable to collect and focus any forty (40°) degree scattered light 44 onto alight sensor 52. - A plan view of the
sensors arrows fiber 56 is shown exiting thenozzle 30 and passing in front of thesensors light beam 34 impinges upon thefiber 56 in the area immediately in front of thesensors sensors light beam 34 in the absence of any fibers disposed in thebeam 34 and, in the presence of fibers in thebeam 34, thesensors light beam 34 less the amount of light extinction caused by thefiber 56 and less the amount of light scattered around thesensors fiber 56. In practice, the reduction in light received by thesensors fiber 56 will be primarily due to the extinction of light caused by thefiber 56. - Also shown in Figure 3 is the
circular shield 48 and thelens 50. It will appreciated that theshield 48 andlens 50 form an annular aperture 58 that receives forward scattered light at an angle of about forty (40°) degrees with respect to the direction of the collimatedbeam 34 wherein the forty (40°) degree angle is rotated three hundred and sixty (360°) degrees about the directional axis of the collimatedbeam 34. - Referring to Figure 4, detailed views of
sensors sensors distance 60 between the left edge ofsensor 46a and the left edge of 46b is 530 microns. Likewise, the distance between the centers ofsensors sensors distance 62 between the right edge ofsensor 46a and the left edge ofsensor 46b is approximately 20 microns, and thedistance 64 between the tops and bottoms of thesensors -
Sensors fiber 56 shown in Figure 3. However, it is not intuitively apparent that thesensors fiber 56. Typically, a cotton fiber has a ribbon width of approximately 20 micrometers. Because of this small ribbon width, when light impinges upon the cotton fiber, it rapidly diffracts behind the fiber and creates a diffuse diffraction pattern. In other words, because the fiber is so small, it does not cast a shadow with sharp edges as one might expect with a larger object. The diffraction pattern or the near zero degrees forward scattered light does not resemble a shadow in the ordinary sense of the word. But an ordinary sharply-defined shadow is not as important here as having identical, symmetrical, and constant responses from the two detectors. We discovered that thesensors nozzles - As the fiber or other entity moves in the +Y direction extinction caused by the fiber or other entity produces a symmetrically equal response whose difference in time corresponds exactly to the difference in space D . Thus speed is measured. The
sensors sensors sensors sensors sensors - It will be appreciated that the dimensions of the
sensors sensors sensors sensors - Referring now to Figure 5, there is shown yet another diagrammatic view of the sensor and
sample region 18 andelectronics system 22. In this view, it may be appreciated that thefiber 56 has aleading end 66 and trailingend 68. When theleading end 66 first enters thebeam 34, it scatters light and causes light extinction. - Referring to Figure 5, the dashed line 70 represents light that is scattered by the
fiber 56 from the left-most side of thebeam 34 at a forward scattering angle of fifty (50) degrees. In like manner, dashed line 72 represents thirty (30°) degree forward scattered originating at the left side of thelight beam 34. Dashedline 74 represents fifty (50°) degree scattered light originating at the right side of thebeam 34 and dashedline 76 represents thirty (30°) degree scattered light originating at the right side ofbeam 34. The light between dashed lines 70 and 72 and between dashedlines lens 50 and focused upon thesensor 52. Thus, thelens 50 will collect forward scattered light in an annular pattern as best shown in Figure 3 that is scattered at an angle of between thirty and fifty degrees. - Light that is scattered by the
fiber 56 from the center of thebeam 34 will have scattering angles that are greater than fifty degrees. However, the apparatus illustrated in Figure 5 is intended to illustrate what applicants consider to be approximately forty degree forward scattered light. - As shown in Figure 5, the light detected by
sensors lines amplifiers conditioning electronics 86. In a similar manner, the light that is focused by thelens 50 onto thesensor 52 is converted to an electrical signal which is transmitted throughline 88 andamplifier 90 to theconditioning electronics 86. - In the case of the signals received from the
sensors electronics 86 are conditioned to detect decreases in voltages which correspond to the extinction of light caused byfibers 56 passing in front of thesensors sensors display 92 which, preferably, is an oscilloscope. Also, the signals are converted to digital form and are transmitted to thecomputer 94 where they are stored and further analyzed. Adisplay 96 is also connected to thecomputer 94 so that visual displays may also be generated from the digital data corresponding to the signals fromsensors - The signal from
sensor 52 will increase in voltage in the presence of afiber 56 which is opposite to the effect that thefiber 56 has on the light received bysensors conditioning electronics 86 is adapted to detect increases in the voltage of the signal from thesensor 52. As before, the signals fromsensor 52 may be shown ondisplay 92 in the analog domain and are converted to digital form and stored in thecomputer 94. Again, the digital data corresponding to the signals from thesensor 52 may be shown ondisplay 96. - Referring to Figure 6 in conjunction with Figure 5, the operation of the
apparatus 10 may best be understood. Figure 6 shows an oscilloscope display of twosignals sensors signal 100 is shifted significantly abovesignal 102, it should be understood that the base line voltages of two signals are very nearly the same. However, the graph ofsignal 100 has been shifted upwardly with respect to the graph ofsignal 102 for the purpose of illustration. In other words, the zero base line ofsignal 100 is significantly above the zero base line ofsignal 102. - When the leading end of the
fiber 56 begins to cross in front ofsensor 46a, the graph ofsignal 100 rises rapidly and after the signal has risen to a predetermined level, indicated byreference character 104, one assumes that the leading end of the fiber is passing a predetermined point in space immediately in front of thedetector 46a. Likewise, when thesignal 102 increases to a predetermined voltage indicated byreference character 106, the leading end of the fiber is positioned at a predetermined point immediately in front of thesensor 46b. Thereference characters signal 100 reaches the predetermined level indicated bycharacter 104 slightly beforesignal 102 reaches the predetermined level indicated bycharacter 106. This difference represents the time that is required for the leading end of the fiber to travel from a predetermined point in front of thesensor 46a to a corresponding point in front of thesensor 46b. - In like manner, when the
signal 100 drops below a predetermined reference level indicated bycharacter 108, the trailing end of the fiber is positioned at a predetermined point in front of the detector 56a, and when the trailing end of thefiber 56 is positioned at a corresponding point in front of the detector 56b, the voltage ofsignal 102 drops to the point indicated bycharacter 110. - The difference in time between the positions indicated by
characters fiber 56 to travel from a predetermined point in front ofsensor 46a to a corresponding point in front ofsensor 46b. Also, by observing the characteristic peaks and valleys of the two signals, it will be observed that the peaks and valleys ofsignal 100 occur before the peaks and valleys of thesignal 102. These peaks and valleys represent physical characteristics of the fiber and the occurrence of the peak insignal 100 indicates that a particular physical feature has appeared in front of thesensor 46a. Then, the corresponding peak or valley insignal 102 indicates that the same physical feature has appeared in front of thesensor 46b. By comparing the time positions of the peaks and valleys as betweensignals sensor 46a to thesensor 46b. - It has been discovered that the fiber in the above-described apparatus is accelerating as it passes between the
nozzles sensors sensors reference character 112. These two peaks represent a physical characteristic near the leading end of the fiber. Likewise, two other corresponding peaks in the two curves are indicated byreference character 114 and these two peaks would represent a physical characteristic of the fiber near its trailing end. It will noted that the two peaks indicated bycharacter 112 are further apart than the peaks indicated by thecharacter 114. This means that the leading end of the fiber requires greater time than the trailing end of the fiber to travel the same distance. Thus, the leading end of the fiber was traveling more slowly when it passedsensors computer 94 based upon the change in speed and the time between the two measurements based upon the knowledge that the change in speed equals acceleration multiplied by time. It has been discovered that the acceleration of the fiber is not linear; it is slightly parabolic. However, the acceleration is sufficiently close to linear that the length of a fiber can be accurately determined by measuring the leading end speed, the trailing end speed and averaging the two speeds to determined a mean speed of the fiber. In order to determine the length of a fiber, one first determines the time difference between when the leading end passes a particular point in front of one of thesensors - Another method of finding the fiber speed is to determine the times required for the leading end to travel from a point in front of
sensor 46a to a point in front ofsensor 46b (the leading end time) and to determine the time required for the trailing end to pass between the same two points (the trailing end time). Then, the leading end time and trailing end time are averaged to determine an average time. Fiber speed is then determined by dividing the distance between the two points by the time average. Since the acceleration of the fiber is not constant, the average or assumed fiber speed differs depending on which of the above two methods are used to calculate speed, but either is more accurate than assuming constant speed or measuring speed once. Also, other mathematical models may be used to predict average speed, fiber speed or fiber length based on two or more time measurements. - Referring again to Figure 6, it has been further discovered that the integrated area beneath the graphs of
signals sensors computer 94 generates data corresponding to mean ribbon width by calculating and storing the average amplitude of the signal received from one of thesensors computer 94, it further calculates the aspect ratio of the fiber (length/ribbon width) which constitutes shape information. Thecomputer 94 also records the average frequency of the signals fromsensors - It will be noted that both Figures 6 and 7 show increasing voltages in the presence of a
fiber 56 in thelight beam 34 and in front of thesensors sensors fiber 56 in front of the sensors. However, for clarity of illustration and display, the conditioning electronics inverts the signals so that a decreasing signal fromsensors display 92 which is preferably an oscilloscope. - The system shown in Figure 5 is particularly useful for measuring characteristics of cotton fibers one-at-a-time. Because cotton is so complex, numerous parameters have been used to describe its cross sectional characteristics. Those relevant to this discussion include Dr = ribbon width, A = cross sectional area (with or without lumen), θ = circularity ratio = A divided by area of a circle with the same perimeter P, and Mic = micronaire air flow permeability. Other parameters include F = Fineness or linear density, measured in gm/Km = tex, and M = Maturity. Maturity is measured in several ways, all of which more or less relate to the biological maturity in wall thicknes t of the fiber at harvest. From basic fiber physics, F = pA, where p is cellulosic density, gm/cm3 and θ is the most direct measure of maturity M. Thus, F is directly proportional to A and θ is directly proportional to M.
- Experimentally and theoretically the following conclusions may be drawn regarding the system of Figure 5:
- 1. The forward scattering signal of sensor 52 (Vs) correlates more highly with fiber surface area than fiber width.
- 2. The extinction mode signal of either of
sensors - 3. Vs and Ve correlate poorly and therefore provide partially independent data on cross-sectional parameters of fibers.
- Based in part on these conclusions, it follows that Vs and Ve may be used to provide data correlating to fineness (F) and (M) maturity and to evaluate this correlation, we have compared AFIS 1 data with data obtained using Image Analyzer and micronaire methods. We have found that Image Analyzer, micronaire and AFIS 1 data obey:


- Thus, one procedure for predicting average circularity (θ-) and cross sectional area (A-) is as follows. Using equation 1, predict Mic based on Vs data from AFIS 1. Use the predicted Mic value and the measured Ve in equation 2 to predict θ-. Then using the values calculated for θ- and Mic, one may determine A- by solving:

- Since F is proportional to A, it follows that A- is also a measure of F-, fineness. Also, since M is proportional to θ, it follows that θ- is a measure of M, maturity.
- Referring to Figure 5, in practice the
computer 94 records Vs and Ve for each fiber in addition to the other information discussed above such as length and ribbon width. After all sample fibers are tested, thecomputer 94 then makes the appropriate calculations to determine A-, θ- and Mic, if desired, using Vs and Ve. - Referring now to Figure 8, there is shown another embodiment of the present invention in which a pair of
backscattering sensors beam 34 by thefiber 56. In Figure 8, thelight source 33 provides acollimated beam 34 of white light (a broad wavelength distribution) to facilitate color measurements. Afilter 104 is placed in front of thedetector 100 and alens 106 is provided to focus light that is transmitted by thefilter 104 onto thedetector 100. In like manner, afilter 108 is disposed in front of thedetector 102 and alens 110 is provided for focusing light that is transmitted through thefilter 108 onto thedetector 102. Afilter 112 is disposed in front of thedetectors filter 114 is positioned in front of thedetector 52. Thus, all the detectors in the embodiment in Figure 8 receive light through a filter. - The
filters conditioning electronics 86 and thecomputer 94 throughlines conditioning electronics 86 may control the polarity and the wavelength responses of thefilters fiber 56 in a forward scattering mode (filter 114 and detector 52), an extinction mode or near zero forward scattering mode (sensors filters detectors 100 and 102). Although all of the filters may be used to detect color or polarization information, it is preferred to usefilter 104 anddetector 110 to observe the grayness of cotton fibers and it is preferred to usefilter 108 anddetector 102 to observe the yellowness of cotton fibers. - Also it is preferred to observe polarity information primarily through
filters detectors computer 94 for each fiber tested. - From the foregoing, it will be appreciated that the present invention is capable of very accurately measuring the speed of a fiber and using the speed to calculate the length of the fiber. In addition, using light extinction information, the mean ribbon width is rapidly determined and, using forward scattered light information, a surface data signal is generated that is indicative of fiber surface properties. In particular, it is known that the surface data signal (Vs) is directly related to micronaire and, using formulas 1, 2 and 3, θ- and A- may be calculated. Thus, the present invention is capable of analyzing single fibers from a sample with rapidity and, since characteristics of each fiber are measured, multivariate data is generated by
computer 94. For example, in addition to length distribution for a sample, the computer calculates length vs. diameter distribution for the sample and may also calculate other multivariate distributions based on any of the characteristics measured such as color, shape, micronaire, A-, θ- or others.
Claims (11)
- An apparatus for rapidly transporting, classifying and measuring characteristics of single particles (12) like textile fibers (56), neps or trash, each particle having a length, i. e. major axis and a leading edge and a trailing edge spaced apart one from the other along the particle length, the apparatus comprisinga first conduit (16) for transporting the single particles, means (14) for delivering single particles one at a time to the first conduit,means (26) for creating a fluid stream (51) within the first conduit,an accelerating nozzle (30) connected to the first conduit for accelerating the particles,a second conduit (24) for receiving and transporting the single particles from the first conduit (16),a gap formed between the first and the second conduit, the ends of the conduits being within a sample chamber (18, 36) comprising the gap and the gap being traversed by the particles and the fluid stream,a source emitting a light beam (34) directed through said gap, across the fluid stream and impinging upon the particles in the fluid stream and upon a light sensor means for sensing the presence of particles,characterized bysaid light sensor means comprising an upstream and a downstream sensor (46a, 46b) spaced apart in the direction parallel to the path of movement of the particles in said gap,the sensors being directed towards said source of light so as to be sensitive to extinction of light by the particles, and each providing an output signal, andcomputer means (94) arranged to use the output signals from the sensors to obtain the time instants at which the leading and trailing edges of each particle respectively pass each sensor,said computing means determining the time difference between time instants at which the leading and trailing edge of a particle passing one of the sensors, and multiplying this difference by the average speed of the particle to obtain the length of said particle, said average speed being calculated bycalculating from said time instants and the distance between the sensors, the leading edge speed and the trailing edge speed and therefrom the average speed of said particle.
- An apparatus for rapidly transporting, classifying and measuring characteristics of single particles (12) like textile fibers (56), neps or trash, each particle having a length, i. e. major axis and a leading edge and a trailing edge spaced apart one from the other along the particle length, the apparatus comprisinga first conduit (16) for transporting the single particles, means (14) for delivering single particles one at a time to the first conduit,means (26) for creating a fluid stream (51) within the first conduit,an accelerating nozzle (30) connected to the first conduit for accelerating the particles,a second conduit (24) for receiving and transporting the single particles from the first conduit (16),a gap formed between the first and the second conduit, the ends of the conduits being within a sample chamber (18, 36) comprising the gap and the gap being traversed by the particles and the fluid stream,a source emitting a light beam (34) directed through said gap, across the fluid stream and impinging upon the particles in the fluid stream and upon a light sensor means for sensing the presence of particles,characterized bysaid light sensor means comprising an upstream and a downstream sensor (46a, 46b) spaced apart in the direction parallel to the path of movement of the particles in said gap,the sensors being directed towards said source of light so as to be sensitive to extinction of light by the particles, and each providing an output signal, andcomputer means (94) arranged to use the output signals from the sensors to obtain the time instants at which the leading and trailing edges of each particle respectively pass each sensor,said computing means determining the time difference between time instants at which the leading and trailing edge of a particle passing one of the sensors, and multiplying this difference by the average speed of the particle to obtain the length of said particle, said average speed being calculated byobtaining the leading edge time for the leading edge, and the trailing edge time for the trailing edge, to travel from the upstream sensor to the downstream sensor, taking the average between the leading edge time and the trailing edge time, and determining the average particle speed by dividing the distance between the sensors by said average time.
- An apparatus according to claims 1 or 2, wherein said upstream sensor and downstream sensor are disposed adjacent to said sample chamber for receiving light from a collimated beam of light and generating an extinction signal (Ve).
- An apparatus according to claim 3, wherein said light sensor means comprise a further light sensor (52) disposed adjacent to said sample chamber and being dimensioned and positioned for receiving forward light scattering caused by particles passing through said sample chamber and generating a scattering signal (Vs).
- An apparatus according to claim 1 or 2 further comprising means for calculating the mean diameter of each entity passing through the sample chamber based on the extinction of light.
- An apparatus according to claim 4, comprising means responsive to the scattering signal for generating surface property data corresponding to the particles passing through the sample chamber.
- An apparatus according to claim 6, wherein said sensors are configured and positioned to receive all light scattered forward by said particles at a scattering angle of about forty degrees (40°) with respect to the direction of the beam of light.
- An apparatus according to claim 6 wherein said sensors are configured and positioned to receive all light scattered forward by said particles at a scattering angle of between about thirty degrees (30°) and about fifty degrees (50°) with respect to the direction of the beam of light.
- An apparatus according to claim 4 further comprising means for calculating circularity based on the light scattering signal (Vs) and the extinction signal (Ve).
- An apparatus according to claim 4 further comprising means for calculating average cross-sectional area based on the light scattering signal (Vs) and the extinction signal (Ve).
- An apparatus according to claim 1 and 2 wherein said computer means determines the acceleration of each particle based upon the time instants at which the leading and trailing edges of each particle respectively pass each sensor.
Applications Claiming Priority (3)
| Application Number | Priority Date | Filing Date | Title |
|---|---|---|---|
| US07/493,961 US5270787A (en) | 1990-03-14 | 1990-03-14 | Electro-optical methods and apparatus for high speed, multivariate measurement of individual entities in fiber or other samples |
| PCT/US1991/001650 WO1991014169A1 (en) | 1990-03-14 | 1991-03-12 | Electro-optical methods and apparatus for high speed, multivariate measurement of individual entities in fiber or other samples |
| US493961 | 2000-01-28 |
Publications (3)
| Publication Number | Publication Date |
|---|---|
| EP0519975A1 EP0519975A1 (en) | 1992-12-30 |
| EP0519975A4 EP0519975A4 (en) | 1993-09-30 |
| EP0519975B1 true EP0519975B1 (en) | 1996-11-20 |
Family
ID=23962430
Family Applications (1)
| Application Number | Title | Priority Date | Filing Date |
|---|---|---|---|
| EP91905936A Expired - Lifetime EP0519975B1 (en) | 1990-03-14 | 1991-03-12 | Electro-optical methods and apparatus for high speed, multivariate measurement of individual entities in fiber or other samples |
Country Status (7)
| Country | Link |
|---|---|
| US (1) | US5270787A (en) |
| EP (1) | EP0519975B1 (en) |
| JP (1) | JP3211089B2 (en) |
| AU (1) | AU649028B2 (en) |
| DE (1) | DE69123246T2 (en) |
| ES (1) | ES2094221T3 (en) |
| WO (1) | WO1991014169A1 (en) |
Families Citing this family (42)
| Publication number | Priority date | Publication date | Assignee | Title |
|---|---|---|---|---|
| US5410401A (en) * | 1990-03-14 | 1995-04-25 | Zellweger Uster, Inc. | Methods and apparatus for mechanically and electronically correcting presentation of entities in a fluid flow |
| US5430301A (en) * | 1990-03-14 | 1995-07-04 | Zellweger Uster, Inc. | Apparatus and methods for measurement and classification of generalized neplike entities in fiber samples |
| US5539515A (en) * | 1990-03-14 | 1996-07-23 | Zellweger Uster, Inc. | Apparatus and methods for measurement and classification of trash in fiber samples |
| US5469253A (en) | 1990-03-14 | 1995-11-21 | Zellweger Uster, Inc. | Apparatus and method for testing multiple characteristics of single textile sample with automatic feed |
| JP3070786B2 (en) * | 1990-11-22 | 2000-07-31 | 株式会社佐竹製作所 | Method and apparatus for analyzing granules and apparatus for adjusting the roll gap of a crusher using the apparatus |
| RU94019480A (en) * | 1991-09-06 | 1996-06-10 | Коммонвелт Сайнтифик энд Индастриал Рисерч Организэйшн (AU) | Method of determination of measurands and device for its accomplishment |
| US5394480A (en) * | 1991-09-19 | 1995-02-28 | Zellweger Uster, Inc. | Topological map maker |
| DE4139899A1 (en) * | 1991-12-04 | 1993-06-09 | Hoffmann, Alfred, Dr., 9200 Freiberg, De | Measuring turbidity and mass flow of suspended particles in liquids simultaneously - regulating diode emission power, averaging turbidity over repeated cycles and measuring transition time of flow rate |
| US5293219A (en) * | 1991-12-31 | 1994-03-08 | Andritz Sprout-Bauer, Inc. | Fiber length analyzer |
| US5311290A (en) * | 1992-09-30 | 1994-05-10 | Pulp And Paper Research Institute Of Canada | Imaging apparatus and method of fiber analysis |
| US5383135A (en) * | 1992-12-31 | 1995-01-17 | Zellweger Uster, Inc. | Acquisition, measurement and control of thin webs on in-process textile materials |
| EP0604875B1 (en) * | 1992-12-31 | 1999-04-21 | Zellweger Uster, Inc. | Continious two dimensional monitoring of thin webs of textile materials |
| EP0606620B1 (en) * | 1993-01-11 | 2000-02-09 | Zellweger Uster, Inc. | Apparatus and methods for measurement and classification of trash in fiber samples |
| CH685506A5 (en) * | 1993-06-23 | 1995-07-31 | Zellweger Uster Ag | Device for measuring the mass or substance cross-section of slivers and use of the device. |
| US5694807A (en) * | 1994-09-29 | 1997-12-09 | The United States Of America As Represented By The Administrator Of The National Aeronautics And Space Administration | Apparatus and method for determining the mass density of a filament |
| DE19507643C1 (en) * | 1995-03-04 | 1996-07-25 | Rockwool Mineralwolle | Process for rendering hot inclusions in a mineral wool fleece harmless and device for carrying out the process |
| GR960100084A (en) * | 1995-04-13 | 1996-12-31 | Trutzschler Gmbh & Co Kg | Apparatus on a carding machine |
| US5654797A (en) * | 1996-02-22 | 1997-08-05 | National Research Council Of Canada | Method and apparatus for monitoring the diameter of thermally sprayed particles |
| US6005662A (en) * | 1996-11-04 | 1999-12-21 | Certainteed Corporation | Apparatus and method for the measurement and separation of airborne fibers |
| US5929460A (en) * | 1997-10-06 | 1999-07-27 | Premier Polytronics Limited | High throughput nep measurement |
| US5890264A (en) * | 1997-10-06 | 1999-04-06 | Premier Polytronics Limited | Aeromechanical individualizer |
| US6052182A (en) * | 1997-10-28 | 2000-04-18 | Zellweger Uster, Inc. | Fiber quality monitor |
| WO1999037973A1 (en) * | 1998-01-22 | 1999-07-29 | Maschinenfabrik Rieter Ag | Method and device for measuring fibre length |
| US5892142A (en) * | 1998-02-06 | 1999-04-06 | Zellweger Uster, Inc. | Fiber micronaire testing system |
| US6219136B1 (en) | 1998-03-03 | 2001-04-17 | Union Underwear Company, Inc. | Digital signal processor knitting scanner |
| GB2336050B (en) * | 1998-03-31 | 2003-03-26 | Marconi Gec Ltd | Improvements in or relating to remote air detection |
| NL1012750C2 (en) * | 1999-07-30 | 2001-02-01 | Dsm Nv | Method for determining the density of a fiber. |
| US7345756B2 (en) | 2003-01-07 | 2008-03-18 | Shofner Engineering Associates, Inc. | Image-based fiber length measurements from tapered beards |
| JP2004223815A (en) * | 2003-01-21 | 2004-08-12 | Fuji Photo Film Co Ltd | Device for detecting side edge of recording paper and printer sheet |
| AU2003901910A0 (en) * | 2003-04-17 | 2003-05-08 | Commonwealth Scientific And Industrial Research Organisation | Method and apparatus for testing fibres |
| DE10347240B4 (en) * | 2003-10-10 | 2015-10-15 | Trützschler GmbH & Co Kommanditgesellschaft | Apparatus in the spinning preparation for detecting foreign parts made of plastic in fiber flakes |
| CN1910442B (en) * | 2004-01-20 | 2011-04-13 | 联邦科学和工业研究组织 | Method and apparatus for measuring fiber |
| US7143642B1 (en) * | 2005-07-01 | 2006-12-05 | Uster Technologies, Inc. | Integrated moisture, length, and strength tester |
| US8120769B2 (en) * | 2007-08-03 | 2012-02-21 | North Carolina State University | Method and system for fiber properties measurement |
| EP2574511B1 (en) * | 2011-09-30 | 2016-03-16 | Honda Research Institute Europe GmbH | Analyzing road surfaces |
| US9329162B2 (en) * | 2012-02-08 | 2016-05-03 | Uster Technologies Ag | Auto micronaire |
| US8496114B1 (en) | 2012-06-14 | 2013-07-30 | Uster Technologies Ag | Trash separator |
| WO2019051620A1 (en) | 2017-09-14 | 2019-03-21 | Uster Technologies Ag | Fiber blend identification and/or ratio measurement |
| US10962461B2 (en) * | 2019-08-02 | 2021-03-30 | X Energy, Llc | System and method for controlling metal oxide gel particle size |
| CZ2022522A3 (en) | 2022-12-12 | 2024-06-19 | Rieter Cz S.R.O. | A method of controlling a technological process on a spinning machine, a spinning machine for carrying out the method, a computer program for carrying out the method on a spinning machine and a computer-readable medium with a computer program |
| KR20240140336A (en) | 2023-03-16 | 2024-09-24 | 삼성전자주식회사 | Substrate processing apparatus and method of manufacturing a semiconductor device using the same |
| CN116893127B (en) * | 2023-09-11 | 2023-12-08 | 中储粮成都储藏研究院有限公司 | Grain appearance quality index detector |
Family Cites Families (11)
| Publication number | Priority date | Publication date | Assignee | Title |
|---|---|---|---|---|
| US3816001A (en) * | 1972-06-20 | 1974-06-11 | W Duncan | Measuring length and velocity of single staple fibers within an airflow |
| US3815001A (en) * | 1973-03-13 | 1974-06-04 | Parker L | Silicon controlled rectifier motor speed controller |
| US4027162A (en) * | 1976-04-26 | 1977-05-31 | Particle Measuring Systems, Inc. | Method and apparatus for orienting and measuring fibrous particles |
| FR2408117B1 (en) * | 1977-11-07 | 1982-04-16 | Agronomique Inst Nat Rech | METHOD AND APPARATUS FOR MEASURING THE DIMENSIONS OF WOOD FIBERS |
| CH643060A5 (en) * | 1979-11-20 | 1984-05-15 | Zellweger Uster Ag | METHOD FOR DETERMINING THE DIAMETER OR THE SECTION OF A THREAD OR WIRE-SHAPED BODY, DEVICE FOR IMPLEMENTING THE METHOD, AND APPLICATION OF THE METHOD. |
| DE2952712C2 (en) * | 1979-12-29 | 1984-07-12 | Hoesch Werke Ag, 4600 Dortmund | Device for detecting errors |
| GB8523747D0 (en) * | 1985-09-26 | 1985-10-30 | Vg Instr Group | Fibre size monitor |
| US4788579A (en) * | 1985-09-30 | 1988-11-29 | The General Electric Company | Semiconductor superlattice |
| DE3703969A1 (en) * | 1986-09-26 | 1988-04-07 | Phb Weserhuette Ag | STACKING AND / OR UNLOADING DEVICE FOR STUECKGUETER |
| SE457480B (en) * | 1987-05-06 | 1988-12-27 | Gedevelop Electronics Ab | SET AND DEVICE FOR DETERMINING SIZE AND / OR FORM OF A FREE FALLING ITEM |
| US4938592A (en) * | 1987-07-28 | 1990-07-03 | Amherst Process Instruments, Inc. | Beam forming and sensing apparatus for aerodynamic particle sizing system |
-
1990
- 1990-03-14 US US07/493,961 patent/US5270787A/en not_active Expired - Lifetime
-
1991
- 1991-03-12 AU AU74843/91A patent/AU649028B2/en not_active Ceased
- 1991-03-12 ES ES91905936T patent/ES2094221T3/en not_active Expired - Lifetime
- 1991-03-12 DE DE69123246T patent/DE69123246T2/en not_active Expired - Fee Related
- 1991-03-12 WO PCT/US1991/001650 patent/WO1991014169A1/en not_active Ceased
- 1991-03-12 EP EP91905936A patent/EP0519975B1/en not_active Expired - Lifetime
- 1991-03-12 JP JP50621291A patent/JP3211089B2/en not_active Expired - Fee Related
Non-Patent Citations (3)
| Title |
|---|
| "Advanced fiber information systems: a new technology for evaluating cotton", by F.M. Schofner, G.F. Williams, C.K. Bragg, and P.E. Sasser, December 1988, Textile Institute Conference Fibre Science Group, UK * |
| "Advanced technology for measuring cotton fiber length, diameter, and trash content", by C.K. Bragg (March 1988) * |
| Faser Forschung und Textiltechnik, volume 25, no. 2, 1975, E.W. Unger: "Beitrag zur Entwicklung rationalisierter automatisierter physikalischer Analysenmethoden für die direkte Bestimmung der Dimensionen von Zellstoff-Fasern" * |
Also Published As
| Publication number | Publication date |
|---|---|
| US5270787A (en) | 1993-12-14 |
| EP0519975A1 (en) | 1992-12-30 |
| ES2094221T3 (en) | 1997-01-16 |
| AU649028B2 (en) | 1994-05-12 |
| DE69123246D1 (en) | 1997-01-02 |
| WO1991014169A1 (en) | 1991-09-19 |
| EP0519975A4 (en) | 1993-09-30 |
| JP3211089B2 (en) | 2001-09-25 |
| JPH07500660A (en) | 1995-01-19 |
| DE69123246T2 (en) | 1997-03-13 |
| AU7484391A (en) | 1991-10-10 |
Similar Documents
| Publication | Publication Date | Title |
|---|---|---|
| US5270787A (en) | Electro-optical methods and apparatus for high speed, multivariate measurement of individual entities in fiber or other samples | |
| US3960449A (en) | Measurement of angular dependence of scattered light in a flowing stream | |
| US5321496A (en) | Apparatus for monitoring trash in a fiber sample | |
| US3835315A (en) | System for determining parameters of a particle by radiant energy scattering techniques | |
| DE3875069T2 (en) | DEVICE FOR DETERMINING THE ASYMMETRY OF PARTICLES. | |
| US4298836A (en) | Particle shape determination | |
| US20060066852A1 (en) | Data frame selection for cytometer analysis | |
| US5679907A (en) | Method and device to determine the aerodynamic diameter of particles | |
| Garg et al. | Measurements of a supersonic turbulent boundary layer by focusing schlieren deflectometry | |
| EP0606619B1 (en) | Apparatus and methods for measurement and classification of generalized neplike entities in fiber samples | |
| Chen et al. | Experimental responses of two optical particle counters | |
| US6104491A (en) | System for determining small particle size distribution in high particle concentrations | |
| Schweers et al. | Experimental investigation of particle collection on single fibres of different configurations | |
| US5448362A (en) | Non-contact measurement of displacement and changes in dimension of elongated objects such as filaments | |
| NoMIZU et al. | Simultaneous measurement of the elemental content and size of airborne particles by inductively coupled plasma emission spectrometry combined with the laser light-scattering method | |
| Szymanski et al. | Absolute aerosol number concentration measurement by simultaneous observation of extinction and scattered light | |
| EP0606620A1 (en) | Apparatus and methods for measurement and classification of trash in fiber samples | |
| US6512583B1 (en) | Apparatus and method for the dimensional measurement of airborne fibers | |
| Cooper et al. | A new particle size classifier: variable-slit impactor with photo-counting | |
| DE19525847C2 (en) | Method and device for determining the diameter of particles | |
| Bauckhage et al. | Correlation of simultaneously measured droplet sizes and velocities in nozzle sprays | |
| Taylor | Aerodynamic drag of cotton fibers in crossflow | |
| HUP0001651A2 (en) | Apparatus and method for measuring the concentration of airborne fibers | |
| Hovenac | Droplet sizing instrumentation used for icing research: operation, calibration, and accuracy | |
| Cain et al. | Qualitative and quantitative wind tunnel measurements of the airflow through a shrouded airborne aerosol sampling probe |
Legal Events
| Date | Code | Title | Description |
|---|---|---|---|
| PUAI | Public reference made under article 153(3) epc to a published international application that has entered the european phase |
Free format text: ORIGINAL CODE: 0009012 |
|
| 17P | Request for examination filed |
Effective date: 19920904 |
|
| AK | Designated contracting states |
Kind code of ref document: A1 Designated state(s): BE CH DE ES FR GB IT LI |
|
| 17Q | First examination report despatched |
Effective date: 19930318 |
|
| GRAG | Despatch of communication of intention to grant |
Free format text: ORIGINAL CODE: EPIDOS AGRA |
|
| GRAH | Despatch of communication of intention to grant a patent |
Free format text: ORIGINAL CODE: EPIDOS IGRA |
|
| GRAH | Despatch of communication of intention to grant a patent |
Free format text: ORIGINAL CODE: EPIDOS IGRA |
|
| GRAA | (expected) grant |
Free format text: ORIGINAL CODE: 0009210 |
|
| AK | Designated contracting states |
Kind code of ref document: B1 Designated state(s): BE CH DE ES FR GB IT LI |
|
| REF | Corresponds to: |
Ref document number: 69123246 Country of ref document: DE Date of ref document: 19970102 |
|
| ITF | It: translation for a ep patent filed | ||
| REG | Reference to a national code |
Ref country code: ES Ref legal event code: FG2A Ref document number: 2094221 Country of ref document: ES Kind code of ref document: T3 |
|
| ET | Fr: translation filed | ||
| PLBE | No opposition filed within time limit |
Free format text: ORIGINAL CODE: 0009261 |
|
| STAA | Information on the status of an ep patent application or granted ep patent |
Free format text: STATUS: NO OPPOSITION FILED WITHIN TIME LIMIT |
|
| 26N | No opposition filed | ||
| PGFP | Annual fee paid to national office [announced via postgrant information from national office to epo] |
Ref country code: ES Payment date: 20000322 Year of fee payment: 10 |
|
| PG25 | Lapsed in a contracting state [announced via postgrant information from national office to epo] |
Ref country code: ES Free format text: LAPSE BECAUSE OF NON-PAYMENT OF DUE FEES Effective date: 20010313 |
|
| REG | Reference to a national code |
Ref country code: GB Ref legal event code: IF02 |
|
| PGFP | Annual fee paid to national office [announced via postgrant information from national office to epo] |
Ref country code: GB Payment date: 20030312 Year of fee payment: 13 |
|
| REG | Reference to a national code |
Ref country code: ES Ref legal event code: FD2A Effective date: 20030303 |
|
| REG | Reference to a national code |
Ref country code: FR Ref legal event code: CD |
|
| REG | Reference to a national code |
Ref country code: CH Ref legal event code: PFA Owner name: USTER TECHNOLOGIES, INC. Free format text: ZELLWEGER USTER, INC.#456 TROY CIRCLE#KNOXVILLE, TN 37950-1270 (US) -TRANSFER TO- USTER TECHNOLOGIES, INC.#456 TROY CIRCLE#KNOXVILLE, TN 37950-1270 (US) |
|
| PG25 | Lapsed in a contracting state [announced via postgrant information from national office to epo] |
Ref country code: GB Free format text: LAPSE BECAUSE OF NON-PAYMENT OF DUE FEES Effective date: 20040312 |
|
| GBPC | Gb: european patent ceased through non-payment of renewal fee |
Effective date: 20040312 |
|
| REG | Reference to a national code |
Ref country code: CH Ref legal event code: PUE Owner name: USTER TECHNOLOGIES AG Free format text: USTER TECHNOLOGIES, INC.#456 TROY CIRCLE#KNOXVILLE, TN 37950-1270 (US) -TRANSFER TO- USTER TECHNOLOGIES AG#WILSTRASSE 11#8610 USTER (CH) |
|
| PGFP | Annual fee paid to national office [announced via postgrant information from national office to epo] |
Ref country code: BE Payment date: 20070514 Year of fee payment: 17 |
|
| PGFP | Annual fee paid to national office [announced via postgrant information from national office to epo] |
Ref country code: FR Payment date: 20070308 Year of fee payment: 17 Ref country code: CH Payment date: 20080228 Year of fee payment: 18 |
|
| PGFP | Annual fee paid to national office [announced via postgrant information from national office to epo] |
Ref country code: IT Payment date: 20080327 Year of fee payment: 18 |
|
| PGFP | Annual fee paid to national office [announced via postgrant information from national office to epo] |
Ref country code: DE Payment date: 20080306 Year of fee payment: 18 |
|
| BERE | Be: lapsed |
Owner name: *USTER TECHNOLOGIES INC. Effective date: 20080331 |
|
| REG | Reference to a national code |
Ref country code: FR Ref legal event code: ST Effective date: 20081125 |
|
| PG25 | Lapsed in a contracting state [announced via postgrant information from national office to epo] |
Ref country code: BE Free format text: LAPSE BECAUSE OF NON-PAYMENT OF DUE FEES Effective date: 20080331 |
|
| PG25 | Lapsed in a contracting state [announced via postgrant information from national office to epo] |
Ref country code: FR Free format text: LAPSE BECAUSE OF NON-PAYMENT OF DUE FEES Effective date: 20080331 |
|
| REG | Reference to a national code |
Ref country code: CH Ref legal event code: PL |
|
| PG25 | Lapsed in a contracting state [announced via postgrant information from national office to epo] |
Ref country code: CH Free format text: LAPSE BECAUSE OF NON-PAYMENT OF DUE FEES Effective date: 20090331 Ref country code: DE Free format text: LAPSE BECAUSE OF NON-PAYMENT OF DUE FEES Effective date: 20091001 Ref country code: LI Free format text: LAPSE BECAUSE OF NON-PAYMENT OF DUE FEES Effective date: 20090331 |
|
| PG25 | Lapsed in a contracting state [announced via postgrant information from national office to epo] |
Ref country code: IT Free format text: LAPSE BECAUSE OF NON-PAYMENT OF DUE FEES Effective date: 20090312 |