EP0505003B1 - Normalizing analyzer systems to a standard analyzer - Google Patents
Normalizing analyzer systems to a standard analyzer Download PDFInfo
- Publication number
- EP0505003B1 EP0505003B1 EP92200767A EP92200767A EP0505003B1 EP 0505003 B1 EP0505003 B1 EP 0505003B1 EP 92200767 A EP92200767 A EP 92200767A EP 92200767 A EP92200767 A EP 92200767A EP 0505003 B1 EP0505003 B1 EP 0505003B1
- Authority
- EP
- European Patent Office
- Prior art keywords
- analyzer
- response
- standard
- field
- calibration
- Prior art date
- Legal status (The legal status is an assumption and is not a legal conclusion. Google has not performed a legal analysis and makes no representation as to the accuracy of the status listed.)
- Expired - Lifetime
Links
- 230000004044 response Effects 0.000 claims description 113
- 238000000034 method Methods 0.000 claims description 27
- 238000011088 calibration curve Methods 0.000 claims description 22
- 230000006870 function Effects 0.000 claims description 15
- 239000012491 analyte Substances 0.000 claims description 10
- 230000003287 optical effect Effects 0.000 claims description 10
- 239000007788 liquid Substances 0.000 claims description 8
- 230000008859 change Effects 0.000 claims description 6
- 238000005259 measurement Methods 0.000 claims description 6
- 230000032683 aging Effects 0.000 claims description 5
- 238000004519 manufacturing process Methods 0.000 claims description 3
- 238000012360 testing method Methods 0.000 description 33
- 239000012530 fluid Substances 0.000 description 28
- WQZGKKKJIJFFOK-GASJEMHNSA-N Glucose Natural products OC[C@H]1OC(O)[C@H](O)[C@@H](O)[C@@H]1O WQZGKKKJIJFFOK-GASJEMHNSA-N 0.000 description 22
- 239000008103 glucose Substances 0.000 description 22
- 238000012937 correction Methods 0.000 description 16
- 238000000576 coating method Methods 0.000 description 15
- 239000011248 coating agent Substances 0.000 description 13
- 230000000694 effects Effects 0.000 description 8
- 238000012887 quadratic function Methods 0.000 description 8
- 238000012512 characterization method Methods 0.000 description 7
- 238000003556 assay Methods 0.000 description 6
- 230000000875 corresponding effect Effects 0.000 description 6
- 239000000523 sample Substances 0.000 description 6
- 239000000783 alginic acid Substances 0.000 description 5
- 239000004382 Amylase Substances 0.000 description 3
- 102000013142 Amylases Human genes 0.000 description 3
- 108010065511 Amylases Proteins 0.000 description 3
- 235000019418 amylase Nutrition 0.000 description 3
- 230000002596 correlated effect Effects 0.000 description 3
- 238000009826 distribution Methods 0.000 description 3
- 238000004806 packaging method and process Methods 0.000 description 3
- 238000010276 construction Methods 0.000 description 2
- 238000005204 segregation Methods 0.000 description 2
- 210000002966 serum Anatomy 0.000 description 2
- 0 C*(C)(C)C(*)C=N Chemical compound C*(C)(C)C(*)C=N 0.000 description 1
- PNNCWTXUWKENPE-UHFFFAOYSA-N [N].NC(N)=O Chemical compound [N].NC(N)=O PNNCWTXUWKENPE-UHFFFAOYSA-N 0.000 description 1
- 238000004458 analytical method Methods 0.000 description 1
- 230000005540 biological transmission Effects 0.000 description 1
- 210000004369 blood Anatomy 0.000 description 1
- 239000008280 blood Substances 0.000 description 1
- 238000001514 detection method Methods 0.000 description 1
- 239000000835 fiber Substances 0.000 description 1
- 238000012886 linear function Methods 0.000 description 1
- QSHDDOUJBYECFT-UHFFFAOYSA-N mercury Chemical compound [Hg] QSHDDOUJBYECFT-UHFFFAOYSA-N 0.000 description 1
- 239000013610 patient sample Substances 0.000 description 1
- 230000008569 process Effects 0.000 description 1
- 238000003908 quality control method Methods 0.000 description 1
- 230000024977 response to activity Effects 0.000 description 1
- 238000001228 spectrum Methods 0.000 description 1
- 238000012546 transfer Methods 0.000 description 1
- 230000009466 transformation Effects 0.000 description 1
- 238000000844 transformation Methods 0.000 description 1
Images





Classifications
-
- G—PHYSICS
- G01—MEASURING; TESTING
- G01N—INVESTIGATING OR ANALYSING MATERIALS BY DETERMINING THEIR CHEMICAL OR PHYSICAL PROPERTIES
- G01N35/00—Automatic analysis not limited to methods or materials provided for in any single one of groups G01N1/00 - G01N33/00; Handling materials therefor
- G01N35/02—Automatic analysis not limited to methods or materials provided for in any single one of groups G01N1/00 - G01N33/00; Handling materials therefor using a plurality of sample containers moved by a conveyor system past one or more treatment or analysis stations
-
- G—PHYSICS
- G01—MEASURING; TESTING
- G01N—INVESTIGATING OR ANALYSING MATERIALS BY DETERMINING THEIR CHEMICAL OR PHYSICAL PROPERTIES
- G01N21/00—Investigating or analysing materials by the use of optical means, i.e. using sub-millimetre waves, infrared, visible or ultraviolet light
- G01N21/17—Systems in which incident light is modified in accordance with the properties of the material investigated
- G01N21/25—Colour; Spectral properties, i.e. comparison of effect of material on the light at two or more different wavelengths or wavelength bands
- G01N21/27—Colour; Spectral properties, i.e. comparison of effect of material on the light at two or more different wavelengths or wavelength bands using photo-electric detection ; circuits for computing concentration
- G01N21/274—Calibration, base line adjustment, drift correction
Definitions
- This invention relates to a method of calibrating a clinical analyzer so that it can be used with slide elements calibrated for use on a drastically different type of analyzer than the one actually used.
- Certain dried, slide test elements such as the elements available under the trademark "Ektachem” from Eastman Kodak Company, are capable of use on a variety of different analyzers. These latter include the “Ektachem 700" analyzer and the “Ektachem DT-60” analyzer, both available from Eastman Kodak Company.
- analyzers such as the elements available under the trademark "Ektachem” from Eastman Kodak Company.
- Ektachem 700 analyzer
- Ektachem DT-60 both available from Eastman Kodak Company.
- the correlation between detected response and concentration is different, for any given test element, when read on for example, the "Ektachem DT-60" analyzer, compared to its reading on the "Ektachem 700" analyzer.
- Such different correlations require that a different calibration curve establishing the correlation, be used for each different kind of analyzer.
- Different calibration mathematics has to be established for each different type of analyzer. This requires the "proper" type analyzer be used at the factory to determine the calibration, rather than any possible analyzer.
- Such different calibration curves and the related calibration mathematics have to be "carried” with the test element in question such as by bar coding and/or magnetic disk.
- the correction for such variation is different depending on what kind of analyzer is to be used for detection.
- the test elements have to be somehow segregated, using such a system, based on which type of analyzer the elements have been tested on and are destined for.
- the test elements have to be paired with a particular type of analyzer, especially if all or some of the calibration mathematics is being passed along with the test elements.
- the invention is based on the discovery that a relationship exists between how a given test element will perform on one type of analyzer, compared to how it will perform on a standard analyzer, such as on the Kodak "Ektachem 700"TM, hereinafter "E700", analyzer, so that this relationship can be programmed into that one type of analyzer to make its response LOOK like it is a "E700" analyzer response.
- E700 Kodak
- correction factors can be sent with all test elements of an assay as though they were all to be tested on the one single type of analyzer, namely (in this case) the "E700" analyzer.
- Prior art document US Patent No. 4,959,796 discloses a method of producing an analytical curve for an analyzing apparatus which provides an analysis result on the basis of the analytical curve in response to a measurement value obtained by photo-electrically measuring light intensity reflected from a slide to be analyzed.
- the slides are analyzed by first and second analyzing apparatus and the relation between the measurements obtained.
- Prior art document US Patent No. 4,866,644 discloses a calibration system for optical instruments of the type which make measurements at incrementally spaced wavelengths throughout a spectrum.
- the plurality of standard samples are measured by a master instrument and a field instrument.
- the measurement data obtained from each instrument are then statistically correlated to determine a calibration file which is stored with the field instrument.
- This prior art document teaches non-quantitative results dealing with the optics in a non-clinical chemistry field and the use of linear equations.
- field analyzer refers to the analyzer used by the customer, which may be the same or a different type as was selected for the standard analyzer.
- the calibration of the field analyzer being used is expressed in terms of a single standard analyzer, so that differences introduced by variations in the analyzer type are automatically corrected and the same slide elements can be used in both analyzers even though the calibration mathematics is derived for only a single type of analyzer.
- the slide test element bearing a set of calibration parameters is useful in a variety of analyzers having different constructions, rather than just one, and such test elements with their calibration mathematics need not be supplied to only one type of analyzer.
- the invention is hereinafter described in connection with certain preferred embodiments, featuring preferred slide test elements tested in preferred clinical analyzers, wherein calibration mathematics is transmitted by bar codes and/or magnetic disk.
- the invention is useful regardless of the form of the test elements, regardless of which types of analyzers are used, and regardless of the mode of transmission of the calibration mathematics, so long as one kind of analyzer is selected as a standard, producing a response against which the response of any other analyzer is compared and corrected as part of the calibration.
- the preferred test elements are the slide test elements available from Eastman Kodak Company under the trademark "Ektachem” slides.
- a "transformed OD” is an optical density value obtained through a spline function from raw optical density values to correct for interferences or to convert to other densities, for example, by using a transform such as the Clapper-Williams transform.
- the preferred analyzers are any of the analyzers available from Eastman Kodak Company under the trademark “Ektachem” analyzer as well as the analyzer available under the tradename "Vettest 8008” from Vettest Corporation.
- the reflectometer or detecting station of any analyzer can be used to provide the response R standard ; that is any analyzer can be the "standard” analyzer.
- any analyzer can be the "standard” analyzer.
- the "E700" analyzers available from Eastman Kodak Company have been selected as the "standard” analyzer for this invention.
- any other analyzer used as the field analyzer is then programmed pursuant to this invention to convert the detected response into the corresponding value that would have been produced on the "E700".
- calibration mathematics which is passed along with the slide elements of any given chemistry, are presented as though those slide elements were to be read on an actual "E700" as the field analyzer, even though they may not be.
- calibration mathematics includes not only the calibration parameters but also any relevant spline information and concentrations associated with calibrators.
- the "Vettest 8008" reflectometer uses LEDs for its visible light and mercury vapor bulbs for UV, which illuminate the slide elements at wavelengths which differ from those used for any given chemistry on the "E700".
- the "DT-60” reflectometer differs even more in that it uses a contact read station, instead of the non-contact read station of the "E700", created by the fiber optics construction shown, for example, in US-A-4 302 420.
- the function then of the invention is to correct the raw reading of, say, the "DT-60” analyzer or the “Vettest 8008" analyzer to the corresponding reading which would have been obtained on the "E700” analyzer.
- This is not as important for the "DT-60” analyzer because its slide elements are packaged differently and its calibration mathematics is passed on different media, as noted above, such packaging or media could change at a future date and be so similar to the packaging and media of the slide elements for the "E700" as to warrant the use of this invention.
- the procedure of the invention is schematically illustrated in Figure 2.
- the plot of this Figure correlates the response obtained on the field analyzer, R F , to the response R standard obtained or expected on the "standard” analyzer, here, the "E700". Because the R standard values are conventionally correlated to the concentration, as defined by Quadrant III of this plot, the correlation of R F to R standard will act to convert the field analyzer responses to the concentration predictable as though the analyzer were a "standard" analyzer.
- a spline function is generated for the reading R F to create a g F (R F ) value that most closely fits the data, as is conventional for spline functions and is described in, for example, Industrial Applications of Cubic Spline Functions , by N. J. Barosi, October 26, 1973, pp. 3-6, (A Presentation to the 17th Annual Technical Conference of The American Society for Quality Control and The American Statistical Association), and Splines and Statistics , by Edward J. Wegman and Ian W. Wright, "Journal of the American Statistical Association", June 1983, Volume 78, Number 382, Theory and Methods Section, pp. 351-352.
- the coefficients B 0 , B 1 and B 2 are the resulting solution of the equation that best fits the data of the plot of g F (R F ) versus R standard .
- the preceding is handled using fresh slide elements from a standard lot of a given chemistry, the same lot of which is to be used on the field analyzer, also fresh.
- R F the raw response
- equation (II) is of the same form as equation (I), so that A 0 , A 1 and A 2 can be incorporated into B 0 ', B 1 ' and B 2 ', thus correlating for analyzer variation, slide element aging, and lot-to-lot variances, all at once.
- the curve may be expected to have shifted to a position such as is shown in phantom.
- the steps of the process of the invention involving reading a response of calibrator liquid of known concentration on a slide element, first on the standard analyzer and then on the field analyzer, is preferably done using three different levels of calibrator liquid.
- one or two levels of calibrators are sufficient if the only difference to be adjusted for is a difference within a single type of field analyzer so as to be just a slope or intercept change or both.
- the "standard” analyzer was an “E700” analyzer available from Eastman Kodak Company.
- Example 1 Glucose Slide Elements in a Vettest 8008 Analyzer
- the field analyzer was a "Vettest 8008" analyzer, and the slide elements were "Ektachem” glucose slide elements from Eastman Kodak Company.
- a set of 20 fluids with glucose concentrations ranging from 30 to 600 mg/dL were collected. These fluids were spotted onto slides from one lot of glucose test slides and the amount of color formed was read by the two analyzers.
- a graph of the data and the quadratic function can be found in Figure 3.
- R standard (E700 Reflectance) Vettest R F Reflectance Corrected R F Reflectance Difference from R standard 0.1489 0.2603 0.1505 +0.0016 0.0982 0.1949 0.1014 +0.0032 0.2103 0.3299 0.2087 -0.0016 0.2546 0.3805 0.2549 +0.0003 0.3356 0.4641 0.3384 +0.0028 0.3025 0.4281 0.3014 -0.0011 0.5392 0.6357 0.5376 -0.0016 0.5526 0.6484 0.5538 +0.0012 0.0537 0.1256 0.0553 +0.0016 0.0322 0.0825 0.0297 -0.0025 0.2195 0.3420 0.2195 NONE 0.0555 0.1270 0.0562 +0.0007 0.1481 0.2597 0.1500 +0.0019 0.1976 0.3180 0.1983 +0.0017 0.1742 0.2860 0.1712
- the resulting responses are tabulated in Table 3.
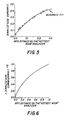
- the g F function was represented as the following cubic spline: X-Value Y-Value 2nd Derivative 0.0 0.0 0.0 0.02 0.067684 -31.76737 0.12 0.275344 -2.2153 1.0 1.0 0.0 to be used to provide a curve such as forms quadrant I of Figure 2. More specifically, the relation of R F of Table 3, and this g F (R F ) is shown in Figure 6.
- FIG. 8 A plot of the standard BUN response to concentration relationship for the lot of BUN slides is located in Figure 8. The predicted concentrations are printed in Table 6. For comparison, a predicted concentration from R F , uncorrected, is also shown.
- E700 Reflectance DT60 Reflectance Corrected R F (DT60) Reflectance 0.4482 0.5487 0.4488 0.0828 0.1348 0.0830 0.0298 0.0554 0.0289 0.3233 0.4238 0.3236 0.3108 0.4100 0.3105 0.3368 0.4359 0.3351 0.3190 0.4207 0.3206 0.2231 0.3086 0.2194 0.2984 0.3978 0.2991 0.1593 0.2370 0.1602 0.2141 0.3019 0.2137 0.0655 0.1132 0.0677 0.0668 0.1134 0.0679 0.0877 0.1420 0.0881 0.0372 0.0705 0.0388 0.0375 0.0700 0.0385 0.0350 0.0658 0.0357 0.0225 0.0411 0.0198 0.0255 0.0473 0.0237
- the resulting responses are tabulated in Table 9.
- Figure 13 is a graphical representation of the use of the invention in factory calibration.
- the left hand quadrant depicts the analyzer characterization and the right hand quadrant depicts the test element characterization.
- equation (I) is a correction of the field analyzer response of whatever type (Dr, rate or mv) to the standard response.
- the curve F Lot is found by calibrating the test element on the analyzer chosen as the standard analyzer for factory calibration using the test element's wet calibration model. The mathematical relationship of this curve is then passed on to the customer in suitable coded form, for example, a bar code associated with the test element.
- Analyzer 6 of the nine analyzers was used as the standard analyzer for the factory calibration model since this analyzer was a typical "E700" analyzer. Therefore, the K-Model wet calibration curve found for each coating on analyzer 6 served as the web characterization curve F Lot , Figure 13, for each coating. (All remaining analyzers are treated as "field analyzers".) Table 11 contains calibrator response information on coating 1 used in computing the analyzer characterizations. Analyzer Cal 1 Dr Cal 2 Dr Cal 3 Dr.
- Figure 15 shows the distribution of predictions for the control fluid 24102 using the factory calibration technique, that is, after converting the Dr readings on analyzer 8 as the "Field Response", left quadrant of Figure 13, to "predicted Concentration" in the right quadrant.
- the variance of predicted concentration using the factory calibration of this invention is similar to the variance obtained when one uses the K-Model conventional three-level wet calibration method.
- Example 5 The same control was used as for Example 5, that is, a calibration curve was found for each analyzer/slide lot combination using a conventional wet calibration protocol of 2 repetitions of each calibrator fluid. All repetitions of fluids, run on a given analyzer/slide lot combination, were predicted through that analyzer/slide lot combination's K-Model calibration curve.
- analyzer 9 was used as the standard analyzer for the factory calibration since this analyzer was a typical "E700" analyzer. Therefore, the K-Model wet calibration curve found for each slide lot on analyzer 9 served as the web characterization curve F Lot for each lot. Since analyzer 9 was chosen as the standard, a quadratic function, Equation (I), was found for each analyzer which converted the given analyzer's rate to analyzer 9 rate.
- the variances of predicted concentration using the factory calibration model are only slightly greater than the variance obtained when one uses the conventional K-Model three-level customer wet calibration model.
Landscapes
- Physics & Mathematics (AREA)
- Immunology (AREA)
- General Health & Medical Sciences (AREA)
- Pathology (AREA)
- Biochemistry (AREA)
- Health & Medical Sciences (AREA)
- Life Sciences & Earth Sciences (AREA)
- Chemical & Material Sciences (AREA)
- Analytical Chemistry (AREA)
- General Physics & Mathematics (AREA)
- Mathematical Physics (AREA)
- Spectroscopy & Molecular Physics (AREA)
- Engineering & Computer Science (AREA)
- Theoretical Computer Science (AREA)
- Investigating Or Analysing Materials By The Use Of Chemical Reactions (AREA)
- Automatic Analysis And Handling Materials Therefor (AREA)
- Investigating Or Analysing Materials By Optical Means (AREA)
- Investigating Or Analysing Biological Materials (AREA)
Description
- This invention relates to a method of calibrating a clinical analyzer so that it can be used with slide elements calibrated for use on a drastically different type of analyzer than the one actually used.
- Certain dried, slide test elements, such as the elements available under the trademark "Ektachem" from Eastman Kodak Company, are capable of use on a variety of different analyzers. These latter include the "Ektachem 700" analyzer and the "Ektachem DT-60" analyzer, both available from Eastman Kodak Company. However, when a test element is used on one type of analyzer, for example, one that uses one kind of reflectometer, it tends to produce a different correlation between detected response and analyte concentration, than it produces when read on a second type of analyzer, for example, one that uses a second type of reflectometer. As a result, the correlation between detected response and concentration is different, for any given test element, when read on for example, the "Ektachem DT-60" analyzer, compared to its reading on the "Ektachem 700" analyzer.
- Such different correlations require that a different calibration curve establishing the correlation, be used for each different kind of analyzer. Different calibration mathematics has to be established for each different type of analyzer. This requires the "proper" type analyzer be used at the factory to determine the calibration, rather than any possible analyzer. Such different calibration curves and the related calibration mathematics have to be "carried" with the test element in question such as by bar coding and/or magnetic disk. Importantly, the correction for such variation is different depending on what kind of analyzer is to be used for detection. As a result, the test elements have to be somehow segregated, using such a system, based on which type of analyzer the elements have been tested on and are destined for. In sum, the test elements have to be paired with a particular type of analyzer, especially if all or some of the calibration mathematics is being passed along with the test elements.
- Such pairings or segregation has not been a problem when there are only two basic types of analyzers to choose from, for example, the "Ektachem 700" type and the "Ektachem DT-60" type. The reason is that the "DT-60" type elements have already been packaged differently (individually) from the packaging of the "700" types (by cartridge), and the calibration mathematics is passed differently, so that segregation occurs naturally. Where a problem arises is when yet a third type of analyzer is introduced that also packages test elements in a manner that is similar to either of the first two noted above. As a result, the test elements can end up being used on an analyzer for which the test elements bear the wrong calibration mathematics. Keeping track of which test element is to go to what type of analyzer, and thus is to have what calibration mathematics "carried" with it, becomes a horrendous logistics problem.
- Therefore, there has been a problem prior to this invention of devising correction factors for the calibration of test elements which will not be different due to which type of analyzer the element ends up being tested on.
- It is known to have a correction method which relates an aged test element to that element when fresh, or a lot-varied element of a given assay to a standard element of that assay, when always used on the same analyzer. Such a method is shown for optical density in US-A-4 884 213. However, that method makes no correction for analyzer-to-analyzer variations, and furthermore incorrectly asserts that the variations which are discussed can always be corrected by a linear relationship.
- The invention is based on the discovery that a relationship exists between how a given test element will perform on one type of analyzer, compared to how it will perform on a standard analyzer, such as on the Kodak "Ektachem 700"™, hereinafter "E700", analyzer, so that this relationship can be programmed into that one type of analyzer to make its response LOOK like it is a "E700" analyzer response. Once that occurs, correction factors can be sent with all test elements of an assay as though they were all to be tested on the one single type of analyzer, namely (in this case) the "E700" analyzer.
- Prior art document US Patent No. 4,959,796 discloses a method of producing an analytical curve for an analyzing apparatus which provides an analysis result on the basis of the analytical curve in response to a measurement value obtained by photo-electrically measuring light intensity reflected from a slide to be analyzed. The slides are analyzed by first and second analyzing apparatus and the relation between the measurements obtained.
- Prior art document US Patent No. 4,866,644 discloses a calibration system for optical instruments of the type which make measurements at incrementally spaced wavelengths throughout a spectrum. The plurality of standard samples are measured by a master instrument and a field instrument. The measurement data obtained from each instrument are then statistically correlated to determine a calibration file which is stored with the field instrument. This prior art document teaches non-quantitative results dealing with the optics in a non-clinical chemistry field and the use of linear equations.
- Prior art document EP-A-0496455 is prior art in accordance with Article 54(3)EPC which teaches a transfer of calibration coefficients when tested on one type of analyzer.
- In accordance with the present invention, there is provided a method as defined in the claims of quantitatively determining an analyte in a liquid sample applied to a slide element by measuring in a read station of a field analyzer a response developed in the slide element and correlating said response to an analyte concentration using a calibration curve produced from calibrators having known concentrations, such slide elements being selected from a set of slide elements that all produce the same response in said field analyzer except for deviations due to lot-to-lot variations or aging, said same response being a function of the kind of analyzer used;
wherein said response on said analyzer is corrected substantially to the response that would have been detected on a standard analyzer of a type different from said field analyzer and having one of said calibration curves for correlating the response to an analyte concentration, by the steps of: - a) applying at least one level of said calibrators on at least one of said set of slide elements and reading the response in said standard analyzer,
- b) repeating step (a) but by reading their response in said field analyzer;
- c) correlating the relationship of the
different responses in said two analyzers by using the
equation (I):
- d) applying an unknown patient liquid sample to a slide element selected from said set of slide elements and reading a response in said read station of said field analyzer;
- e) ascertaining from said correlation of step (c) what said read response in said field analyzer in step (d) would produce as the corresponding response in said standard analyzer, and
- f) correlating said ascertained corresponding response to the predicted analyte concentration using said calibration curve of said standard analyzer.
-
- As used herein, "field analyzer" refers to the analyzer used by the customer, which may be the same or a different type as was selected for the standard analyzer.
- Thus, it is an advantageous feature of the invention that the calibration of the field analyzer being used is expressed in terms of a single standard analyzer, so that differences introduced by variations in the analyzer type are automatically corrected and the same slide elements can be used in both analyzers even though the calibration mathematics is derived for only a single type of analyzer.
- It is a related advantageous feature of the invention that the slide test element bearing a set of calibration parameters is useful in a variety of analyzers having different constructions, rather than just one, and such test elements with their calibration mathematics need not be supplied to only one type of analyzer.
- For a better understanding of the present invention, reference will now be made, by way of example only, to the accompanying drawings in which:-
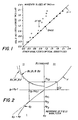
- Figure 1 is a plot of the optical density detected from certain reference elements of known density, using on one hand the standardization analyzer (here, the "E700" analyzer), and, on the other hand, various other analyzers which can be used as field analyzers;
- Figure 2 is a schematic plot which is illustrative of the steps of the invention;
- Figure 3 is a plot of Quadrants I and II of Figure 2 for a given example of chemistry and a given field analyzer where the gF function is unity and contributes no correction;
- Figure 4 is a plot of Quadrant III of Figure 2, for the chemistry of Figure 3;
- Figure 5 is a plot similar to Figure 3, but for a different chemistry;
- Figure 6 is a plot corresponding to the chemistry of Figure 5 using, however, a gF correction provided in the manner indicated in Quadrant I;
- Figure 7 is a plot similar to that of Figure 5, after the correction of Figure 6 has been applied;
- Figure 8 is a plot of Quadrant III of Figure 2, for the chemistry and results obtained from Figure 7;
- Figure 9 is a plot similar to that of Figure 3, but for yet another field analyzer;
- Figure 10 is a plot similar to that of Figure 4, for the analyzer of Figure 9;
- Figure 11 is a plot similar to that of Figure 3, illustrating the invention when using a rate assay;
- Figure 12 is a plot of Quadrant III of Figure 2, but for the rate assay of Figure 11;
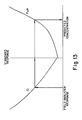
- Figure 13 is a plot similar to that of Figure 2, but illustrating an alternative embodiment, namely factory calibration; and
- Figures 14 and 15 are respective plots of distributions of predictions of concentration using either the conventional K-Model method or the calibration method of the invention.
-
- The invention is hereinafter described in connection with certain preferred embodiments, featuring preferred slide test elements tested in preferred clinical analyzers, wherein calibration mathematics is transmitted by bar codes and/or magnetic disk. In addition, the invention is useful regardless of the form of the test elements, regardless of which types of analyzers are used, and regardless of the mode of transmission of the calibration mathematics, so long as one kind of analyzer is selected as a standard, producing a response against which the response of any other analyzer is compared and corrected as part of the calibration.
- The preferred test elements are the slide test elements available from Eastman Kodak Company under the trademark "Ektachem" slides. Such slide elements provide a raw response in the analyzer which is either a reflectance R, an optical density OD where OD = log(l/R), the rate of change of either R, OD, or a transformed OD, or an electrical potential created by a differential measurement of ion concentration in two ion-selective electrodes. Any one of these responses can be calibrated by this invention. (A "transformed OD" is an optical density value obtained through a spline function from raw optical density values to correct for interferences or to convert to other densities, for example, by using a transform such as the Clapper-Williams transform.)
- The preferred analyzers are any of the analyzers available from Eastman Kodak Company under the trademark "Ektachem" analyzer as well as the analyzer available under the tradename "Vettest 8008" from Vettest Corporation.
- The reflectometer or detecting station of any analyzer can be used to provide the response Rstandard; that is any analyzer can be the "standard" analyzer. For convenience, due to their common occurrence in industry, the "E700" analyzers available from Eastman Kodak Company have been selected as the "standard" analyzer for this invention.
- Any other analyzer used as the field analyzer, is then programmed pursuant to this invention to convert the detected response into the corresponding value that would have been produced on the "E700". Thus, calibration mathematics which is passed along with the slide elements of any given chemistry, are presented as though those slide elements were to be read on an actual "E700" as the field analyzer, even though they may not be. As used herein, "calibration mathematics" includes not only the calibration parameters but also any relevant spline information and concentrations associated with calibrators.
- The problem created by different types of analyzers being used to read the same slide elements using only "E700" calibration mathematics, is illustrated in Figure 1. A series of magenta slides of permanent, differing optical density were read both on the "E700" reflectometer or read station, and then on one of the following reflectometers (or read stations): the reflectometer for the "DT-60"™ analyzer of Eastman Kodak Company, or the reflectometer of the "E400"™ analyzer of Eastman Kodak Company. The X=Y line indicates the substantial identity which is achieved if the "other" analyzer is in fact the "E700" analyzer. Because the results obtained on the "E400" analyzer fall substantially on the X=Y line, it can be assumed, and indeed has been shown, that the "E400" is in fact just another "E700" as far as its calibration mathematics is concerned.
- However, the other reflectometer, that of the "DT-60", produces results which deviate significantly from the X=Y line. It can be further shown that the "
Vettest 8008", if plotted on Figure 1, would produce substantial deviation from the X=Y line. A still further example would be a reflectometer identical to that of the "E700" analyzer, except for items such as the incubator for that reflectometer being maintained at a temperature substantially different from that of the "E700" analyzer, or the dispensing station being different, and so forth. - These deviations are not surprising due to the differences noted. The "
Vettest 8008" reflectometer uses LEDs for its visible light and mercury vapor bulbs for UV, which illuminate the slide elements at wavelengths which differ from those used for any given chemistry on the "E700". The "DT-60" reflectometer differs even more in that it uses a contact read station, instead of the non-contact read station of the "E700", created by the fiber optics construction shown, for example, in US-A-4 302 420. - The function then of the invention is to correct the raw reading of, say, the "DT-60" analyzer or the "
Vettest 8008" analyzer to the corresponding reading which would have been obtained on the "E700" analyzer. Although this is not as important for the "DT-60" analyzer because its slide elements are packaged differently and its calibration mathematics is passed on different media, as noted above, such packaging or media could change at a future date and be so similar to the packaging and media of the slide elements for the "E700" as to warrant the use of this invention. - The procedure of the invention is schematically illustrated in Figure 2. The plot of this Figure correlates the response obtained on the field analyzer, RF, to the response Rstandard obtained or expected on the "standard" analyzer, here, the "E700". Because the Rstandard values are conventionally correlated to the concentration, as defined by Quadrant III of this plot, the correlation of RF to Rstandard will act to convert the field analyzer responses to the concentration predictable as though the analyzer were a "standard" analyzer.
- Quadrant II of the plot takes a function gF(RF), and correlates that function to Rstandard by the equation (I) noted above, where it is assumed that k is a value that is either 0 or 2. (If the graph is curved as shown, k is 2.) If, in fact, the raw response RF is a quadratic function, or a linear function (k=0 and B2=0), of Rstandard, then gF(RF) is in fact simply RF and the curve gF of Quadrant I becomes the identity line shown in phantom in quadrant I. The only time gF, or Quadrant I, is not unity and must be used, is if k truly is not equal to zero or 2 in equation (I) of Quadrant II. For such occasions, such as the blood urea nitrogen (BUN) example set forth below, a spline function is generated for the reading RF to create a gF(RF) value that most closely fits the data, as is conventional for spline functions and is described in, for example, Industrial Applications of Cubic Spline Functions, by N. J. Barosi, October 26, 1973, pp. 3-6, (A Presentation to the 17th Annual Technical Conference of The American Society for Quality Control and The American Statistical Association), and Splines and Statistics, by Edward J. Wegman and Ian W. Wright, "Journal of the American Statistical Association", June 1983, Volume 78, Number 382, Theory and Methods Section, pp. 351-352. Most preferably, the spline is adjusted so as to render the Rstandard a quadratic function of gF(RF). It is then this gF(RF) value that can be correlated, quadrant II, to Rstandard by the quadratic equation (I) where k = 2. The coefficients B0, B1 and B2 are the resulting solution of the equation that best fits the data of the plot of gF(RF) versus Rstandard.
- Ideally, the preceding is handled using fresh slide elements from a standard lot of a given chemistry, the same lot of which is to be used on the field analyzer, also fresh. However, as has been shown in, for example, Us-A-4 884 213, slight variances can be introduced in the raw response RF and thus, gF(RF), when either a new lot of slide elements for the same chemistry is prepared, or when the slide elements actually tested on the field analyzer are aged. Unfortunately, in most cases the slide elements actually used in the field analyzer will either be aged or from a different lot, or both, and further correction is required. Such correction is obtained, by plotting Rvariance against Rstandard', where Rvariance is the response of the aged or lot-varied slide element, and Rstandard' is the response of a fresh slide element from the lot selected to be the "standard" lot, and determining the best fit in accordance with equation (II):
- Once the curve shape of Quadrant II is ascertained, then it is possible to pass on the calibration mathematics obtained from the standard analyzer for any given chemistry to the field analyzer, using the field analyzer gF and by computing B0, B1 and B2 at the customer site. Thus, each new generation of slide elements need not be tested on all the different analyzer types, nor would separate calibration mathematics for each type of analyzer, and slide elements with such mathematics, be carefully sheparded only to that type of analyzer. Instead, the new generation and a single set of calibration mathematics becomes applicable to all analyzer types.
- The steps of the process of the invention involving reading a response of calibrator liquid of known concentration on a slide element, first on the standard analyzer and then on the field analyzer, is preferably done using three different levels of calibrator liquid. However, one or two levels of calibrators are sufficient if the only difference to be adjusted for is a difference within a single type of field analyzer so as to be just a slope or intercept change or both.
- The following examples further illustrate the scope of the invention.
- In all of these examples, the "standard" analyzer was an "E700" analyzer available from Eastman Kodak Company.
- In this example, the field analyzer was a "
Vettest 8008" analyzer, and the slide elements were "Ektachem" glucose slide elements from Eastman Kodak Company. A set of 20 fluids with glucose concentrations ranging from 30 to 600 mg/dL were collected. These fluids were spotted onto slides from one lot of glucose test slides and the amount of color formed was read by the two analyzers. The standard responses were plotted versus the responses of the field analyzer and a quadratic polynomial was fit to the data resulting in B0, B1, B2 = -0.01263, 0.46095, 0.62659 respectively. A graph of the data and the quadratic function can be found in Figure 3. Standardized responses for the field analyzer were found by evaluating:Rstandard (E700 Reflectance) Vettest RF Reflectance Corrected RF Reflectance Difference from Rstandard 0.1489 0.2603 0.1505 +0.0016 0.0982 0.1949 0.1014 +0.0032 0.2103 0.3299 0.2087 -0.0016 0.2546 0.3805 0.2549 +0.0003 0.3356 0.4641 0.3384 +0.0028 0.3025 0.4281 0.3014 -0.0011 0.5392 0.6357 0.5376 -0.0016 0.5526 0.6484 0.5538 +0.0012 0.0537 0.1256 0.0553 +0.0016 0.0322 0.0825 0.0297 -0.0025 0.2195 0.3420 0.2195 NONE 0.0555 0.1270 0.0562 +0.0007 0.1481 0.2597 0.1500 +0.0019 0.1976 0.3180 0.1983 +0.0017 0.1742 0.2860 0.1712 -0.0030 0.1073 0.2067 0.1098 +0.0025 0.1270 0.2321 0.1287 +0.0017 0.1690 0.2768 0.1637 -0.0053 0.1380 0.2416 0.1359 -0.0021 0.0394 0.0976 0.0384 -0.0010 E700 Concentration Concentration from RF Uncorrected Response Concentration from R F Corrected % Error in Corrected Response Compared to E700 180 106 178 1.1 252 142 246 2.4 132 80 133 0.8 108 66 108 0 78 46 77 1.2 89 55 89 0 37 27 38 2.6 36 26 38 5.6 85 207 378 1.8 564 287 600 6.4 126 76 126 0 377 206 374 0.8 181 106 179 1.1 140 84 139 0.7 157 95 160 1.9 235 134 231 1.7 205 119 203 1.0 161 99 166 3.1 192 115 195 1.6 481 253 490 1.9 - Thus, the calibration of this invention successfully converted the response (here reflectance) of the field analyzer (here, a "
Vettest 8008") to the values that would have occurred if such slide elements (here, for glucose) were read on the standard analyzer. Because the equation of quadrant II of Figure 2 was essentially quadratic in nature, there was no need to use quadrant I in this example. Equivalently, gF(RF)=RF in this example. - The same analyzers were used in this test as in Example 1. A set of 20 fluids with BUN concentrations ranging from 10 to 90 mg/dL were collected. These fluids were spotted onto slides from one lot of BUN test slides and the amount of color formed was read by the two analyzers. The standard responses were plotted versus the responses of the field analyzer and a quadratic polynomial was fitted to the data resulting in B0, B1, B2= 0.02845, 2.2517, -3.0861 respectively. A graph of the data and the quadratic function can be found in Figure 5. Standardized responses for the field analyzer were found by evaluating:
R standard E700 Reflectance Vettest Reflectance Corrected RF Reflectance 0.2013 0.0845 0.1967 0.3654 0.2153 0.3701 0.3899 0.2344 0.3867 0.2881 0.1455 0.2908 0.3127 0.1668 0.3182 0.2197 0.0958 0.2158 0.1298 0.0429 0.1193 0.3917 0.2392 0.3905 0.2525 0.1207 0.2553 0.3082 0.1622 0.3125 0.3749 0.2199 0.3744 0.4162 0.2668 0.4095 0.1722 0.0652 0.1620 0.1137 0.0324 0.0982 0.0319 0.0065 0.0430 0.0342 0.0068 0.0435 0.0312 0.0066 0.0431 0.1373 0.0462 0.1258 0.2871 0.1479 0.2940 0.2864 0.1488 0.2952 E700 Concentration Concentration from RF Uncorrected Concentration from RF Corrected 30 58 31 14 28 13 12 26 12 20 40 20 18 36 17 28 54 28 44 80 47 12 25 12 24 46 23 18 37 18 13 28 13 11 22 11 35 66 37 48 89 53 89 135 80 87 134 79 90 135 80 42 77 45 20 40 19 20 40 19 - Hence, a gF function was found to remove the non-quadratic response differences that existed between the "E700" and the field analyzer. The gF function was represented as the following cubic spline:
X-Value Y-Value 2nd Derivative 0.0 0.0 0.0 0.02 0.067684 -31.76737 0.12 0.275344 -2.2153 1.0 1.0 0.0 - The standard responses, Rstandard, were plotted versus the responses of the field analyzer. The field analyzer responses were evaluated through gF and then a quadratic polynomial, which changed transformed field analyzer responses to standard responses, was found. This resulted in B0, B1, B2 = 0.013317, 0.881242, -0.029543 respectively. A graph of the data and the correction curve can be found in Figure 7. Standardized responses for the field analyzer were found by evaluating:
Rstandard E700 Reflectance Vettest RF Reflectance g F (R F ) Corrected Reflectance from gF(RF) 0.2013 0.0845 0.2195 0.2053 0.3654 0.2153 0.4060 0.3662 0.3899 0.2344 0.4300 0.3868 0.2881 0.1455 0.3122 0.2856 0.3127 0.1668 0.3419 0.3112 0.2197 0.0958 0.2383 0.2217 0.1298 0.0429 0.1325 0.1296 0.3917 0.2392 0.4359 0.3919 0.2525 0.1207 0.2764 0.2546 0.3082 0.1622 0.3356 0.3057 0.3749 0.2199 0.4119 0.3713 0.4162 0.2668 0.4960 0.4201 0.1722 0.0652 0.1831 0.1737 0.1137 0.0324 0.1048 0.1053 0.0319 0.0065 0.0227 0.0333 0.0342 0.0068 0.0235 0.0340 0.0312 0.0066 0.0228 0.0334 0.1373 0.0462 0.1407 0.1367 0.2871 0.1479 0.3156 0.2885 0.2864 0.1488 0.3169 0.2896 E700 Concentration Concentration from RF Uncorrected Concentration from gF(RF) % Error Compared to Cstandard 30 58 30 0 14 28 14 0 12 26 12 0 20 40 20 0 18 36 18 0 28 54 27 3.7 44 80 44 0 12 25 12 0 24 46 23 4.2 18 37 18 0 13 28 13 0 11 22 10 9.1 35 66 35 0 48 89 51 6.3 89 135 88 1.1 87 134 87 0 90 135 88 2.2 42 77 42 0 20 40 20 0 20 40 20 0 - The procedure of Example 1 was repeated, except that the field analyzer was a "DT-60" analyzer from Eastman Kodak Company. A set of 19 fluids with glucose concentrations ranging from 48 to 710 mg/dL were collected. These fluids were spotted onto slides from one lot of glucose test slides and the amount of color formed was read by the two analyzers. The standard responses were plotted versus the responses of the field analyzer and a quadratic polynomial was fit to the data resulting in (B0, B1, B2 = -0.005724, 0.602386, 0.412017). A graph of the data and the quadratic function can be found in Figure 9. Standardized responses for the field analyzer were found by evaluating:
E700 Reflectance DT60 Reflectance Corrected RF (DT60) Reflectance 0.4482 0.5487 0.4488 0.0828 0.1348 0.0830 0.0298 0.0554 0.0289 0.3233 0.4238 0.3236 0.3108 0.4100 0.3105 0.3368 0.4359 0.3351 0.3190 0.4207 0.3206 0.2231 0.3086 0.2194 0.2984 0.3978 0.2991 0.1593 0.2370 0.1602 0.2141 0.3019 0.2137 0.0655 0.1132 0.0677 0.0668 0.1134 0.0679 0.0877 0.1420 0.0881 0.0372 0.0705 0.0388 0.0375 0.0700 0.0385 0.0350 0.0658 0.0357 0.0225 0.0411 0.0198 0.0255 0.0473 0.0237 E700 Concentration Concentration from RF Uncorrected Concentration from RF (Corrected) 48 28 48 286 197 286 580 375 594 81 54 81 85 57 85 76 51 77 82 55 82 123 86 125 89 60 89 170 116 169 129 88 129 335 227 328 331 227 327 275 188 274 493 319 478 490 321 481 516 334 508 711 459 774 652 417 686 - The procedure of Example 1 was repeated, except that the field analyzer was a "
Vettest 8008" and the slide elements were "Ektachem" LDH slides from Eastman Kodak Company. A set of 20 fluids with LDH activities ranging from 182 to 1420 U/L were collected. These fluids were spotted onto slides from one lot of LDH test slides and the rate of change of optical density (OD) was read by the two analyzers. The standard responses were plotted versus the responses of the field analyzer and a quadratic polynomial was fit to the data resulting in (B0, B1, B2 = -0.00811, 1.20522, -1.51568). A graph of the data and the quadratic function can be found in Figure 11. Standardized responses for the field analyzer were found by evaluating:E700 Rate Vettest Rate Corrected Vettest Rate -0.0330 -0.0202 -0.0331 -0.0525 -0.0355 -0.0527 -0.0217 -0.0121 -0.0229 -0.0434 -0.0275 -0.0424 -0.0326 -0.0189 -0.0315 -0.0677 -0.0470 -0.0682 -0.0733 -0.0499 -0.0720 -0.0389 -0.0244 -0.0384 -0.0593 -0.0404 -0.0592 -0.0321 -0.0153 -0.0269 -0.0376 -0.0241 -0.0381 -0.0668 -0.0466 -0.0675 -0.0480 -0.0322 -0.0485 -0.0294 -0.0174 -0.0295 -0.0294 -0.0176 -0.0298 -0.0802 -0.0562 -0.0807 -0.0570 -0.0396 -0.0582 -0.0882 -0.0613 -0.0876 -0.0237 -0.0138 -0.0250 -0.0216 -0.0130 -0.0241 E700 Activity Uncorrected Vettest Activity Corrected Vettest Activity 418 154 419 791 466 796 184 -23 210 620 307 602 408 127 387 1065 689 1074 1163 743 1141 533 241 523 916 562 915 398 48 294 509 236 517 1050 681 1063 708 402 717 345 93 346 344 99 353 1283 860 1291 875 547 895 1419 951 1409 227 15 254 183 -1 235 Vettest 8008") to the values that would have occurred if such slide elements (here, for LDH) were read on the standard analyzer. Because the equation of quadrant II of Figure 2 was essentially quadratic in nature, there was no need to use quadrant I in this example. Equivalently, gF(RF)=RF in this example. - It is not necessary that the second and third steps of this invention (of reading the field analyzer response and establishing the coefficients of equation no. (I)) be done at the field site, called "wet calibration", although this is one use of the invention. In addition, it can all be done at the manufacturing site of the field analyzer. In many cases we have found that factory calibration results are comparable to results obtained using conventional wet calibration. (During such conventional wet calibration, the analyzer and slide elements are characterized at the customer site by reading the slide response of a number of calibrator fluids on the site's analyzer. This information is then used to define the relationship between analyte concentration and slide response for all patient samples on the site's analyzer.)
- Figure 13 is a graphical representation of the use of the invention in factory calibration. The left hand quadrant depicts the analyzer characterization and the right hand quadrant depicts the test element characterization. In factory calibration, equation (I) is a correction of the field analyzer response of whatever type (Dr, rate or mv) to the standard response. Conveniently, the quadratic form of equation (I) above is used, for example,
- The curve FLot is found by calibrating the test element on the analyzer chosen as the standard analyzer for factory calibration using the test element's wet calibration model. The mathematical relationship of this curve is then passed on to the customer in suitable coded form, for example, a bar code associated with the test element.
- The following examples demonstrate the effectiveness of this factory calibration technique.
- This test used the following:
- Nine "E700"™ analyzers manufactured by Eastman Kodak Company, which were intentionally varied, for example, by altering the volume to be metered or by changing the position of the spotted liquid on the test element from the optimum, to cause analyzer response differences; "Ektachem"™ elements from Eastman Kodak Company, from five different glucose coatings; three calibrator fluids; three control fluids; and two patient pools.
- Eight repetitions of each fluid were run on every analyzer/coating combination for a total of 360 (8 X 5 X 9) repetitions of each fluid.
- A calibration curve was found for each analyzer/coating combination using a conventional wet calibration protocol of 2 repetitions of each calibrator fluid. All repetitions of fluids, run on a given analyzer/coating combination, were predicted through that analyzer/coating combination's K-Model wet calibration curve. (Such "K-Model calibration is well known and is the method currently used in the "E400"™ and "E700"™ analyzers. Figure 14 shows the distribution of these predictions for the control fluid, 24102, which is comprised of a human serum base pool with normal glucose concentration.
- Analyzer 6 of the nine analyzers was used as the standard analyzer for the factory calibration model since this analyzer was a typical "E700" analyzer. Therefore, the K-Model wet calibration curve found for each coating on analyzer 6 served as the web characterization curve FLot, Figure 13, for each coating. (All remaining analyzers are treated as "field analyzers".) Table 11 contains calibrator response information on coating 1 used in computing the analyzer characterizations.
Analyzer Cal 1 Dr Cal 2 Dr Cal 3 Dr. 1 0.32250 1.17297 1.58588 2 0.33128 1.18523 1.60577 3 0.33210 1.19432 1.59229 4 033587 1.19345 1.59562 5 0.33847 1.20931 1.62825 6 0.32895 1.18602 1.60482 7 0.33482 1.21462 1.63463 8 0.32409 1.17470 1.59108 9 0.31762 0.17360 1.58352 - Since analyzer 6 was chosen as the standard, a quadratic function was found for each analyzer which converted the given analyzer's Dr to analyzer 6 Dr. The coefficients of the quadratic correction for each analyzer are listed in Table 12.
Analyzer B0 B1 B2 1 0.00590 1.000057 0.005153 2 -0.00595 1.012941 -0.006120 3 0.01719 0.923388 0.046278 4 0.00662 0.948520 0.033277 5 0.00075 0.965598 0.012007 6 0.0 1.0 0.0 7 0.00997 0.946787 0.017671 8 0.00187 1.009693 -0.001402 9 0.01693 0.977254 0.016108 - To provide a factory calibration curve for coating 4 on "field" analyzer 8, the following two steps are used:
- 1. The analyzer 8 characterization is used
to convert the Dr of the sample on analyzer 8 to the Dr
of the sample on the standard analyzer, that is,
analyzer 6, using:
- 2. The K-Model calibration curve for coating 4 on the standard analyzer, that is, analyzer 6, is used to convert standard Dr to concentration.
-
- The factory calibration curves for all analyzer/coating combinations are constructed in a similar manner. If a markedly different generation of slide elements, for example, of the "Ektachem" glucose elements, produces a drastically different correlation on the standard analyzer, new spline transformations will be then supplied to the field analyzers with that new generation of slide elements, for re-adjustment of the memory of the field analyzer. This is currently done by magnetic floppies for the "E700" and the "E400" analyzers manufactured by Eastman Kodak Company.
- All repetitions of fluids run on a given analyzer/coating combination are predicted through that analyzer/coating combination's factor calibration curve. Figure 15 shows the distribution of predictions for the
control fluid 24102 using the factory calibration technique, that is, after converting the Dr readings on analyzer 8 as the "Field Response", left quadrant of Figure 13, to "predicted Concentration" in the right quadrant. - The variance of predicted concentration across all analyzer/coating combinations for the three controls and two patient pools are printed in table 13. "Kodatrol 1" "Kodatrol 2" are lyophilized human serum-based control fluids available under these trade names from the Eastman Kodak Company, and are included to illustrate the ability of the factory calibration to work with a variety of liquids.
Fluid Concentration K-Model Variance Factory Calibration Variance Kodatrol I 88.31 1.84 1.53 Kodatrol II 303.33 7.32 7.04 Control 24102126.48 3.474 2.486 Human Pool 1 60.04 0.697 0.566 Human Pool 2 412.11 26.31 29.89 - The variance of predicted concentration using the factory calibration of this invention is similar to the variance obtained when one uses the K-Model conventional three-level wet calibration method.
- This example used the following:
- Nine "E700" analyzers from Eastman Kodak Company, which were intentionally varied to cause analyzer differences; five lots of "Ektachem" amylase slide elements from three different coatings; three calibrator fluids; three control fluids; and two patient pools.
- Eight repetitions of each fluid were run on every analyzer/slide lot combination for a total of 360 (8 x 5 x 9) repetitions of each fluid.
- The same control was used as for Example 5, that is, a calibration curve was found for each analyzer/slide lot combination using a conventional wet calibration protocol of 2 repetitions of each calibrator fluid. All repetitions of fluids, run on a given analyzer/slide lot combination, were predicted through that analyzer/slide lot combination's K-Model calibration curve.
- In this example, analyzer 9 was used as the standard analyzer for the factory calibration since this analyzer was a typical "E700" analyzer. Therefore, the K-Model wet calibration curve found for each slide lot on analyzer 9 served as the web characterization curve FLot for each lot. Since analyzer 9 was chosen as the standard, a quadratic function, Equation (I), was found for each analyzer which converted the given analyzer's rate to analyzer 9 rate.
- To provide a factory calibration curve for slide lot 4 on "field" analyzer 8 the following two steps were used:
- 1. The analyzer 8 characterization was used
to convert the rate of the sample on analyzer 8 to the
rate of the sample on the standard analyzer, that is,
analyzer 9, using:
- 2. The K-Model calibration curve for slide lot 4 on the standard analyzer, that is, analyzer 9, was used to convert standard rate to concentration.
-
- The factory calibration curves for all analyzer/slide lot combinations are constructed in a similar manner.
- All repetitions of fluids run on a given analyzer/slide lot combination were predicted through that analyzer/slide lot combination's factory calibration curve.
- The variance of predicted concentration across all analyzer/slide lot combinations for the three controls and two patient pools are printed in table 14.
Fluid Concentration K-Model Variance Factory Calibration Variance Kodatrol I 83.27 16.31 24.96 Kodatrol II 370.30 1110.33 1273.48 Control 2410253.64 8.39 7.99 Human Pool 1 706.31 974.10 993.70 Human Pool 2 379.32 140.57 212.34 - The variances of predicted concentration using the factory calibration model are only slightly greater than the variance obtained when one uses the conventional K-Model three-level customer wet calibration model.
- This data shows that the factory calibration method of the invention yields results similar to the conventional K-model three-level customer calibration model for glucose and amylase. Similar test data can be shown for most other "Ektachem" slide element chemistries.
Claims (8)
- A method of quantitatively determining an analyte in a liquid sample applied to a slide element by measuring in a read station of a field analyzer a response developed in the slide element and correlating said response to an analyte concentration using a calibration curve produced from calibrators having known concentrations, such slide elements being selected from a set of slide elements that all produce the same response in said field analyzer except for deviations due to lot-to-lot variations or aging, said same response being a function of the kind of analyzer used;
wherein said response on said analyzer is corrected substantially to the response that would have been detected on a standard analyzer of a type different from said field analyzer and having one of said calibration curves for correlating the response to an analyte concentration, by the steps of:a) applying at least one level of said calibrators on at least one of said set of slide elements and reading the response in said standard analyzer,b) repeating step (a) but by reading their response in said field analyzer;c) correlating the relationship of the different responses in said two analyzers by using a non-linear equation having the form of equation (I) :d) applying an unknown patient liquid sample to a slide element selected from said set of slide elements and reading a response in said read station of said field analyzer;e) ascertaining from said correlation of step (c) what said read response in said field analyzer in step (d) would produce as the corresponding response in said standard analyzer, andf) correlating said ascertained corresponding response to the predicted analyte concentration using said calibration curve of said standard analyzer. - A method as defined in claim 1, wherein said step (d) includes the further step of correcting for any deviation produced in said field analyzer due to lot-to-lot variations or aging variations so that said read response from said field analyzer corresponds to a standard fresh slide element of the type actually used in said step (a).
- A method as defined in claim 1 or 2, wherein said response is selected from the group consisting of reflectance R, optical density OD where OD = log (1/R); rate of change in R, OD or a transformed OD; or electrical potential created by a differential measurement of ion concentration in two ion-selective electrodes.
- A method as defined in claim 1, wherein said response is reflectance or optical density and said k of equation (I) is a value of 2.
- A method as defined in claim 1, wherein said response is the rate of change of either R or OD or a transformed OD.
- A method as defined in claim 1 or 2, wherein calibration mathematics is provided as a set of machine-readable digits with each set of slide elements sent to any one of said field analyzers, that are suitable to establish for said one field analyzer the value of said coefficients B0, B1 and B2.
- A method as defined in claim 1 or 2, wherein said steps a), b) and c) are done at a manufacturing facility for said field analyzer and wherein said equation (I) is stored in memory in said field analyzer, so that said field analyzer is factory-calibrated and does not need field calibration.
- A method as claimed in any of the preceding claims, wherein said equation (I) is quadratic.
Applications Claiming Priority (4)
| Application Number | Priority Date | Filing Date | Title |
|---|---|---|---|
| US67297691A | 1991-03-21 | 1991-03-21 | |
| US672976 | 1992-02-18 | ||
| US836694 | 1992-02-18 | ||
| US07/836,694 US5257212A (en) | 1991-03-21 | 1992-02-18 | Normalizing analyzer systems to a standard analyzer |
Publications (3)
| Publication Number | Publication Date |
|---|---|
| EP0505003A2 EP0505003A2 (en) | 1992-09-23 |
| EP0505003A3 EP0505003A3 (en) | 1995-05-24 |
| EP0505003B1 true EP0505003B1 (en) | 1999-08-11 |
Family
ID=27100858
Family Applications (1)
| Application Number | Title | Priority Date | Filing Date |
|---|---|---|---|
| EP92200767A Expired - Lifetime EP0505003B1 (en) | 1991-03-21 | 1992-03-18 | Normalizing analyzer systems to a standard analyzer |
Country Status (5)
| Country | Link |
|---|---|
| US (1) | US5257212A (en) |
| EP (1) | EP0505003B1 (en) |
| JP (1) | JP3172241B2 (en) |
| KR (1) | KR960016173B1 (en) |
| DE (1) | DE69229756T2 (en) |
Families Citing this family (11)
| Publication number | Priority date | Publication date | Assignee | Title |
|---|---|---|---|---|
| CA2156834A1 (en) * | 1993-02-23 | 1994-09-01 | Emery N. Brown | A computer system and method for measuring an analyte concentration with an affinity assay |
| JP3504750B2 (en) * | 1993-12-22 | 2004-03-08 | オルソ−クリニカル ダイアグノスティクス,インコーポレイティド | Recalibration method of calibration relational expression and quantitative test kit |
| US5532941A (en) * | 1994-07-08 | 1996-07-02 | Lin; Lawrence I. | Inter-laboratory performance monitoring system |
| US7273591B2 (en) | 2003-08-12 | 2007-09-25 | Idexx Laboratories, Inc. | Slide cartridge and reagent test slides for use with a chemical analyzer, and chemical analyzer for same |
| US7588733B2 (en) | 2003-12-04 | 2009-09-15 | Idexx Laboratories, Inc. | Retaining clip for reagent test slides |
| US9116129B2 (en) | 2007-05-08 | 2015-08-25 | Idexx Laboratories, Inc. | Chemical analyzer |
| US20100219085A1 (en) * | 2009-02-27 | 2010-09-02 | Edwards Lifesciences Corporation | Analyte Sensor Offset Normalization |
| US9797916B2 (en) | 2014-01-10 | 2017-10-24 | Idexx Laboratories, Inc. | Chemical analyzer |
| CA2900201C (en) * | 2014-08-25 | 2025-01-07 | Bio-Rad Laboratories, Inc. | Value assignment for customizable quality controls |
| WO2018005945A1 (en) * | 2016-06-30 | 2018-01-04 | Beckman Coulter, Inc. | Core calibration of analyzers |
| US11977091B2 (en) | 2020-07-10 | 2024-05-07 | Idexx Laboratories Inc. | Point-of-care medical diagnostic analyzer and devices, systems, and methods for medical diagnostic analysis of samples |
Family Cites Families (13)
| Publication number | Priority date | Publication date | Assignee | Title |
|---|---|---|---|---|
| JPS56155835A (en) * | 1980-05-02 | 1981-12-02 | Olympus Optical Co Ltd | Component analyzing method |
| JPS58109837A (en) * | 1981-12-24 | 1983-06-30 | Olympus Optical Co Ltd | Compensating method of calibration curve |
| US4581714A (en) * | 1983-09-09 | 1986-04-08 | Sensormedics Corporation | Method of calibrating and linearizing the output of fluid measuring instruments |
| US4627014A (en) * | 1984-04-09 | 1986-12-02 | Eastman Kodak Company | Method and apparatus for determination of an analyte and method of calibrating such apparatus |
| JPH0718853B2 (en) * | 1984-05-15 | 1995-03-06 | 住友化学工業株式会社 | Data processing method in chromatography |
| JPH0629852B2 (en) * | 1985-08-26 | 1994-04-20 | 富士写真フイルム株式会社 | Quantitative analysis method of test substance in liquid sample using biased dry analysis element |
| US4866644A (en) * | 1986-08-29 | 1989-09-12 | Shenk John S | Optical instrument calibration system |
| US4847793A (en) * | 1986-09-24 | 1989-07-11 | The Babcock & Wilcox Company | Updating physical property correlations with laboratory data |
| JPH01124751A (en) * | 1987-11-10 | 1989-05-17 | Konica Corp | Preparation of conversion expression |
| US4947355A (en) * | 1988-05-05 | 1990-08-07 | John Fluke Mfg. Co., Inc. | Modular electronic instrument system having automated calibration capability |
| US4864842A (en) * | 1988-07-29 | 1989-09-12 | Troxler Electronic Laboratories, Inc. | Method and system for transferring calibration data between calibrated measurement instruments |
| JP2654682B2 (en) * | 1989-02-17 | 1997-09-17 | 富士写真フイルム株式会社 | Biochemical analyzer, biochemical analysis correction method and correction value recording medium |
| US5126952A (en) * | 1991-01-22 | 1992-06-30 | Eastman Kodak Company | Bar coding calibration |
-
1992
- 1992-02-18 US US07/836,694 patent/US5257212A/en not_active Expired - Lifetime
- 1992-03-18 EP EP92200767A patent/EP0505003B1/en not_active Expired - Lifetime
- 1992-03-18 DE DE69229756T patent/DE69229756T2/en not_active Expired - Fee Related
- 1992-03-21 JP JP06429592A patent/JP3172241B2/en not_active Expired - Fee Related
- 1992-03-21 KR KR1019920004700A patent/KR960016173B1/en not_active Expired - Fee Related
Also Published As
| Publication number | Publication date |
|---|---|
| DE69229756D1 (en) | 1999-09-16 |
| KR920018482A (en) | 1992-10-22 |
| US5257212A (en) | 1993-10-26 |
| JPH0627116A (en) | 1994-02-04 |
| HK1003448A1 (en) | 1998-10-30 |
| EP0505003A2 (en) | 1992-09-23 |
| KR960016173B1 (en) | 1996-12-04 |
| EP0505003A3 (en) | 1995-05-24 |
| JP3172241B2 (en) | 2001-06-04 |
| DE69229756T2 (en) | 2000-01-13 |
Similar Documents
| Publication | Publication Date | Title |
|---|---|---|
| EP0496455A2 (en) | Bar coding calibration | |
| EP0453036B1 (en) | Analytical instrument and method of calibrating an analytical instrument | |
| Kemp | Theoretical aspects of one-point calibration: causes and effects of some potential errors, and their dependence on concentration. | |
| EP2145174B1 (en) | Method and apparatus for measuring ph of low alkalinity solutions | |
| US7129038B2 (en) | Method for selectively combining multiple membranes for assembly into test strips | |
| EP2724130B1 (en) | Method of normalizing a fluorescence analyzer | |
| EP1086366B1 (en) | A method in quality control of a spectrophotometer | |
| US6611777B2 (en) | Method for calibrating spectrophotometric apparatus | |
| US5257212A (en) | Normalizing analyzer systems to a standard analyzer | |
| CN105229447B (en) | Calibration method for photometry | |
| EP1391728A1 (en) | Method and apparatus for assigning calibration codes to diagnostic test strips on the basis of calibration parameters | |
| EP1017993B1 (en) | Spectroscopic analysis of samples with turbidity and high absorbance | |
| US5348889A (en) | Method for correcting a calibration curve | |
| US20030235923A1 (en) | Acceptance testing method for sets of multiple colored workpieces | |
| US5183761A (en) | Method of making calibration solution for verifying calibration and linearity of vertical photometers | |
| EP0653622A1 (en) | Method for correcting instrumental error of spectorscope of optical analyzer | |
| JPS6332132B2 (en) | ||
| HK1003448B (en) | Normalizing analyzer systems to a standard analyzer | |
| IE920897A1 (en) | Normalizing analyzer systems to a standard analyzer | |
| Westgard et al. | Comparison of Results from the Du Pont" ACA" and Technicon" SMA 12/60" | |
| Blijenberg et al. | Calibrators and control samples for bilirubinometers | |
| Buzoianu | Measurement uncertainty and its meaning in legal metrology of environmental chemistry and public health | |
| Bescupschi et al. | Optical Absorbance Liquid Filters as a New Path to Metrological Traceability in Medical Devices | |
| Igne et al. | 17 Calibration Transfer | |
| Buzoianu et al. | Some practical aspects of the validation of photometric systems for clinical analyses |
Legal Events
| Date | Code | Title | Description |
|---|---|---|---|
| PUAI | Public reference made under article 153(3) epc to a published international application that has entered the european phase |
Free format text: ORIGINAL CODE: 0009012 |
|
| AK | Designated contracting states |
Kind code of ref document: A2 Designated state(s): BE CH DE FR GB IT LI LU NL |
|
| PUAL | Search report despatched |
Free format text: ORIGINAL CODE: 0009013 |
|
| AK | Designated contracting states |
Kind code of ref document: A3 Designated state(s): BE CH DE FR GB IT LI LU NL |
|
| RAP1 | Party data changed (applicant data changed or rights of an application transferred) |
Owner name: CLINICAL DIAGNOSTIC SYSTEMS, INC. |
|
| RAP1 | Party data changed (applicant data changed or rights of an application transferred) |
Owner name: JOHNSON & JOHNSON CLINICAL DIAGNOSTICS, INC. |
|
| 17P | Request for examination filed |
Effective date: 19951026 |
|
| 17Q | First examination report despatched |
Effective date: 19980114 |
|
| GRAG | Despatch of communication of intention to grant |
Free format text: ORIGINAL CODE: EPIDOS AGRA |
|
| GRAG | Despatch of communication of intention to grant |
Free format text: ORIGINAL CODE: EPIDOS AGRA |
|
| GRAH | Despatch of communication of intention to grant a patent |
Free format text: ORIGINAL CODE: EPIDOS IGRA |
|
| GRAH | Despatch of communication of intention to grant a patent |
Free format text: ORIGINAL CODE: EPIDOS IGRA |
|
| GRAA | (expected) grant |
Free format text: ORIGINAL CODE: 0009210 |
|
| AK | Designated contracting states |
Kind code of ref document: B1 Designated state(s): BE CH DE FR GB IT LI LU NL |
|
| PG25 | Lapsed in a contracting state [announced via postgrant information from national office to epo] |
Ref country code: NL Free format text: LAPSE BECAUSE OF FAILURE TO SUBMIT A TRANSLATION OF THE DESCRIPTION OR TO PAY THE FEE WITHIN THE PRESCRIBED TIME-LIMIT Effective date: 19990811 Ref country code: BE Free format text: LAPSE BECAUSE OF FAILURE TO SUBMIT A TRANSLATION OF THE DESCRIPTION OR TO PAY THE FEE WITHIN THE PRESCRIBED TIME-LIMIT Effective date: 19990811 |
|
| REG | Reference to a national code |
Ref country code: CH Ref legal event code: EP |
|
| REG | Reference to a national code |
Ref country code: CH Ref legal event code: NV Representative=s name: E. BLUM & CO. PATENTANWAELTE |
|
| REF | Corresponds to: |
Ref document number: 69229756 Country of ref document: DE Date of ref document: 19990916 |
|
| ET | Fr: translation filed | ||
| ITF | It: translation for a ep patent filed | ||
| NLV1 | Nl: lapsed or annulled due to failure to fulfill the requirements of art. 29p and 29m of the patents act | ||
| PG25 | Lapsed in a contracting state [announced via postgrant information from national office to epo] |
Ref country code: LU Free format text: LAPSE BECAUSE OF NON-PAYMENT OF DUE FEES Effective date: 20000318 |
|
| PLBE | No opposition filed within time limit |
Free format text: ORIGINAL CODE: 0009261 |
|
| STAA | Information on the status of an ep patent application or granted ep patent |
Free format text: STATUS: NO OPPOSITION FILED WITHIN TIME LIMIT |
|
| 26N | No opposition filed | ||
| REG | Reference to a national code |
Ref country code: GB Ref legal event code: IF02 |
|
| PGFP | Annual fee paid to national office [announced via postgrant information from national office to epo] |
Ref country code: GB Payment date: 20070314 Year of fee payment: 16 Ref country code: CH Payment date: 20070314 Year of fee payment: 16 |
|
| PGFP | Annual fee paid to national office [announced via postgrant information from national office to epo] |
Ref country code: DE Payment date: 20070315 Year of fee payment: 16 |
|
| REG | Reference to a national code |
Ref country code: CH Ref legal event code: PFA Owner name: JOHNSON & JOHNSON CLINICAL DIAGNOSTICS, INC. Free format text: JOHNSON & JOHNSON CLINICAL DIAGNOSTICS, INC.#100 INDIGO CREEK DRIVE#ROCHESTER NEW YORK 14650 (US) -TRANSFER TO- JOHNSON & JOHNSON CLINICAL DIAGNOSTICS, INC.#100 INDIGO CREEK DRIVE#ROCHESTER NEW YORK 14650 (US) |
|
| PGFP | Annual fee paid to national office [announced via postgrant information from national office to epo] |
Ref country code: IT Payment date: 20070627 Year of fee payment: 16 |
|
| PGFP | Annual fee paid to national office [announced via postgrant information from national office to epo] |
Ref country code: FR Payment date: 20070308 Year of fee payment: 16 |
|
| REG | Reference to a national code |
Ref country code: CH Ref legal event code: PL |
|
| GBPC | Gb: european patent ceased through non-payment of renewal fee |
Effective date: 20080318 |
|
| REG | Reference to a national code |
Ref country code: FR Ref legal event code: ST Effective date: 20081125 |
|
| PG25 | Lapsed in a contracting state [announced via postgrant information from national office to epo] |
Ref country code: DE Free format text: LAPSE BECAUSE OF NON-PAYMENT OF DUE FEES Effective date: 20081001 Ref country code: LI Free format text: LAPSE BECAUSE OF NON-PAYMENT OF DUE FEES Effective date: 20080331 Ref country code: CH Free format text: LAPSE BECAUSE OF NON-PAYMENT OF DUE FEES Effective date: 20080331 |
|
| PG25 | Lapsed in a contracting state [announced via postgrant information from national office to epo] |
Ref country code: FR Free format text: LAPSE BECAUSE OF NON-PAYMENT OF DUE FEES Effective date: 20080331 |
|
| PG25 | Lapsed in a contracting state [announced via postgrant information from national office to epo] |
Ref country code: GB Free format text: LAPSE BECAUSE OF NON-PAYMENT OF DUE FEES Effective date: 20080318 |
|
| PG25 | Lapsed in a contracting state [announced via postgrant information from national office to epo] |
Ref country code: IT Free format text: LAPSE BECAUSE OF NON-PAYMENT OF DUE FEES Effective date: 20080318 |