EP0489135B1 - Method for attribute tracking in seismic data - Google Patents
Method for attribute tracking in seismic data Download PDFInfo
- Publication number
- EP0489135B1 EP0489135B1 EP91911657A EP91911657A EP0489135B1 EP 0489135 B1 EP0489135 B1 EP 0489135B1 EP 91911657 A EP91911657 A EP 91911657A EP 91911657 A EP91911657 A EP 91911657A EP 0489135 B1 EP0489135 B1 EP 0489135B1
- Authority
- EP
- European Patent Office
- Prior art keywords
- trace
- seed
- traces
- point
- depth
- Prior art date
- Legal status (The legal status is an assumption and is not a legal conclusion. Google has not performed a legal analysis and makes no representation as to the accuracy of the status listed.)
- Expired - Lifetime
Links
- 238000000034 method Methods 0.000 title claims abstract description 70
- 238000012360 testing method Methods 0.000 claims abstract description 41
- 230000015572 biosynthetic process Effects 0.000 claims abstract 5
- 238000005755 formation reaction Methods 0.000 claims abstract 5
- 238000012795 verification Methods 0.000 description 7
- 230000011218 segmentation Effects 0.000 description 3
- 230000010355 oscillation Effects 0.000 description 2
- 239000003208 petroleum Substances 0.000 description 2
- 238000012545 processing Methods 0.000 description 2
- 238000004364 calculation method Methods 0.000 description 1
- 239000002131 composite material Substances 0.000 description 1
- 238000012937 correction Methods 0.000 description 1
- 238000001514 detection method Methods 0.000 description 1
- 238000011161 development Methods 0.000 description 1
- 230000018109 developmental process Effects 0.000 description 1
- 230000002452 interceptive effect Effects 0.000 description 1
- 238000003909 pattern recognition Methods 0.000 description 1
- 230000001902 propagating effect Effects 0.000 description 1
- 238000010998 test method Methods 0.000 description 1
Images

Classifications
-
- G—PHYSICS
- G01—MEASURING; TESTING
- G01V—GEOPHYSICS; GRAVITATIONAL MEASUREMENTS; DETECTING MASSES OR OBJECTS; TAGS
- G01V1/00—Seismology; Seismic or acoustic prospecting or detecting
- G01V1/28—Processing seismic data, e.g. for interpretation or for event detection
- G01V1/30—Analysis
Definitions
- This invention relates to the field of seismic data interpretation.
- the invention relates to a machine process for selection of three-dimensional (3D) seismic data to provide petroleum exploration professionals more detailed understanding of subsurface geology and geometry.
- this invention is an automated method of "picking” or “tracking” individual seismic events through a three-dimensional volume of data with extreme accuracy.
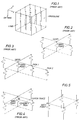
- FIGS 1 through 4 of the Drawings illustrate features and methods associated with the prior art picking methods; Figures 5 through 8 illustrate features and methods of the invention. Only Figures associated with prior art methods are introduced here.
- Figure 1 is an isometric view of a portion of a hypothetical three-dimensional (3D) seismic data volume.
- the circles at the top of the volume represent the surface location of individual traces.
- the vertical lines represent seismic traces which are measured in time or distance along the z-axis of the volume.
- Each individual trace is an amplitude versus time representation of an acoustic reflection from strata in the earth.
- a sequence of x versus time traces is called a "line” by seismic explorationists.
- a sequence of y versus time traces is called a "cross-line”.
- the horizontal section or time slice is a horizontal slice or plane through the 3D volume of data.
- An "horizon slice” is a slice along or parallel to a structurally interpreted horizon and hence along one bedding plane. Plotting of common amplitudes on x-y axes is similar to a surface topographic map, but of course such a plot is of subsurface strata. Plotting of such different amplitudes at a common subsurface depth illustrates different strata at common depths.
- a user selected or "input” at least one "seed point", which then “expanded” in all four directions within the 3D data volume as illustrated in Figure 2 until it reached the boundaries of a user specified zone. Users had the option of tracking seismic data in one of two modes.
- a "seed point” is specified by its x and y location and its time or depth (i.e., the z-axis of Figure 1). It is also specified by a characteristic of the reflection at that point. Such characteristic is usually the maximum amplitude of the reflection at that location in the volume of the data. Other characteristics, such as minimum amplitude, phase, frequency, etc., of the reflection at the x, y, z point may be used. As illustrated in Figure 3 non-iterative tracking searched the seismic traces adjacent seed points for similar amplitude values, picked the best one, then proceeded to the next available trace without double-checking the accuracy of the pick.
- An iterative picking mode verified an adjacent trace as a pick by cross-referencing the previous trace. Once verified, the adjacent trace was treated as a seed point and the picking of adjacent traces from it proceeded. Figure 4 illustrates such prior art iterative picking. Verification means that if the amplitude of the picked trace is within the limits of tolerance set by the user, the pick is accepted. Users could specify (on a scale of 1-10) the degree of amplitude similarity they would allow. If a pick did not pass this acceptance test, it was designated "dead” until at least one directly adjacent trace matched sufficiently to accept it.
- a local extrema of a variable x i where i is a digitizing index is defined as x i-1 ⁇ x i ⁇ x i+1 or x i-1 > x i ⁇ x i+1 .
- Such scanning is bounded by zero crossings of the amplitude of the trace in the case of a peak or a trough.
- extrema will typically vary with time a small amount. For example, if T0 represents the seed point, T1 would typically represent the time of the extrema. Next, the time T0 is started on the target trace.
- the time is varied up and down between zero crossings of its trace amplitude until the nearest extrema T2 is found.
- the time T2 is used on the trace on which the seed point exists and on such "seed" trace scanning up and down the "z” axis is again performed for the nearest extrema T3. If T3 equals T1, then iterative tracking has been achieved and tracking continues.
- the score is compared with a control value from 1 to 10 selected by the interpreter or user of the data. Scores greater than the control value prevent a target trace from being picked.
- a primary object of the invention is to provide a method for tracking seismic horizons in a 3D volume with much greater accuracy than prior art methods.
- Another object of the invention is to provide a seismic, horizon tracking method which minimizes the time of interpreters in trying to correct "misties”.
- Still another object of the invention is to provide a method for tracking seismic horizons in a 3D volume which allows interpreters to discover and precisely delineate even small faults and discontinuities.
- a time or horizontal slice of 3D seismic trace data defines an x-y grid of data points of which a seismic exploration specialist wants to map or identify all points having a common characteristic.
- Such characteristic may in numerical terms be the amplitude of a trace oscillation. In physical terms such amplitude may represent the boundary of a subterranean strata.
- the process begins after certain seed points have been selected by the user. Region growing from such a seed point starts after a grid of three or more data points is defined. Such grid of data points, called a test area or "tile", includes the seed point and other test points in the grid which are to be tested to determine if they have the characteristic common with the seed point.
- the invention stores each of the test data points as representative of the characteristic only if a test data point satisfies an acceptance test with respect to a numerical value of the seed point along at least two separate paths via imaginary links which define the test area.
- the test area or tile is a grid of nine data points defined by a three-by-three array of points with the seed point at the center of the grid.
- the tile is a composite area of four adjacent two-by-two grids, with each grid having the seed point at one corner.
- the preferred method requires that the data point diagonally opposite each of the two-by-two grids satisfy an acceptance test along two different paths. Each of such diagonally opposite points must satisfy the acceptance test in order for the entire three-by-three array to be accepted.
- Figures 1 through 4 illustrate prior art methods; the advantages and objects of the invention are described in Figures 5-8 of which,
- the autotracking process used by the invention begins when an interpreter manually inputs one or more seed points (or lines), indicating the seismic horizon he or she wishes to track through the 3D data volume.
- a "tile" or area In order to grow or expand through the 3D volume of data, a "tile" or area must be verified by an iterative method as described above by reference to Figure 4. Each point of the tile defined by traces 0, 1, 2 and 3 is verified in turn. That is, point 1 is verified from points 0 to 1. Point 2 is verified from point 1 to point 2. Point 3 is verified from point 0 to point 3. Point 2 is again verified from point 3 to point 2. Of course, point 3 could be verified from point 2 to point 3 and from point 0 to point 3. Alternatively, verification could proceed from 0 to 1, 1 to 2, 2 to 3 and ultimately from 3 to 0.
- Each trace or point on the tile must be iteratively verified in order for any one of them to be picked. Additionally, the entire tile is "picked” according to an "all or nothing” rule.
- the "all or nothing" verification of the tile requires that at least one point in the tile be verified by two different paths around the tile. For example, if amplitude is selected as the verification characteristic for the tile, then the amplitude of point 1 compared with the amplitude of point 0 must be within a predetermined score of the control value selected by the user as described above by reference to prior art iterative method of Figure 4. Point 2 as verified from point 1 to point 2 must also pass the acceptance test.
- the preferred embodiment of the method designates a nine-trace test area - or "tile" -around and including the seed point as illustrated in Figure 6.
- Each tile consists of a center trace (with the seed point), four "side” traces (orthogonal to the center), and four "corner” traces (diagonal to the center).
- the preferred embodiment of the invention picks and iteratively verifies all eight side and corner traces before any of them are accepted. If any comparison between two adjacent traces in the tile fails to pass a user-specified acceptance limit, all eight traces surrounding the seed point are rejected. In that case, autotracking can proceed only if another seed point has been input somewhere else in the 3D volume of data. Multiple seed points are typically selected for region growing in a 3D volume set.
- the method according to the invention steps through the multiple trace verification process in a single nine trace tile by first picking four adjacent (side) traces (see Figure 7) and verifying each of the four points 1, 3, 5 and 7 in exactly the same way as the prior art iterative mode as indicated by Figure 4.
- each corner trace is verified by two independent routes or links.
- point 2 is iteratively verified via the link from 1 to 2 and from the link 3 to 2.
- Point 4 is iteratively verified via the link from 3 to 4 and from 5 to 4.
- Each iterative verification uses the same user-defined acceptance criteria as described above. All eight traces about the seed trace will be accepted only if all 12 paths or links in the tile pass the acceptance tests. When all 12 links pass these tests, any one of the eight traces 1-8 can be linked back to the seed point 0 by any possible route through the tile. This "all or nothing rule" insures that all nine points actually lie on the same seismic horizon.
- a tile of points is verified and accepted about a seed point.
- a user of the method specifies a boundary of data points about which picking is to be performed. Such boundary defines a search area.
- the user may specify many "seed" points about which the method is to be applied. Accordingly, there is provided, in the preferred embodiment of the invention, a method for defining which data points will have a new "tile" defined about it in order to continue region growing about original and new seed points.
- a control array is first created so that the status of every point within the search area may be maintained at initialization.
- each point is classified in one of three ways:
- the tracked points are labelled “fresh” and the seed point is labelled “dead, but picked”.
- the seed point is also labelled "dead, but picked", but the adjacent points remain unchanged.
- the tiling method starts again about the next available seed point.
- a "pass" through the control array begins at a corner of the array and each point is searched until a "seed” or “expand” point is found. That point is expanded by the "tile” method described above. Scanning continues for each point adjacent the seed point.
- a seed (expand) point When a seed (expand) point is found, it is placed at the center of a tile and the tile process as described above proceeds. Where two seed (expand) points are close to each other, expansion from each of such seed (expand) points may be to a common virgin point. The first seed point to test the virgin point determines its status. If the virgin point is on a successful tile, it is labelled "fresh”. It will not be repicked, but will be used later in further testing to test the validity of other tiles.
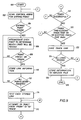
- Figure 9 illustrates the preferred embodiment steps of the invention with a flow chart of process steps to be performed on a digital computer. The method steps are performed for a tile of points 0-8 as illustrated in Figure 6.
- a user defines the x-y extent of the 3D data to be searched.
- the user also provides a preselected grid of seed points representative of a characteristic of the 3D seismic data which is to be mapped or picked in the data.
- the method begins with logic box 100 for starting the method and then proceeds to logic box 102 where the test points of a tile - like those of Figure 6 - are defined. If the method is being started for the first time, each of the points 1-8 will be "virgin" points. On the other hand, if after a first tile has been found acceptable, each of the points 1-8 are selected as seed points and a new tile defined about each point. Links which have been previously accepted during the testing of points for a previous seed point are not re-tested. Similarly, dead links remain dead and "kill" any new tile of which they might be a part. A user may also specify points as dead; that is parts of the data may be specified which will not be searched.
- Logic box 106 determines which links of a previously tested tile are to be tested. It receives feedback from logic blocks 108 and 112 to evaluate which links are to be tested. Link information defining "from" point and the "to" point are stored in logic box 110. Logic box 108 specifies whether a point is a fresh point never before having a tile defining it, a virgin point previously accepted, or a dead point.
- Logic box 114 begins the test of each link of the tile, if not previously tested, from the "from” trace to the "to” trace. Actual testing of each link is done in logic box 116 and continues until all links are tested. Testing of a link is done by comparing a characteristic of the "from" trace to a corresponding characteristic of the "to” trace. For example, the amplitude of a reflection oscillation at a time (or depth) of the "to" trace can be required to be within a predetermined ratio of the amplitude of the "from” trace. Iterative tracking is required before a link is “tracked” successfully. That is, the "from” trace is also compared with the "to” trace. Iterative tracking and amplitude acceptance test procedures are the same as described above with reference to Figure 4. Other characteristics can be used for testing of one trace to another. For example, phase, or frequency comparisons, or a mathematical correlation of one trace to another can be used if desired.
- control is sent back to logic box 102 where the x-y grid is again scanned.
- control is passed to logic box 120 where the track time for a link is compared with a predetermined time. If the tracking time is too large, control is again sent to logic box 102. Otherwise control is passed to logic box 122 for storing the track time for the previously tested link. Control is then passed to logic box 124 where a test is performed to determine if all links in the tile have been tested. If testing for a tile is not complete, control is passed again to logic box 116. If all links have been tested, the traces on the tile successfully tested are stored in an "horizon" file with traces or points designated as "picked” points if each and every link tested was successful according to the test routines illustrated by Figures 7 and 8.
- Each picked trace then becomes a seed point and the process continues until no more seed points are available for testing in the x-y region of the 3D data volume.
- a seed point is found, it is set at the center of a new tile to be tested and all points or traces on the tile are examined to determine which links need to be tested. If two or more tiles attempt to expand into the same "virgin" point, the first tile to be tested will test the virgin point. If a second tile fails to confirm that point, such point is then labelled "fresh" and will not be repicked but used later to test the validity of other tiles.
- Figure 10 illustrates how the tile region growing process according to the invention prevents expansion into fault data or noisy data on an x-y grid of data at a predetermined depth or time in a 3D volume of seismic traces.
- Tile 1 is successfully tested about seed point 1.
- tiles about new seed points 2 and 3 are successfully tested.
- a tile defined about seed point 4 is unsuccessful because of the existence of a trace in its southwest corner which lies in a fault zone or is noisy data. Accordingly, none of the points of the tile about seed point 4 are picked, but some of them will be picked from other seed points during the region growing process.
Landscapes
- Engineering & Computer Science (AREA)
- Remote Sensing (AREA)
- Physics & Mathematics (AREA)
- Life Sciences & Earth Sciences (AREA)
- Geology (AREA)
- Environmental & Geological Engineering (AREA)
- Acoustics & Sound (AREA)
- General Life Sciences & Earth Sciences (AREA)
- General Physics & Mathematics (AREA)
- Geophysics (AREA)
- Geophysics And Detection Of Objects (AREA)
- Burglar Alarm Systems (AREA)
- Manufacture, Treatment Of Glass Fibers (AREA)
- Buildings Adapted To Withstand Abnormal External Influences (AREA)
- Management, Administration, Business Operations System, And Electronic Commerce (AREA)
Abstract
Description
- This invention relates to the field of seismic data interpretation. In particular the invention relates to a machine process for selection of three-dimensional (3D) seismic data to provide petroleum exploration professionals more detailed understanding of subsurface geology and geometry. Still more particularly, this invention is an automated method of "picking" or "tracking" individual seismic events through a three-dimensional volume of data with extreme accuracy.
- Figures 1 through 4 of the Drawings illustrate features and methods associated with the prior art picking methods; Figures 5 through 8 illustrate features and methods of the invention. Only Figures associated with prior art methods are introduced here.
- Figure 1 illustrates a portion of a hypothetical 3D seismic data volume in order to explain the three-dimensional relationships discussed in the text and accompanying drawings in this specification;
- Figure 2 is an isometric view of a portion of five seismic traces which illustrates the relationship between a "seed point" and its four adjacent traces;
- Figure 3 illustrates a prior art automatic tracking method; and
- Figure 4 illustrates a prior art "iterative" autotracking method.
- Figure 1 is an isometric view of a portion of a hypothetical three-dimensional (3D) seismic data volume. The circles at the top of the volume represent the surface location of individual traces. The vertical lines represent seismic traces which are measured in time or distance along the z-axis of the volume. Each individual trace is an amplitude versus time representation of an acoustic reflection from strata in the earth. A sequence of x versus time traces is called a "line" by seismic explorationists. A sequence of y versus time traces is called a "cross-line".
- The horizontal section or time slice is a horizontal slice or plane through the 3D volume of data. An "horizon slice" is a slice along or parallel to a structurally interpreted horizon and hence along one bedding plane. Plotting of common amplitudes on x-y axes is similar to a surface topographic map, but of course such a plot is of subsurface strata. Plotting of such different amplitudes at a common subsurface depth illustrates different strata at common depths.
- In less than ten years, computer aided exploration revolutionized seismic exploration and field development. Until recently, however, one aspect of seismic interpretation - picking subsurface horizons, or simply, "picking", remained essentially unchanged from paper and pencil method to automatic computer picking methods.
- An article in the Oil and Gas Journal, February 26, 1990 at pp 102-105 describes prior horizon picking methods as illustrated in Figures 1 - 4. Traditionally, picking was done manually by drawing with colored pencils on paper, one seismic section or line at a time--an incredibly tedious process. In the early 1980's, interactive CAEX (an acronym for Computer Aided Exploration) workstations gave seismic explorationists the ability to pick 3D data more quickly and effectively. While interpreting seismic lines (that is, a two-dimensional vertical slice or a "vertical seismic section") was still accomplished by viewing and picking one line at a time, it could then be done by using a mouse in combination with a display screen and clicking the cursor on a few selected points along a horizon and letting the machine pick all the rest of the points on that line. This was the first type of automated picking, and represented an incremental increase in both productivity and accuracy over manual picking.
- In one prior art automatic system for tracking a bedding plane (called an horizon) in a horizontal slice of 3D data, a user selected or "input" at least one "seed point", which then "expanded" in all four directions within the 3D data volume as illustrated in Figure 2 until it reached the boundaries of a user specified zone. Users had the option of tracking seismic data in one of two modes.
- A "seed point" is specified by its x and y location and its time or depth (i.e., the z-axis of Figure 1). It is also specified by a characteristic of the reflection at that point. Such characteristic is usually the maximum amplitude of the reflection at that location in the volume of the data. Other characteristics, such as minimum amplitude, phase, frequency, etc., of the reflection at the x, y, z point may be used. As illustrated in Figure 3 non-iterative tracking searched the seismic traces adjacent seed points for similar amplitude values, picked the best one, then proceeded to the next available trace without double-checking the accuracy of the pick.
- An iterative picking mode verified an adjacent trace as a pick by cross-referencing the previous trace. Once verified, the adjacent trace was treated as a seed point and the picking of adjacent traces from it proceeded.Figure 4 illustrates such prior art iterative picking. Verification means that if the amplitude of the picked trace is within the limits of tolerance set by the user, the pick is accepted. Users could specify (on a scale of 1-10) the degree of amplitude similarity they would allow. If a pick did not pass this acceptance test, it was designated "dead" until at least one directly adjacent trace matched sufficiently to accept it.
- More specifically, once a seed point is selected on a trace, the trace is scanned up and down the z or time axis to find the local extrema amplitude or simply "extrema". A local extrema of a variable xi where i is a digitizing index, is defined as

or
Such scanning is bounded by zero crossings of the amplitude of the trace in the case of a peak or a trough. Such extrema will typically vary with time a small amount. For example, if T₀ represents the seed point, T₁ would typically represent the time of the extrema. Next, the time T₀ is started on the target trace. On it, the time is varied up and down between zero crossings of its trace amplitude until the nearest extrema T₂ is found. Finally, the time T₂ is used on the trace on which the seed point exists and on such "seed" trace scanning up and down the "z" axis is again performed for the nearest extrema T₃. If T₃ equals T₁, then iterative tracking has been achieved and tracking continues. - The acceptance test tolerance of the prior art iterative tracking defined a function,

where
At = Amplitude from the target trace at T₂, and
As = Amplitude from the seed at T₁. - The value of S is bounded by values of 0 and 1. The more similar the two amplitudes, the closer the S function is to zero. The more dissimilar the two amplitudes, the closer the S function is to 1. Next, a score function is evaluated:

- The score is compared with a control value from 1 to 10 selected by the interpreter or user of the data. Scores greater than the control value prevent a target trace from being picked.
- This iterative tracking mode and its associated acceptance test, while significantly more accurate than the non-iterative mode, was nevertheless unable to adequately pick horizons in areas with faults or discontinuities ("noise"). It had a tendency to jump off the original event in such areas of incoherent data, then "wander" from there, often propagating mis-picks all the way across a 3D survey.
- The prior art methods of identifying similar seismic events in a 3D grid of seismic traces required only one neighboring point for verification. Under certain circumstances, picking errors slipped through. In practice, excessive correction and re-autotracking was required, or seismic interpreters couldn't use it in heavily faulted areas, the very areas where petroleum deposits may occur.
- Other prior art patents and publications include:
- (1) U.S. Patent 4,633,401 to Flinchbaugh illustrates a computer system for identifying horizons in 3D seismic data by identifying zero-crossings to determine the same seismic event in adjacent seismic traces;
- (2) A journal article titled, "A Rule-Based Interpretation System For Segmentation of Seismic Images," in Pattern Recognition, Vol. 20, No. 1, pp. 45-53, 1987 describes a rule-based interpretation system for segmenting seismic images based on signal character; and
- (3) A paper presented at the 1989 International. Conference on Acoustics, Speech and Signal Processing, 23-26 May, 1989 at the Scottish Exhibition Conference Centre, Glasgow, Scotland, titled "Texture Analysis and Segmentation of Seismic Images" describes texture analysis and segmentation of geophysical images based on the detection of seismic horizons and on the calculation of their features.
- A primary object of the invention is to provide a method for tracking seismic horizons in a 3D volume with much greater accuracy than prior art methods.
- Another object of the invention is to provide a seismic, horizon tracking method which minimizes the time of interpreters in trying to correct "misties".
- Still another object of the invention is to provide a method for tracking seismic horizons in a 3D volume which allows interpreters to discover and precisely delineate even small faults and discontinuities.
- The objects identified above as well as other advantages and features are provided in a method of tracking certain subterranean stratigraphic characteristics inferred from seismic traces. The invention is set out in
claim 1. A time or horizontal slice of 3D seismic trace data defines an x-y grid of data points of which a seismic exploration specialist wants to map or identify all points having a common characteristic. Such characteristic may in numerical terms be the amplitude of a trace oscillation. In physical terms such amplitude may represent the boundary of a subterranean strata. - The process begins after certain seed points have been selected by the user. Region growing from such a seed point starts after a grid of three or more data points is defined. Such grid of data points, called a test area or "tile", includes the seed point and other test points in the grid which are to be tested to determine if they have the characteristic common with the seed point. In its broadest form, the invention stores each of the test data points as representative of the characteristic only if a test data point satisfies an acceptance test with respect to a numerical value of the seed point along at least two separate paths via imaginary links which define the test area.
- In a preferred embodiment of the invention, the test area or tile is a grid of nine data points defined by a three-by-three array of points with the seed point at the center of the grid. Viewed another way, the tile is a composite area of four adjacent two-by-two grids, with each grid having the seed point at one corner. The preferred method requires that the data point diagonally opposite each of the two-by-two grids satisfy an acceptance test along two different paths. Each of such diagonally opposite points must satisfy the acceptance test in order for the entire three-by-three array to be accepted. Once a tile has been accepted, region growing through the entire 3D slice of data continues by treating each data point on the tile as a new seed point.
- As indicated above, Figures 1 through 4 illustrate prior art methods; the advantages and objects of the invention are described in Figures 5-8 of which,
- Figure 5 illustrates a "tile" or test area according to the invention which includes four traces in a two-by-two trace grid in which a seed point is established at a corner of the tile and the entire tile is verified by verifying another point on the tile by two different paths;
- Figure 6 illustrates a preferred "tile", or test area, as designated by the invention which includes nine traces in a rectilinear three-by-three trace grid about a center trace;
- Figure 7 illustrates the first step in autotracking using the preferred method of the invention where the seed point expands in all four directions within the 3D data volume and where four adjacent (side) traces are picked;
- Figure 8 illustrates the second step in autotracking with the tile of Figure 6 where each corner trace is picked and verified by two independent routes, and then all eight trace points in the tile about the seed point are verified for accuracy before any of the eight trace points are accepted;
- Figure 9 illustrates a flow chart useful for programming the preferred nine trace tile method according to the invention; and
- Figure 10 illustrates the propagation of tiles to show how each trace accepted in one tile becomes the seed point of another tile, and how tiles rapidly expand until they reach a fault or area of bad data.
- The autotracking process used by the invention begins when an interpreter manually inputs one or more seed points (or lines), indicating the seismic horizon he or she wishes to track through the 3D data volume.
- In its broadest aspect, the method according to the invention is illustrated by reference to Figure 5 where a user-specified
seed point 0 is illustrated. In order to grow or expand through the 3D volume of data, a "tile" or area must be verified by an iterative method as described above by reference to Figure 4. Each point of the tile defined bytraces point 1 is verified frompoints 0 to 1.Point 2 is verified frompoint 1 topoint 2.Point 3 is verified frompoint 0 topoint 3.Point 2 is again verified frompoint 3 topoint 2. Of course,point 3 could be verified frompoint 2 topoint 3 and frompoint 0 topoint 3. Alternatively, verification could proceed from 0 to 1, 1 to 2, 2 to 3 and ultimately from 3 to 0. - Each trace or point on the tile must be iteratively verified in order for any one of them to be picked. Additionally, the entire tile is "picked" according to an "all or nothing" rule. The "all or nothing" verification of the tile requires that at least one point in the tile be verified by two different paths around the tile. For example, if amplitude is selected as the verification characteristic for the tile, then the amplitude of
point 1 compared with the amplitude ofpoint 0 must be within a predetermined score of the control value selected by the user as described above by reference to prior art iterative method of Figure 4.Point 2 as verified frompoint 1 topoint 2 must also pass the acceptance test. - Next the above two steps are preformed first from
point 0 topoint 3 and then frompoint 3 topoint 2. If and only ifpoint 2 is verified via the alternative paths of 0-1; 1-2, and 0-3; 3-2 will any of thepoints seed point 0. Once selected, each of the other points will act as a seed point for a new tile. Each tile is tested according to the steps described above until there are no more seed points which can be tested. - The preferred embodiment of the method designates a nine-trace test area - or "tile" -around and including the seed point as illustrated in Figure 6. Each tile consists of a center trace (with the seed point), four "side" traces (orthogonal to the center), and four "corner" traces (diagonal to the center). Unlike the iterative tracking mode of the prior art method-which required only one-to-one trace verification--the preferred embodiment of the invention picks and iteratively verifies all eight side and corner traces before any of them are accepted. If any comparison between two adjacent traces in the tile fails to pass a user-specified acceptance limit, all eight traces surrounding the seed point are rejected. In that case, autotracking can proceed only if another seed point has been input somewhere else in the 3D volume of data. Multiple seed points are typically selected for region growing in a 3D volume set.
- The method according to the invention steps through the multiple trace verification process in a single nine trace tile by first picking four adjacent (side) traces (see Figure 7) and verifying each of the four
points point 2 is iteratively verified via the link from 1 to 2 and from thelink 3 to 2.Point 4 is iteratively verified via the link from 3 to 4 and from 5 to 4. Each iterative verification uses the same user-defined acceptance criteria as described above. All eight traces about the seed trace will be accepted only if all 12 paths or links in the tile pass the acceptance tests. When all 12 links pass these tests, any one of the eight traces 1-8 can be linked back to theseed point 0 by any possible route through the tile. This "all or nothing rule" insures that all nine points actually lie on the same seismic horizon. - The description above describes how a tile of points is verified and accepted about a seed point. In actual practice a user of the method specifies a boundary of data points about which picking is to be performed. Such boundary defines a search area. The user may specify many "seed" points about which the method is to be applied. Accordingly, there is provided, in the preferred embodiment of the invention, a method for defining which data points will have a new "tile" defined about it in order to continue region growing about original and new seed points.
- A control array is first created so that the status of every point within the search area may be maintained at initialization. At initialization, each point is classified in one of three ways:
- (1) Picked:Used as a seed point from which expansion proceeds,
- (2) Virgin:Unpicked point for which tracking is possible, or
- (3) Dead:A point designated by the user as ineligible for tracking.
- Multiple passes through each point in the control area search for a seed point. When a seed point is found, an attempt is made to expand about it, by means of the tile method described above, into adjacent "virgin" points.
- If attempts at expanding into the adjacent points are successful (i.e., by the tile method described above), the tracked points are labelled "fresh" and the seed point is labelled "dead, but picked".
- If the attempts are unsuccessful, the seed point is also labelled "dead, but picked", but the adjacent points remain unchanged. The tiling method starts again about the next available seed point.
- When all points of the control array have been scanned, all points picked during the previous pass, now labelled "fresh", are relabelled "expand" and used as seed points on the next pass. Passes through the control area continue until no more "fresh" points are found.
- A "pass" through the control array begins at a corner of the array and each point is searched until a "seed" or "expand" point is found. That point is expanded by the "tile" method described above. Scanning continues for each point adjacent the seed point.
- When a seed (expand) point is found, it is placed at the center of a tile and the tile process as described above proceeds. Where two seed (expand) points are close to each other, expansion from each of such seed (expand) points may be to a common virgin point. The first seed point to test the virgin point determines its status. If the virgin point is on a successful tile, it is labelled "fresh". It will not be repicked, but will be used later in further testing to test the validity of other tiles.
- Scanning continues in the control array. If no seed points are found, processing stops. If at least one seed point is found, all points labelled "fresh" are relabelled as "expand" and are used as seed points and the process is repeated.
- Figure 9 illustrates the preferred embodiment steps of the invention with a flow chart of process steps to be performed on a digital computer. The method steps are performed for a tile of points 0-8 as illustrated in Figure 6.
- A user defines the x-y extent of the 3D data to be searched. The user also provides a preselected grid of seed points representative of a characteristic of the 3D seismic data which is to be mapped or picked in the data.
- As performed in a programmed digital computer, the method begins with
logic box 100 for starting the method and then proceeds tologic box 102 where the test points of a tile - like those of Figure 6 - are defined. If the method is being started for the first time, each of the points 1-8 will be "virgin" points. On the other hand, if after a first tile has been found acceptable, each of the points 1-8 are selected as seed points and a new tile defined about each point. Links which have been previously accepted during the testing of points for a previous seed point are not re-tested. Similarly, dead links remain dead and "kill" any new tile of which they might be a part. A user may also specify points as dead; that is parts of the data may be specified which will not be searched. -
Logic box 106 determines which links of a previously tested tile are to be tested. It receives feedback fromlogic blocks logic box 110.Logic box 108 specifies whether a point is a fresh point never before having a tile defining it, a virgin point previously accepted, or a dead point. -
Logic box 114 begins the test of each link of the tile, if not previously tested, from the "from" trace to the "to" trace. Actual testing of each link is done inlogic box 116 and continues until all links are tested. Testing of a link is done by comparing a characteristic of the "from" trace to a corresponding characteristic of the "to" trace. For example, the amplitude of a reflection oscillation at a time (or depth) of the "to" trace can be required to be within a predetermined ratio of the amplitude of the "from" trace. Iterative tracking is required before a link is "tracked" successfully. That is, the "from" trace is also compared with the "to" trace. Iterative tracking and amplitude acceptance test procedures are the same as described above with reference to Figure 4. Other characteristics can be used for testing of one trace to another. For example, phase, or frequency comparisons, or a mathematical correlation of one trace to another can be used if desired. - If the tracking from a "from" trace to a "to" trace in the process is unsuccessful, control is sent back to
logic box 102 where the x-y grid is again scanned. - If tracking of a "from" trace to a "to" trace is successful in
logic box 118, control is passed tologic box 120 where the track time for a link is compared with a predetermined time. If the tracking time is too large, control is again sent tologic box 102. Otherwise control is passed tologic box 122 for storing the track time for the previously tested link. Control is then passed tologic box 124 where a test is performed to determine if all links in the tile have been tested. If testing for a tile is not complete, control is passed again tologic box 116. If all links have been tested, the traces on the tile successfully tested are stored in an "horizon" file with traces or points designated as "picked" points if each and every link tested was successful according to the test routines illustrated by Figures 7 and 8. - Each picked trace then becomes a seed point and the process continues until no more seed points are available for testing in the x-y region of the 3D data volume. When a seed point is found, it is set at the center of a new tile to be tested and all points or traces on the tile are examined to determine which links need to be tested. If two or more tiles attempt to expand into the same "virgin" point, the first tile to be tested will test the virgin point. If a second tile fails to confirm that point, such point is then labelled "fresh" and will not be repicked but used later to test the validity of other tiles.
- When the limits of the x-y array of data have been reached and no new seed points have been found, then the process stops. If at least one seed point is found, all traces which have been tracked (on the previous pass through the x-y data array) which were labelled "fresh" are relabelled "expand" or seed points and the tile region growing process is repeated.
- Figure 10 illustrates how the tile region growing process according to the invention prevents expansion into fault data or noisy data on an x-y grid of data at a predetermined depth or time in a 3D volume of seismic traces.
Tile 1 is successfully tested aboutseed point 1. Likewise, tiles aboutnew seed points seed point 4 is unsuccessful because of the existence of a trace in its southwest corner which lies in a fault zone or is noisy data. Accordingly, none of the points of the tile aboutseed point 4 are picked, but some of them will be picked from other seed points during the region growing process.
Claims (8)
- A method of automatically selecting a horizon of earth formations from a three dimensional volume of seismic wavelet traces
characterized in that the method includes the steps of(a) collecting seismic reflection data of said earth formations and storing such data in a computer memory as a volume of seismic traces each including a plurality of seismic wavelets,(b) selecting a seed point at a seed depth of at least one of said seismic traces designated as a seed trace, where said seed depth is the depth of a characteristic of a wavelet of said seed trace,(c) selecting a test volume of seismic traces of which said seed trace is one such trace,(d) determining that a local horizon exists through said seed point of said seed trace and depth points of all other traces in said test volume only if one or more wavelets of the test traces other than said seed trace is picked with respect to said wavelet of said seed point of said seed trace along two different paths from said seed trace, where a path includes one or more path links from one seed point of a starting trace to a target trace and picking is achieved where a characteristic of a wavelet of said target trace corresponds in depth to such characteristic of a wavelet of said starting trace,(e) storing each of said depth points only if it is determined that a local horizon exists through said depth point of said seed trace and said other traces of said test volume in step (d), and(f) using each of said depth points of said all other traces in said test volume as a seed point of step (b) and repeating steps (c), (d), and (e). - The method of claim 1 further characterized by the step of
(g) displaying said stored depth points in a graphical format which identifies the depth of said characteristic as a function of x-y dimensions of said volume of seismic traces. - The method of claim 1 for automatically selecting a horizon of earth formations from a three dimensional volume of seismic wavelet traces;
characterized in that the method includes the steps of(c′) in said selecting step (c) identifying a test volume of seismic traces including said seed trace and at least three other traces adjacent each other, said three other traces including two side traces and one diagonal trace, where said diagonal trace is disposed diagonally from said seed trace between said side traces,(d′) in said determining step (d), further determining that a local horizon exists through said seed point of said seed trace and depth points of said two side traces and said diagonal trace only if a depth point of a wavelet of one of said side traces or said diagonal trace is picked via at least two different paths from said seed trace,(e′) in said storing step (e), storing each of said depth points of said two side traces and said diagonal trace only if it is determined that a horizon exists through said depth point of said seed trace and said other traces in step (c′), and(f′) using each of said depth points of said two side traces and said diagonal trace as a seed point of step (b) and repeating steps (c′), (d′) and (e′). - The method of claim 3
wherein the method is further characterized in that
step (f′) continues until no more local horizons exist through seed points which satisfy step (d′). - The method of claim 4
wherein the method is further characterized by the step of
displaying said stored depth points in a graphical format which identifies the depth of said characteristic of said seismic wavelet as a function of x-y dimensions of said three dimensional volume of traces. - The method of claim 5
wherein the method is further characterized in that
each target trace is iteratively picked along said path link with respect to a starting trace. - The method of claim 6
wherein the method is further characterized in that
a target trace is iteratively picked along said path link with respect to a starting trace including the steps of(i) recording a numerical value of said characteristic of a starting wavelet at a starting depth point of said starting wavelet,(ii) transferring the depth of said starting depth point to said target trace and finding the closest depth point of said characteristic of the wavelet of said target that exists between zero crossings of said target trace and recording said depth point and a numerical value of said characteristic of said target trace wavelet, and(iii) transferring the depth of said depth point of said target trace back to said beginning trace to determine if it is between zero crossings of said wavelet of said starting trace, and if it is,(iv) requiring that the difference between said numerical value of said characteristic of said starting trace wavelet and said numerical value of said characteristic of said target wavelet be within a predetermined numerical amount. - The method of claim 1
further characterized in that(c˝) said selecting step (c) includes identifying a test volume of seismic traces including at least eight other traces adjacent said seed trace, said eight other traces including four side traces and four diagonal traces,(d˝) said determining step (d) includes determining that a local horizon exists through said seed point of said seed trace and depth points of said eight traces only if a depth point of a wavelet of one of each of said four diagonal traces is picked via at least two different paths from said seed trace,(e˝) said storing step (e) includes storing each of said depth points of said eight traces only if it is determined that a local horizon exists through said depth point of said seed trace and said eight traces, and(f˝) said using step (f) includes using each of said depth points of said eight traces which has not been used as a seed point before as a seed point of step (b) and repeating steps (c˝), (d˝) and (e˝).
Applications Claiming Priority (3)
| Application Number | Priority Date | Filing Date | Title |
|---|---|---|---|
| US543663 | 1983-10-19 | ||
| US07/543,663 US5056066A (en) | 1990-06-25 | 1990-06-25 | Method for attribute tracking in seismic data |
| PCT/US1991/004083 WO1992000532A1 (en) | 1990-06-25 | 1991-06-10 | Method for attribute tracking in seismic data |
Publications (3)
| Publication Number | Publication Date |
|---|---|
| EP0489135A1 EP0489135A1 (en) | 1992-06-10 |
| EP0489135A4 EP0489135A4 (en) | 1993-11-18 |
| EP0489135B1 true EP0489135B1 (en) | 1995-08-30 |
Family
ID=24169025
Family Applications (1)
| Application Number | Title | Priority Date | Filing Date |
|---|---|---|---|
| EP91911657A Expired - Lifetime EP0489135B1 (en) | 1990-06-25 | 1991-06-10 | Method for attribute tracking in seismic data |
Country Status (11)
| Country | Link |
|---|---|
| US (1) | US5056066A (en) |
| EP (1) | EP0489135B1 (en) |
| AT (1) | ATE127237T1 (en) |
| AU (1) | AU644453B2 (en) |
| CA (1) | CA2064686C (en) |
| DE (1) | DE69112580T2 (en) |
| DK (1) | DK0489135T3 (en) |
| ES (1) | ES2076533T3 (en) |
| GR (1) | GR3017342T3 (en) |
| NO (1) | NO303153B1 (en) |
| WO (1) | WO1992000532A1 (en) |
Families Citing this family (78)
| Publication number | Priority date | Publication date | Assignee | Title |
|---|---|---|---|---|
| US5251184A (en) * | 1991-07-09 | 1993-10-05 | Landmark Graphics Corporation | Method and apparatus for finding horizons in 3D seismic data |
| US5153858A (en) * | 1991-07-09 | 1992-10-06 | Landmark Graphics Corporation | Method for finding horizons in 3D seismic data |
| US5432895A (en) * | 1992-10-01 | 1995-07-11 | University Corporation For Atmospheric Research | Virtual reality imaging system |
| US5751289A (en) * | 1992-10-01 | 1998-05-12 | University Corporation For Atmospheric Research | Virtual reality imaging system with image replay |
| US5373486A (en) * | 1993-02-03 | 1994-12-13 | The United States Department Of Energy | Seismic event classification system |
| US5537365A (en) * | 1993-03-30 | 1996-07-16 | Landmark Graphics Corporation | Apparatus and method for evaluation of picking horizons in 3-D seismic data |
| US5570106A (en) * | 1993-07-28 | 1996-10-29 | Landmark Graphics Corporation | Method and apparatus for creating horizons from 3-D seismic data |
| DE4413081C1 (en) * | 1994-04-15 | 1995-03-09 | Sartorius Gmbh | Process and apparatus for testing the integrity of filter elements in areas having particular safety requirements |
| US5481269A (en) * | 1994-05-27 | 1996-01-02 | Westinghouse Electric Corp. | General frame wavelet classifier |
| US5537320A (en) * | 1994-10-31 | 1996-07-16 | Landmark Graphics Corporation | Method and apparatus for identifying fault curves in seismic data |
| USRE38229E1 (en) | 1994-12-12 | 2003-08-19 | Core Laboratories Global N.V. | Method and apparatus for seismic signal processing and exploration |
| US5930730A (en) * | 1994-12-12 | 1999-07-27 | Amoco Corporation | Method and apparatus for seismic signal processing and exploration |
| US5563949A (en) * | 1994-12-12 | 1996-10-08 | Amoco Corporation | Method of seismic signal processing and exploration |
| US5555531A (en) * | 1994-12-19 | 1996-09-10 | Shell Oil Company | Method for identification of near-surface drilling hazards |
| US5586082A (en) * | 1995-03-02 | 1996-12-17 | The Trustees Of Columbia University In The City Of New York | Method for identifying subsurface fluid migration and drainage pathways in and among oil and gas reservoirs using 3-D and 4-D seismic imaging |
| RU2187130C2 (en) * | 1995-10-06 | 2002-08-10 | Корэ Лэбораторис Глобал Н.В. | Process and gear to process seismic signal and to prospect for mineral resources |
| US5831935A (en) | 1996-03-05 | 1998-11-03 | Chevron U.S.A. Inc. | Method for geophysical processing and interpretation using seismic trace difference for analysis and display |
| US5724309A (en) * | 1996-03-06 | 1998-03-03 | Chevron U.S.A. Inc. | Method for geophysical processing and interpretation using instantaneous phase and its derivatives and their derivatives |
| CA2220274C (en) * | 1996-04-12 | 2005-06-28 | Amoco Corporation | Method and apparatus for seismic signal processing and exploration |
| US5894417A (en) * | 1996-09-19 | 1999-04-13 | Atlantic Richfield Company | Method and system for horizon interpretation of seismic surveys using surface draping |
| US5982707A (en) * | 1997-01-16 | 1999-11-09 | Geoquest | Method and apparatus for determining geologic relationships for intersecting faults |
| US6018497A (en) * | 1997-02-27 | 2000-01-25 | Geoquest | Method and apparatus for generating more accurate earth formation grid cell property information for use by a simulator to display more accurate simulation results of the formation near a wellbore |
| US6106561A (en) * | 1997-06-23 | 2000-08-22 | Schlumberger Technology Corporation | Simulation gridding method and apparatus including a structured areal gridder adapted for use by a reservoir simulator |
| US5940778A (en) * | 1997-07-31 | 1999-08-17 | Bp Amoco Corporation | Method of seismic attribute generation and seismic exploration |
| US6092026A (en) * | 1998-01-22 | 2000-07-18 | Bp Amoco Corporation | Seismic signal processing and exploration |
| US6016287A (en) * | 1998-05-07 | 2000-01-18 | Geoquest, A Division Of Schlumberger Technology Corporation | Apparatus and method for accurately determining the location of events such as peaks in seismic data |
| US6765570B1 (en) * | 1998-07-21 | 2004-07-20 | Magic Earth, Inc. | System and method for analyzing and imaging three-dimensional volume data sets using a three-dimensional sampling probe |
| US6138075A (en) * | 1998-08-05 | 2000-10-24 | Landmark Graphics Corporation | Methods and apparatus for analyzing seismic data |
| DK1058131T3 (en) * | 1999-06-03 | 2004-09-20 | Jason Geosystems B V | Method for determining spatial changes in underground structure, stratigraphy, lithology and fluid content and reduction of seismic noise |
| US7006085B1 (en) | 2000-10-30 | 2006-02-28 | Magic Earth, Inc. | System and method for analyzing and imaging three-dimensional volume data sets |
| US6853922B2 (en) * | 2001-07-20 | 2005-02-08 | Tracy Joseph Stark | System for information extraction from geologic time volumes |
| US6850845B2 (en) | 2001-07-20 | 2005-02-01 | Tracy Joseph Stark | System for multi-dimensional data analysis |
| US7123766B2 (en) * | 2002-02-11 | 2006-10-17 | Cedara Software Corp. | Method and system for recognizing and selecting a region of interest in an image |
| AU2003263015B2 (en) * | 2002-09-26 | 2009-01-22 | Exxonmobil Upstream Research Company | Method for performing stratigraphically-based seed detection in a 3-D seismic data volume |
| US7280952B2 (en) * | 2003-01-28 | 2007-10-09 | Conocophillips Company | Well planning using seismic coherence |
| US7298376B2 (en) * | 2003-07-28 | 2007-11-20 | Landmark Graphics Corporation | System and method for real-time co-rendering of multiple attributes |
| US7283911B2 (en) * | 2004-10-22 | 2007-10-16 | Landmark Graphics Corporation | System and method for interpreting reverse faults and multiple z-valued seismic horizons |
| DE602004015297D1 (en) * | 2004-10-26 | 2008-09-04 | Total Sa | Method and computer program for defect surface construction |
| FR2880154B1 (en) * | 2004-12-27 | 2007-06-22 | Gen Electric | METHOD AND SYSTEM FOR RAPID VISUALIZATION OF STRUCTURES |
| EP1949280B1 (en) * | 2005-10-21 | 2016-04-13 | Paradigm Geophysical Ltd. | System and method for displaying seismic horizons with attributes |
| CN101506686B (en) * | 2006-06-21 | 2013-11-06 | 特拉斯帕克地球科学有限责任公司 | Interpretation of Geological Sedimentary Systems |
| CN101583911B (en) | 2006-09-01 | 2013-01-02 | 哈利伯顿兰德马克绘图公司 | Systems and methods for imaging a wave body |
| CA2674846C (en) * | 2007-01-05 | 2017-01-03 | Landmark Graphics Corporation, A Halliburton Company | Systems and methods for visualizing multiple volumetric data sets in real time |
| US9171391B2 (en) | 2007-07-27 | 2015-10-27 | Landmark Graphics Corporation | Systems and methods for imaging a volume-of-interest |
| AU2008322505B9 (en) * | 2007-11-14 | 2014-10-02 | Cgg Jason (Netherlands) B.V. | Seismic data processing |
| US7702463B2 (en) * | 2007-12-12 | 2010-04-20 | Landmark Graphics Corporation, A Halliburton Company | Systems and methods for enhancing a seismic data image |
| US20110115787A1 (en) * | 2008-04-11 | 2011-05-19 | Terraspark Geosciences, Llc | Visulation of geologic features using data representations thereof |
| BRPI0909958A2 (en) * | 2008-06-06 | 2015-10-20 | Landmark Graphics Corp | devices and methods for displaying a three-dimensional volume of geometrically irregular grid data representing the grid volume |
| US8265876B1 (en) | 2008-11-08 | 2012-09-11 | Ihs Global Inc. | Seismic horizon autopicking using orientation vector field |
| FR2939520B1 (en) * | 2008-12-10 | 2011-05-20 | Elite Image Software | METHOD FOR THE GEOLOGICAL MODELING OF SEISMIC DATA BY CORRELATION OF TRACES |
| US8094515B2 (en) * | 2009-01-07 | 2012-01-10 | Westerngeco L.L.C. | Seismic data visualizations |
| US20100214870A1 (en) * | 2009-02-23 | 2010-08-26 | Randolph Pepper | Method and apparatus for dynamic extraction of extrema-based geometric primitives in 3d voxel volumes |
| US8600708B1 (en) | 2009-06-01 | 2013-12-03 | Paradigm Sciences Ltd. | Systems and processes for building multiple equiprobable coherent geometrical models of the subsurface |
| US8743115B1 (en) | 2009-10-23 | 2014-06-03 | Paradigm Sciences Ltd. | Systems and methods for coordinated editing of seismic data in dual model |
| US8957895B2 (en) | 2011-09-08 | 2015-02-17 | Landmark Graphics Corporation | Systems and methods for rendering 2D grid data |
| US9618639B2 (en) | 2012-03-01 | 2017-04-11 | Drilling Info, Inc. | Method and system for image-guided fault extraction from a fault-enhanced seismic image |
| GB2503506B (en) * | 2012-06-29 | 2014-12-03 | Foster Findlay Ass Ltd | Adaptive horizon tracking |
| US9182511B2 (en) | 2012-11-04 | 2015-11-10 | Drilling Info, Inc. | System and method for reproducibly extracting consistent horizons from seismic images |
| US10577895B2 (en) | 2012-11-20 | 2020-03-03 | Drilling Info, Inc. | Energy deposit discovery system and method |
| NO20121473A1 (en) * | 2012-12-06 | 2014-06-09 | Roxar Software Solutions As | System for modeling geological structures |
| US10459098B2 (en) | 2013-04-17 | 2019-10-29 | Drilling Info, Inc. | System and method for automatically correlating geologic tops |
| US10853893B2 (en) | 2013-04-17 | 2020-12-01 | Drilling Info, Inc. | System and method for automatically correlating geologic tops |
| US9911210B1 (en) | 2014-12-03 | 2018-03-06 | Drilling Info, Inc. | Raster log digitization system and method |
| CN104808244B (en) * | 2015-04-14 | 2017-03-08 | 中国石油天然气股份有限公司 | Automatic Identification Method of Paleochannel Riverbed Erosion Depth |
| US10908316B2 (en) | 2015-10-15 | 2021-02-02 | Drilling Info, Inc. | Raster log digitization system and method |
| US10466388B2 (en) | 2016-09-07 | 2019-11-05 | Emerson Paradigm Holding Llc | System and method for editing geological models by switching between volume-based models and surface-based structural models augmented with stratigraphic fiber bundles |
| US11294085B2 (en) | 2016-11-18 | 2022-04-05 | Landmark Graphics Corporation | Multi-Z horizon auto-tracking |
| GB201619782D0 (en) * | 2016-11-23 | 2017-01-04 | Foster Findlay Ass Ltd | Adaptive tracking of geological objects |
| GB2579854B (en) | 2018-12-18 | 2021-06-16 | Equinor Energy As | Method of analysing seismic data to detect hydrocarbons |
| US11156744B2 (en) | 2019-01-10 | 2021-10-26 | Emerson Paradigm Holding Llc | Imaging a subsurface geological model at a past intermediate restoration time |
| US10520644B1 (en) | 2019-01-10 | 2019-12-31 | Emerson Paradigm Holding Llc | Imaging a subsurface geological model at a past intermediate restoration time |
| CN111650637B (en) * | 2019-03-04 | 2022-12-02 | 中国石油天然气股份有限公司 | Seismic Horizon Interpretation Method and Device |
| GB2583910B (en) * | 2019-05-03 | 2022-01-12 | Equinor Energy As | Method of analysing seismic data |
| US12326532B2 (en) | 2019-10-14 | 2025-06-10 | Schlumberger Technology Corporation | Feature detection in seismic data |
| CN113888700A (en) * | 2021-10-20 | 2022-01-04 | 哈尔滨理工大学 | A 3D Reconstruction Method of Medical Image Based on Voxel Growth |
| CN116449416B (en) * | 2021-12-30 | 2026-01-23 | 中国石油天然气集团有限公司 | Seismic horizon tracking method, device and storage medium |
| CN115685333A (en) * | 2022-09-28 | 2023-02-03 | 中海石油(中国)有限公司天津分公司 | An Automatic Detection Method of Reservoir Architecture Units Based on Finite Seed Points |
| GB2637022A (en) | 2024-01-04 | 2025-07-09 | Equinor Energy As | Seismic data processing |
Family Cites Families (2)
| Publication number | Priority date | Publication date | Assignee | Title |
|---|---|---|---|---|
| GB2138135B (en) * | 1983-04-06 | 1986-09-17 | Chevron Res | Interpretation of seismic records |
| US4633401A (en) * | 1984-11-08 | 1986-12-30 | Texas Instruments Incorporated | Method and apparatus for automatically determining pairs of turnings related to the same seismic event in adjacent seismic traces |
-
1990
- 1990-06-25 US US07/543,663 patent/US5056066A/en not_active Expired - Lifetime
-
1991
- 1991-06-10 EP EP91911657A patent/EP0489135B1/en not_active Expired - Lifetime
- 1991-06-10 DE DE69112580T patent/DE69112580T2/en not_active Expired - Fee Related
- 1991-06-10 WO PCT/US1991/004083 patent/WO1992000532A1/en not_active Ceased
- 1991-06-10 CA CA002064686A patent/CA2064686C/en not_active Expired - Fee Related
- 1991-06-10 DK DK91911657.4T patent/DK0489135T3/en active
- 1991-06-10 AU AU80516/91A patent/AU644453B2/en not_active Ceased
- 1991-06-10 ES ES91911657T patent/ES2076533T3/en not_active Expired - Lifetime
- 1991-06-10 AT AT91911657T patent/ATE127237T1/en not_active IP Right Cessation
-
1992
- 1992-02-24 NO NO920738A patent/NO303153B1/en not_active IP Right Cessation
-
1995
- 1995-09-08 GR GR950401863T patent/GR3017342T3/en unknown
Non-Patent Citations (1)
| Title |
|---|
| ICASSP 89, Glasgow, GB, May 1989, pages 1437-1440, I.Pitas & C.Kotropoulos: "Texture analysis and segmentation of seismic images" * |
Also Published As
| Publication number | Publication date |
|---|---|
| US5056066A (en) | 1991-10-08 |
| NO920738L (en) | 1992-02-24 |
| AU8051691A (en) | 1992-01-23 |
| DE69112580T2 (en) | 1996-04-18 |
| AU644453B2 (en) | 1993-12-09 |
| DK0489135T3 (en) | 1995-10-16 |
| ATE127237T1 (en) | 1995-09-15 |
| EP0489135A4 (en) | 1993-11-18 |
| NO920738D0 (en) | 1992-02-24 |
| ES2076533T3 (en) | 1995-11-01 |
| CA2064686C (en) | 1997-06-03 |
| DE69112580D1 (en) | 1995-10-05 |
| GR3017342T3 (en) | 1995-12-31 |
| NO303153B1 (en) | 1998-06-02 |
| WO1992000532A1 (en) | 1992-01-09 |
| CA2064686A1 (en) | 1991-12-26 |
| EP0489135A1 (en) | 1992-06-10 |
Similar Documents
| Publication | Publication Date | Title |
|---|---|---|
| US5056066A (en) | Method for attribute tracking in seismic data | |
| EP0548341B1 (en) | Method and apparatus for finding horizons in 3d seismic data | |
| US5432751A (en) | Method and apparatus for finding horizons in 3D seismic data | |
| US5675551A (en) | Apparatus and method for evaluation of score failures in picking of 3-D seismic data | |
| US6018498A (en) | Automated seismic fault detection and picking | |
| US7162463B1 (en) | Pattern recognition template construction applied to oil exploration and production | |
| US7188092B2 (en) | Pattern recognition template application applied to oil exploration and production | |
| US20100274543A1 (en) | Method and Apparatus For Analyzing Three-Dimensional Data | |
| US5570106A (en) | Method and apparatus for creating horizons from 3-D seismic data | |
| US5268994A (en) | Method of plotting surfaces in a 3D volume | |
| EP2113796A1 (en) | Method and Apparatus for Analyzing Three-Dimensional Data | |
| US6493634B1 (en) | Method for determining stacking velocity parameters or other reflection geometry information from seismic gather data using multiple attributes and 3-D visualization | |
| US11885922B2 (en) | Adaptive tracking of geological objects | |
| US6249746B1 (en) | Automated seismic isochron analysis | |
| Poelchau | Coherence mapping—An automated approach to display goodness-of-correlation between wells in a field | |
| WO2004008338A1 (en) | Oil exploration and production pattern recognition template | |
| Laroche et al. | Computer-assisted structural and stratigraphic interpretation | |
| Ferrier | Murphy et al. |
Legal Events
| Date | Code | Title | Description |
|---|---|---|---|
| PUAI | Public reference made under article 153(3) epc to a published international application that has entered the european phase |
Free format text: ORIGINAL CODE: 0009012 |
|
| 17P | Request for examination filed |
Effective date: 19920309 |
|
| AK | Designated contracting states |
Kind code of ref document: A1 Designated state(s): AT BE CH DE DK ES FR GB GR IT LI LU NL SE |
|
| A4 | Supplementary search report drawn up and despatched |
Effective date: 19930930 |
|
| AK | Designated contracting states |
Kind code of ref document: A4 Designated state(s): AT BE CH DE DK ES FR GB GR IT LI LU NL SE |
|
| 17Q | First examination report despatched |
Effective date: 19940805 |
|
| GRAA | (expected) grant |
Free format text: ORIGINAL CODE: 0009210 |
|
| ITF | It: translation for a ep patent filed | ||
| AK | Designated contracting states |
Kind code of ref document: B1 Designated state(s): AT BE CH DE DK ES FR GB GR IT LI LU NL SE |
|
| REF | Corresponds to: |
Ref document number: 127237 Country of ref document: AT Date of ref document: 19950915 Kind code of ref document: T |
|
| ET | Fr: translation filed | ||
| REF | Corresponds to: |
Ref document number: 69112580 Country of ref document: DE Date of ref document: 19951005 |
|
| REG | Reference to a national code |
Ref country code: DK Ref legal event code: T3 |
|
| REG | Reference to a national code |
Ref country code: ES Ref legal event code: FG2A Ref document number: 2076533 Country of ref document: ES Kind code of ref document: T3 |
|
| REG | Reference to a national code |
Ref country code: GR Ref legal event code: FG4A Free format text: 3017342 |
|
| PLBE | No opposition filed within time limit |
Free format text: ORIGINAL CODE: 0009261 |
|
| STAA | Information on the status of an ep patent application or granted ep patent |
Free format text: STATUS: NO OPPOSITION FILED WITHIN TIME LIMIT |
|
| 26N | No opposition filed | ||
| EUG | Se: european patent has lapsed | ||
| REG | Reference to a national code |
Ref country code: GB Ref legal event code: IF02 |
|
| PGFP | Annual fee paid to national office [announced via postgrant information from national office to epo] |
Ref country code: LU Payment date: 20060330 Year of fee payment: 16 |
|
| PGFP | Annual fee paid to national office [announced via postgrant information from national office to epo] |
Ref country code: GR Payment date: 20060406 Year of fee payment: 16 |
|
| PGFP | Annual fee paid to national office [announced via postgrant information from national office to epo] |
Ref country code: AT Payment date: 20060508 Year of fee payment: 16 |
|
| PGFP | Annual fee paid to national office [announced via postgrant information from national office to epo] |
Ref country code: CH Payment date: 20060608 Year of fee payment: 16 Ref country code: SE Payment date: 20060608 Year of fee payment: 16 |
|
| PGFP | Annual fee paid to national office [announced via postgrant information from national office to epo] |
Ref country code: BE Payment date: 20060629 Year of fee payment: 16 |
|
| BERE | Be: lapsed |
Owner name: *LANDMARK GRAPHICS CORP. Effective date: 20070630 |
|
| REG | Reference to a national code |
Ref country code: CH Ref legal event code: PL |
|
| EUG | Se: european patent has lapsed | ||
| PG25 | Lapsed in a contracting state [announced via postgrant information from national office to epo] |
Ref country code: AT Free format text: LAPSE BECAUSE OF NON-PAYMENT OF DUE FEES Effective date: 20070610 |
|
| PG25 | Lapsed in a contracting state [announced via postgrant information from national office to epo] |
Ref country code: BE Free format text: LAPSE BECAUSE OF NON-PAYMENT OF DUE FEES Effective date: 20070630 |
|
| PG25 | Lapsed in a contracting state [announced via postgrant information from national office to epo] |
Ref country code: LI Free format text: LAPSE BECAUSE OF NON-PAYMENT OF DUE FEES Effective date: 20070630 Ref country code: CH Free format text: LAPSE BECAUSE OF NON-PAYMENT OF DUE FEES Effective date: 20070630 |
|
| PG25 | Lapsed in a contracting state [announced via postgrant information from national office to epo] |
Ref country code: SE Free format text: LAPSE BECAUSE OF NON-PAYMENT OF DUE FEES Effective date: 20070611 |
|
| PGFP | Annual fee paid to national office [announced via postgrant information from national office to epo] |
Ref country code: ES Payment date: 20080611 Year of fee payment: 18 Ref country code: DK Payment date: 20080508 Year of fee payment: 18 |
|
| PGFP | Annual fee paid to national office [announced via postgrant information from national office to epo] |
Ref country code: IT Payment date: 20080618 Year of fee payment: 18 |
|
| PGFP | Annual fee paid to national office [announced via postgrant information from national office to epo] |
Ref country code: DE Payment date: 20080630 Year of fee payment: 18 Ref country code: NL Payment date: 20080530 Year of fee payment: 18 |
|
| PG25 | Lapsed in a contracting state [announced via postgrant information from national office to epo] |
Ref country code: GR Free format text: LAPSE BECAUSE OF NON-PAYMENT OF DUE FEES Effective date: 20080104 |
|
| PG25 | Lapsed in a contracting state [announced via postgrant information from national office to epo] |
Ref country code: LU Free format text: LAPSE BECAUSE OF NON-PAYMENT OF DUE FEES Effective date: 20070610 |
|
| REG | Reference to a national code |
Ref country code: DK Ref legal event code: EBP |
|
| NLV4 | Nl: lapsed or anulled due to non-payment of the annual fee |
Effective date: 20100101 |
|
| REG | Reference to a national code |
Ref country code: FR Ref legal event code: ST Effective date: 20100226 |
|
| PG25 | Lapsed in a contracting state [announced via postgrant information from national office to epo] |
Ref country code: FR Free format text: LAPSE BECAUSE OF NON-PAYMENT OF DUE FEES Effective date: 20090630 |
|
| PGFP | Annual fee paid to national office [announced via postgrant information from national office to epo] |
Ref country code: FR Payment date: 20080424 Year of fee payment: 18 |
|
| PG25 | Lapsed in a contracting state [announced via postgrant information from national office to epo] |
Ref country code: DE Free format text: LAPSE BECAUSE OF NON-PAYMENT OF DUE FEES Effective date: 20100101 |
|
| PG25 | Lapsed in a contracting state [announced via postgrant information from national office to epo] |
Ref country code: NL Free format text: LAPSE BECAUSE OF NON-PAYMENT OF DUE FEES Effective date: 20100101 Ref country code: DK Free format text: LAPSE BECAUSE OF NON-PAYMENT OF DUE FEES Effective date: 20090630 |
|
| REG | Reference to a national code |
Ref country code: ES Ref legal event code: FD2A Effective date: 20090612 |
|
| PG25 | Lapsed in a contracting state [announced via postgrant information from national office to epo] |
Ref country code: ES Free format text: LAPSE BECAUSE OF NON-PAYMENT OF DUE FEES Effective date: 20090612 |
|
| PGFP | Annual fee paid to national office [announced via postgrant information from national office to epo] |
Ref country code: GB Payment date: 20100401 Year of fee payment: 20 |
|
| PG25 | Lapsed in a contracting state [announced via postgrant information from national office to epo] |
Ref country code: IT Free format text: LAPSE BECAUSE OF NON-PAYMENT OF DUE FEES Effective date: 20090610 |
|
| REG | Reference to a national code |
Ref country code: GB Ref legal event code: PE20 Expiry date: 20110609 |
|
| PG25 | Lapsed in a contracting state [announced via postgrant information from national office to epo] |
Ref country code: GB Free format text: LAPSE BECAUSE OF EXPIRATION OF PROTECTION Effective date: 20110609 |